Abstract
Facades play an important role in building performance and durability since these systems, one of the most external elements, are highly exposed to climatic degradation agents. The degradation process evolves over time, causing anomalies and performance failures, ultimately reducing the building’s service life. When directly influenced by the agents and mechanisms, the expected degradation of the systems that constitute the facade depends on the degree of exposure to the agents and how the degradation mechanisms act under different conditions. Given the relevance of the topic and the need for information on the degradation process of facade elements, this investigation aims to evaluate the relationship between the degradation measured in buildings in Brasília and the exposure degree of the facades, focusing on climatic degradation agents. The facades are evaluated regarding exposure to driving rain and solar radiation and classified into two groups: high exposure and low exposure. The sample degradation was quantified using the Degradation Measurement Method (DMM) and the General Degradation Factor (FGD). This methodology showed both the behavior models for the different exposure groups and allowed us to calculate estimated service life (ESL) values of approximately 26 and 35 years for facades with high and low exposures, respectively. The FGD values are higher for facades with high exposure compared to those with lower exposure. Additionally, North-oriented facades are the most critical, exhibiting the highest degradation levels due to the greater intensity of driving rain and incident solar radiation.
1. Introduction
Facade systems perform relevant functions for the performance of buildings, especially preventing the passage of water, whether from rain or other sources that generate moisture. In addition to the important watertight requirement concerning facade performance, another important function is to protect the internal environment from the external climate. Durable facades that protect against the elements are a requirement in the construction of buildings that aim to guarantee safety, aesthetics, and comfort for their users [1,2,3].
The building envelope, composed of the roof, facades, and elements under the ground, is the most external system of a building and receives a large set of actions and efforts, many of them arising from the climate. ISO 15686-2 [4] classifies agents according to their nature. In general, when external to the building, these degradation agents originate from the atmosphere or soil; when internal to the building, the agents originate from use and occupation [5,6,7,8,9,10]. Different agents can also act together, the greatest example being rain associated with wind that gives rise to driving rain at facades [11,12,13,14].
2. Facade Degradation
To investigate the degradation of facades and the factors involved in its process, different considerations are required, mainly regarding climate variables. In Brasília, DF, Brazil, in general, North-facing facades present potentially more significant levels of degradation resulting from exposure to a set of active agents [12,15,16]. From another perspective, high exposure to possible climatic degradation agents does not necessarily imply higher levels of degradation. For degradation to occur, the agent must allow conditions for the development of degradation mechanisms. Furthermore, the agent-mechanism combination, whether due to the intensity or duration of the effects, differentiates the degradation levels observed on building facades. Particularities that increase this action enhance the conditions necessary for developing significant levels of degradation; therefore, it is mandatory to investigate the agents and mechanisms, the level of exposure to the agents, and the anomalies observed in these situations [7,9,13,17,18,19].
2.1. Degradation Agents and Mechanisms
The building exposure conditions can contribute to the reduction of performance, consequently affecting the degradation and service life of the building facade [15,20,21]. Building elements are affected by an evolutionary process of degradation over time, mainly related to the conditions of exposure to the environment and the agents and mechanisms of degradation [22,23,24]. A mechanism may involve more than one degradation agent, and, in many cases, these combinations increase the system complexity, hampering the identification of such actions and mechanisms [25,26,27].
Degradation mechanisms can also act synergistically in different ways: associated or not, simultaneously, or sequentially. For example, the effects of wetting and drying cycles on the development of salt crystallization and the detachment of claddings [28]. The synergy between mechanisms, in these cases, is responsible for increasing degradation severity and propagation. Often, a mechanism generates an anomaly from which other mechanisms become relevant. For example, when cracking occurs, the entry of rainwater into the cladding starts to trigger other mechanisms that have not been active until then. Therefore, degradation evolution and propagation is not a constant process but rather an extremely dynamic one where the relevance of its agents and mechanisms changes constantly over time [4,13,28,29,30,31].
Different analyses and associations can be presented to understand the effects of degradation. Stresses and deformations of the facade cladding system are associated with temperature and evaluated based on the action of incident solar radiation striking the building’s facade. The incidence of solar radiation varies throughout the day, differing depending on the facade cardinal orientation [3,12,28]. The facade’s response to incident solar radiation manifests itself mainly in deformations and thermomechanical efforts caused by temperature differences between the elements. This behavior becomes even more significant with longer exposure of the facade to this agent and more intense incident radiation [32,33,34].
The effect of radiation on facade temperatures is directly correlated with climatic characteristics and orientation, as well as material surface characteristics such as color and absorptance [35]. As a result of the action of temperature variations and their effects, detachment and cracking anomalies mainly occur [5,7,36,37].
Driving rain is responsible for several anomalies, affecting the durability and hygrothermal performance of buildings. The incidence of this agent is affected by the direction and speed of the wind, which leads to its action differing with the orientation of the facade. In most situations, there are facades with a higher incidence of driving rain throughout the year, in which the volume of rain is relatively more important. Water presence and transport in wetting and drying mechanisms can be one of the most common causes of damage to the cladding of building facades [28,31]. Several anomalies associated with ceramic and cementitious materials are affected by water transported in their porosity, such as the crystallization of salts, cracking, dimensional variations due to changing moisture, and the development of stains, among others [6,36,38,39]. Also, the mechanical properties are affected by entering water. Zones exposed to intense humidification during rainy episodes exhibit increasing ceramic detachments, for example. Therefore, areas close to the top of the building are significantly critical, as they are subjected to high levels of incident radiation and a high concentration of driving rain and their effects. This combined effect critically increases the severity of the degradation observed [13,18,40,41,42,43].
As facades are subject to climatic and atmospheric conditions, the level of exposure of the building to these agents affects its degradation and service life. Regarding driving rain, some standards classify facades as protected and unprotected [4,44], thus addressing considerations and criteria based on the degree of protection. A different exposure behavior is also assessed concerning the facade areas, where the top is the most exposed region [42,45,46].
2.2. Quantifying Degradation and Service Life
The measurement of degradation has several practical applications in civil construction, such as assessing service life conditions, quantifying damage, observing severity, and defining predictive or corrective maintenance operations according to building needs [13]. There are several methods to quantify facade degradation using indicators generally associated with inspections and mapping of areas degraded by different anomalies [46,47,48,49]. Thus, the severity of the degradation process can be investigated while also determining the possible causes of degradation.
The Degradation Measurement Method (DMM) allows the existing degradation to be quantified by calculating quantitative degradation indicators [3,31,42,45,50,51,52]. The assessment of degradation in building facades is facilitated by the organized, logical, and systematic process causing it. The DMM consists of procedures that involve facade inspection, mapping, and quantification of damages and anomalies [45,51].
Applying the DMM to investigate a database of a set of buildings provides degradation indicators that allow different analyses of degradation behavior, from the most specific to the most general. Furthermore, as long as the database is adequate, covering buildings of different ages and exposed to different cardinal orientations, it is possible to obtain mathematical degradation models that allow the estimation of the service life of facades [3]. The General Degradation Factor (FGD) is the main indicator, calculated based on the areas degraded by different anomalies, weighted by specific severity and relevance factors. It basically consists of calculating the weighted degradation related to the types of anomalies observed in the inspection process. This factor makes it possible to quantify the degradation of each facade sample. Based on previous studies [3,13,14,16], the adopted limit for the degradation state corresponds to a FGD of 0.05; this value indicates that the facade service life has been reached and that the cladding system no longer fulfills the functions for which it was designed and built.
Given the above and the need to understand the behavior and actions of degradation agents on facades, this work aims to contribute to the study of facade degradation of buildings in Brasília, Brazil. To understand the degradation process, the exposure conditions of the facades are classified based on the degree of exposure. In addition to the classification, the study measures degradation using the DMM by determining the FGD and analyzing its evolution over time for a robust database of inspected buildings. The degradation behavior is also correlated with the service life limit for both groups, classified according to the degree of exposure.
3. Method
This investigation focuses on the analysis of degradation quantified for the chosen database. The aim is to obtain differentiated profiles and patterns of degradation evolution depending on control variables such as age and exposure to agents (driving rain and solar radiation).
3.1. Characterizing the Buildings of the Database
The used database consists of a set of buildings from a global database developed within the scope of DMMPROJECT: Degradation, Measurement, and Modeling, created and maintained by researchers at the University of Brasília [53]. All DMMPROJECT monitored buildings are located in Brasília, DF, Brazil. The city is recognized for the uniqueness and striking features of its architecture and urbanism and is considered a “National Heritage” and “Cultural Heritage of Humanity” by UNESCO. Brasília, located on the central Brazilian plateau, has either flat or gently undulating terrain.
According to the Köppen classification, Brasília has a tropical climate with two distinct seasons: rainy summers from October to March and dry winters from April to September, when rainfall rates are very low [54,55]. The predominantly northern winds have maximum values close to 10.4 m/s and an annual average of 2.45 m/s [12].
Brasília’s buildings, particularly those in the database, follow a pattern: the facades use masonry in ceramic or concrete blocks covered with ceramics or mortar/painting claddings. The structure is made of reinforced concrete arranged in slabs, beams, and pillars [9,56]. These mostly residential 6-floor buildings follow an architectural pattern with a horizontal trend, are elongated, separated from each other, and, generally, have 4 facades.
3.2. Sampling
To analyze the facades and measure degradation, a methodology was developed to define the study samples. The respective facades of the buildings were subdivided into samples, and each sample was investigated individually. After removing spurious data, 307 samples were selected. Then, the samples were grouped by age and cardinal orientation. Table 1 and Table 2 present the subdivisions after the global analysis of the samples.

Table 1.
Database by age group.
Table 2.
Database by orientation.
3.3. Degradation Measurement Method (DMM)
Once the damage map has been prepared, based on the inspection, the areas degraded by the different anomalies are quantified. The subdivision of the samples on the facade follows some basic criteria. Each sample must comply with the following criteria [3,13,14,16,43]:
- Area between 50 and 300 m2;
- The sample must be on the same plane. Changes in plan orientation configure another sample;
- The sample limit (edges) must coincide with structural or expansion joints, if there are any on the facade;
- Each sample must be inserted into a single architectural element (facade or gable).
Figure 1 shows an example of the definition of samples on an investigated facade. The degraded areas were then quantified, and the cardinal orientation (North, South, East, and West) was observed for each sample [3,13,14,16,26,43,46,51].
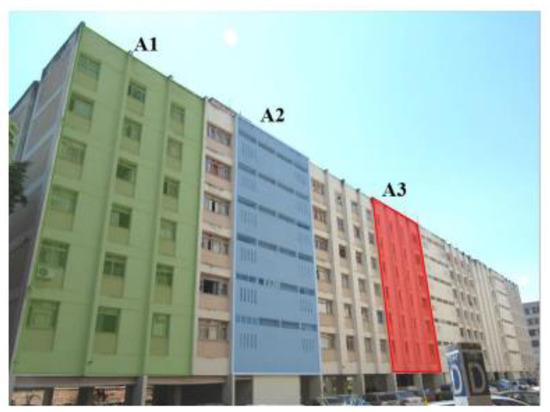
Figure 1.
Subdivision of the facade into samples according to the DMM.
The DMM quantifies the degradation process by defining quantitative indicators of degradation for each facade sample investigated. These indicators can be applied to model building degradation and define service life, among others. A particularity of this method is that degradation is quantified in facade samples, which allows a more specific analysis of the system behavior and a more detailed analysis of degradation behavior.
The DMM uses two main degradation indicators: the General Degradation Factor (FGD) and the Anomalies Damage Factor (FDanom). The FGD is determined according to Equation (1) and is calculated for each facade sample in which its area is mapped in relation to the observed anomalies. The quantification of degraded areas for the four main groups of anomalies is inserted into the sums described in Equation (1). Each anomaly area is weighted by the severity factor (G) (Table 3) and by the relative importance factor of the anomaly (RI) (Table 4). The FGD is an indicator in which the degraded area is weighted by these two factors and divided by the most critical condition possible, in which the sample area is multiplied by the sum of the maximum severity levels expressed in Table 4.
where n is the group of anomalies (n = 1 detachment, n = 2 cracks, n = 3 joints, n = 4 stains); Aan(n) is the area damaged by an anomaly of group n (m2); G is the anomaly severity factor (Table 3); RI is a weighting factor for the relative importance of each anomaly (Table 4); A is the total area of the facade sample (m2), and ΣGmax is the sum of the maximum severity factor reached by the anomalies (Table 3), equivalent to 14.
Table 3.
Criteria for defining the severity factor G.
Table 4.
Relative importance factor (RI) for each anomaly group.
The severity factor (G) ranges from 1 to 4, as proposed by ISO/DIS 15686-7 (2006) [4] when discussing the influence of degradation on building service life. Table 5 shows four ranges (A, B, C, and D) that are associated with the severity factor values for each anomaly group.
Table 5.
Accumulated driving rain recorded monthly in a year.
To define the severity factor G in Table 3, it is necessary to calculate the FDanom corresponding to each group of the four main anomalies (detachment, cracks, joints, and stains). The same is obtained by Equation (2).
where FDanom(n) is the Damage Factor for the specific anomaly (n); Aan(n) is the sample degraded area due to the anomaly (n); n is the anomaly under analysis (detachment, cracks, joints, and stains); and A is the total area of the sample.
3.4. Criteria for Classifying Facades According to the Degree of Exposure
The classification of the degree and conditions of exposure focuses on investigating the quantification of driving rain and solar radiation incidents on the facades. To quantify the incidence of climatic agents, a hygrothermal simulation was applied to one year of exposure. One of the results of the simulation is the hourly quantification of incident radiation and directed rain for each of the facade orientations. This analysis was performed using the Wufi® Pro 6.7 software, which is a computational calculation tool for simulating the hygrothermal behavior of the building envelope. The simulation uses the climate file for Brasília developed by Roriz (2012) (TMY-Typical Meteorological Year) based on information from the meteorological station of the Brazilian National Institute of Meteorology (INMET) for the city of Brasília (INMET).
For the city of Brasília, a specific classification is proposed based on the degree of exposure based on the driving rain and solar radiation incident on the facades for the four orientations (N, S, E, and W). Figure 2 and Figure 3 show the different behaviors that are observed throughout the year in Brasília for driving rain and direct radiation, and Table 5 and Table 6 present the values for each month as well as the totals for the year.
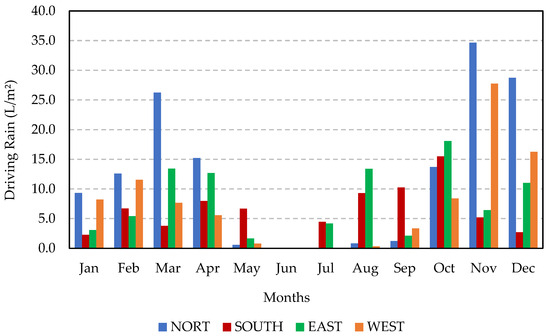
Figure 2.
Average driving rain observed monthly in a year.
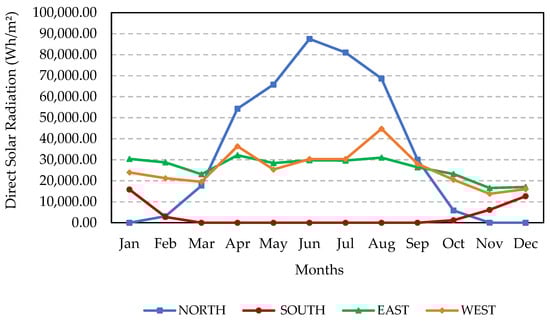
Figure 3.
Average direct solar radiation observed monthly in a year.
Table 6.
Average direct solar radiation observed monthly in a year.
Depending on the dry and rainy climatic periods, there are clear patterns of behavior. In the rainy months (from October to March), it is observed that the highest values of accumulated driving rain occur on the North facades (Figure 2, Table 5). The East and West facades present intermediate values, and the South facade shows the lowest values of driving rain, as can also be seen in Table 5. For the dry months (period from April to September), a much lower incidence of directed rain is observed, mainly on the East and South facades. This behavior is explained by the different cardinal orientation of the dominant winds that occurs in the less rainy season.
When observing the evolution of direct solar radiation throughout the year, it is identified that in the dry months (April to September), the highest radiation values are observed for the North façade, as illustrated in Figure 3 and shown in Table 6. This condition is due to the autumn and winter periods, when in the southern hemisphere, there is predominant exposure to sunlight. Another important point is that in the dry months, the cloud cover is very low, which leads to an increase in solar exposure on the North facade. For the East and West orientations, the evolution of incident radiation is intermediate, with values close to each other (Table 6). For the South orientation, the lowest values of incident radiation occur, and there is no solar incidence on this facade for almost the entire dry period.
For the rainy season (from October to May), it appears that the highest radiation values are associated with the East and West orientations (Figure 3). These values, however, are much lower than those that occur on the North facade in the dry season. The North façade during the rainy season presents the lowest values of incident radiation. It must be remembered that, in addition to differences in solar incidence, there is also cloudiness associated with the rainy season.
In the analysis of the values observed for directed rain and radiation for the four orientations (N, S, E, and W), it is identified that the North facades are the most attacked by these agents. Obviously, this action is not constant throughout the year, but it is possible to attribute a High Exposure condition to the North facade. Otherwise, especially, when observing the total values throughout the year, the East, West, and South facades can be assigned a Low Exposure condition. Exposure to agents is one of the conditions for degradation, but it is not the only one that explains it. One of the objectives of the present investigation, by differentiating these exposure conditions and using field data, is to highlight how much degradation can be explained by exposure and whether this condition has a clear impact on degradation and estimated service life.
3.5. Estimated Service Life
Based on a general model based on age, it is possible to parameterize the evolution of the degradation of each sample as a function of time. Figure 4 presents the values corresponding to the level of degradation of ceramic coverings in inspected buildings in the city of Brasília—DF, distributed according to the age of each sample that constitutes the database used in the study. The behavior of the degradation indicator observed in the degradation curve is represented by the second-degree polynomial indicated in Figure 4.
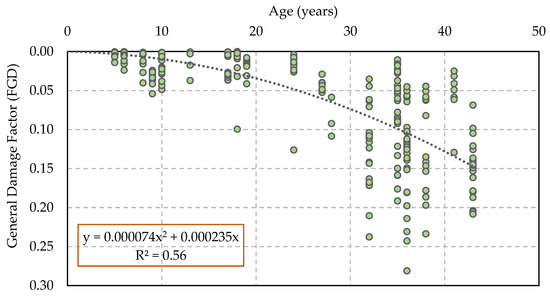
Figure 4.
Degradation behavior over time in buildings in Brasília (DMMPROJECT database).
Based on a general degradation function (model), with age as the dependent variable, it is possible to investigate and determine the age of the building in which the degradation exceeds the service limit state (FGD > 0.05). The service life associated with the different acting conditions (degree of exposure, mechanisms, and anomalies) is thus quantitatively observed.
Among the various existing methods for determining the estimated service life, the point transposition method allows determining the adjustment of the general degradation function for each facade investigated in the database. By obtaining this adjusted function, it is easy to identify when the useful life limit value is reached (FGD of 0.05) and thus determine the age corresponding to the estimated service life. In this way, a transposition is made from the real case (measured by the DMM) to the age at which this case reached the limit state of degradation.
To obtain the adjusted function, Equations (3)–(5) allow carrying out the associated calculations. The transposition of the facade’s degradation point, identified at a given time (age) and with a corresponding FGD, occurs by converting the function f (Equation (3)), associated with the degradation model, into a function f′ (Equation (4)), of the same family of f, going through the facade case analyzed. The conversion of the function f into the function f′ is carried out by adjusting the function f multiplied by the factor k. This factor is obtained by the ratio between the real FGD and the model’s FGD at that age (Equation (5)) [3,9].
where f is the degradation curve, f′ is the curve of the same family as the function f through the analyzed facade, k is the multiplicative factor of the function f, a and b are the regression coefficients, and x is the age of the facade.
f = 0.000074·x2 + 0.000235·x
An example is shown in Figure 5, in which the degradation function f (model) is the central curve. The function f′ is exemplified at the two highlighted points, where it is identified that f′ passes through these points. The determination of the estimated useful life is determined for each case when this function f′ reaches the limit value of FGD (0.05).
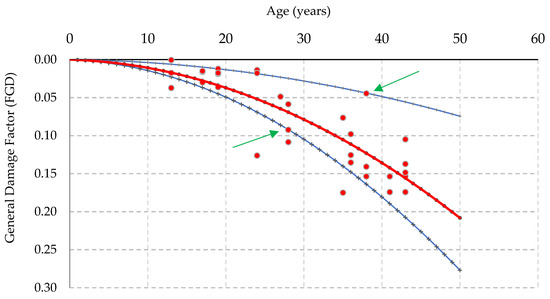
Figure 5.
Degradation model with point transposition.
4. Results
The present investigation proposes to discuss in a quantitative way the differences in degradation that may be associated with the degree of exposure to the agents. The aim is to observe whether conditions classified as high and low exposures present different behaviors in terms of degradation measured in the field (database).
The effect of the degree of exposure can be identified in the general model of the evolution of degradation in relation to age (time), as seen in Figure 6. When observing the behavior of samples classified as having high exposure, it is clear that their degradation is more pronounced at an early age compared to those with low exposure. It is also identified that, at more advanced ages, the evolution of degradation is much more pronounced. The trend curves (Figure 6) show that the service limit condition (FGD 0.05) is reached at about 22 and 27 years for high and low exposures, respectively. Also, the curves of both groups show that, although the degradation evolution curve differs from an early age, the difference in curves becomes more pronounced as the years go by. At 43 years, FGD values of 0.22 and 0.13 are observed for facades under high- and low-exposure conditions, respectively.
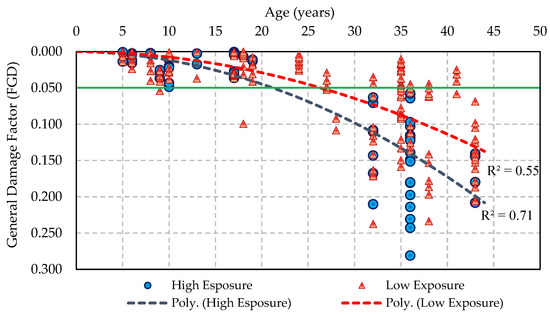
Figure 6.
Facade degradation behavior over time regarding the degree of protection.
4.1. Estimated Service Life (ESL)
Considering the behavior of ESL in conditions of high and low exposures, the difference in values is evident. Figure 6 shows the ESL values for all investigated samples presented in chronological order of age. Most high-exposure samples have a useful life of up to 30 years. When analyzing an ESL considered advanced, such as 40 years, only 7 samples classified as high exposure exceed this limit, while in the low exposure condition, 35 samples have an estimated useful life of more than 40 years, some even exceeding 60 years.
In the analysis of Figure 7, a behavioral trend is observed, not a direct and conclusive relationship. It is clear from this trend that the low exposure group presents higher ESL values, but some low values are also observed, including those less than 20 years. This must be considered in the context of degradation assessed in the field, where it cannot be explained solely by exposure. The influence of other factors, such as age and critical facade zones, can differentiate behaviors. Due to the combination of factors, there may be critical conditions of greater sensitivity in which degradation occurs differently. However, the general trend is quite clear: high-exposure facades have lower ESL.
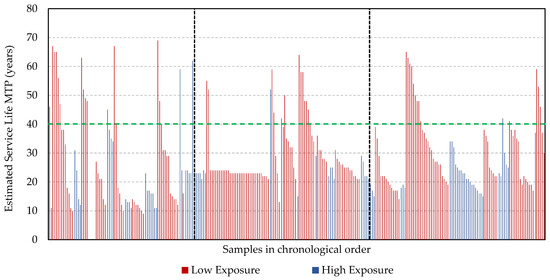
Figure 7.
Estimated service life (ESL) of samples according to degree of exposure (samples in chronological order).
When quantitatively observing the number of cases in high and low exposure conditions, as in relation to the FGD limits and the average ESL, Table 7 summarizes the behaviors found. In terms of average ESL, values of 35 and 26 years are observed, respectively, for low and high exposures. This aspect coincides with the trend found in Figure 6, and it is emphasized that these are the average values of the samples for each condition. In this approach, it is possible to identify the influence of the exposure condition associated with greater degradation in conditions of greater exposure to agents.
Table 7.
FGD and ESL of the two groups studied.
In the case of samples with FGD ≥ 0.05 (Table 7), it is identified that 48% of the samples are found in the High Exposure group, while 28% of the group’s samples are found in the Low Exposure group. It is then identified that, in this condition of high severity, the incidence of observed cases is more incisive for the most severe exposure.
4.2. Degradation Classes
The results obtained for the studied samples were grouped into four classes that characterize the respective degradation degrees. Class A (FGD < 0.003) refers to a mild degradation condition; Class B (FGD from 0.003 to 0.049) indicates localized degradation that does not compromise performance; Class C (FGD between 0.050 and 0.169) indicates that the degradation limit is exceeded, with a loss of functionality and safety; and lastly, Class D (FGD > 0.169) indicates that degradation is severe and performance and safety are gravely affected, thus intensive rehabilitation must be carried out [3,43].
Table 8 shows the grouping of the samples into classes according to the determined FGD value. The percentages the samples represent regarding the total of each exposure group are presented in Table 8 and Figure 8.
Table 8.
Number of samples per FGD range.
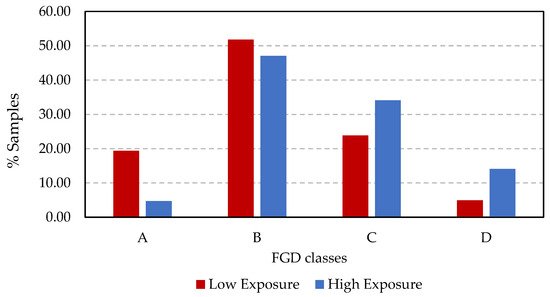
Figure 8.
Percent samples per FGD class.
The separation of samples by range of values corresponding to the FGD shows that there are several samples that exceed the FGD limit value (classes C and D). For low and high exposures, FGD limit values of 29% and 48% are observed, respectively. Otherwise, for Classes A and B, FGD limit values of 71% and 52% are identified for low and high exposures, respectively. It is clear that the greater number of samples for conditions of lesser degradation (FGD < 0.05) is associated with conditions of lesser severity. In this case, when observing the Class A values, the highest percentage of the low exposure condition is clear, that is, there is a very significant value of samples with acceptable performance (low degradation). Likewise for Class B, the greater number of cases in the low exposure condition indicates samples are still within the service life limit.
Cases of high degradation are observed in low-exposure situations. In this case, this degradation is mainly limited to older buildings. As seen in Figure 6, degradation evolves with age for both exposure conditions. This behavior may be explained by the cumulative effect of actions over time, which ultimately coincides with a more severe degradation level since this behavior becomes more incisive under high exposure.
4.3. Evolution of Degradation and Service Life
When comparing the evolution of the FGD for the High-Exposure condition (Figure 9a) and for Low Exposure (Figure 9b), it is identified that the FGD increases more sharply for samples with more severe exposure. In this case, when exceeding the service limit (FGD > 0.05), the values increase in sequence, reaching values close to 0.28. An ESL under 20 years old is identified. In the Low-Exposure situation, the evolution of the FGD occurs below the service limit (FGD < 0.05) in almost 70% of the samples. In these samples, the highest ESL values are also observed, with several samples exceeding 40 years. When the useful life limit is exceeded, the FGD increases, reaching a value of 0.23. In these cases, the ESL reduces to values close to 25 years.
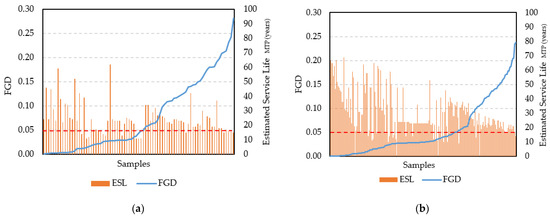
Figure 9.
Service life and FGD for facades under the studied conditions: (a) high exposure and (b) low exposure.
It is evident that both FGD and ESL are strongly influenced by exposure conditions. The trends discussed corroborate this relationship, which is evidenced by the field data investigated. Several aspects affect degradation and exposure, and its effects are one of the main ones, as can be seen in Figure 6, Figure 7 and Figure 9. In this sense, it is also necessary to address the association with the degradation mechanisms that act differently in anomalies. The age of the buildings is also a variable that differentiates behavior. Even with these aspects, the analysis of the database allows us to differentiate the effects of exposure to agents.
5. Discussion
This study differentiates facades’ behavior regarding the degree of exposure by showing the different degradation behaviors over time between low- and high-exposure facades. Furthermore, the results show that the facades are influenced by climate actions at varying degrees of intensity and frequency. Such differences depend, in addition to the degree of exposure, on the hygrothermal properties of the components and the cyclical and seasonal variations of climatic agents that affect behavior [12].
Corroborating previous studies [8,12,42,51], based on the behavior of direct solar radiation and directed rain, North-oriented facades are the most exposed throughout the year and become, therefore, the most critical for the emergence and even evolution of degradation. The influence of climatic agents on degradation responses, especially in older buildings, shows that the North orientation is the most critical. Faced with more intense degradation due to the action of climatic agents, it is highlighted that the probability of the occurrence of anomalies is higher in North-oriented facades [8,31,42].
Furthermore, highly exposed facades have a shorter estimated service life since they degrade more quickly compared to facades under low exposure; thus, the degree of exposure of a facade to incident agents correlates with the degradation level. Several studies [7,9,28] highlight this fact, showing that the North orientation is more critical for buildings in Brasília, and associate this result with incident radiation and also driving rain [9,12,57,58,59].
In addition to investigating the properties and characteristics of materials when studying degradation, another fundamental factor is based on agents, mostly climatic. Despite other agents of climatic origin acting on facades often, this study chose to focus on the different levels of exposure to driving rain and solar radiation. The presence of a degradation agent, whether of climatic origin or not, does not represent the only triggering factor in the degradation process. The degradation process, in addition to the presence of an agent, is triggered by the adequate conditions needed for the development of degradation mechanisms [13].
The degradation of a facade and its elements must be studied in detail due to not only the complexity of the phenomenon but also the number of factors that influence this process; the cladding facade and its orientation can be highlighted. In some specific situations, depending on local characteristics, the microclimate around the building can also influence the speed of degradation [3,12,60].
The study of degradation, depending on the degree of exposure, contributes to the understanding of both the evolution characteristics and the quantitative assessment of degradation in each sample under high or low exposure. In addition to the need for a detailed study investigating degradation, it is necessary to pay attention to the particularities that must be considered for each case and approach. To establish behaviors and associated aspects and trends, it is always necessary to keep in mind that each field investigation has its particularities that are evident in the database used. Thus, constructive aspects, exposure to agents, and dominant mechanisms must always be linked to the investigated database. Comparing models or using indices and classifications based on very different databases, as in the case of countries with different climates, geography or relief, and construction techniques, leads to results that do not reflect the observed reality [13].
6. Conclusions
The results allow us to list the conclusions relevant to the study of degradation on facades with different levels of exposure.
The classification of facades into high-exposure and low-exposure groups proved to be relevant and appropriate for this investigation. Based on hygrothermal simulation, the quantification of agents allows an adequate association that is relevant in the analysis of exposure conditions.
Degradation behaves differently depending on the degree of exposure to each facade. Facades with a low level of exposure tend to degrade more slowly over the years as the agents, mostly climatic, act less directly and more mildly compared to those with high exposure.
The level of degradation determined according to degrees of exposure shows that degradation patterns change over time and are also controlled differently. For buildings over 40 years old, facades with greater exposure tend to show an increased FGD value. At more advanced ages, there will likely be combined effects between agents, and the mechanisms will worsen the conditions of degradation observed at earlier ages.
The behavioral findings presented are contributions that need to be considered when designing new buildings as well as when studying service life since they can have direct application in the rehabilitation of buildings. The differentiation of behavior concerning degradation for facades with different levels of exposure highlights not only the importance of what has already been investigated but also the need for a set of detailed analyses capable of tracking and identifying the factors or aspects that control degradation in addition to exposure and what other additional factors can aggravate the degradation of facades.
The behaviors observed in the study are specific to the database used for the city of Brasília. Complementary studies or similar considerations for other databases, locals, and construction topology must closely consider the specific characteristics.
Based on the results observed in low- and high-exposure behaviors, where degradation is very different, it is suggested that a new approach evaluating the degradation initiation phases (FGD < 0.05) and the propagation phase (FGD ≥ 0.05) could be useful for drawing more specific conclusions on degradation behaviors.
Author Contributions
Conceptualization, A.L.R.d.S., T.R.d.L.M.R. and E.B.; methodology, A.L.R.d.S., T.R.d.L.M.R. and E.B.; validation, A.L.R.d.S.; investigation, T.R.d.L.M.R.; data curation, A.L.R.d.S. and T.R.d.L.M.R.; writing—original draft preparation, A.L.R.d.S.; writing—review and editing, T.R.d.L.M.R. and E.B.; supervision, E.B.; project administration, T.R.d.L.M.R. All authors have read and agreed to the published version of the manuscript.
Funding
The Coordination for the Improvement of Higher Education Personnel (CAPES) for financial assistance via scholarship and the Dean of Graduate Studies (DPG) of the University of Brasília (UnB) for financial assistance.
Data Availability Statement
The data used are made available by the DMM Project upon request.
Acknowledgments
The authors would like to thank DMMPROJECT: Degradation, Measurement, and Modeling for providing the database used in the study.
Conflicts of Interest
The authors declare no conflict of interest.
References
- Oliveira, L.A. Methodology for Developing Lightweight Facade Projects. Ph.D. Thesis, Polytechnic School of the University of São Paulo, São Paulo, Brazil, 2009. [Google Scholar]
- Amorim, C.N.D.; Braga, D.K.; Christakou, E.D.; Grillo, J.C.S.; Lima, T.B.S.; Baldoíno, V. Environmental rehabilitation and use of natural light in modern architecture: Brasília Palace Hotel and Palacio do Itamaraty. Paranoá 2014, 3, 115–128. [Google Scholar]
- Souza, J.S. Impact of Degradation Factors on the Useful Life of Building Facades. Ph.D. Thesis, University of Brasília, Brasília, Brazil, 2019. [Google Scholar]
- ISO 15686-2 (2012); Buildings—Service Life Planning. Part 2: Service Life Prediction Procedures. International Organization for Standardization: Geneva, Switzerland, 2012.
- Silvestre, J.D.; De Brito, J. Inspection and repair of ceramic tiling within a building management system. J. Mater. Civ. Eng. 2010, 22, 39–48. [Google Scholar] [CrossRef]
- Wetzel, A.; Herwegh, M.; Zurbriggen, R.; Winnefeld, F. Influence of shrinkage and water transport mechanisms on microstructure and crack formation of tile adhesive mortars. Cem. Concr. Res. 2012, 42, 39–50. [Google Scholar] [CrossRef]
- Bauer, E.; Silva, M.N.B.; Zanoni, V.A.G. Measurement of degradation and useful life on facades. In Proceedings of the Brazilian Symposium on Mortar Technology—SBTA, Porto Alegre, Brazil, 28–30 April 2015; pp. 1–8. [Google Scholar]
- Nascimento, M.L.M.; Bauer, E.; Souza, J.S.; Zanoni, V.A.G. Wind-driven rain incidence parameters obtained by hygrothermal simulation. J. Build. Pathol. Rehabil. 2016, 1, 5. [Google Scholar] [CrossRef]
- Souza, J.S.; Silva, A.; De Brito, J.; Bauer, E. Analysis of the influencing factors of external wall ceramic claddings’ service life using regression techniques. Eng. Fail. Anal. 2018, 83, 141–155. [Google Scholar] [CrossRef]
- Ferreira, C.; Silva, A.; De Brito, J.; Dias, I.S.; Flores-Colen, I. The impact of imperfect maintenance actions on the degradation of buildings’ envelope components. J. Build. Eng. 2021, 33, 101571. [Google Scholar] [CrossRef]
- Derome, D.; Kubilay, A.; Defraeye, T.; Blocken, B.; Carmeliet, J. Ten Questions concerning Modeling of Wind-driven Rain in the Built Environment. Build. Environ. 2017, 114, 495–506. [Google Scholar] [CrossRef]
- Zanoni, V.A.G. Influence of Climatic Agents of Degradation on the Hygrothermal Behavior of Facades in Brasília. Ph.D. Thesis, University of Brasília, Brasília, Brazil, 2015. [Google Scholar]
- Bauer, E.; Souza, A.L.R. Failure patterns associated with facade zones and anomalies in the initiation and propagation of degradation. Constr. Build. Mater. 2002, 347, 128563. [Google Scholar] [CrossRef]
- Andrade, D.T.; Bauer, E.; Souza, J.S. Hygrothermal Simulation Applied to Degradation Modeling of Ceramic Facades. J. Perform. Constr. Facil. 2023, 37, 04022079. [Google Scholar] [CrossRef]
- Souza, A.L.R.; Andrade, D.T.; Bauer, E.; Souza, J.S. Classification of building facades using the degree of protection criterion. In Proceedings of the REHABEND—Construction Pathology, Rehabilitation Technology and Heritage Management, Granada, Spain, 13–15 September 2022. [Google Scholar]
- Andrade, D.T. Modeling of Facade Degradation based on Parameters Obtained from Hygrothermal Simulation for Buildings in Brasília. Master’s Thesis, Structures and Civil Construction, Department of Civil and Environmental Engineering, University of Brasília, Brasília, Brazil, 2022. DF 101. p. 2022. [Google Scholar]
- Bauer, E.; Milhomem, P.M.; Aidar, L.A.G. Evaluating the damage degree of cracking in facades using infrared thermography the elements for allowing degradation agents such as. J. Civ. Struct. Health Monit. 2018, 8, 517–528. [Google Scholar] [CrossRef]
- Carretero-Ayuso, M.J.; Moreno-Cansado, A.; García-Sanz-Calcedo, J. Anomalies in External Construction Elements in Spain according to Cause-Damage Relationship. J. Infrastruct. Syst. 2019, 25, 1–7. [Google Scholar] [CrossRef]
- Carretero-Ayuso, M.J.; Rodríguez-Jiménez, C.E.; Bienvenido-Huertas, D.; Moyano, J.J. Interrelations between the types of damages and their original causes in the envelope of buildings. J. Build. Eng. 2021, 39, 1–13. [Google Scholar] [CrossRef]
- Freitas, V.P.; Vieira, M.; Guimarães, A.S. The French, Norwegian and Danish experience. A State-of-the-Art Report on Building Pathology. CIB Publ. 2013, 393, 30–35. [Google Scholar]
- Kazmierczak, C.S.; Kulakowski, M.P.; Brehm, F.A.; Sentena, J.A.A.; Marquetto, L. Considerations on the Assessment of Durability of Mortar Coatings with Incorporation of Waste Using Accelerated Tests with Thermal Cycles; Editoriale Scienza: Porto Alegre, Brazil, 2016; Chapter 6; pp. 147–175. [Google Scholar]
- ISO 15686-10 (2010); Buildings and Constructed Assets—Service Life Planning—Part 10: When to Assess Functional Performance. International Organization for Standardization: Geneva, Switzerland, 2010.
- CIB. Defects in Masonry Walls Guidance on Cracking: Identification, Prevention and Repair; International Council for Research Innovation in Building and Construction: Ottawa, ON, Canada, 2014. [Google Scholar]
- Dias, J.L.; Silva, A.; Chai, C.; Gaspar, P.L.; De Brito, J. Neural networks applied to service life prediction of exterior painted surfaces. Build. Res. Inf. 2014, 42, 371–380. [Google Scholar] [CrossRef]
- Cóias, V. Inspections and Tests in the Rehabilitation of Buildings, 2nd ed; IST Press: Lisbon, Portugal, 2009. [Google Scholar]
- Flores-Colen, I.; De Brito, J.; Freitas, V.P. Methodology for in-service performance assessment of rendering facades for predictive maintenance. TG75, W014, W080, W083 and W086. In Proceedings of the 18th CIB World Building Congress, Salford, UK, 10–13 May 2010; p. 388. [Google Scholar]
- Santos, D.G. Study of the Useful Life and Degradation of Mortar Facades based on Building Inspections. Master’s Thesis, University of Brasília, Brasília, Brazil, 2018. [Google Scholar]
- Bauer, E.; Souza, J.S.; Mota, L.M.G. Degradation of mortar-coated facades in buildings in Brasília, Brazil. Built Environ. Porto Alegre 2021, 21, 23–43. [Google Scholar]
- Bordalo, R.; De Brito, J.; Gaspar, P.L.; Silva, A. Service life prediction modelling of adhesive ceramic tiling systems. Build. Res. Inf. 2011, 39, 66–78. [Google Scholar] [CrossRef]
- Nogal, M.; O’connor, A. Resilience assessment of transportation networks. In Routledge Handbook of Sustainable and Resilient Infrastructure; Routledge: London, UK, 2018; p. 199. [Google Scholar]
- Mota, L.M. Study of the Initiation and Propagation of Degradation of Mortar-Coated Facades. Master’s Thesis, University of Brasília, Brasília, Brazil, 2021. [Google Scholar]
- Haase, M.; Silva, F.M.; Amato, A. Simulation of ventilated facades in hot and humid climates. Energy Build. 2009, 41, 361–373. [Google Scholar] [CrossRef]
- Barreira, E.; De Freitas, V.P. Evaluation of Surface Humidification of Exterior Insulation and Finish Systems. J. Perform. Constr. Facil. 2016, 30, 04015026. [Google Scholar] [CrossRef]
- Mazer, W.; Silva, L.M.R.; Lucas, E.; Santos, F.C.M. Evaluation of pathological manifestations in buildings according to orientation geographic. Rev. Alconpat 2016, 6, 145–156. [Google Scholar] [CrossRef]
- Bauer, E.; Kraus, E.; Silva, M.N.B.; Zanoni, V.A.G. Evaluation of Damage of Building Facades in Brasília. In Proceedings of the 13th DBMC—International Conference on Durability of Buildings Materials and Components, São Paulo, Brazil, 2–15 September 2014; pp. 535–542. [Google Scholar]
- Silvestre, J.D. Support System for Inspection and Diagnosis of Anomalies in Adhesive Ceramic Coatings. Master’s Thesis, Technical University of Lisbon, Lisbon, Portugal, 2005. [Google Scholar]
- Silvestre, J.D.; De Brito, J. Ceramic tiling inspection system. Constr. Build. Mater. 2009, 23, 653–668. [Google Scholar] [CrossRef]
- Fiorito, A.J.S.I. Mortar and Coatings Manual, 2nd ed.; Editora Pini Ltda: São Paulo, Brazil, 2009. [Google Scholar]
- Mota, L.; Lopes, A.; Bauer, E. Methodology for quantifying facade degradation. In Proceedings of the V CIRMARE—International Congress on the Recovery, Maintenance and Restoration of Buildings, Annals, Rio de Janeiro, Brazil, 14–16 April 2020. [Google Scholar]
- Silvestre, J.D.; De Brito, J. Ceramic tiling in building façades: Inspection and pathological characterization using an expert system. Constr. Build. Mater. 2011, 25, 1560–1571. [Google Scholar] [CrossRef]
- Herwegh, M.; Zurbriggen, R.; Mettier, R.; Winnefeld, F.; Kaufmann, J.; Wetzel, A. Hygrical shrinkage stresses in tiling systems: Numerical modeling combined with field studies. Cem. Concr. Compos. 2015, 55, 1–10. [Google Scholar] [CrossRef]
- Piazzarollo, C.B. Study of the Evolution and Severity of Degradation in the Different Areas of the Facade. Master’s Thesis, University of Brasília, Brasília, Brazil, 2019. [Google Scholar]
- Bauer, E.; Souza, J.S.; Piazzarollo, C.B. Application of the Degradation Measurement Method in the Study of Facade Service Life. In Building Pathology, Duraability and Service Life; Delgado, J.M.P.Q., Ed.; Springer International Publishing: Porto, Portugal, 2020; Volume 12, pp. 105–119. [Google Scholar]
- Straube, J.F. Simplified Prediction of Driving Rain on Buildings: ASHRAE 160P and WUFI 4.0. Build. Sci. Dig. 2010, 148, 1–16. [Google Scholar]
- Bauer, E.; Kraus de Castro, E.; Antunes, G.R.; Leal, F.E. Identification and Quantification of Failure Modes of New Buildings Façades in Brasília. In Proceedings of the XII DBMC—International Conference on Durability of Buildings Materials and Components, Porto, Portugal, 12–15 April 2011; pp. 1–7. [Google Scholar]
- Silva, M.N.B. Quantitative Assessment of the Degradation and Useful Life of Facade Coatings—Application to the case of Brasília/DF. Ph.D. Thesis, University of Brasília, Brasilia, Brazil, 2014. [Google Scholar]
- Galbusera, M.M.; De Brito, J.; Silva, A. The importance of the quality of sampling in service life prediction. Constr. Build. Mater. 2014, 66, 19–29. [Google Scholar] [CrossRef]
- Magos, M.; De Brito, J.; Gaspar, P.L.; Silva, A. Application of the factor method to the prediction of the service life of external paint finishes on facades. Mater. Struct. 2016, 49, 5209–5225. [Google Scholar] [CrossRef]
- Prieto, A.J.; Silva, A. Service life prediction and environmental exposure conditions of timber claddings in South Chile. Build. Res. Inf. 2020, 48, 191–206. [Google Scholar] [CrossRef]
- Souza, J.; Piazzarollo, C.B.; Bauer, E. Application of the Degradation Measurement Method in facade coverings. In Proceedings of the TECSIC—2nd Workshop on Technology of Construction Processes and Systems, August 2019; Available online: https://eventos.antac.org.br/index.php/tecsic/article/view/362 (accessed on 15 November 2023).
- Antunes, G.R. Study of Pathological Manifestations in Facade Cladding in Brasília: Systematization of the Incidence of Cases. Master’s Thesis, University of Brasilia, Brasilia, Brazil, 2010; p. 166. [Google Scholar]
- Souza, J.S. Evolution of Facade Degradation—Effect of Degradation Agents and Constituent Elements. Master’s Thesis, University of Brasilia, Brasilia, Brazil, 2016. [Google Scholar]
- Pinheiro, P.I.S. Application of the Degradation Measurement Method (MMD) to the Study of Building Facades in Brasília. Final project. Bachelor’s Thesis, University of Brasília, Brasilia, Brazil, 2016. [Google Scholar]
- Bauer, E. DMM Project: Building Degradation—Measurement and Modeling; Research Project. Postgraduate Program in Structures and Civil Construction—Brasília; University of Brasília—UnB: Brasilia, Brazil, 2021. [Google Scholar]
- Alvares, C.A.; Stape, J.L.; Sentelhas, P.C.; Goncalves, J.L.M.; Sparovek, G. Köppen’s climate classification map for Brazil. Meteorol. Z. 2013, 22, 711–728. [Google Scholar] [CrossRef]
- Fracinete , P., Jr.; Souza, J.S.; Zanoni, V.A.G.; Silva, M.N.B.; Bauer, E. Relationship between the degradation of facades and the incidence of directed rain and temperature—Case study for buildings in Brasília-Brazil. In Proceedings of the CONPAT 2015, Anais, Lisbon, Portugal, 2015. [Google Scholar]
- Amorim, C.N.; Flores, A.L. Residential buildings in the Plano Piloto superblocks, Brasília: Aspects of preservation and environmental comfort. In Proceedings of the National and Latin American Meeting on Comfort in the Built Environment—ENCAC/ELACAC, Maceió, Brazil, 31 October 2005; pp. 37–46. [Google Scholar]
- Santos, D.G. Measurement and distribution of pathologies in mortar degradation. Patorreb. 4–6 April 2018. [Google Scholar]
- Souza, J.; Silva, A.; Brito, J.; Dias, J.L.; Bauer, E. Evaluation of the Deterioration of Ceramic Claddings by Application of Artificial Neural Networks. J. Perform. Constr. Facil. 2020, 34, 04020084. [Google Scholar] [CrossRef]
- Ferreira, C.; Barrelas, J.; Silva, A.; de Brito, J.; Dias, I.S.; Flores-Colen, I. Impact of environmental exposure conditions on the maintenance of facades’ claddings. Buildings 2021, 11, 138. [Google Scholar] [CrossRef]
Disclaimer/Publisher’s Note: The statements, opinions and data contained in all publications are solely those of the individual author(s) and contributor(s) and not of MDPI and/or the editor(s). MDPI and/or the editor(s) disclaim responsibility for any injury to people or property resulting from any ideas, methods, instructions or products referred to in the content. |
© 2024 by the authors. Licensee MDPI, Basel, Switzerland. This article is an open access article distributed under the terms and conditions of the Creative Commons Attribution (CC BY) license (https://creativecommons.org/licenses/by/4.0/).