Abstract
Steel-fiber-reinforced recycled coarse aggregate concrete (SFRCAC) has great potential for use in structural members due to environmental and economic reasons. A comparison of SF’s reinforcing effect on the strength of RCAC with natural recycled coarse aggregate concrete (NCAC) was conducted through experiments and analysis. Three types of steel fiber—milling (MF), shear-wave (SWF), and both-end hooked (BF)—were used. The SF volume fraction () was taken as 0, 0.5%, 1.0%, 1.5%, and 2%. The results show that SF has a similar reinforcing effect on NCAC and RCAC. The reinforcing effect of SF on the strength of RCAC is relevant to the strength of the RCAC matrix. The suitable content range of SF is from 0.5% to 1.5% in terms of the reinforcement effects on the compressive strength () and splitting tensile strength () of RCAC. SF with a higher aspect ratio (AR) has a better reinforcing effect on the splitting tensile strength () and flexural strength () of RCAC. The equations of / and / with the characteristic parameters of steel fiber () were put forward to accurately determine the dosage of SF.
1. Introduction
Concrete is the most widely utilized building material in the construction industry and is a great consumer of natural resources. Making up waste concrete into recycled coarse aggregate (RCA) to produce new concrete can reduce the impact of the construction industry on the environment [1,2,3,4,5]. RCA is mainly made of natural coarse aggregate (NCA) and the clung cement mortar, in which the clung cement mortar on RCA has higher porosity, higher water absorption, and lower strength than that on NCA [6]. Compared with NCA, RCA has much higher water absorption [7] and lower apparent density [8]. Additionally, a large number of microcracks are produced in the process of crushing waste concrete, which causes a higher crushing index and reduces the soundness property of RCA [9]. Replacing NCA with RCA decreases the durability and strength of recycled coarse aggregate concrete (RCAC) and increases its shrinkage strain [10,11,12]. Because of its poor properties, the application of RCAC is limited. In China, RCAC is only feasible as backfill and subgrade material, or for self-bearing members in civil engineering [13,14].
The addition of double hooked-end steel fiber (SF) to RCAC at a fiber volume content of 1% led to an increase of 60% in the splitting tensile strength () and 88% in the flexural strength () at 28 days [15]. The addition of SF improves the mechanical properties of the RCAC; in particular, it better controls its fracture process [16]. It has been well confirmed that the incorporation of SF improves the working performance of RCAC, including better crack resistance, ductility, and toughness [17,18,19]. Also, the combination of SF and RCA has great environmental and economic positive effects; SF can prevent the development of cracks in concrete through the bridging of the fibers and improve the strength and toughness of concrete [18,20,21]. SF-reinforced RCAC has great application potential for structural members [22].
However, the reinforcing effect of SF type and content on the strength of RCAC is still unclear, and there is no proper calculation method for the dosage determination of steel fiber in the mixture proportion design of SF-reinforced RCAC, which is dependent only on the experience of designer. The dosage of SF determined by experience is generally larger than that for actual demand, leading to waste of SF material. Therefore, the reinforcing effect of SF type and content on the strength of RCAC was studied by experiments for this paper, and the dosage determination method was put forward based on experimental research and analysis of the results. The list of abbreviations is shown in Table 1.

Table 1.
List of abbreviations.
2. Experimental Program
2.1. Materials
General Portland cement (P.O 42.5) conforming to the stipulations in GB 175 [23] was used in all mixtures; the properties of the cement are shown in Table 2. The coarse aggregate included NCA and RCA. The NCA was crushed limestone with continuous grading of particle sizes from 4.75 mm to 20 mm. The RCA was obtained from waste concrete specimens with compressive strength () ranging from 30 MPa to 50 MPa, and of unknown age. The waste concrete was collected and crushed through a jaw crusher, and then screened through sieves with a maximum size of 20 mm and a minimum size of 4.75 mm. The grading of the NCA and RCA was within the upper and lower limit bounds of ASTMC33/C33M-13 [24]. The fine aggregate was river sand with a fineness modulus of 2.67. The physical properties of all aggregates used in the test, obtained using the test methods in Chinese standards GB/T 25177 [25] and GB/T 14685 [26], are shown in Table 3. The NCA used was in the oven-dried condition. The particle size distributions of the coarse aggregates are shown in Figure 1. It can be inferred from Table 3 that the RCA, compared with the NCA, had the higher water absorption, void ratio, and crushing index, but lower apparent density. To remedy the adverse effects of RCA on the working performance of RCAC, it needs to be pre-wet and in the saturated surface-dry state when batching. Three types of SF, including milling (MF), shear-wave (SWF), and both-end hooked (BF), were used. Table 4 provides an overview of the characteristic parameters of the SFs.
Table 2.
Physical and mechanical properties of cement.
Table 3.
Physical properties of the coarse and fine aggregates.
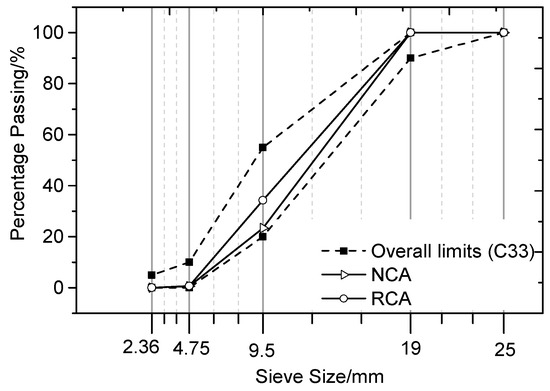
Figure 1.
Size distribution curves of RCA and NCA.
Table 4.
Characteristic parameters of steel fibers.
2.2. Mix Proportion
All of the mixing procedures and the mixture proportions were in accordance with the Chinese regulation “Technical specification for application of fiber reinforced concrete” (JGJ/T 221-2010, 2010) [27]. The water–cement ratio was considered to be 0.48. NCA and RCA were used as coarse aggregates. The SF volume fraction () of MF was taken as 0, 0.5%, 1.0%, 1.5%, and 2%, and only 1% for SWF and BF to compare with MF. To ensure the workability of SFRCAC, for each 0.5% increase in , the water content was increased by 8 kg/m3 and the sand ratio by 3% [28]. To accurately determine the reinforcement effect of SF, one mixture for normal concrete without SF, which each group of SFRCAC corresponding to the same proportion of , was also prepared. The 22 groups of mixture proportions designed are listed in Table 5.
Table 5.
Mixture proportions (kg/m3), compressive strength, splitting tensile strength, and flexural strength of SFRCAC.
2.3. Test Specimens
Cubic specimens with a side length of 150 mm were cast for the compressive strength () and splitting tensile strength () tests, while prism specimens of 100 mm × 100 mm × 400 mm were cast for the flexural strength () tests. Three identical specimens in each condition were prepared for each test.
The mixing process of SFRCAC consists of three steps: Firstly, all aggregates and SF were put into a small blender to mix for about 2 min in order to assure that the SF could be evenly distributed in the aggregates. Secondly, we added cement and continued to mix for 1 min. Finally, half of the water was added to the blender and mixed for 1 min, before adding the remaining water and mixing again for 1 min.
The fresh SFRCAC was put rapidly into molds that were pre-brushed with oil. The specimens were vibrated for 20 s. After curing in air for 24 h, the specimens were demolded carefully and placed in a curing room at approximately 95% RH and 20 ℃.
2.4. Test Methods
The technology roadmap is shown in Figure 2. All of the tests were carried out after 28 days of curing. The compressive and splitting tensile strength tests were performed according to the stipulations in GB/T50081 [29] on a servohydraulic closed-loop testing machine with capacity of 3000 kN, at loading rates of 0.6 MPa/s and 0.06 MPa/s, respectively. The instrument setup used for the compressive strength test and the splitting tensile strength test is shown in Figure 3 and Figure 4, respectively. The specimen should be put in the central position of the testing machine. The casting face of the specimen cannot be used as the splitting surface, so as to eliminate the effect of the rough casting face. One cushion block and one wood filler strip were placed between specimen and the top and bottom pressure plates, respectively. The section of cushion block was a circle with a radius of 75 mm and thickness of 20 mm. The section of filler strip was 20 mm × 4 mm. The cushion block and wood filler strip should be aligned with the centerline of the top and bottom surfaces of the specimen, respectively. The of the specimens was calculated as follows:
where is the splitting tensile strength (MPa), F is the maximum applied load shown by the testing machine (N), and A is the area of the splitting surface (mm2).
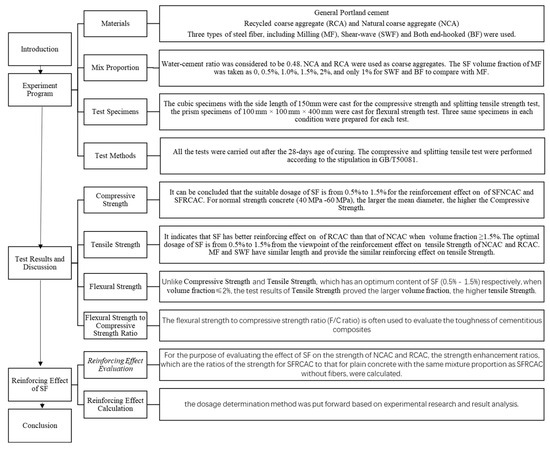
Figure 2.
Technology roadmap.
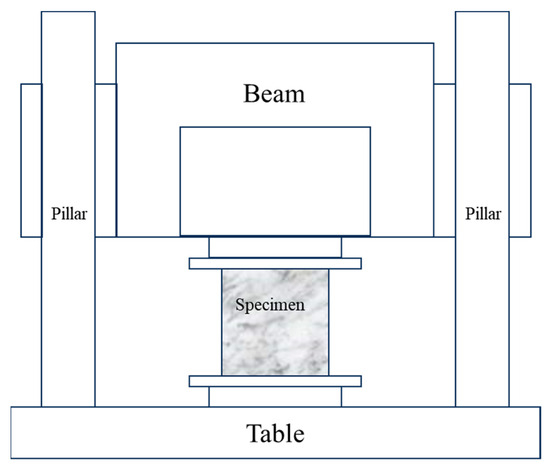
Figure 3.
Instrument setup for the compressive strength tests.
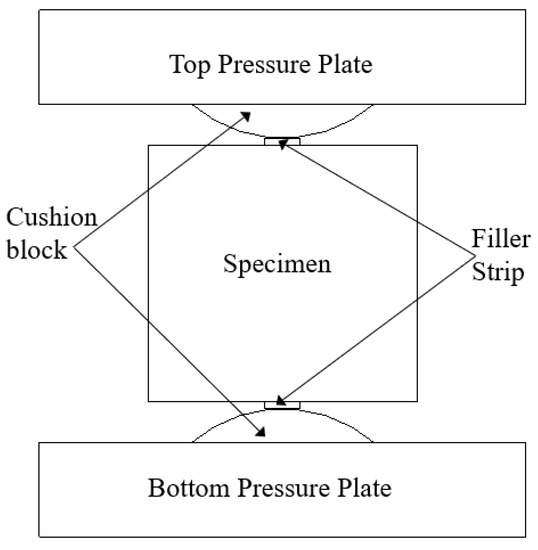
Figure 4.
Test setup for splitting tensile strength.
The flexural tests were carried out on an MTS810 testing machine with a capacity of 500 kN and displacement control at a rate of 0.1 mm/min, according to the stipulations in ASTM C1609 [30]. The specimens were rotated normally from the casting position to eliminate the eccentricity effect caused by the roughness of the surface. The of the specimens was calculated as follows:
where is the flexural strength (MPa), F is the maximum applied load shown by the testing machine (N), is the average width and height of the specimen, respectively (mm), and is the span length of the specimen (mm).
The test results for each specimen group are the mean value of three specimens. The test results for , , and are listed in Table 5.
3. Test Results and Discussion
3.1. Compressive Strength
When the SF type is MF, the relations between and SF are as shown in Figure 5. Obviously, the of SFNCAC is higher than that of SFRCAC when increases from 0 to 2%. This is because RCA has more defects than NCA, and the matrix strength of RCAC is lower than that of NCAC with the same mixture proportions. This trend is evident in Table 4, which shows that the matrix strength of SFRCAC is lower than that of SFNCAC; many previous studies have reached the same conclusion [31,32]. However, when increases from 0 to 2%, the of SFNCAC and SFRCAC has a similar increasing trend. The curves of for both SFNCAC and SFRCAC can be divided into three parts: in the first part (0 < ≤ 0.5%), the compressive strength () for both of SFNCAC and SFRCAC increases gently; in the second part (0.5% < ≤ 1.5%), the for both of SFNCAC and SFRCAC increases rapidly; in the third part (1.5% < ≤ 2%), the of SFNCAC decreases slightly, while the of SFRCAC still increases, with a small growth rate. From the analysis mentioned above, it can be concluded that the suitable dosage of SF is from 0.5% to 1.5% for the reinforcement effect on the of SFNCAC and SFRCAC.
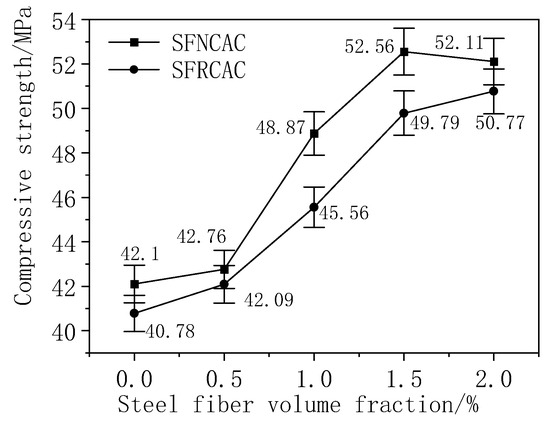
Figure 5.
Relationships between compressive strength and steel fiber volume fraction.
When = 1%, the relations of with the SF type are as displayed in Figure 6. It can be concluded that the curves are close to straight lines and nearly parallel to one another, which indicates that the three types of SF (MF, BF, and SWF) have very similar effects on the of SFNCAC and SFRCAC. This is because the compressive properties of SF-reinforced concrete are mainly controlled by the of the concrete matrix [19]. The same kind of SF has the same reinforcing effect on concrete whether the concrete matrix is NCAC or RCAC. Of the three types of SF, MF has the best reinforcing effect on ; the other two kinds of SF have similar reinforcing effects. This may be because MF has a larger mean diameter than that of BF and SWF. For normal-strength concrete (40 MPa–60 MPa), the larger the mean diameter, the higher the .
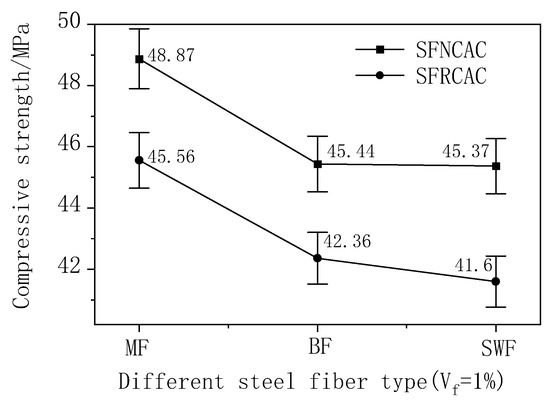
Figure 6.
Relationships between compressive strength and steel fiber type.
3.2. Tensile Strength
When the SF type is MF, the relations between and SF are as displayed in Figure 7. It can be concluded that the SF has same positive effect on the of both NCAC and RCAC. The curves of with SF can be divided into three parts: in the first part (0 < ≤ 0.5%), the increasing trends of for both NCAC and RCAC are very gentle; in the second part (0.5% < ≤ 1.5%), increases rapidly; is almost 5.5 MPa in the third part (1.5% < ≤ 2%). Therefore, when ≤ 0.5%, SF only has a weak effect on ; when > 1.5%, does not increase with the increase in , but the of RCAC is very close to that of NCAC, and even surpasses that of NCAC when = 1.5%. This indicates that SF has a better reinforcing effect on the of RCAC than on that of NCAC when ≥ 1.5%. On the whole, insufficient cannot provide reinforcement to , while excessive does not work well and wastes the material. The optimal dosage of SF is from 0.5% to 1.5% from the viewpoint of the reinforcement effect on the of NCAC and RCAC.
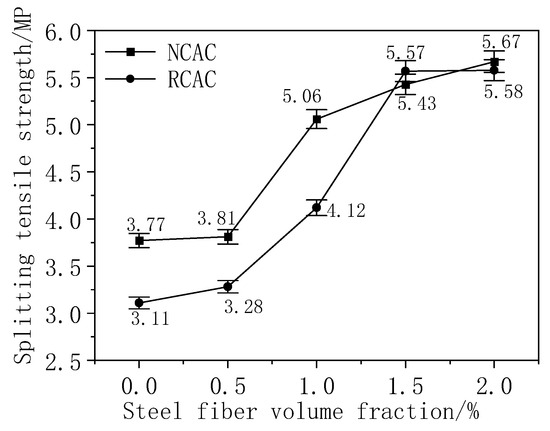
Figure 7.
Relationships between splitting tensile strength and steel fiber volume fraction.
When = 1%, the relations between and the SF type are as displayed in Figure 8, based on the experimental data. It can be concluded that the curves for both NCAC and RCAC are nearly parallel to one another, which indicates that the three types of SF (MF, BF, and SWF) have similar effects on the of NCAC and RCAC. Of the three types of SF, BF has the best reinforcing effect on . As shown in Table 3, BF is almost twice as long as MF and SWF. Longer SF requires a stronger pullout force, and this may be the reason that BF can provide the best reinforcing effect on . MF and SWF have similar lengths and provide similar reinforcing effects on .
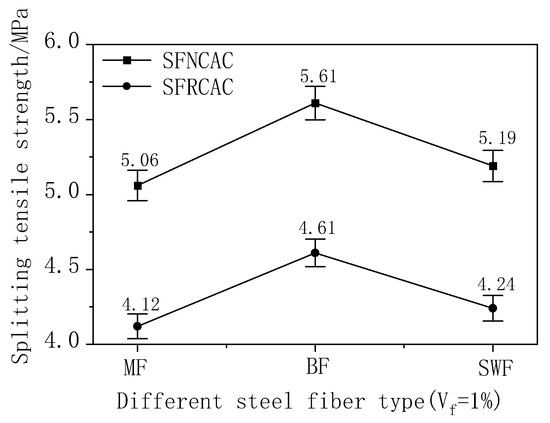
Figure 8.
Relationships between splitting tensile strength and steel fiber type.
3.3. Flexural Strength
When the SF type is MF, the relations between and SF are as shown in Figure 9. Whether the concrete matrix is NCAC or RCAC, the of NCAC and RCAC increases obviously with the increase in . Although the of NCAC is higher than that of RCAC, the lines showing the increases in the of NCAC and RCAC are almost parallel to one another. This indicates that SF has the same reinforcing effect on the of NCAC and RCAC. Unlike and , which have optimal contents of SF (0.5–1.5%), when ≤ 2%, the test results of prove that the larger the , the higher the . Therefore, the upper limit of for the of NCAC and RCAC needs to be further studied.
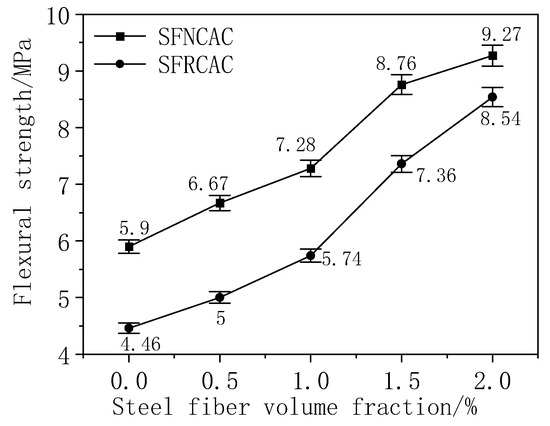
Figure 9.
Relationships between flexural strength and steel fiber volume fraction.
When = 1%, the relations between and the SF type are as displayed in Figure 10. It can be concluded that the curves for both NCAC and RCAC are parallel to one another, which indicates that the three types of SF (MF, BF, and SWF) have similar effects on the of NCAC and RCAC. Of the three types of SF, BF has the best reinforcing effect on , while SWF has a slightly better effect than MF. This may be because BF has the largest AR.
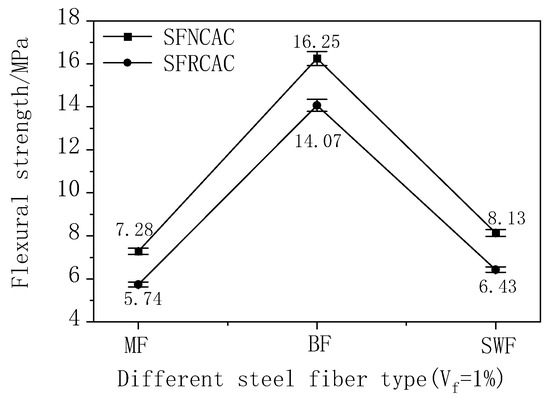
Figure 10.
Relationships between flexural strength and steel fiber type.
3.4. Flexural Strength to Compressive Strength Ratio
The flexural strength–compressive strength ratio (F/C ratio) is often used to evaluate the toughness of cementitious composites [33]. When the SF type is MF, the relations between the F/C ratio and SF are as shown in Figure 11. We can conclude that no matter whether the concrete matrix is NCAC or RCAC, the F/C ratio of NCAC and RCAC shows an increasing trend in general. Nevertheless, the F/C ratio of NCAC is consistently higher than that of RCAC regardless of the fiber doping, and it can also be seen that for the RCAC matrix, the most suitable SF doping is about 1%. Hence, it is interesting that the reinforcing effect of steel fiber on NCAC is more effective than on RCAC. This may result from the higher bonding strength between steel fiber and NCAC than between steel fiber and RCAC.
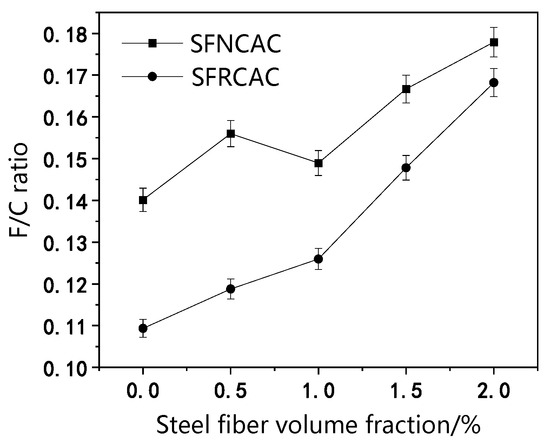
Figure 11.
Relationships between flexural strength–compressive strength ratio and steel fiber volume fraction.
When = 1%, the relations between the F/C ratio and SF type are as displayed in Figure 12. We can clearly see that the curve is similar to the curve, and the lines showing the increases in the FC/ratio of NCAC and RCAC are almost parallel to one another. We can easily deduce that BF is more effective in improving the toughness of NCAC and RCAC.
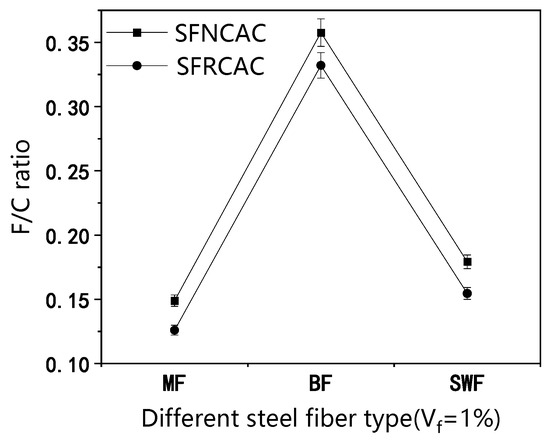
Figure 12.
Relationships between flexural strength–compressive strength ratio and steel fiber type.
4. Reinforcing Effect of SF
4.1. Reinforcing Effect Evaluation
For the purpose of evaluating the effects of SF on the strength of NCAC and RCAC, the strength enhancement ratios (/, /, /), which are the ratios of the strength of SFRCAC to that of plain concrete with the same mixture proportions as SFRCAC without fibers, were calculated.
The relations of /, / and / with are shown in Figure 13, according to the test results with the same type SF (MF). It can be concluded that for both NCAC and RCAC, the value of / is smallest compared with that of / and /. The value of / for both NCAC and RCAC with = 1% reached the maximum of 1.18, and it was below 1.1 for the other case, which is far below the values of / and /. These results are consistent with those reported in the literature, indicating that the adding SF to concrete can increase the by a factor of 1.5–2, with a slight increase in (up to 10–25%) [34]. Only when = 0.5% is the value of / for NCAC larger than 1.1, which indicates that when ≤ 0.5%, steel fiber has a slight reinforcing effect on the and of NCAC, except for the of SFNCAC. The values of both / and / increase rapidly when ≥ 1%; moreover, the value of / is larger than that of /. When = 2%, the value of / for SFNCAC reaches the maximum of 1.76, while it is 1.68 for SFRCAC. The value of / for SFNCAC is very close to that for SFRCAC, especially when = 1.5%, with the same value of 1.33.
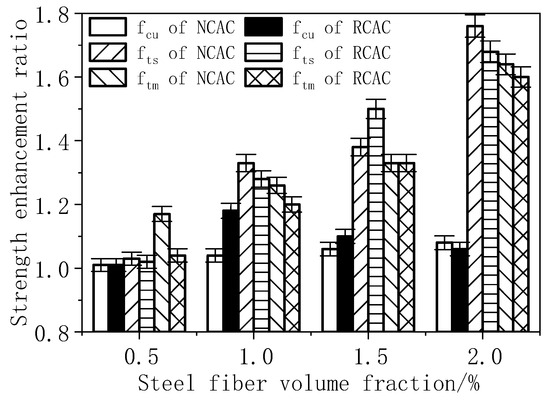
Figure 13.
Relationships between strength enhancement ratio and steel fiber volume fraction.
For the purpose of evaluating the reinforcing effect of SF type on , , and , the values of /, /, and / reinforced by MF, BF, and SF ( = 1%) were also calculated. The relations of /, /, and / with SF type are given in Figure 14. The values of / for the three types of SF are less than 1.1, and they are all lower than those of / and /. This indicates that the reinforcing effect of these three types of SF on is less than that on and . MF and SWF have similar reinforcing effects on , , and ; the values of / and / for SFNCAC and SFRCAC are around 1.3 and 1.4, respectively. The values of / for SFNCAC and SFRCAC with BF are 1.47 and 1.43, respectively, which are slightly higher than those with MF and SWF. However, the values of / for SFNCAC and SFRCAC with BF are 2.81 and 2.94, respectively, which are much higher than those with MF and SWF. This may be due to the fact that the AR values of MF and SF are very close, while the AR of BF is almost twice that of the other two types of SF. When is determined, the values of / and / increase significantly with the increase in the SF aspect ratio (AR).
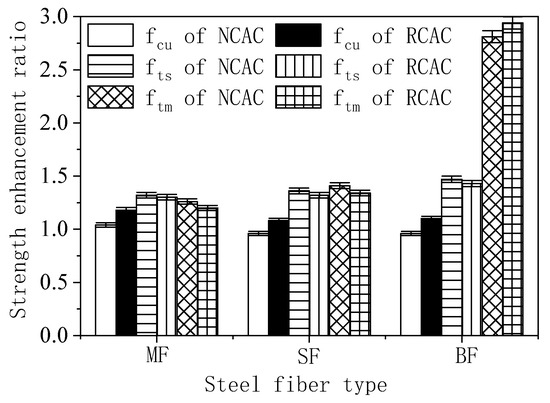
Figure 14.
Relationships between strength enhancement ratio and steel fiber type.
4.2. Reinforcing Effect Calculation
Based on the above analysis, SF has similar reinforcing effects on NCAC and RCAC. The reinforcing effect of SF on is not as obvious as on and . The values of / and / are related to the and aspect ratio. These two factors can be reflected by the SF characteristic coefficient (), . The relations between /, /, and , according to the experimental data in this paper and the previous literature [35], are shown in Figure 15.
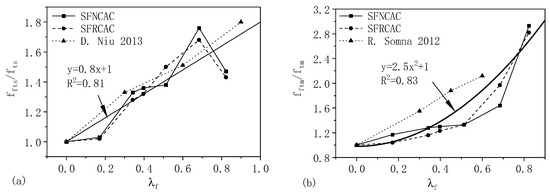
Figure 15.
Relationships between strength enhancement ratio and characteristic coefficient of steel fiber (a) [34]; (b) [36].
As shown in Figure 15a, the change in / for SFNCAC and SFRCAC follows the same trend, where both increase with the increase in . Except for two points, where the steel fiber is BF and = 1%, the value of / decreases obviously with the increase in . As shown in Table 3, the length of BF is 62 mm, and its AR is 82.3; both the length and AR of BF are much higher than those of other two types of SF. The length of the specimens for the splitting tensile strength tests was 150 mm; therefore, the distribution uniformity of SF in the specimens may decrease if the SF is too long. This may lead to the content of SF being too small in partial sites, the internal defects of SFNCAC and SFRCAC increase, and the stress easily concentrates under the action of loading. With the increase in , the value of / does not increase, but rather decreases. Therefore, the long SF is not suitable for the small specimens, as the reinforcing effect could be weakened due to the inhomogeneous distribution of SF. As shown in Figure 15a, the reinforcing ratio of is approximately linear with the increase in . According to the test data of this paper and the literature [34], a linear regression equation between / and is put forward as follows:
where is the splitting tensile strength of SFRCAC, is the splitting tensile strength of RCAC with the same mix proportions as the SFRCAC, and is the characteristic parameter of steel fiber.
As shown in Figure 15b, the values of / for both SFNCAC and SFRCAC increase with the increase in . When is less than 0.5, the value of / increases slowly; however, it increases rapidly when is above 0.5. The relationship between / and is quadratic. Based on regression analysis of the experimental data from this paper and the literature [36], a regression equation between / and is proposed as follows:
where is the flexural strength of SFRCAC, while is the flexural strength of RCAC with the same mix proportions as the SFRCAC.
For the required or of SFRCAC, the can be determined using Equation (3) when is known, or using Equation (4) when is known. The SF type and AR can be chosen according to the engineering requirements. Finally, the can be calculated.
5. Value Engineering Analysis
Value engineering analysis is a quantitative method of analyzing the value of a product in terms of the features that it possesses compared to the cost that it requires. Value (V) = Function (F)/Cost (C). The value engineering analysis method was used to perform a cost analysis of steel-fiber-reinforced recycled aggregate concrete.
According to the experimental results, it can be seen that the mechanical properties of concrete can be significantly improved when SF is added. Among them, SFNCAC had the highest strength, while the mechanical properties of SFRCAC were lower than those of SFNCAC but significantly higher than those of ordinary concrete and recycled aggregate concrete. However, the cost of SFNCAC is much higher than that of SFRCAC. Among them, the cost of SFNCAC is the highest, at CNY 725.75, while the cost of SFRCAC is similar to or even lower than that of NCAC, at CNY 468.66.
According to the value engineering analysis method, the value of the samples was analyzed and compared, as shown in Table 6. It can be inferred that although RCAC has the best cost performance, its mechanical properties are the worst, which makes it difficult to apply in practical engineering. Compared with SFNCAC, SFRCAC has lower cost and similar mechanical properties, which means that it has better cost performance.
Table 6.
Value engineering analysis.
6. Conclusions
The reinforcing effects of SF on the , , and of SFNCAC and SFRCAC were studied through experiments. Based on the experimental results and analysis, the following conclusions can be drawn:
- Steel fiber has the same reinforcing effect on NCAC and RCAC. For RCAC, the suitable content range of SF is from 0.5% to 1.5% of in terms of the reinforcement effects on and . When ≤ 2%, the larger the , the higher the . The upper limit of for needs to be further studied.
- The reinforcing effect of SF on the strength of SFRCAC is related to the strength of the RCAC matrix. When all other conditions are equal, the SF with the larger diameter has the better reinforcing effect on the of RCAC; the steel fiber with the higher AR has the better reinforcing effect on the and of RCAC.
- Among the three types of steel fibers, MF and SF have similar reinforcing effects on , , and , However, the / values of SFNCAC and SFRCAC with BF are much higher than those with MF and SF because of the larger aspect ratio of the former.
- According to the value engineering analysis method, it can be inferred that although RCAC has the best cost performance, its mechanical properties are the worst, which makes it difficult to apply in practical engineering. Compared with SFNCAC, SFRCAC has lower cost and similar mechanical properties, which means that it has better cost performance.
- The positive reinforcing effect of SF on the and of RCAC is much better than that on . A linear regression equation between / and , and a quadratic equation between / and of SFRCAC, were put forward. The content of steel fiber can be calculated by Equation (3) or Equation (4) when the required or of RCAC is given, respectively.
Author Contributions
Conceptualization, Y.W.; Methodology, L.L.; Formal analysis, L.Z.; Resources, P.Y.; Writing—original draft, P.Y., Z.M., L.Z., Y.W., Q.F. and L.L.; Writing—review & editing, P.Y., Z.M., L.Z., Y.W., Q.F. and L.L.; Supervision, Z.M.; Project administration, Q.F. All authors have read and agreed to the published version of the manuscript.
Funding
This work was part of a key project financially supported by the National Natural Science Foundation of China (52108207, 51808509, 52109168), Natural Science Foundation of Henan (212300410106), Henan Province Key Science and Technology Attack Plan Project (212102310281), Young Backbone Teachers Project of Henan University of Urban Construction (YCJQNGGJS202002), Academic and Technical Leaders Project of Henan University of Urban Construction (YCJXSJSDTR202201), and Innovation and Entrepreneurship Training Program for University Students (202211765031).
Data Availability Statement
No new data was created.
Conflicts of Interest
The authors declare no conflict of interest.
References
- Raman, J.V.M.; Ramasamy, V. Various treatment techniques involved to enhance the recycled coarse aggregate in concrete: A review. Mater. Today Proc. 2021, 45, 6356–6363. [Google Scholar] [CrossRef]
- Ma, Z.; Shen, J.; Wang, C.; Wu, H. Characterization of sustainable mortar containing high-quality recycled manufactured sand crushed from recycled coarse aggregate. Cem. Concr. Compos. 2022, 132, 104629. [Google Scholar] [CrossRef]
- Liu, H.; Liu, C.; Wu, Y.; Bai, G.; He, C.; Zhang, R.; Wang, Y. Hardened properties of 3D printed concrete with recycled coarse aggregate. Cem. Concr. Res. 2022, 159, 106868. [Google Scholar] [CrossRef]
- Bao, J.; Li, S.; Zhang, P.; Ding, X.; Xue, S.; Cui, Y.; Zhao, T. Influence of the incorporation of recycled coarse aggregate on water absorption and chloride penetration into concrete. Constr. Build Mater. 2020, 239, 117845. [Google Scholar] [CrossRef]
- Salesa, N.; Pérez-Benedicto, J.A.; Colorado-Aranguren, D.; López-Julián, P.L.; Esteban, L.M.; Sanz-Baldúz, L.J.; Sáez-Hostaled, J.L.; Ramis, J.; Olivares, D. Physico-mechanical properties of multi-recycled concrete from precast concrete industry. J. Clean. Prod. 2017, 141, 248–255. [Google Scholar] [CrossRef]
- Shi, C.; Li, Y.; Zhang, J.; Li, W.; Chong, L.; Xie, Z. Performance enhancement of recycled concrete aggregate—A review. J. Clean. Prod. 2016, 112, 466–472. [Google Scholar] [CrossRef]
- Kubissa, J.; Koper, M.; Koper, W.O.; Kubissa, W. Koper. Water Demand of Concrete Recycled Aggregates. Procedia Eng. 2015, 108, 63–71. [Google Scholar] [CrossRef]
- Hamad, B.S.; Dawi, A.H. Sustainable normal and high strength recycled aggregate concretes using crushed tested cylinders as coarse aggregates. Case Stud. Constr. Mater. 2017, 7, 228–239. [Google Scholar] [CrossRef]
- Bravo, M.; de Brito, J.; Evangelista, L.; Pacheco, J. Superplasticizer’s efficiency on the mechanical properties of recycled aggregates concrete: Influence of recycled aggregates composition and incorporation ratio. Constr. Build. Mater. 2017, 153, 129–138. [Google Scholar] [CrossRef]
- He, Z.; Zhang, J. Strength characteristics and failure criterion of plain recycled aggregate concrete under triaxial stress states. Constr. Build. Mater. 2014, 54, 354–362. [Google Scholar] [CrossRef]
- Omary, S.; Ghorbel, E. Wardeh. Relationships between recycled concrete aggregates characteristics and recycled aggregates concretes properties. Constr. Build. Mater. 2016, 108, 163–174. [Google Scholar] [CrossRef]
- Khodair, Y.; Bommareddy, B. Self-consolidating concrete using recycled concrete aggregate and high volume of fly ash, and slag. Constr. Build. Mater. 2017, 153, 307–316. [Google Scholar] [CrossRef]
- Ding, T.; Xiao, J.; Tam, V.W.Y. A closed-loop life cycle assessment of recycled aggregate concrete utilization in China. Waste Manag. 2016, 56, 367–375. [Google Scholar] [CrossRef] [PubMed]
- Xiao, J.; Li, W.; Fan, Y.; Huang, X. An overview of study on recycled aggregate concrete in China (1996–2011). Constr. Build. Mater. 2012, 31, 364–383. [Google Scholar] [CrossRef]
- Afroughsabet, V.; Biolzi, L.; Ozbakkaloglu, T. Influence of double hooked-end steel fibers and slag on mechanical and durability properties of high performance recycled aggregate concrete. Compos. Struct. 2017, 181, 273–284. [Google Scholar]
- Carneiro, J.A.; Lima, P.R.L.; Leite, M.N.B.; Filho, R.D.T. Compressive stress–strain behavior of steel fiber reinforced-recycled aggregate concrete. Cem. Concr. Compos. 2014, 46, 65–72. [Google Scholar] [CrossRef]
- Gao, D.; Zhang, L.; Nokken, M. Mechanical behavior of recycled coarse aggregate concrete reinforced with steel fibers under direct shear. Cem. Concr. Compos. 2017, 79, 1–8. [Google Scholar] [CrossRef]
- Li, L.; Yan, C.; Zhang, N.; Farooqi, M.U.; Xu, S.; Deifalla, A.F. Flexural fracture parameters of polypropylene fiber reinforced geopolymer. J. Mater. Res. Technol. 2023, 24, 1839–1855. [Google Scholar] [CrossRef]
- Li, L.; Qin, Y.; Cao, M.; Guan, J.; Xie, C. Bending performance and calculation of reinforced beam with hybrid fiber and CaCO3 whisker. Comput. Concr. 2023, 31, 197–206. [Google Scholar]
- Gao, D.; Zhu, W.; Fang, D.; Tang, J.; Zhu, H. Shear behavior analysis and capacity prediction for the steel fiber reinforced concrete beam with recycled fine aggregate and recycled coarse aggregate. Structures 2022, 37, 44–55. [Google Scholar] [CrossRef]
- Li, L.; Ma, Z.; Ming, X. Multiscale ab-initio modeling and experiment of nano-CaCO3 and fiber synergy on toughening low-carbon geopolymer composites. Mater. Des. 2023, 233, 112280. [Google Scholar] [CrossRef]
- Jang, S.; Yun, H. Combined effects of steel fiber and coarse aggregate size on the compressive and flexural toughness of high-strength concrete. Compos. Struct. 2018, 185, 203–211. [Google Scholar] [CrossRef]
- GB/175-2007; Common Portland Cement. China Standards Press: Beijing, China, 2007.
- ASTM C33-13; Standard Specification for Concrete Aggregates. ASTM: West Conshohocken, PA, USA, 2013.
- GB/T 25177; Recycled Coarse Aggregate for Concrete. China Standards Press: Beijing, China, 2010.
- GB/T 14685; Pebble and Crushed Stone for Construction. China Standards Press: Beijing, China, 2011.
- JGJ/T 221-2010; Technical Specification for Application of Fiber Reinforced Concrete. China National Standardization Administration: Beijing, China, 2010.
- Gao, D.; Zhao, J.; Zhu, H. Design and Application of Steel Fiber Concrete; China Construction Industry Press: Beijing, China, 2002. [Google Scholar]
- GB/T50081; Standard for Test Method of Mechanical Properties on Ordinary Concrete. China Architecture & Building Press: Beijing, China, 2002.
- ASTM C1609; Standard Test Method for Flexural Performance of Fiber-Reinforced Concrete (Using Beam with Third-Point Loading). ASTM International: West Conshohocken, PA, USA, 2012.
- Mukharjee, B.B.; Barai, S.V. Influence of incorporation of nano-silica and recycled aggregates on compressive strength and microstructure of concrete. Constr. Build. Mater. 2014, 71, 570–578. [Google Scholar] [CrossRef]
- Silva, R.V.; de Brito, J.; Dhir, R.K. Establishing a relationship between modulus of elasticity and compressive strength of recycled aggregate concrete. J. Clean. Prod. 2016, 112, 2171–2186. [Google Scholar]
- Cao, M.; Zhang, C.; Li, Y.; Wei, J. Using Calcium Carbonate Whisker in Hybrid Fiber-Reinforced Cementitious Composites. J. Mater. Civ. Eng. 2015, 27, 4014139. [Google Scholar] [CrossRef]
- Niu, D.; Jiang, L.; Bai, M.; Miao, Y. Study of the performance of steel fiber reinforced concrete to water and salt freezing condition. Mater. Des. 2013, 44, 267–273. [Google Scholar] [CrossRef]
- Kim, H.; Kim, G.; Gucunski, N.; Nam, J.; Jeon, J. Assessment of flexural toughness and impact resistance of bundle-type polyamide fiber-reinforced concrete. Compos. Part B Eng. 2015, 78, 431–446. [Google Scholar] [CrossRef]
- Somna, R.; Jaturapitakkul, C.; Chalee, W.; Rattanachu, P. Effect of the Water to Binder Ratio and Ground Fly Ash on Properties of Recycled Aggregate Concrete. J. Mater. Civ. Eng. 2012, 24, 16–22. [Google Scholar] [CrossRef]
Disclaimer/Publisher’s Note: The statements, opinions and data contained in all publications are solely those of the individual author(s) and contributor(s) and not of MDPI and/or the editor(s). MDPI and/or the editor(s) disclaim responsibility for any injury to people or property resulting from any ideas, methods, instructions or products referred to in the content. |
© 2023 by the authors. Licensee MDPI, Basel, Switzerland. This article is an open access article distributed under the terms and conditions of the Creative Commons Attribution (CC BY) license (https://creativecommons.org/licenses/by/4.0/).