Abstract
The increasing quantity of air pollutants generated by automobiles can cause significant harm in relatively enclosed indoor environments. Studying the distribution of pollutants under different conditions in underground parking garages is of great significance for improving indoor air quality and reducing casualties in the event of a fire. This article presents a geometric model of an underground parking garage based on PHOENICS modeling. The related results of CO concentration distribution and fire temperature distribution under ventilation and fire conditions are obtained. Based on the CO concentration and velocity distribution as well as the temperature distribution during a fire, reasonable suggestions are proposed to improve indoor air quality and reduce casualty rates in fire incidents. The results show that under ventilation conditions, adjusting the position of the induced ventilation fan can maintain CO concentrations below 30 ppm in partitions one to three and below 37 ppm in partitions four to six. The temperature of smoke gases remained below 50 °C during the evacuation time, and only a small area exhibited CO levels exceeding 2000 ppm. The existing ventilation exhaust system provides effective fire protection, as it minimally affects personnel evacuation due to the relatively lower smoke temperature.
1. Introduction
At present, the world’s population is rapidly increasing, and the living standards of people have significantly improved, leading to continuous expansion of urban areas. The development of urbanization has brought about some negative impacts on human life [1]. The continuous increase in car usage brings about environmental issues [2,3] and the phenomenon of land shortage [4,5], which cannot be ignored. The challenges caused by these environmental issues are not only limited to outdoor air; indoor air also faces similar challenges [6].
In recent years, underground spaces have been widely utilized [7], among which underground parking garages are the most common. Underground garages have large capacity but rely solely on entrances and exits for natural ventilation, resulting in poor ventilation performance and an environment similar to enclosed spaces. The exhaust emissions from running vehicles contain a significant amount of pollutants. Transport-related pollutants have a significant impact on human health [8], and the effects of traffic pollution on human health are increasingly gaining attention [9,10].
The primary gaseous pollutants emitted by vehicles include carbon monoxide (CO), nitrogen oxides (NOX), hydrocarbons (HCs), and aldehydes [11,12]. Studies have shown that among the various pollutants emitted by cars, CO is the primary air pollutant in parking lots [13,14]. Insufficient ventilation or malfunction in garages can cause the accumulation of a large amount of CO emissions and heat [15]. Enclosed underground garages represent a typical occupational microenvironment with high expected CO concentrations [16]. CO poses significant health risks to humans [17,18], as it combines with hemoglobin in the blood, causing a rapid decrease in oxygenated hemoglobin in the plasma, severely impairing the ability to transport oxygen, leading to tissue hypoxia, and in severe cases, death may occur [18,19]. In many countries, CO concentration is considered as the primary indicator of pollutant levels in underground garages [14,20].
Computational Fluid Dynamics (CFD) is an effective method for analyzing indoor ventilation in buildings [21]. Through the simulation of CO concentration in underground garages using the PHOENICS program, it has been discovered that improper ventilation system settings result in an uneven distribution of CO within the space [22,23]. The use of CFD research to meet indoor air quality and thermal comfort standards shows that controlling indoor pollutant concentration can only be achieved by controlling the airflow throughout the entire space. Previous studies have confirmed that both ventilation conditions and fire scenarios can be numerically simulated using CFD models [22,24]. These simulations facilitate effective comparative analyses between experimental and theoretical approaches [25]. CFD simulation has been widely used to analyze spatial thermal and airflow environments [26,27], and using CFD simulation to study ventilation performance has significant advantages [28]. Numerical calculation models for flow and concentration behaviors in enclosed spaces are useful tools for predicting velocity fields and CO level distributions inside the garage [12,29].
A certain underground garage in Ethiopia employs an induced ventilation system, which has been commonly used in the ventilation systems of underground garages [30,31], and some studies have also investigated how induced fans significantly improve airflow distribution in underground garages [32,33]. Controlling pollutant concentration in garages is the best method for estimating exhaust gas leakage in underground garages [34].
Numerous studies have explored the advantages of utilizing induced ventilation in underground parking garages [32,33] and the rationality of simulating pollutant distribution in space using the PHOENICS model [22,23]. However, there is a limited number of studies that have extensively employed both PHOENICS and numerical simulation methods to investigate specific ventilation conditions and fire scenarios in underground parking garages with induced ventilation systems. Additionally, few studies have proposed optimization and improvement strategies for these scenarios. To address this gap, this paper utilizes the PHOENICS version 2022 program to establish a simplified geometric model of a two-level underground parking garage. The ventilation conditions and fire conditions of the induced ventilation system in the underground parking garage are simulated. The aim is to examine whether the ventilation conditions, with a certain level of air exchange, can effectively maintain the CO concentration in the underground parking garage within the safe range of 2000 ppm (ppm in this article is a unit of mass concentration). Additionally, the distribution of temperature and smoke concentration in the space under the existing ventilation system during fire conditions is evaluated for its rationality. Specific modification suggestions are proposed, aiming to provide a reference for the design of ventilation systems in underground parking garages.
2. Methods
2.1. Theoretical Approach
2.1.1. Simplification of the Physical Model
The CFD model is highly sensitive to the computational parameters set by the user and offers strong accuracy [35,36]. PHOENICS is a reliable and cost-effective CFD program that can establish models for confined spaces and control boundary conditions and flow field data throughout the entire space. The geometric model is established using PHOENICS, and the standard κ-ε model is employed to simulate the flow field. The buoyancy effect generated by the flame is considered by incorporating the density difference based on the ideal gas law. Assumptions and simplifications are made on the physical model to simulate fire scenarios:
- (1)
- The airflow in the underground parking garage is a three-dimensional flow of incompressible viscous fluid.
- (2)
- The surrounding structure of the underground parking garage is insulated, and there are no heat sources other than the heat emitted by the car engine and passengers.
- (3)
- Impact of disturbances caused by people and vehicles on the airflow is neglected, as well as the influence of exhaust emission velocity.
- (4)
- The mass of pollution particles is neglected, and the emission rate of pollutants within the garage is assumed to be constant.
- (5)
- The atmospheric pollution concentration in the supply air of the garage is ignored, and the CO concentration is set to 0 mg/m3.
- (6)
- The temperature and velocity of the supply and exhaust air are assumed to be uniform.
- (7)
- A continuous pollutant emission outlet is used as a simplified model for the car exhaust pipe on the roadway, with a width of 0.2 m set for this linear volume source.
2.1.2. Mathematical Formulas of the Model
The partial differential equations within the CFD code can be used to calculate and control the CO levels and ventilation conditions present in any three-dimensional geometric building. For unsteady flow, the general form of the conservation equation (Equation (1)) can be expressed [12]:
where ρ represents density; ui represents velocity vector components; Γφ represents the effective exchange coefficient of φ; Sφ represents the source rate per unit volume.
The standard κ–ε model equations are given by Equations (2)–(8) [37]:
Continuity equation:
Momentum equation:
κ–ε equation:
where ūi represents the average velocity component in the i direction; ūj represents the average velocity component in the j direction; is the fluid pressure; δij is the Kronecker delta; υ is the kinematic viscosity; υt is the turbulent viscosity; Pκ is the volume production rate of under shear force; Cμ = 0.09.
Control equation for CO concentration:
where C represents the time-averaged concentration of CO; Dm is the molecular diffusion rate; Dt is the turbulent diffusion rate; S is the volumetric emission rate of pollutants; SCt is the turbulent Schmidt number.
2.2. Phoenics Model
2.2.1. Ventilation Model
The underground garage has two levels, and the ventilation provided by the vehicle entry and exit on the ground floor is not considered. Therefore, the simulation only considers the second-floor garage. The concentration of CO in the space is positively correlated with the frequency of vehicles entering and exiting the space [38]. Based on the characteristics of building usage, three time periods have a high flow of vehicles during peak hours, the morning peak (8:00–9:00), lunchtime peak (12:00–13:00), and evening peak (17:00–18:00), with entry and exit frequencies of 0.6, 1.2, and 1.8, respectively. The entry and exit frequency refers to the ratio of the number of vehicles entering and exiting the garage per hour to the number of parking spaces.
The division of the second-floor grid for the underground garage is shown in Figure 1 and Figure 2. Simplifications were made to the geometric model to reduce the simulation time. A grid independence analysis shows the grid number for partitions one to three is set as 3,954,846 (221 × 191 × 102), and for partitions four to six, it is set as 2,629,662 (203 × 177 × 102).
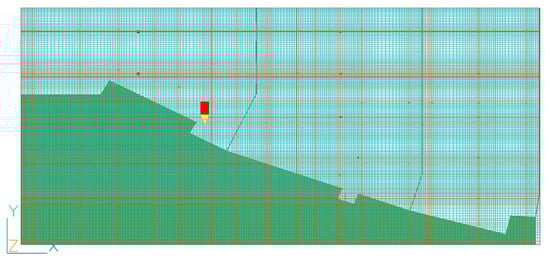
Figure 1.
Grid distribution (partitions one, two, and three) in the PHOENICS software.
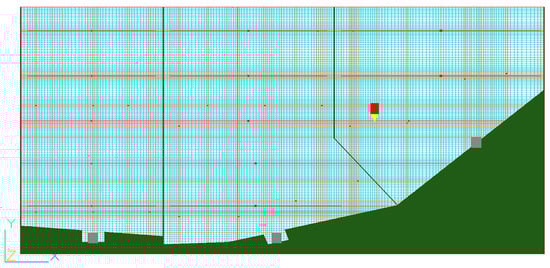
Figure 2.
Grid distribution (partitions four, five, and six) in the PHOENICS software.
Considering the symmetry in the geometric model, section areas, ventilation positions, and parking spaces, as well as the minimization of errors, reduction in grid quantity, and simplification of calculations by not considering the area near the garage entrance, partitions one to three and partitions four to six are established as two separate models. A full-scale model of the symmetrical position is shown in Figure 3.
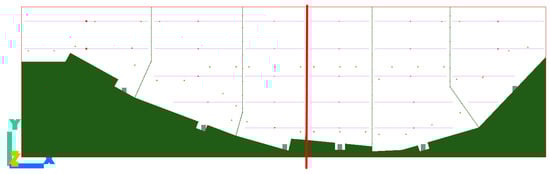
Figure 3.
Full-scale model of symmetrical position.
2.2.2. Fire Model
In the event of a fire, the fireproof rolling shutter door will descend to block the spread of heat and smoke. Considering the existing ventilation geometry partition, six different fireproof partitions are established. Taking into account the presence of vehicles near the ignition point, the ignition points are set for each partition as shown in Figure 4.
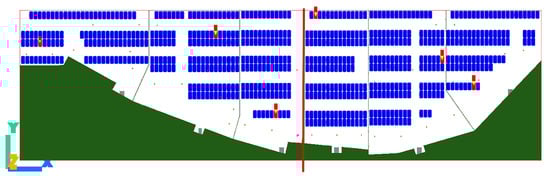
Figure 4.
Geometry of each partition.
2.3. Boundary Conditions
2.3.1. Ventilation Conditions
The total pollutants emitted by vehicles entering and exiting the garage at a fixed frequency within one hour can be calculated using Equation (11):
where α represents the frequency of vehicles entering and exiting the garage; N is the total number of parking spaces for vehicles exiting the garage; q is the emission rate of CO per unit time for a single vehicle; tcar is the running time of vehicles inside the garage.
The rate of pollutants emitted by all vehicles in the garage per unit time is:
where h represents 1 h, which is equal to 3600 s.
Taking the vehicle entry and exit frequency of 1.8 as an example, the CO emissions from vehicles entering and exiting the garage within one hour with a frequency of 1.8 can be calculated:
The rate of pollutant emissions from all vehicles in the garage per unit of time is:
The above statement suggests that the concentration of CO emitted by vehicles is closely related to the frequency of vehicles entering and exiting the garage, the duration of their stay inside the garage, and the number of vehicles. In addition, the concentration of CO emitted by automobiles is influenced by factors such as the quality of the fuel, combustion efficiency, type of engine, and emission control system [39,40].
Different countries have varying standards for limiting CO emissions from automobiles [41]. In order to mitigate the impact of vehicle emissions on the environment and improve air quality, China has implemented the sixth phase of measurement methods for automobile pollutants and emission limits [42,43]. Europe has enacted European regulations to restrict the release of pollutants from vehicles [44]. The United States Environmental Protection Agency has established separate emission standards for different types of engines [45]. The United Kingdom has adopted European regulations to control the emission of particulate matter within its own country. Japan’s Ministry of Land, Infrastructure, and Transport has replaced old emission standards with updated regulations [46]. Table 1 presents the concentration limits for CO emissions from automobiles in China, Europe, the United States, and Japan.

Table 1.
The restrictions on CO emissions from automobiles vary across different countries.
Assuming that the number of parking spaces in each of the six partitions is evenly distributed, the pollutants are located at a height of 0.2 m with an air supply width of 0.2 m, and the length is chosen according to the size of each partition’s garage area to more accurately replicate the concentration of CO, the entrance area of pollutants for each partition in the software is set based on the total emission of pollutants in that specific partition, and the emission of pollutants in each partition can be obtained.
The variable n is defined as the parking ratio for a particular partition, which is the ratio of the number of parking spaces in that partition to the total number of parking spaces across all partitions. GCO represents the total emission of pollutants in the partition; A represents the inlet area of pollutants in the partition in the software; να=1.8, να=1.2, and να=0.6 represent the pollutant inlet air velocity for entrance frequencies of 1.8, 1.2, and 0.6.
Table 2 presents the emission levels of pollutants in each partition, providing a visual depiction of the relationship between the number of parking spaces and the corresponding increase in total pollutant emissions in various partitions. As the frequency of vehicle traffic increases, the inflow wind speed of pollutants also increases. When α = 0.6, the inflow wind speeds of pollutants in all six partitions are low and relatively similar. However, when α = 1.2, the inflow wind speeds in the third and sixth partitions are lower than the average wind speed of the six partitions. When α = 1.8, the inflow wind speeds in the third and sixth partitions are significantly higher than in the other four partitions. Notably, the inflow areas of pollutants in the third and sixth partitions are inconsistent with reasonable standards.
Table 2.
The emission of CO pollutants in each partition at different frequencies.
Under normal ventilation conditions, ventilation in the garage should be induced no fewer than 6 times per hour [47]. Based on actual measurements, the second-floor underground garage has an area of approximately 21,000 m2 and a volume of approximately 85,000 m3. Calculations show that the total ventilation rate for the second-floor garage should be no less than 510,000 m3/h. According to the principle of equal distribution based on area, the airflow rate G for the fans in fire partitions one to five should be no less than 74,400 m3/h, 96,200 m3/h, 81,000 m3/h, 81,700 m3/h, 105,400 m3/h, and 71,000 m3/h, respectively. νin represents the fan supply air velocity, while νout represents the exhaust fan exhaust velocity. Table 3 shows the settings for the supply and exhaust air conditions in different partitions. After dividing the air distribution system into partitions based on the principle of equal area, the selection of supply and exhaust fans and determination of their sizes were made in accordance with the required air velocity at the diffusers specified by the code of acceptance for construction quality of ventilation and air conditioning works [47]. The dimensions of the supply and exhaust fans were determined, as shown in Table 3.
Table 3.
Fan setting of air supply and exhaust conditions in different partitions.
2.3.2. Fire Condition
The development process of the fire is described using the t2 model [48]:
where Qdilute represents the dilution rate; t represents time, the duration of a fire incident; β represents the fire growth coefficient. Based on the speed of fire development, fires are typically classified as very fast, fast, medium, or slow, with corresponding fire growth coefficients β of 187.6, 46.9, 11.7, and 2.9 W/s.
where Qmax represents the heat release power of the fire source, which is typically selected as 5.0 MW according to the national standard or British standard in the presence of sprinklers. In this study, a is taken as β, and b is taken as 2.
The simulation assumes that CO constitutes 100% of the smoke composition. The smoke release rate is described by Equation (15) [48].
where Z represents the height of the thermal plume diffusion; Q represents the flame heat release rate; ρ0, cρ, and T0 indicate the properties of the ambient air; g represents the acceleration due to gravity. During ignition, the flame height L and smoke height Zs are calculated using the flame heat release rate Q. However, when estimating other plume characteristics, the convective heat release rate Qc is often used. The diagram of the thermal plume of fire and smoke during ignition is shown in Figure 5.
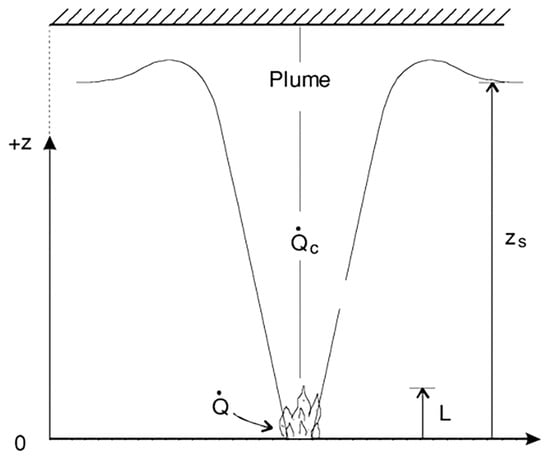
Figure 5.
Fire smoke heat plume.
The ventilation volume of the supply fan is set to be 50% of the ventilation volume of the exhaust fan [47]. The sizes of the supply air fans and exhaust fans in different partitions, as well as the corresponding air velocities at the air outlets, are presented in Table 4.
Table 4.
Size and outlet velocity of supply and exhaust fans in different partitions.
3. Results and Analysis
3.1. Ventilation Conditions
3.1.1. Simulation Results and Analysis of Ventilation Conditions
After the PHOENICS simulation, the CO concentration distribution and velocity distribution maps were obtained for different entrance and exit frequencies (0.6, 1.2, and 1.8) at heights of 1.5 m and 3.5 m. It was found that different entrance and exit frequencies correspond to different levels of CO concentrations in the garage, with CO concentration increasing as the entrance and exit frequency increases. For each doubling of α, the CO concentration in the garage increases by 0.5 to 1.0 times. Since the breathing height of adults is approximately 1.5 m, the research results for a height of 1.5 m are described in the article.
Figure 6 shows the CO concentration distribution and velocity distribution maps at a height of 1.5 m for partitions one to three, with an entrance and exit frequency of 0.6. Figure 6a reveals that the maximum CO concentration in partition three does not exceed 10 ppm. The CO distribution is relatively uniform in all three partitions, with overall low levels of CO concentration. The only areas where CO peaks are observed are at the entrance of the second-level garage and the region directly facing the supply fan outlet. Figure 6b shows that under the combined effect of the supply fan and induced draft fan, the diffusion of CO exhibits rapid changes in multiple local areas in the horizontal direction. This leads to higher CO concentrations in local areas compared to the surrounding regions, with a gradual decrease in CO concentration along the positive Y-axis. In other words, the CO concentration is higher at the outlet of the supply fan and lower at the inlet of the exhaust fan.
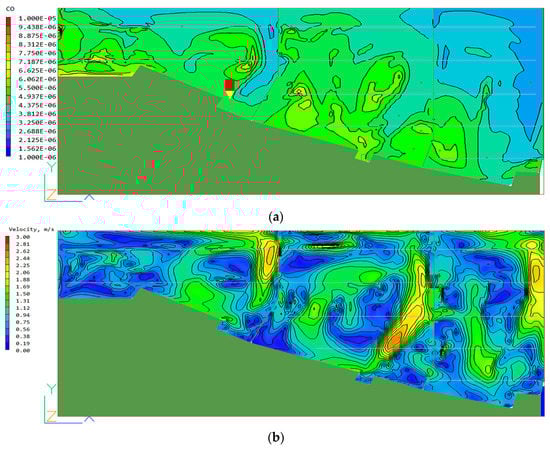
Figure 6.
CO concentration distribution and velocity distribution of partition one, two and three at α = 0.6. (a) CO concentration distribution, (b) CO velocity distribution.
Figure 7 shows the CO concentration distribution and velocity distribution maps at a height of 1.5 m for partitions one to three, with an entrance and exit frequency of 1.2. In Figure 7a, the CO concentration distribution is shown for partitions one to three when α = 1.2. The results indicate a slight increase in CO concentration compared to at α = 0.6, with most areas having concentrations of 9 ppm, 10 ppm, and 11 ppm. In the third partition, some areas have concentrations lower than 5 ppm, while the first and second partitions have multiple local areas with CO concentrations reaching 18 ppm. Figure 7b shows that the diffusion speed of CO in the area facing the supply fan has increased more rapidly compared to at α = 0.6. The supply fan plays a major role in causing uneven CO distribution, while the jet fan has a lesser impact.
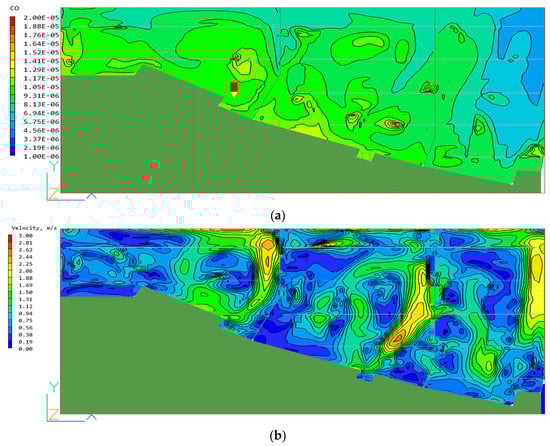
Figure 7.
CO concentration distribution and velocity distribution of partitions one, two, and three at α = 1.2. (a) CO concentration distribution, (b) CO velocity distribution.
Figure 8 shows the CO concentration distribution and velocity distribution maps at a height of 1.5 m for partitions one to three, with an entrance and exit frequency of 1.8. In Figure 8a, it can be observed that the CO distribution at α = 1.8 is more uneven compared to at α = 0.6 and α = 1.2. Multiple local areas in the first partition have CO concentrations exceeding 28 ppm, while the second partition has several areas with CO concentrations reaching 35 ppm. The CO distribution in the third partition is relatively uniform, with lower CO concentrations compared to the first and second partitions. However, there are also localized areas with CO concentrations exceeding 25 ppm. In Figure 8b, it is shown that the CO concentration changes rapidly in the region influenced by the supply fan. However, most areas fall within the control range of the jet fan, resulting in very slow changes in CO concentration. This leads to the high CO concentrations observed in multiple localized areas depicted in Figure 8a, indicating an improper arrangement of the jet fans.
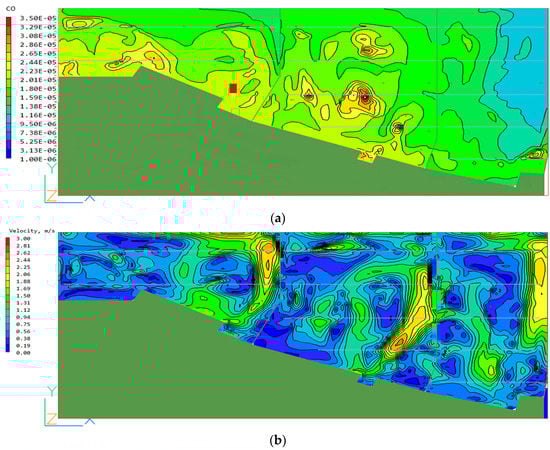
Figure 8.
CO concentration distribution and velocity distribution of partition one, two and three at α = 1.8. (a) CO concentration distribution, (b) CO velocity distribution.
Figure 9 shows the CO concentration distribution and velocity distribution maps at a height of 1.5 m for the partition four to six, with an entrance and exit frequency of 0.6. In Figure 9a, it can be observed that the CO distribution in all three partitions is uniform, with relatively lower concentration levels. The overall CO concentration decreases along the positive Y-axis, and there are localized areas with higher CO concentrations, but they do not exceed 15 ppm. In Figure 9b, it is shown that the CO concentration changes rapidly in the region influenced by the supply fan. The supply fan in partitions four and five shows a CO concentration variation speed of up to 3 m/s within the supply fan area. The effect of CO discharge from the supply fan is significant.
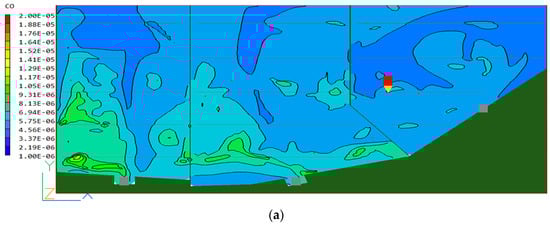
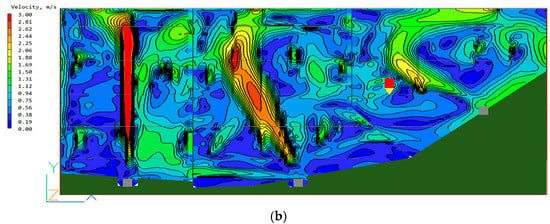
Figure 9.
CO concentration distribution and velocity distribution of partition four, five and six at α = 0.6. (a) CO concentration distribution, (b) CO velocity distribution.
Figure 10 shows the CO concentration distribution and velocity distribution maps at a height of 1.5 m for partitions four to six, with an entrance and exit frequency of 1.2. In Figure 10a, it is shown that at α = 1.2, the CO distribution is uneven compared to at α = 0.6, and the overall CO concentration level has increased to some extent. In the fourth partition, there is a significant CO concentration gradient in the area directly facing the supply fan, with the CO concentration in the lower-left region noticeably higher than its surroundings, reaching 22 ppm. In the fifth partition, there is a peak CO concentration in the lower-left small area, also reaching 22 ppm. Combined with Figure 10b, it can be determined that this could be due to an improper arrangement of the jet fans in that specific area.
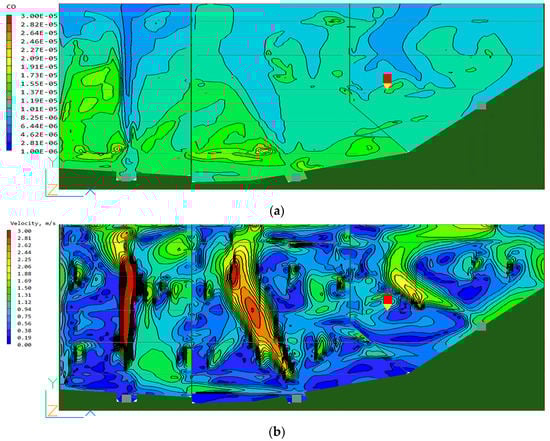
Figure 10.
CO concentration distribution and velocity distribution of partitions four, five, and six at α = 1.2. (a) CO concentration distribution, (b) CO velocity distribution.
Figure 11 shows the CO concentration distribution and velocity distribution maps at a height of 1.5 m for partitions four to six, with an entrance and exit frequency of 1.8. In Figure 11a, it can be observed that the CO distribution in the region is uneven, with significant CO concentration gradients in multiple areas. Moreover, there are several small areas with CO concentrations exceeding 37 ppm, and in specific localized areas in the fourth and fifth partitions, the CO concentration reaches 45 ppm. According to the results shown in Figure 11b, the areas with excessively high CO concentrations fall within the control range of the jet fans, where the CO concentration changes slowly. This indicates that the arrangement of the jet fans in these areas is not appropriate.
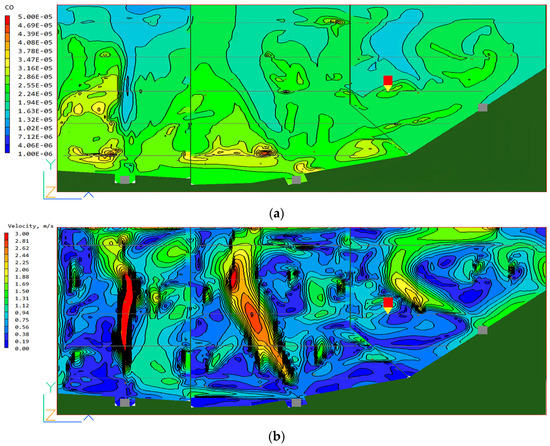
Figure 11.
CO concentration distribution and velocity distribution of partitions four, five, and six at α = 1.8. (a) CO concentration distribution, (b) CO velocity distribution.
The above analysis indicates that there are significant deficiencies in the existing induced ventilation system. The arrangement of supply and jet fans is unreasonable, resulting in an uneven distribution of CO in the area. When the average CO concentration level is high within the area, local small areas may exceed the specified requirements.
Taking the second partition as an example, when the frequency of inflow and outflow is 0.6, the CO concentration within the partition is low and distributed evenly. However, as the frequency increases, issues with the arrangement of supply fans become apparent. Multiple local small areas within the partition exhibit significantly higher CO concentrations than the surrounding areas. The velocity distribution cloud map at α = 1.2 shows that the supply fan rapidly diffuses CO directly into the area, preventing the timely dispersal of CO at the boundary of the airflow, resulting in multiple areas of CO accumulation and excessively high CO levels within the region. This phenomenon is more pronounced at α = 1.8.
Taking the fifth partition as another example, when the frequency of inflow and outflow does not exceed 1.2, the CO distribution within the partition is uniform and the concentration level is low. However, when the frequency reaches 1.2, CO accumulation starts to occur within the area. The velocity distribution cloud map at α = 1.2 and α = 1.8 reveals that the diffusion velocity gradient is high in the airflow region supplied by the fan. However, the concentration of CO remains stable inside and at the boundaries of the airflow, without any CO accumulation phenomena. In the lower-left corner of the partition, where the diffusion velocity of CO is very low, severe CO accumulation occurs. This area corresponds to the control partition of the jet fan, indicating an inappropriate arrangement of the jet fan.
Based on the analysis above, the existing ventilation design standards (with an air exchange rate of 6 times per hour) generally meet the following requirement: when the frequency is not greater than 1.2 and the contact time is short, the CO concentrations in most of the garage areas are less than 30 mg/m3. However, there are still high localized CO concentrations when the frequency is 1.8. The next step would be to optimize the design in terms of the angle of the air supply outlets, the arrangement of supply and exhaust fans, and other aspects.
3.1.2. Optimization of the Ventilation Plan
In the first partition, fans 6 and 7 are positioned too close to the air supply outlets. It is recommended these two fans be relocated away from the air supply area, as shown in Figure 12. For the optimization strategy in partition one, fan 7 should be moved 16 m to the left along the negative X-axis and 5 m upwards along the positive Y-axis, while maintaining a 45-degree angle with the positive Y-axis. Fan 6 should be moved 3 m to the left along the negative X-axis and 3.5 m upwards along the positive Y-axis, while maintaining its original angle. After optimization, the CO concentration at a height of 1.5 m with a frequency of 1.8 does not exceed 28 ppm, effectively improving the situation where certain localized areas exceeded 30 ppm before optimization.
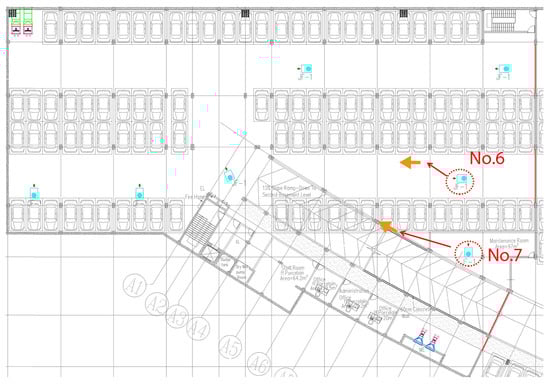
Figure 12.
Optimized strategy for partition one.
In the second partition, there are small localized areas in front of fan 6 where the CO concentration exceeds 30 ppm. As shown in Figure 13, the optimization strategy for partition two and partition three is as follows: fan 6 should be moved 30 m to the left along the negative X-axis and 38 m upwards along the positive Y-axis, while maintaining a 45-degree angle with the positive Y-axis; fan 8 should be moved 21 m to the left along the negative X-axis and 4.5 m upwards along the positive Y-axis, while maintaining its original angle. After optimization, at a height of 1.5 m with a frequency of 1.8, the CO concentration in partition two does not exceed 26 ppm, effectively improving the localized areas that exceeded 30 ppm before optimization, and the distribution of CO is more uniform, significantly improving the concentration distribution in partition two.
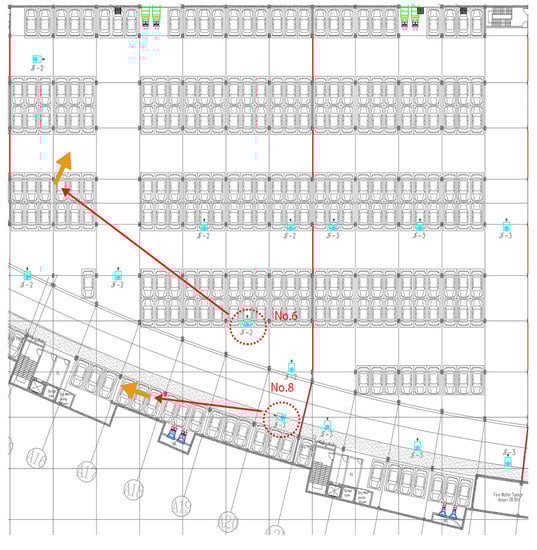
Figure 13.
Optimized strategy for partitions two and three.
For the fourth and fifth partitions, increasing the number of induced fans and changing their arrangement multiple times have not effectively improved the situation of localized areas with CO concentrations exceeding 37 ppm. After careful inspection, the arrangement of fans in partition four and partition five is reasonable. The high concentration of pollutants in these areas is mainly due to the presence of a large number of vehicles. Table 5 shows a comparison of the ventilation rates and CO emissions, while Table 6 shows the capacities of supply fans and exhaust fans in partitions three, four, and five. The results indicate that, compared to partition three, the parking area in partition four is approximately the same, but the number of parked vehicles has increased from 99 to 127. This has resulted in a decrease in the number of parking spaces per unit area and the amount of fresh air supply per unit area. Under simulation conditions, the emission of pollutants is directly proportional to the number of parked vehicles, leading to higher pollutant concentration levels. This implies that the emission of pollutants is determined by the number of parked vehicles, while the ventilation rate is influenced by the building’s parking area (ventilation rate).
Table 5.
Comparison of air change rate and CO emission for every partition.
Table 6.
Capacity volume of supplied fan and exhaust fan in partitions three, four, and five.
To address this, it is suggested the ventilation be increased in partition four or fans with a higher airflow capacity be purchased for these partitions. As for the current optimization solution for partition four, a new simulation setup as shown in Figure 14 is proposed. Fan 5 should be moved 10 m upwards along the Y-axis, increasing the ventilation frequency from 6 to 7 times, while maintaining a 15-degree angle with the positive Y-axis. After optimization, the maximum CO concentration at a height of 1.5 m with a frequency of 1.8 in partition four is lower than 37 ppm, reducing it by approximately 20% compared to the localized areas exceeding 45 ppm before optimization.
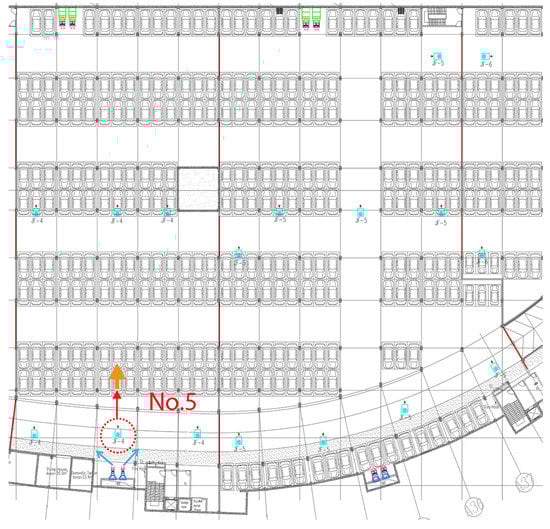
Figure 14.
Optimized strategy for partitions four and five.
For the sixth partition, the enclosed corner area in the actual drawing is too close. The position and angle of fan 4 have been appropriately improved: it should be moved 9 m upwards along the positive Y-axis and maintained at a 30-degree angle with the positive Y-axis. The effect is shown in Figure 15. Before optimization, the average CO concentration exceeded 25 ppm. After optimization, the average CO concentration is below 22 ppm, indicating a significant improvement in the CO concentration in partition six.
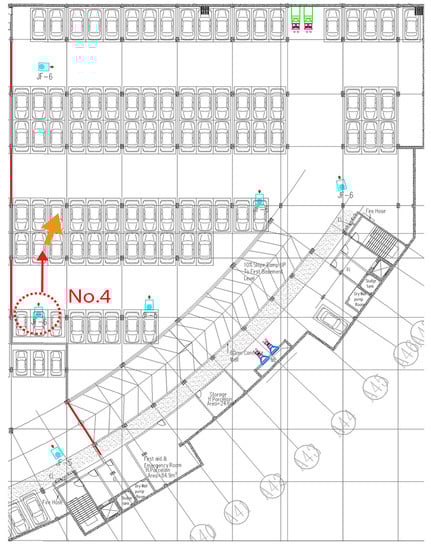
Figure 15.
Optimized strategy for partition six.
Apart from optimizing individual partitions, it is shown in Figure 8 and Figure 11 that the placement of some jet fans is not reasonable. Figure 16 demonstrates that the intake side of certain induced draft fans is too close to the wall. The article suggests maintaining a distance of at least 3 m from the adjacent walls.
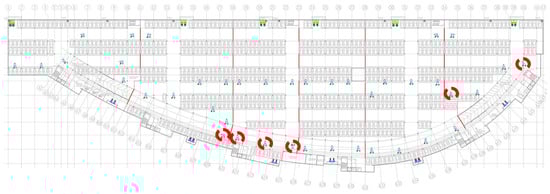
Figure 16.
Induced fan locations for different partitions.
The optimization results are shown in Figure 17. The overall optimization results, with α = 1.8 at a distance of 1.5 m, indicate that the CO concentration in partitions one to three is controlled below 30 ppm, significantly improving the pollution concentration level. In partition four to six, the maximum CO concentration does not exceed 37 ppm, resulting in a reduction of approximately 20% in the pollution concentration level.
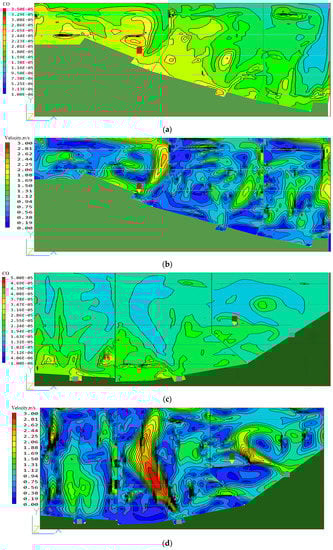
Figure 17.
Ventilation scheme optimization results: (a) partitions one, two, and three, CO concentration distribution; (b) partitions one, two, and three, velocity contour; (c) partitions four, five, and six, CO concentration distribution; (d) partitions four, five and six, velocity contour.
3.2. Fire Scenario
Figure 18 displays the variation in temperature of the ceiling near different ignition points. Preliminary simulation results indicate that under mechanical ventilation conditions within 400 s, the thermal plume near the ignition area rises significantly, but the surface temperature of the ceiling near the ignition point is controlled at a lower temperature below 500 °C.
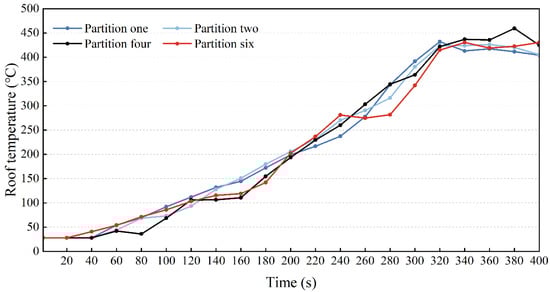
Figure 18.
Ceiling surface temperature variations in different partitions.
We compare the results for the changes in CO concentration over time within 180 s and analyze whether the CO concentration is less than 2000 ppm. Figure 19 displays the distribution of CO concentration at a height of 1.5 m in each partition within 180 s. The results indicate the following: After ignition, the CO concentration near the ignition point increases sharply, and the fire smoke quickly accumulates at the inlet of the exhaust fan due to the induced airflow generated by the induced fan. In the fourth partition, where the ignition point is close to the inlet of the exhaust fan, only a very small area at the inlet of the exhaust fan reaches a CO concentration of 2000 ppm. The smoke can be promptly exhausted, preventing large-scale diffusion in the space. In the fifth partition, where the ignition point is near the outlet of the induced fan, the induced airflow intensifies the spread of fire smoke, leading to an increase in smoke concentration. The concentration exceeds 2000 ppm within a large area, while the CO concentration at the inlet of the exhaust fan does not exceed 1500 ppm. In the sixth partition, where the ignition point is near the inlet of the fan, the CO concentration in the unobstructed area before the fan outlet is below 1000 ppm, while it exceeds 2000 ppm near obstacles (walls), and the CO concentration at the inlet of the exhaust fan is below 1750 ppm. The existing exhaust ventilation system provides effective fire protection, significantly protecting the evacuation of pedestrians in the parking garage during a fire. In most fire scenarios, it can be ensured that the CO concentration does not exceed 2000 ppm within three minutes.
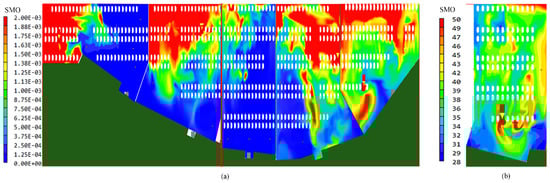
Figure 19.
CO concentration distribution at a height of 1.5 m within 180 s. (a) Distribution of CO concentrations in partitions one, two, four, five, and six, (b) Distribution of CO concentrations in partition three.
Figure 20 shows the temperature distribution at a height of 1.5 m in six different partitions within 180 s. Within this time frame, the temperature in the room increases slowly. The temperature does not exceed 40 °C in any partition except for partition one, where the exhaust fan reaches 50 °C at the entrance. Additionally, the temperature distribution is uniform, which means that the smoke temperature will not cause significant harm to the occupants within the time limit for evacuation.
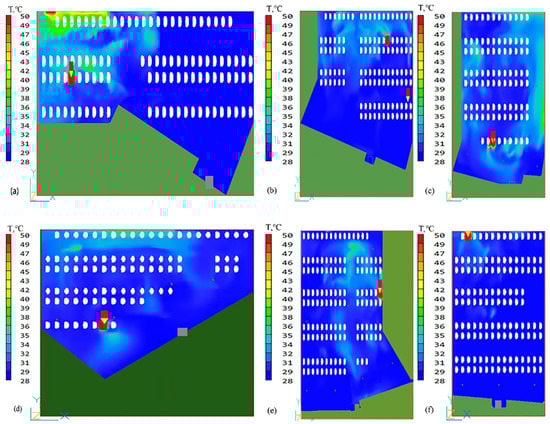
Figure 20.
Temperature distribution at 1.5 m height within 180 s in each partition, (a) temperature distribution in partition one, (b) temperature distribution in partition two, (c) temperature distribution in partition three, (d) temperature distribution in partition six, (e) temperature distribution in partition five, (f) temperature distribution in partition four.
4. Discussion
This article simplified, assumed, and numerically simulated the induced ventilation system on the second floor of an underground parking garage using PHOENICS. The simulation results have a sufficiently high level of accuracy, but there are still some limitations regarding the actual situation:
- (1)
- It was assumed that CO constitutes 100% of the smoke, but in reality, smoke also contains HC and NOx, which are highly detrimental to all human body systems [11,49]. The underground parking garage space is relatively enclosed, making it prone to occurrences of incomplete combustion during a fire. Under incomplete combustion conditions, materials can generate higher concentrations of particulate matter [50,51].
- (2)
- The second floor of the underground parking garage was selected and idealized as a sealed space, without considering natural ventilation. In general, garages have exits and entrances that are connected to the atmosphere, and the impact of natural ventilation caused by vehicle entry and exit on the garage’s ventilation system should not be ignored. Only a study on flat spaces in underground parking garages was conducted. The architectural structures of underground parking garages vary, and there are differences in their impact on the ventilation system [52,53].
- (3)
- In the event of a fire, the data analysis of the fifth and sixth partitions shows that the ignition point is located at the exit and entrance of the induced ventilation fan. The concentration of CO within the partitions increases rapidly. The toxic smoke generated during a fire is the main cause of 85% of fire-related fatalities [54,55]. Therefore, smoke control within the building is of the utmost importance. However, this simulation has not yet proposed any rationalized recommendations for addressing this phenomenon.
- (4)
- To prevent harm to individuals, it is recommended a combination fire suppression approach be used following a fire outbreak. In addition to utilizing smoke exhaust and ventilation systems, smoke barriers, sprinklers, smoke exhaust, and handheld fire extinguishers should all be considered. This will help reduce the power of the ignition source and the spread of smoke, thereby minimizing the impact on people in the vicinity. If this is the only option for survival, residents should promptly evacuate the fire-affected area.
- (5)
- It is important to recognize that validation of numerical simulations under field conditions is desirable whenever possible. However, in this specific study, restricted access to the physical site and limited availability of field data prevented direct validation. Additionally, the aim of this study was to provide a supplementary and optimized analysis based on existing engineering cases, rather than conducting field validation. To address this limitation, we plan to design specific experimental protocols in future studies to validate the numerical simulations. By combining experimental validation with numerical simulations, we can strengthen the accuracy of the results and further contribute to the field of fire and ventilation analysis.
- (6)
- Lastly, it should be noted that this study focused solely on the utilization of the PHOENICS software. In comparison to other software, such as Ansys Fluent or Fire Dynamics Simulator (FDS), there are notable differences and potential limitations. For instance, Ansys Fluent and FDS are well known for their specialized fire modeling capabilities, which encompass advanced combustion models, radiation heat transfer, soot formation, and fire spread simulations. In contrast, PHOENICS may offer more limited built-in fire modeling features, which may make it less suitable for detailed fire simulations. Nevertheless, PHOENICS can still provide valuable functionality for specific fire and ventilation scenarios, particularly if its strengths align with the specific engineering simulation requirements or if engineers have prior experience and expertise with the software.
5. Conclusions
Based on existing induced ventilation systems in underground parking garages, in this study we utilized the PHOENICS fluid calculation software to establish a geometric model and conducted numerical simulations for both ventilation and fire conditions. This significantly improved the convenience and accuracy of the numerical calculations. Through the research on these two scenarios, the following conclusions were drawn:
- (1)
- The concentration of pollutants in the garage is related to the frequency of vehicle entry and exit. The higher the frequency of entry and exit, the higher the concentration of pollutants in the garage. With each doubling of the entry and exit frequency, the CO concentration in the garage increases by approximately 0.5 to 1.0 times.
- (2)
- The induced ventilation fans effectively induce airflow within the space, and by properly arranging the angles and positions of the induced fans, the concentration and distribution of pollutants can be significantly improved. The CO concentration in partitions one to three can be controlled below 30 ppm, and the maximum CO concentration in partitions four to six does not exceed 37 ppm.
- (3)
- Within the evacuation time limit, the maximum smoke temperature does not exceed 50 °C, and the smoke temperature has little impact on personnel evacuation.
- (4)
- In the induced ventilation system, after a fire outbreak, within the evacuation time limit, only small localized areas reach a CO concentration of 2000 ppm, which is sufficient for personnel evacuation. The existing ventilation and exhaust systems provide effective fire protection.
The focus of the study is solely on numerical simulations of underground parking garages involving conventional fuel vehicles, without including simulations for new energy vehicles. However, in the current stage, new energy vehicles are widely utilized, and they can be categorized into electric battery vehicles and fuel cell vehicles. Neither type of vehicle emits carbon monoxide, but there is still a potential risk of releasing a significant amount of air pollutants in the event of battery explosions or fires. Therefore, conducting numerical simulations of fire scenarios in underground parking garages specifically for new energy vehicles should be prioritized in future research efforts.
Author Contributions
Conceptualization, Z.W., X.Z. (Xue Zhou) and J.L.; methodology, X.Z. (Xue Zhou), X.Z. (Xiangyuan Zhu) and J.L.; formal analysis, Z.W., X.Z. (Xue Zhou) and J.L.; investigation, Z.W., X.Z. (Xue Zhou) and J.L.; writing—original draft preparation, Z.W., X.Z. (Xue Zhou), X.Z. (Xiangyuan Zhu) and J.L.; writing—review and editing, Z.W., X.Z. (Xue Zhou), X.Z. (Xiangyuan Zhu) and J.L.; supervision, J.L.; project administration, J.L.; funding acquisition, J.L. All authors have read and agreed to the published version of the manuscript.
Funding
This work was funded by Natural Science Foundation of Shandong Province (ZR2021ME199, ZR2020ME211 and ZR2021ME237) and the Support Plan for Outstanding Youth Innovation Team in Colleges and Universities of Shandong Province (2019KJG005).
Data Availability Statement
Not applicable.
Acknowledgments
This work acknowledges the support of the Plan of Introduction and Cultivation for Young Innovative Talents in Colleges and Universities of Shandong Province.
Conflicts of Interest
The authors declare no conflict of interest.
Nomenclature
| A | the inlet area of pollutants in the partition in the software, m2 |
| C | the time-averaged concentration of CO |
| Dm | the molecular diffusion rate |
| Dt | the turbulent diffusion rate |
| g | the acceleration due to gravity |
| G | the airflow rate, m3/h |
| GCO | the total emission of pollutants in the partition, g/s |
| Gα | the total pollutants emitted by vehicles entering and exiting the garage at a fixed frequency within one hour |
| h | time, 1 h |
| L | the flame height |
| n | the parking space ratio |
| N | the total number of parking spaces for vehicles exiting the garage |
| the fluid pressure, Pa | |
| Pκ | under shear force |
| q | the emission rate of CO per unit time for a single vehicle |
| Q | the flame heat release rate |
| Qdilute | the dilution rate |
| Qc | the convective heat release rate |
| Qmax | the heat release power of the fire source |
| S | the volumetric emission rate of pollutants |
| SCt | the turbulent Schmidt number |
| Sφ | the source rate per unit volume |
| t | time, the duration of a fire incident |
| tcar | the running time of vehicles inside the garage, s |
| ui | velocity vector components, m/s |
| ūi | the average velocity component in the i direction, m/s |
| ūj | the average velocity component in the j direction, m/s |
| νin | the fan supply air velocity, m/s |
| νout | the exhaust fan exhaust velocity, m/s |
| να=0.6 | the pollutant inlet air velocity for an entrance frequency of 0.6, m/s |
| να=1.2 | the pollutant inlet air velocity for an entrance frequency of 1.2, m/s |
| να=1.8 | the pollutant inlet air velocity for an entrance frequency of 1.8, m/s |
| Z | the height of the thermal plume diffusion, m |
| Zs | the smoke height |
| Abbreviation | |
| CFD | Computational Fluid Dynamics |
| CO | carbon monoxide |
| HC | hydrocarbons |
| NOx | nitrogen oxides |
| Greek Symbols | |
| α | the frequency of vehicles entering and exiting the garage |
| β | the fire growth coefficient |
| δij | the Kronecker delta |
| ε | turbulent dissipation rate |
| υ | the kinematic viscosity, m2/s |
| υt | the turbulent viscosity |
| ρ | density, kg/m3 |
| Γφ | the effective exchange coefficient of φ |
| Subscripts | |
| i | the direction i |
| j | the direction j |
| t | the turbulent |
| in | the direction of entering |
| out | the direction of exiting |
| α = 1.8 | the frequency of entry and exit is 1.8 |
| α = 1.2 | the frequency of entry and exit is 1.2 |
| α = 0.6 | the frequency of entry and exit is 0.6 |
References
- Samet, J.M. Traffic, air pollution, and health. Inhal. Toxicol. 2007, 19, 1021–1027. [Google Scholar] [CrossRef] [PubMed]
- Scheiner, J.; Faust, N.; Helmer, J.; Straub, M.; Holz-Rau, C. What’s that garage for? Private parking and on-street parking in a high-density urban residential neighbourhood. J. Transp. Geogr. 2020, 85, 102714. [Google Scholar] [CrossRef]
- Ding, C.; Wang, D.; Liu, C.; Zhang, Y.; Yang, J. Exploring the influence of built environment on travel mode choice considering the mediating effects of car ownership and travel distance. Transp. Res. Part A Policy Pract. 2017, 100, 65–80. [Google Scholar] [CrossRef]
- Mccahill, C.; Garrick, N. Parking Supply and Urban Impacts. In Parking Issues and Policies; Ison, S., Mulley, C., Eds.; Emerald Publishing Limited: Bradford, UK, 2014; Volume 5, pp. 33–55. [Google Scholar]
- Chester, M.; Fraser, A.; Matute, J.; Flower, C.; Pendyala, R. Parking Infrastructure: A Constraint on or Opportunity for Urban Redevelopment? J. Am. Plan. Assoc. 2015, 81, 268–286. [Google Scholar] [CrossRef]
- Glorennec, P.; Bonvallot, N.; Mandin, C.; Goupil, G.; Pernelet-Joly, V.; Millet, M.; Filleul, L.; Le Moullec, Y.; Alary, R. Is a quantitative risk assessment of air quality in underground parking garages possible? Indoor Air 2008, 18, 283–292. [Google Scholar] [CrossRef]
- Wen, Y.; Lau, S.-K.; Leng, J.; Zhou, K.; Cao, S.-J. Passive ventilation for sustainable underground environments from traditional underground buildings and modern multiscale spaces. Tunn. Undergr. Space Technol. 2023, 134, 105002. [Google Scholar] [CrossRef]
- An, F.; Liu, J.; Lu, W.; Jareemit, D. Comparison of exposure to traffic-related pollutants on different commuting routes to a primary school in Jinan, China. Environ. Sci. Pollut. Res. 2022, 29, 43319–43340. [Google Scholar] [CrossRef]
- Liu, J.; Cai, W.; Zhu, S.; Dai, F. Impacts of vehicle emission from a major road on spatiotemporal variations of neighborhood particulate pollution—A case study in a university campus. Sustain. Cities Soc. 2020, 53, 101917. [Google Scholar] [CrossRef]
- An, F.; Liu, J.; Lu, W.; Jareemit, D. A review of the effect of traffic-related air pollution around schools on student health and its mitigation. J. Transp. Health 2021, 23, 101249. [Google Scholar] [CrossRef]
- Demir, A. Investigation of Air Quality in the Underground and Aboveground Multi-Storey Car Parks in Terms of Exhaust Emissions. Procedia Soc. Behav. Sci. 2015, 195, 2601–2611. [Google Scholar] [CrossRef][Green Version]
- Papakonstantinou, K.; Chaloulakou, A.; Duci, A.; Vlachakis, N.; Markatos, N. Air quality in an underground garage: Computational and experimental investigation of ventilation effectiveness. Energy Build. 2003, 35, 933–940. [Google Scholar] [CrossRef]
- Zhao, Y.; Wang, Y.; Zhu, K.; Zhao, J. Seasonal variations and exposure levels of carbon monoxide in a naturally ventilated residential underground parking lot. Sci. Technol. Built Environ. 2018, 24, 73–82. [Google Scholar] [CrossRef]
- Chan, M.Y.; Chow, W.K. Car park ventilation system: Performance evaluation. Build. Environ. 2004, 39, 635–643. [Google Scholar] [CrossRef]
- Chu, C.-R.; Su, Z.-Y. Natural ventilation design for underground parking garages. Build. Environ. 2023, 227, 109784. [Google Scholar] [CrossRef]
- Duci, A.; Papakonstantinou, K.; Chaloulakou, A.; Markatos, N. Numerical approach of carbon monoxide concentration dispersion in an enclosed garage. Build. Environ. 2004, 39, 1043–1048. [Google Scholar] [CrossRef]
- Chen, R.; Pan, G.; Zhang, Y.; Xu, Q.; Zeng, G.; Xu, X.; Chen, B.; Kan, H. Ambient carbon monoxide and daily mortality in three Chinese cities: The China Air Pollution and Health Effects Study (CAPES). Sci. Total Environ. 2011, 409, 4923–4928. [Google Scholar] [CrossRef]
- Hachem, M.; Saleh, N.; Bensefa-Colas, L.; Momas, I. Determinants of ultrafine particles, black carbon, nitrogen dioxide, and carbon monoxide concentrations inside vehicles in the Paris area: PUF-TAXI study. Indoor Air 2021, 31, 848–859. [Google Scholar] [CrossRef]
- Manisalidis, I.; Stavropoulou, E.; Stavropoulos, A.; Bezirtzoglou, E. Environmental and Health Impacts of Air Pollution: A Review. Front. Public Health 2020, 8, 14. [Google Scholar] [CrossRef]
- Gil-Lopez, T.; Sanchez-Sanchez, A.; Gimenez-Molina, C. Energy, environmental and economic analysis of the ventilation system of enclosed parking garages: Discrepancies with the current regulations. Appl. Energy 2014, 113, 622–630. [Google Scholar] [CrossRef]
- Liu, J.; Zhu, S.; Kim, M.K.; Srebric, J. A Review of CFD Analysis Methods for Personalized Ventilation (PV) in Indoor Built Environments. Sustainability 2019, 11, 4166. [Google Scholar] [CrossRef]
- Tung, P.-W.; Chung, H.-C.; Kawabata, N.; Seike, M.; Hasegawa, M.; Chien, S.W.; Shen, T.S. Numerical Study of Smoke Distribution in Inclined Tunnel Fire Ventilation Modes Considering Traffic Conditions. Buildings 2023, 13, 714. [Google Scholar] [CrossRef]
- Chow, W.K. On ventilation design for underground car parks. Tunn. Undergr. Space Technol. 1995, 10, 225–245. [Google Scholar] [CrossRef]
- Sarvestani, A.N.; Oreste, P.; Gennaro, S. Fire Scenarios Inside a Room-and-Pillar Underground Quarry Using Numerical Modeling to Define Emergency Plans. Appl. Sci. 2023, 13, 4607. [Google Scholar] [CrossRef]
- Xu, T.; Zhao, D.; Tao, H.; Lei, P. Extended CFD models for numerical simulation of tunnel fire under natural ventilation: Comparative analysis and experimental verification. Case Stud. Therm. Eng. 2022, 31, 101815. [Google Scholar] [CrossRef]
- Ren, L.; An, F.; Su, M.; Liu, J. Exposure Assessment of Traffic-Related Air Pollution Based on CFD and BP Neural Network and Artificial Intelligence Prediction of Optimal Route in an Urban Area. Buildings 2022, 12, 1227. [Google Scholar] [CrossRef]
- Sarvestani, A.N.; Oreste, P. Effects of the Ventilation System by Using Jet Fans during a Fire in Road Tunnels. Appl. Sci. 2023, 13, 5618. [Google Scholar] [CrossRef]
- Tsui, K.C.; Li, Y.G. Ventilation Effectiveness of Building Cluster. Ashrae Trans. 2012, 118 Pt 1, 558–566. [Google Scholar]
- Papakonstantinou, K.A.; Kiranoudis, C.T.; Markatos, N.C. Numerical Simulation of Volatile Organic Compounds Evaporation in Closed Spaces. Dry. Technol. 2000, 18, 2203–2216. [Google Scholar] [CrossRef]
- Nazari, A.; Jafari, M.; Rezaei, N.; Taghizadeh-Hesary, F. Jet fans in the underground car parking areas and virus transmission. Phys. Fluids 2021, 33, 013603. [Google Scholar] [CrossRef]
- Viegas, J.C. The Use of Impulse Ventilation to Control Pollution in Underground Car Parks. Int. J. Vent. 2011, 8, 57–74. [Google Scholar] [CrossRef]
- Sittisak, P.; Charinpanitkul, T.; Chalermsinsuwan, B. Enhancement of carbon monoxide removal in an underground car park using ventilation system with single and twin jet fans. Tunn. Undergr. Space Technol. 2020, 97, 103226. [Google Scholar] [CrossRef]
- Immonen, E. CFD optimization of jet fan ventilation in a car park by fractional factorial designs and response surface methodology. Build. Simul. 2016, 9, 53–61. [Google Scholar] [CrossRef]
- Debia, M.; Trachy-Bourget, M.-C.; Beaudry, C.; Neesham-Grenon, E.; Perron, S.; Lapointe, C. Characterization of indoor diesel exhaust emissions from the parking garage of a school. Environ. Sci. Pollut. Res. 2017, 24, 4655–4665. [Google Scholar] [CrossRef] [PubMed][Green Version]
- Ramponi, R.; Blocken, B. CFD simulation of cross-ventilation for a generic isolated building: Impact of computational parameters. Build. Environ. 2012, 53, 34–48. [Google Scholar] [CrossRef]
- Hu, Y.; Peng, Y.; Gao, Z.; Xu, F. Application of CFD plug-ins integrated into urban and building design platforms for performance simulations: A literature review. Front. Arch. Res. 2023, 12, 148–174. [Google Scholar] [CrossRef]
- Lin, Y.; Chen, G.; Chen, T.; Luo, Z.; Yuan, C.; Gao, P.; Hang, J. The influence of advertisement boards, street and source layouts on CO dispersion and building intake fraction in three-dimensional urban-like models. Build. Environ. 2019, 150, 297–321. [Google Scholar] [CrossRef]
- Zhang, L.; Yin, Y.; Huang, W.; Zhang, P. Determination Method of Ventilation Rate in Underground Parking Garages Based on Box Model of Overall Ventilation. Build. Energy Environ. 2004, 5, 1–4+29. (In Chinese) [Google Scholar]
- El-Fadel, M.; Abi-Esber, L. In-vehicle Exposure to Carbon Monoxide Emissions from Vehicular Exhaust: A Critical Review. Crit. Rev. Environ. Sci. Technol. 2009, 39, 585–621. [Google Scholar] [CrossRef]
- Flachsbart, P.G.; Howes, J.E.; Mack, G.A.; Rodes, C.E. Carbon Monoxide Exposures of Washington Commuters. JAPCA 1987, 37, 135–142. [Google Scholar] [CrossRef]
- Hagan, R.; Markey, E.; Clancy, J.; Keating, M.; Donnelly, A.; O’connor, D.J.; Morrison, L.; Mcgillicuddy, E.J. Non-Road Mobile Machinery Emissions and Regulations: A Review. Air 2023, 1, 14–36. [Google Scholar] [CrossRef]
- Ministry of Ecology and Environment of the People’s Republic of China. Limits and Measurement Methods for Emissions from Light-Duty Vehicles (CHINA 6). 2020. Available online: https://www.mee.gov.cn/ywgz/fgbz/bz/bzwb/dqhjbh/dqydywrwpfbz/201612/t20161223_369476.shtml (accessed on 2 August 2023).
- Ministry of Ecology and Environment of the People’s Republic of China. Limits and Measurement Methods for Emissions from Diesel Fuelled Heavy-Duty Vehicles (CHINA VI). 2019. Available online: https://www.mee.gov.cn/ywgz/fgbz/bz/bzwb/dqhjbh/dqydywrwpfbz/201807/t20180703_445995.shtml (accessed on 2 August 2023).
- European Environment Agency. 2019. Available online: https://www.eea.europa.eu/publications/emep-eea-guidebook-2019 (accessed on 2 August 2023).
- United States Environmental Protection Agency. United States Environmental Protection Agency. 2020. Available online: https://www.epa.gov/regulations-emissions-vehicles-and-engines/regulations-emissions-nonroad-vehicles-and-engines (accessed on 2 August 2023).
- Dieselnet.com. Emission Standards; Japan: Nonroad Diesel Engines. 2012. Available online: https://dieselnet.com/standards/jp/ld.php (accessed on 2 August 2023).
- Dieselnet.com. Emission Standards; China: Code of Acceptance for Construction Quality of Ventilation and Air Conditioning Works. 2017. Available online: http://www.csres.com/detail/291639.html (accessed on 2 August 2023).
- Karlsson, B.; Quintiere, J. Enclosure Fire Dynamics; CRC Press: Boca Raton, FL, USA, 2000. [Google Scholar]
- Ataei, S.M.; Aghayan, I.; Pouresmaeili, M.A.; Babaie, M.; Hadadi, F. The emission factor adjustments of the passenger cars in multi-story car parks under drive modes. Environ. Sci. Pollut. Res. Int. 2022, 29, 5105–5123. [Google Scholar] [CrossRef]
- Zhang, M.; Buekens, A.; Jiang, X.; Li, X. Dioxins and polyvinylchloride in combustion and fires. Waste Manag. Res. J. Int. Solid Wastes Public Clean. Assoc. ISWA 2015, 33, 630–643. [Google Scholar] [CrossRef] [PubMed]
- Shakya, P.R.; Shrestha, P.; Tamrakar, C.S.; Bhattarai, P.K. Studies on potential emission of hazardous gases due to uncontrolled open-air burning of waste vehicle tyres and their possible impacts on the environment. Atmos. Environ. 2008, 42, 6555–6559. [Google Scholar] [CrossRef]
- Steinberga, I.; Kleperis, J. Urban air pollution: Input from car parking places. WIT Trans. Built Environ. 2004, 75, 851–859. [Google Scholar]
- Höglund, P.G. Parking, energy consumption and air pollution. Sci. Total Environ. 2004, 334–335, 39–45. [Google Scholar] [CrossRef]
- Nguyen, T.D.; Bui, H.M. Computational fluid dynamic model for smoke control of building basement. Case Stud. Chem. Environ. Eng. 2023, 7, 100318. [Google Scholar] [CrossRef]
- Griffiths, S.D.; Entwistle, J.A.; Kelly, F.J.; Deary, M.E. Characterising the ground level concentrations of harmful organic and inorganic substances released during major industrial fires, and implications for human health. Environ. Int. 2022, 162, 107152. [Google Scholar] [CrossRef] [PubMed]
Disclaimer/Publisher’s Note: The statements, opinions and data contained in all publications are solely those of the individual author(s) and contributor(s) and not of MDPI and/or the editor(s). MDPI and/or the editor(s) disclaim responsibility for any injury to people or property resulting from any ideas, methods, instructions or products referred to in the content. |
© 2023 by the authors. Licensee MDPI, Basel, Switzerland. This article is an open access article distributed under the terms and conditions of the Creative Commons Attribution (CC BY) license (https://creativecommons.org/licenses/by/4.0/).