Abstract
Concrete columns in service are exposed to threats such as accidental impacts and explosions, which pose potential risks to the safety of buildings. Although fully lightweight concrete elements prepared from non-sintered fly ash ceramic pellets and pottery sand are widely used in engineering practice, the dynamic response of such elements under impact loading is not supported by adequate research data. Therefore, in this study, the dynamic response of all-lightweight concrete columns under impact loading with different axial compression ratios (0.1, 0.2, and 0.3) was investigated by means of drop hammer impact tests, and the potential of shear wave steel fibers in mitigating structural damage and preventing structural failure was investigated. The results of the study reveal that the specimens primarily exhibit shear and bending damage under impact loading. With an axial compression ratio of 0.1, the specimen is dominated by bending damage. As the axial compression ratio increases from 0.1 to 0.3, the specimen’s damage mode transitions to shear damage dominance. This change results in a larger impact force and displacement response while experiencing lower displacement acceleration. Additionally, the introduction of steel fibers improves the strength and stiffness of the specimens, shifting their behavior from shear to bending damage. Consequently, this reduces impact damage, mid-span displacement, and displacement acceleration while enhancing the specimen’s response to the impact force and its capacity for deformation energy dissipation.
1. Introduction
Concrete columns bearing horizontal and vertical loads are important vertical members of the building structure and may be subject to high strain rate loads during their service period, such as vehicle collisions or gas explosions, thus threatening their load-carrying capacity and durability, and may even trigger the progressive collapse of the building due to member failure [1,2,3]. Therefore, the design and selection of columns need to consider impact resistance to ensure the long-term safe operation of buildings.
The impact resistance of concrete columns has been studied in many tests and papers. Sheng Xiang et al. [4] found a positive correlation between the drop height and peak impact force, peak mid-span displacement, and residual deformation through drop hammer tests on seven axially loaded SRC columns. In addition, a relatively high axial compression ratio increases the stiffness of SRC columns, thus reducing the deflection deformation of the columns under impact loading; Jia-Bin Ye et al. [5] conducted a study on the structural response of slender RC columns under static or dynamic horizontal loading and found that the RC column damage mode is bending damage. The RC columns were resisted by overall bending under static load, while the horizontal impact force was mainly resisted by inertia force, and the peak impact force under dynamic load was 4.51 to 15.27 times higher than that under static load. In addition, it was found that axial preload contributes to the deformation recovery of RC columns under impact loading; Jian Cai et al. [6] studied the effect of horizontal impact loading on the dynamic response of reinforced concrete axial compression columns and found that only 42.6% to 97.5% of the initial impact energy was used for structural deformation. Increasing the impact weight increases the average impact force, and increasing the impact velocity prolongs the impact duration. An increase in specimen length to slenderness ratio resulted in a decrease in bending stiffness, leading to more severe specimen damage. The displacement and strain of the steel bars were observed to be half-sine wave-shaped during the tests, and the velocity versus time curves also showed uniform delayed motion. Gholamreza Gholipour et al. [7] found that axial pressure has a significant effect on the dynamic response and damage behaviour of RC columns under transverse impact loading. As the axial pressure ratio increased, the damage mode of the column shifted from global to local with an increase in the initial peak impact force, inertia force, bending moment, and shear force, while the deflection deformation decreased. Jing-Ming Sun [8] showed that axial compression enhanced the overall transverse stiffness of the RC column, but increasing the axial compression ratio or impact velocity increased the inertia force and caused the column to change from bending damage to shear damage. When the impact velocity is constant, increasing the axial compression ratio from 0 to 0.24 improves the impact resistance of the column but increasing it to 0.64 adversely affects it. The study conducted by Khalil AL-Bukhaiti [9] investigated the effect of axial loading on the dynamic response of reinforced concrete (RC) members under asymmetric lateral impact. Compression ratios between 0.05 and 0.13 resulted in a decrease in impact resistance, leading to increased deflection. Inclined cracks in this range expanded more slowly, took longer to form, and had lower resistance to damage. At compression ratios greater than 0.13, inclined cracks formed earlier, causing brittle and severe damage to the concrete at the point of impact.
Thong M. Pham [10] investigated the effect of rubber on the impact resistance of concrete columns through pendulum impact tests and found that rubber concrete columns had lower peak impact forces, and concrete columns containing 15% and 30% rubber had 58% and 63% higher impact energy absorption, respectively, compared with normal concrete columns. Wei Fan [11] proposed a UHPFRC sheath-reinforced column to evaluate its performance under vehicle impact. The results showed that the displacement caused by the impact was reduced by at least 50%, and when the impact velocity was not high, increasing the thickness of the UHPFRC sheath could effectively improve the residual bearing capacity of the reinforced column. The strengthening effect of CFRP on RC columns has been reported in the literature [12]. The displacement of reinforced RC columns is significantly reduced, and the shear damage is reduced at the same time. The failure mode is changed from brittle shear to ductile bending. Meanwhile, more studies [13,14,15,16,17] have shown that steel fibers can significantly improve the impact resistance of concrete members.
Fly ash is a kind of industrial waste produced by burning coal, containing many respirable fine particulate matter (PM) and other harmful substances. By adopting non-sintering technology, ceramsite and pottery sand made from fly ash are applied to concrete, which can reduce environmental pollution and damage to the natural environment caused by sand and gravel aggregate collection and, at the same time, reduce the dead weight of buildings and reduce thermal conductivity [18,19,20]. This paper uses all-lightweight concrete (hereinafter referred to as ALWC) with non-sintered fly ash ceramic particles and ceramic sand as coarse and fine aggregate preparation; this type of concrete has the characteristics of being impact prone to brittle splitting damage [21,22,23]. Very limited studies exist on the impact resistance of ALWC made from non-sintered fly ash ceramic particles. Fly ash is made into ceramsite and pottery sand and applied to concrete.
In summary, the impact resistance of concrete columns may change adversely with increasing axial load, and the established research results on concrete columns make it difficult to provide data to support the market application of ALWC columns due to the differences in material properties. In the market for ALWC columns, the research for their impact-resistant mechanical properties is still in the initial stage. In this paper, to address this issue, an experimental study of ALWC columns with different axial compression ratios and steel fiber reinforcement conditions is conducted to evaluate this type of member’s performance and provide a reliable data basis for its marketing.
2. Experimental Program
2.1. Specimen Design and Fabrication
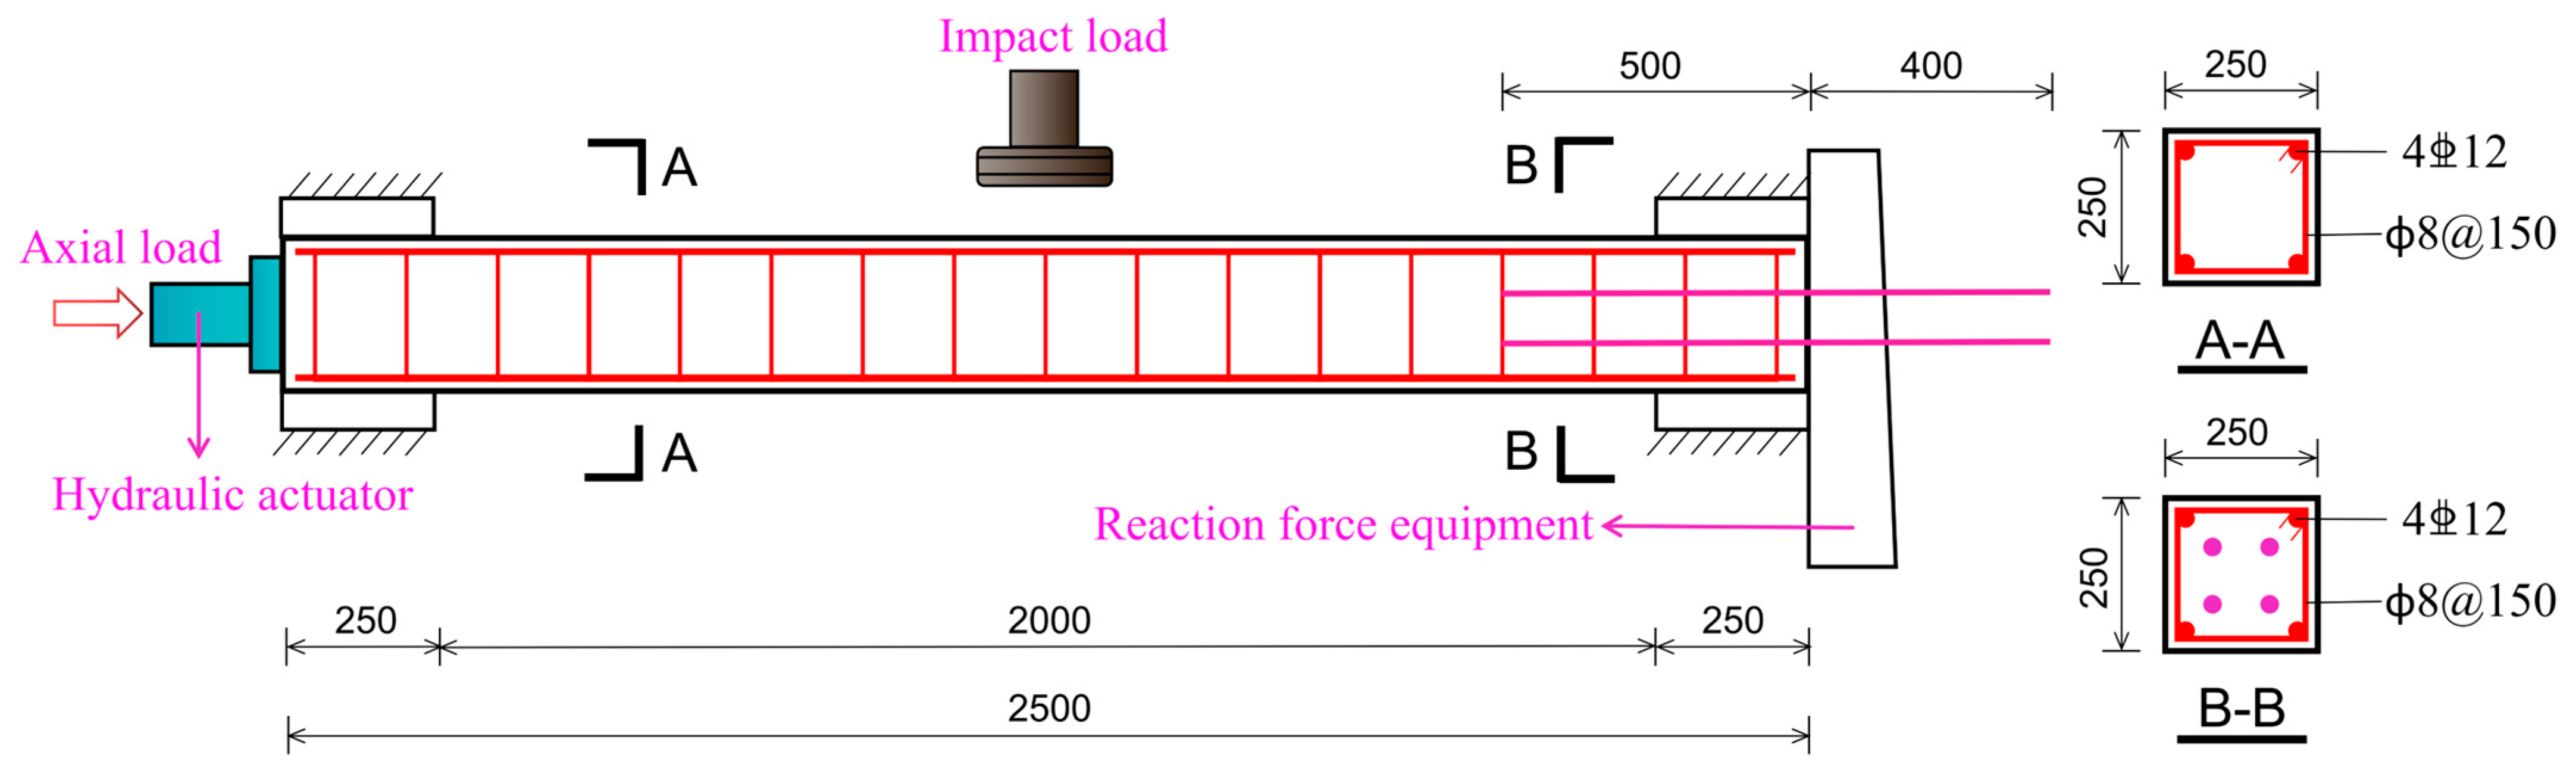
The design of the ALWC column’s reinforcement structure and size follows the guidelines outlined in Code for Design of Concrete Structures [24]. Figure 1 illustrates the design of the ALWC column, while Table 1 presents the design parameters of the specimen. The specimen has a size of 250 × 250 × 2500 mm, is fixed at both ends, and has a net span of 2000 mm. Longitudinal reinforcement, symmetrically arranged on both sides, consists of 12 mm diameter bars. Hoop reinforcement, with an 8 mm diameter and spaced at intervals of 150 mm, is also included. The concrete has a protective layer thickness of 20 mm. Additionally, four anchoring bolts are embedded at one end of the specimen, with a depth of 500 mm.
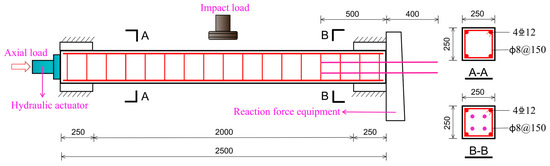
Figure 1.
Reinforcement construction and dimensioning schematic for ALWC columns.

Table 1.
ALWC Column Design Parameter Details.
A total of four square-section ALWC columns were designed for the test. Among them, specimens FACSC-1, FACSC-2, and FACSC-3 had axial compression ratios of 0.1, 0.2, and 0.3, respectively. These specimens were utilized to assess the impact resistance of ALWC columns under varying axial compression ratios. Specimen FACSC-4, with an axial compression ratio of 0.2, was an ALWC column that incorporated 1% shear wave steel fibers. This specimen aimed to examine the impact toughness enhancement resulting from the inclusion of steel fibers in ALWC columns.
2.2. Material Properties
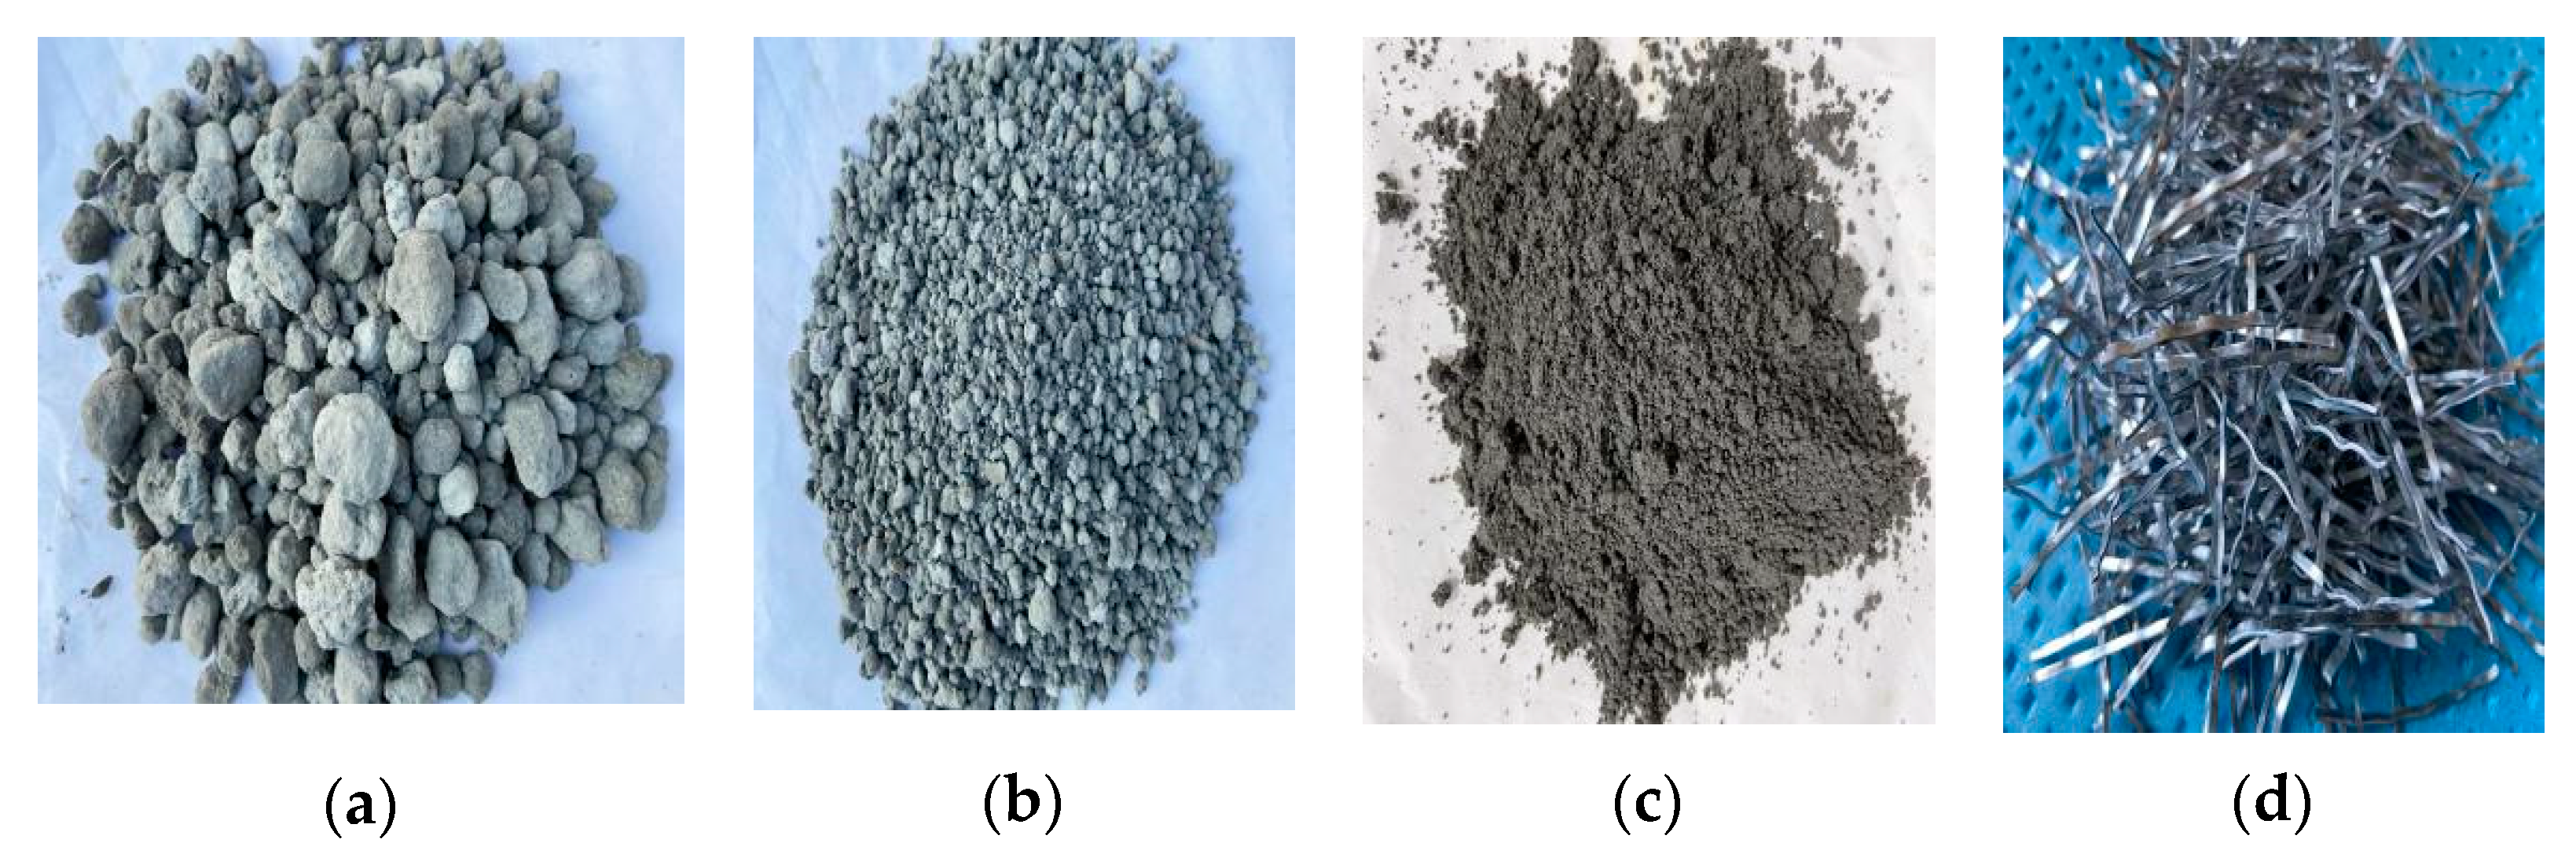
The design strength of ALWC is LC30, and its mix ratio is determined and optimized in accordance with the ‘Technical Standard for Application of Lightweight Aggregate Concrete [25]’, ‘Technical Specification for Application of Fiber Reinforced Concrete [26]’, and ‘Steel Fiber for Concrete [27]’. The specific mix ratio can be found in Table 2, and the constituent materials are shown in Figure 2. Ordinary 42.5 silicate cement was chosen for this study. The particle sizes of non-sintered fly ash ceramic pellets and pottery sand are 5–16 mm and 3–4 mm, respectively. The bulk density of non-sintered fly ash ceramic pellets is 772 kg/m3, with an average cylinder compression strength of 10.1 MPa and an average dry apparent density of 1674 kg/m3. The slump of the mixture is 140–160 mm. For this study, shear wave steel fibers with a rectangular cross-section were selected. Detailed parameters can be found in Table 3. The parameters for the steel reinforcement are listed in Table 4.
Table 2.
ALWC proportioning details.

Figure 2.
ALWC’s main constituent materials are: (a) non-sintered fly ash ceramic granules; (b) non-sintered fly ash ceramic sand; (c) fly ash; and (d) shear wave steel fibers.
Table 3.
Details of steel fiber parameters.
Table 4.
Material property parameters of rebar.
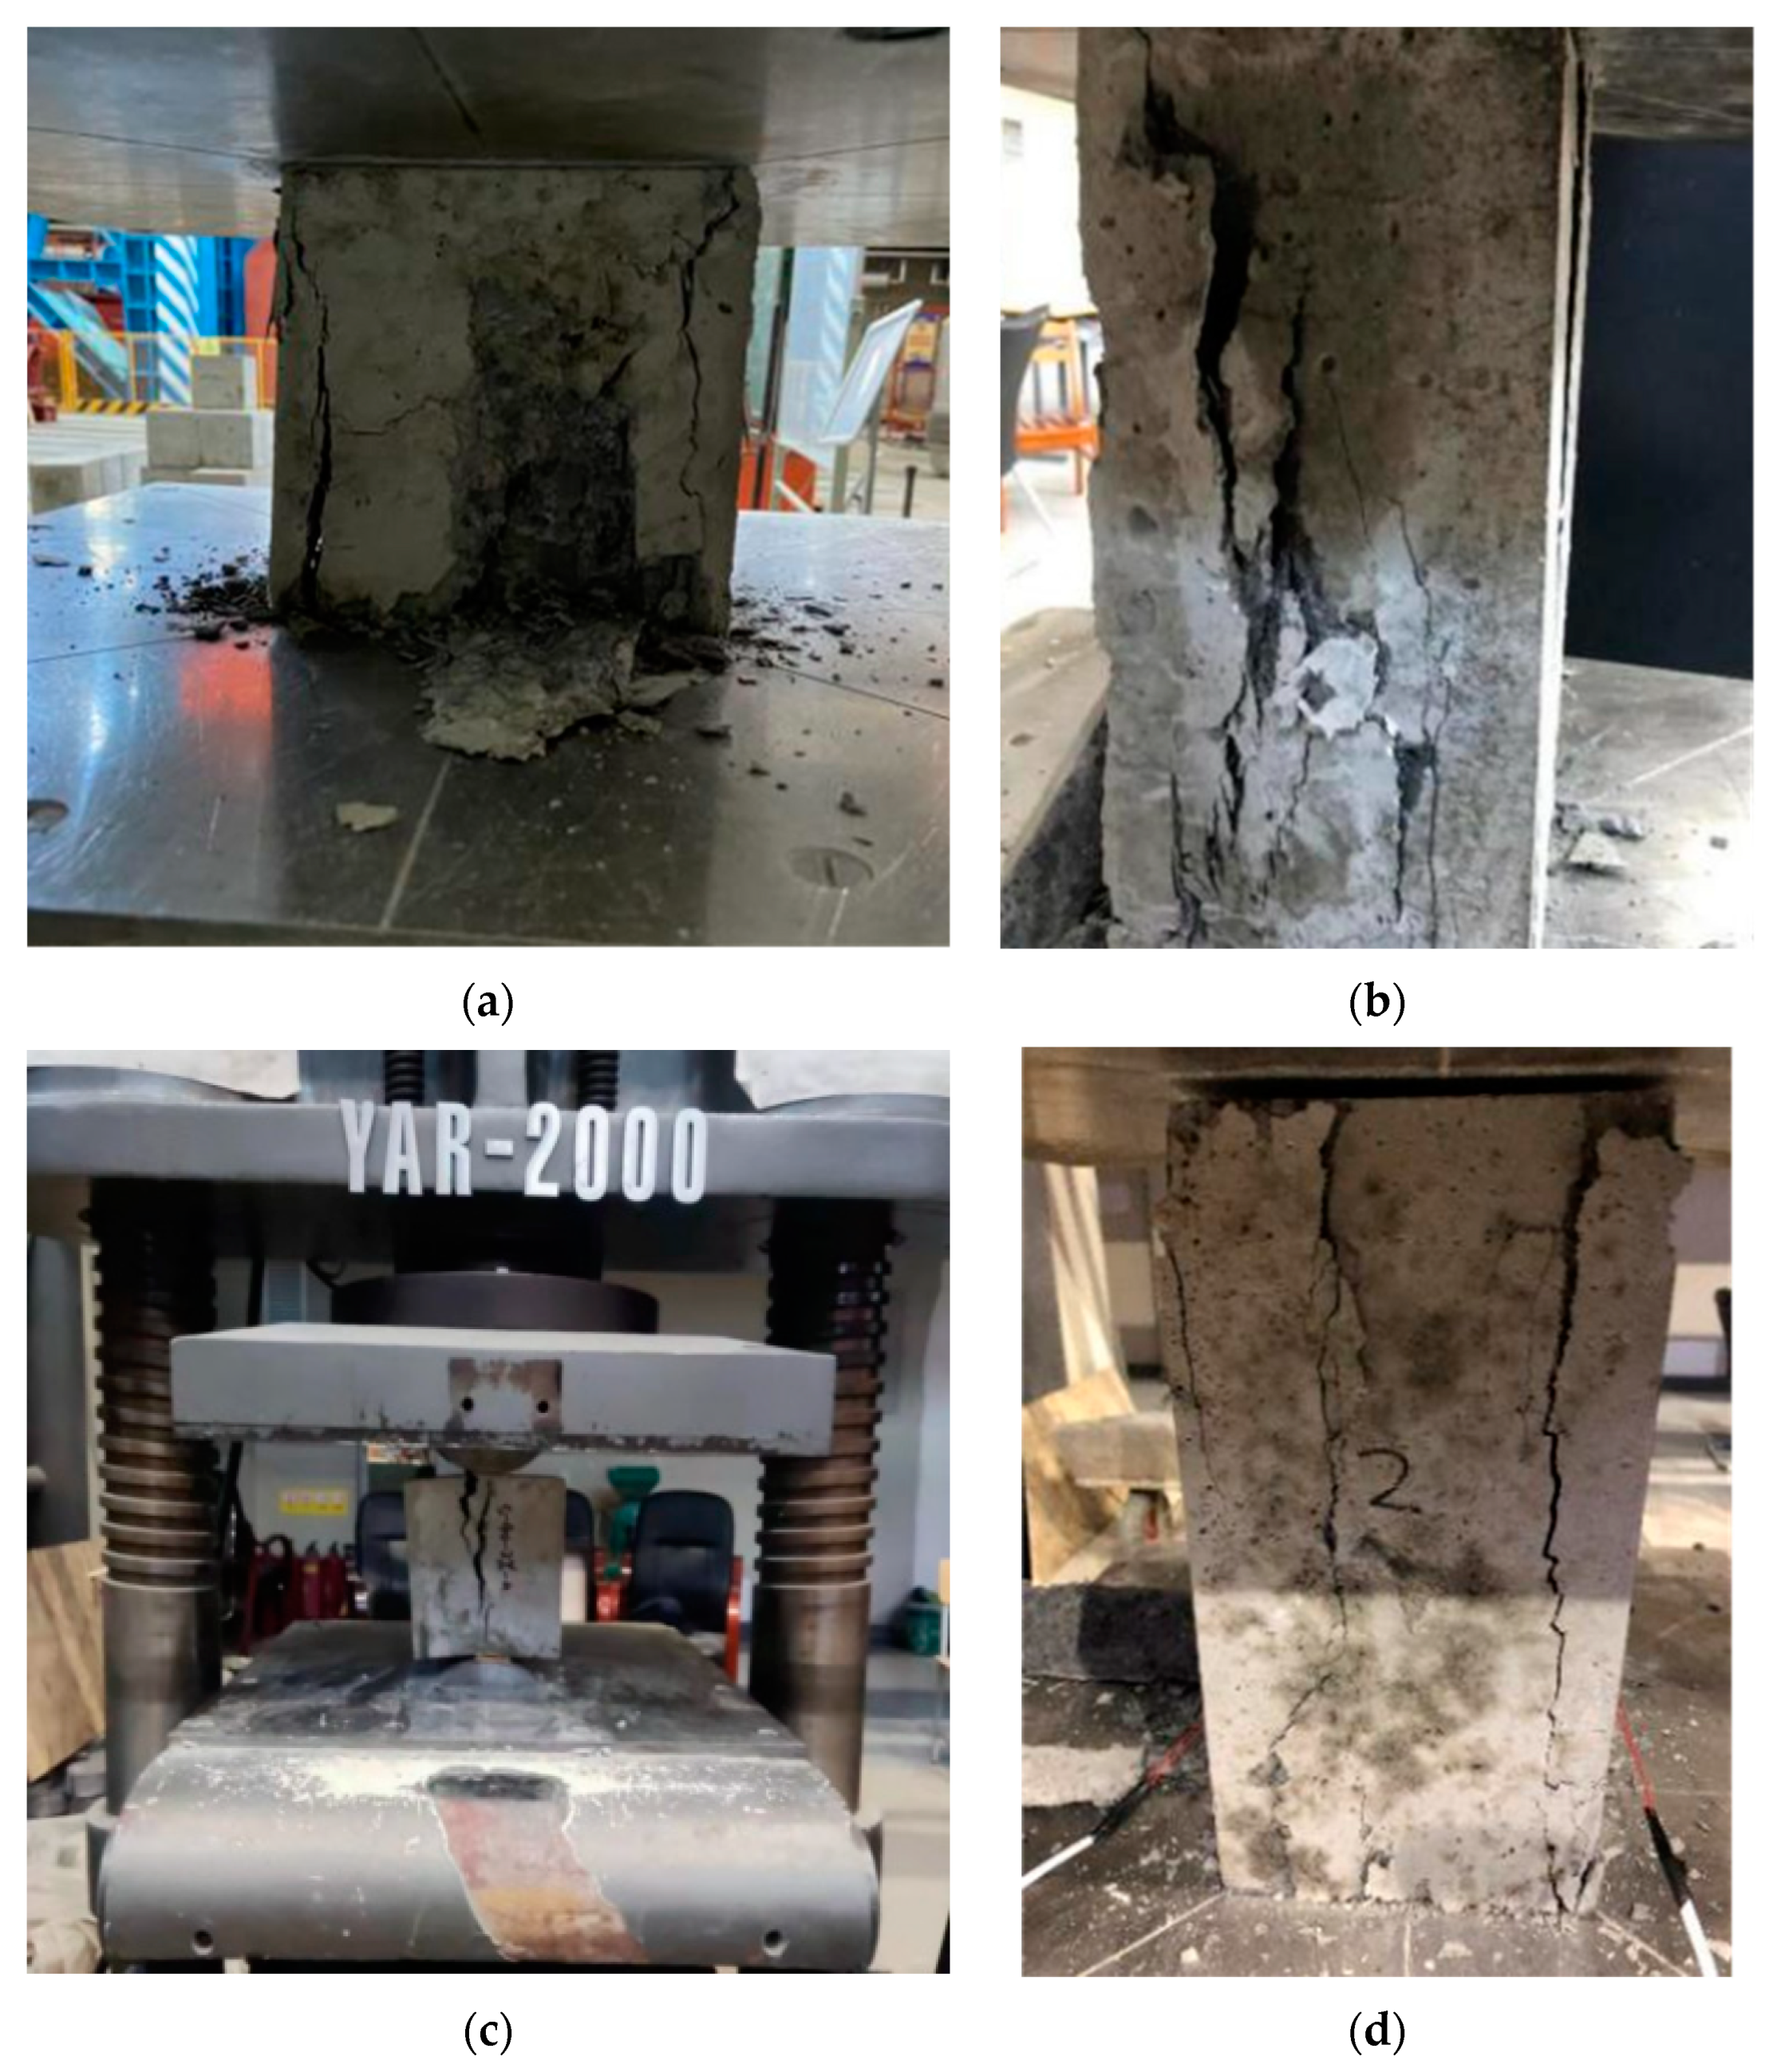
A batch of cube specimens with a 150 mm side length and prism specimens with 150 mm × 150 mm × 300 mm size were poured while making ALWC column specimens. These specimens were cured under standard conditions for 28 days to determine their cubic compressive strength, axial compressive strength, splitting tensile strength, and modulus of elasticity. The test blocks were loaded using a 200 T electro-hydraulic servo universal testing machine with the loading rate set at 0.5 Mpa/s. Three experiments were conducted for each strength test, and the results were averaged. The damage phenomena of test blocks during loading are shown in Figure 3, and the strength test results of different test block types of ALWC are detailed in Table 5.

Figure 3.
ALWC mechanical properties destruction phenomena: (a) cubic compressive strength test; (b) axial compressive strength Test; (c) split tensile strength test; (d) modulus of elasticity test.
Table 5.
ALWC mechanical property test results.
2.3. Test Setup and Test Program
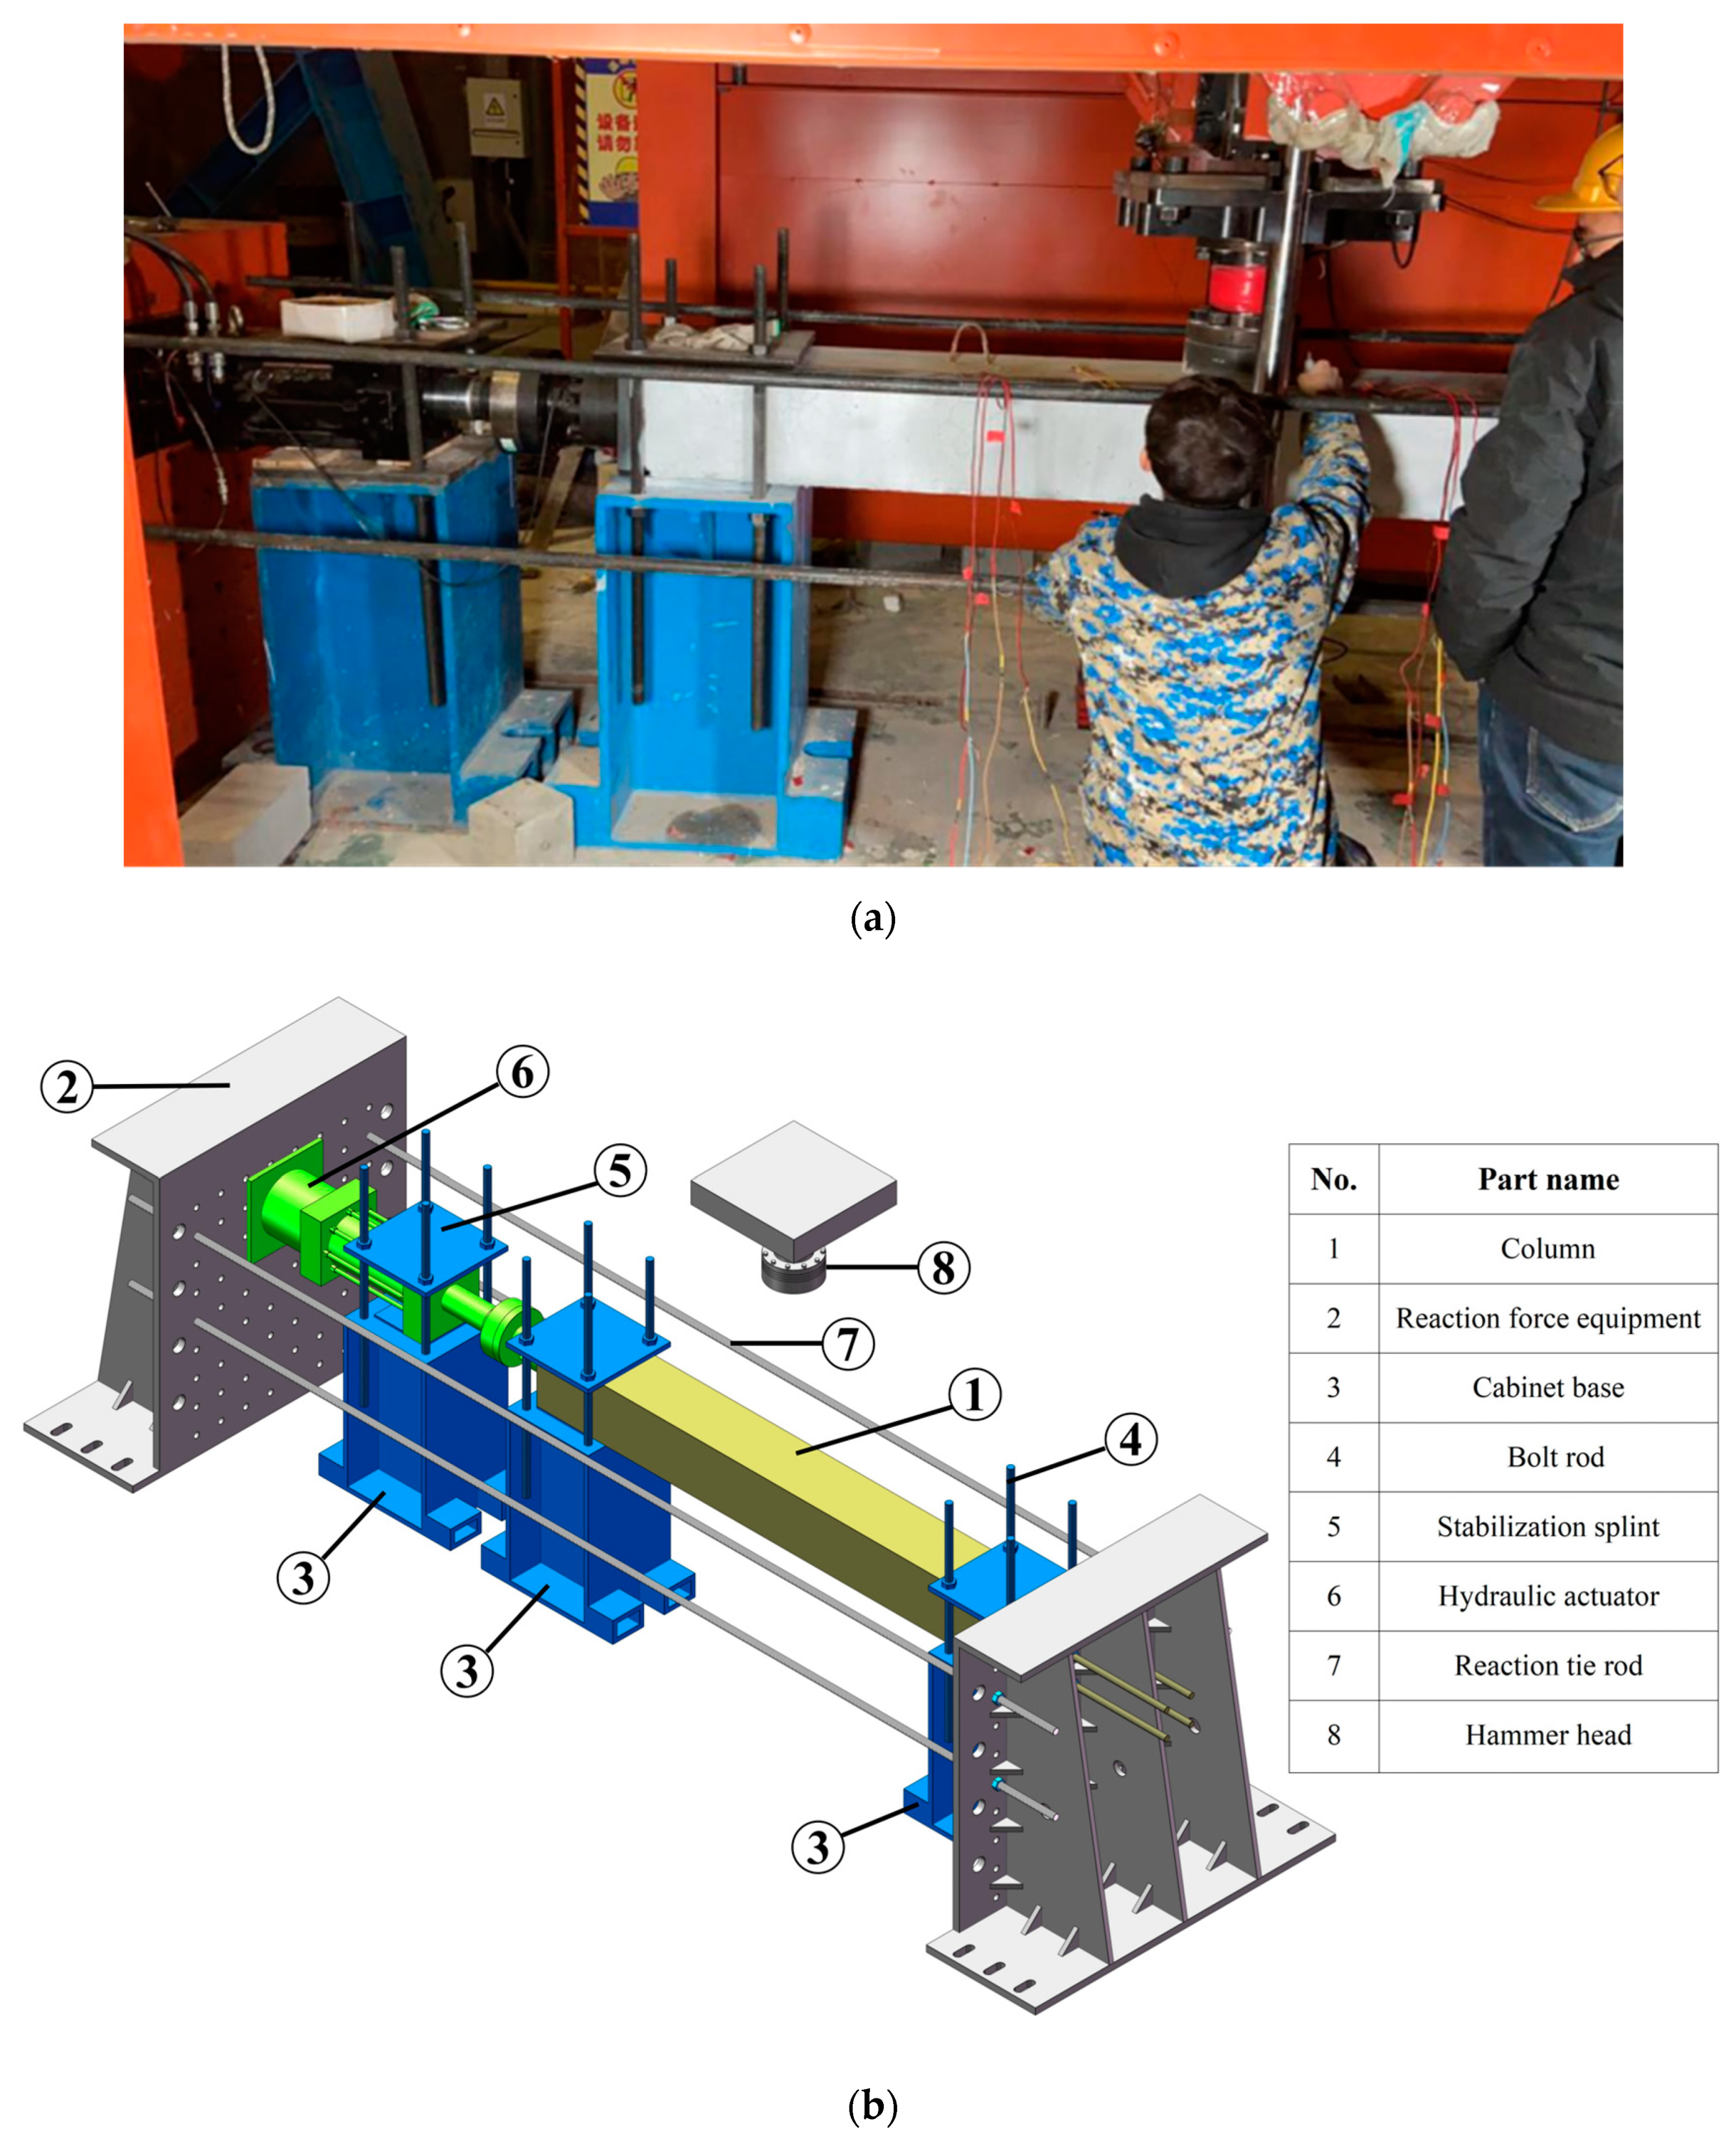
The experiment was conducted at the Structural Laboratory of Jilin Jianzhu University. The impact testing apparatus comprised four components: a drop hammer testing machine, a hydraulic actuator, a fixing device, and reaction force equipment, as depicted in Figure 4. The base of the hydraulic actuator was tightly integrated with the left-side reaction force equipment, applying an axial load to the left end of the specimen through the loading head. The bolt rod for anchoring the specimen penetrated the hole on the right side of the reaction force equipment and was secured at the back of the reaction force equipment with a nut. The specimen and hydraulic actuator were fixed and supported using a combination of clamping plates and pedestals. The reaction force equipment was constrained by the ground anchor, and its upward displacement was restricted by four reaction tie rods, ensuring accurate application of the axial load and rebound of the specimen after impact.

Figure 4.
Schematic diagram of the impact test device: (a) arrangement of the device at the test site; (b) model diagram of the test device.
The main parameters of the impact test are given in Table 6. Among them, m is the mass of the falling hammer, g is the acceleration of gravity, h0 is the height of the falling hammerhead, V0 is the initial impact velocity, and E0 is the initial impact energy. E0 is calculated from Equation (1). The test uses a circular hammer head with a diameter of 22 cm. in which, before the axial load is formally loaded, a preload is carried out with a preload value of 10 kN, and close attention is paid to the displacement of the column and the tightening of the device connection during the loading process. After the preload was unloaded, the gap between the test devices was checked, and the experimental equipment was fastened according to the specific situation.
Table 6.
Details of impact test loading.
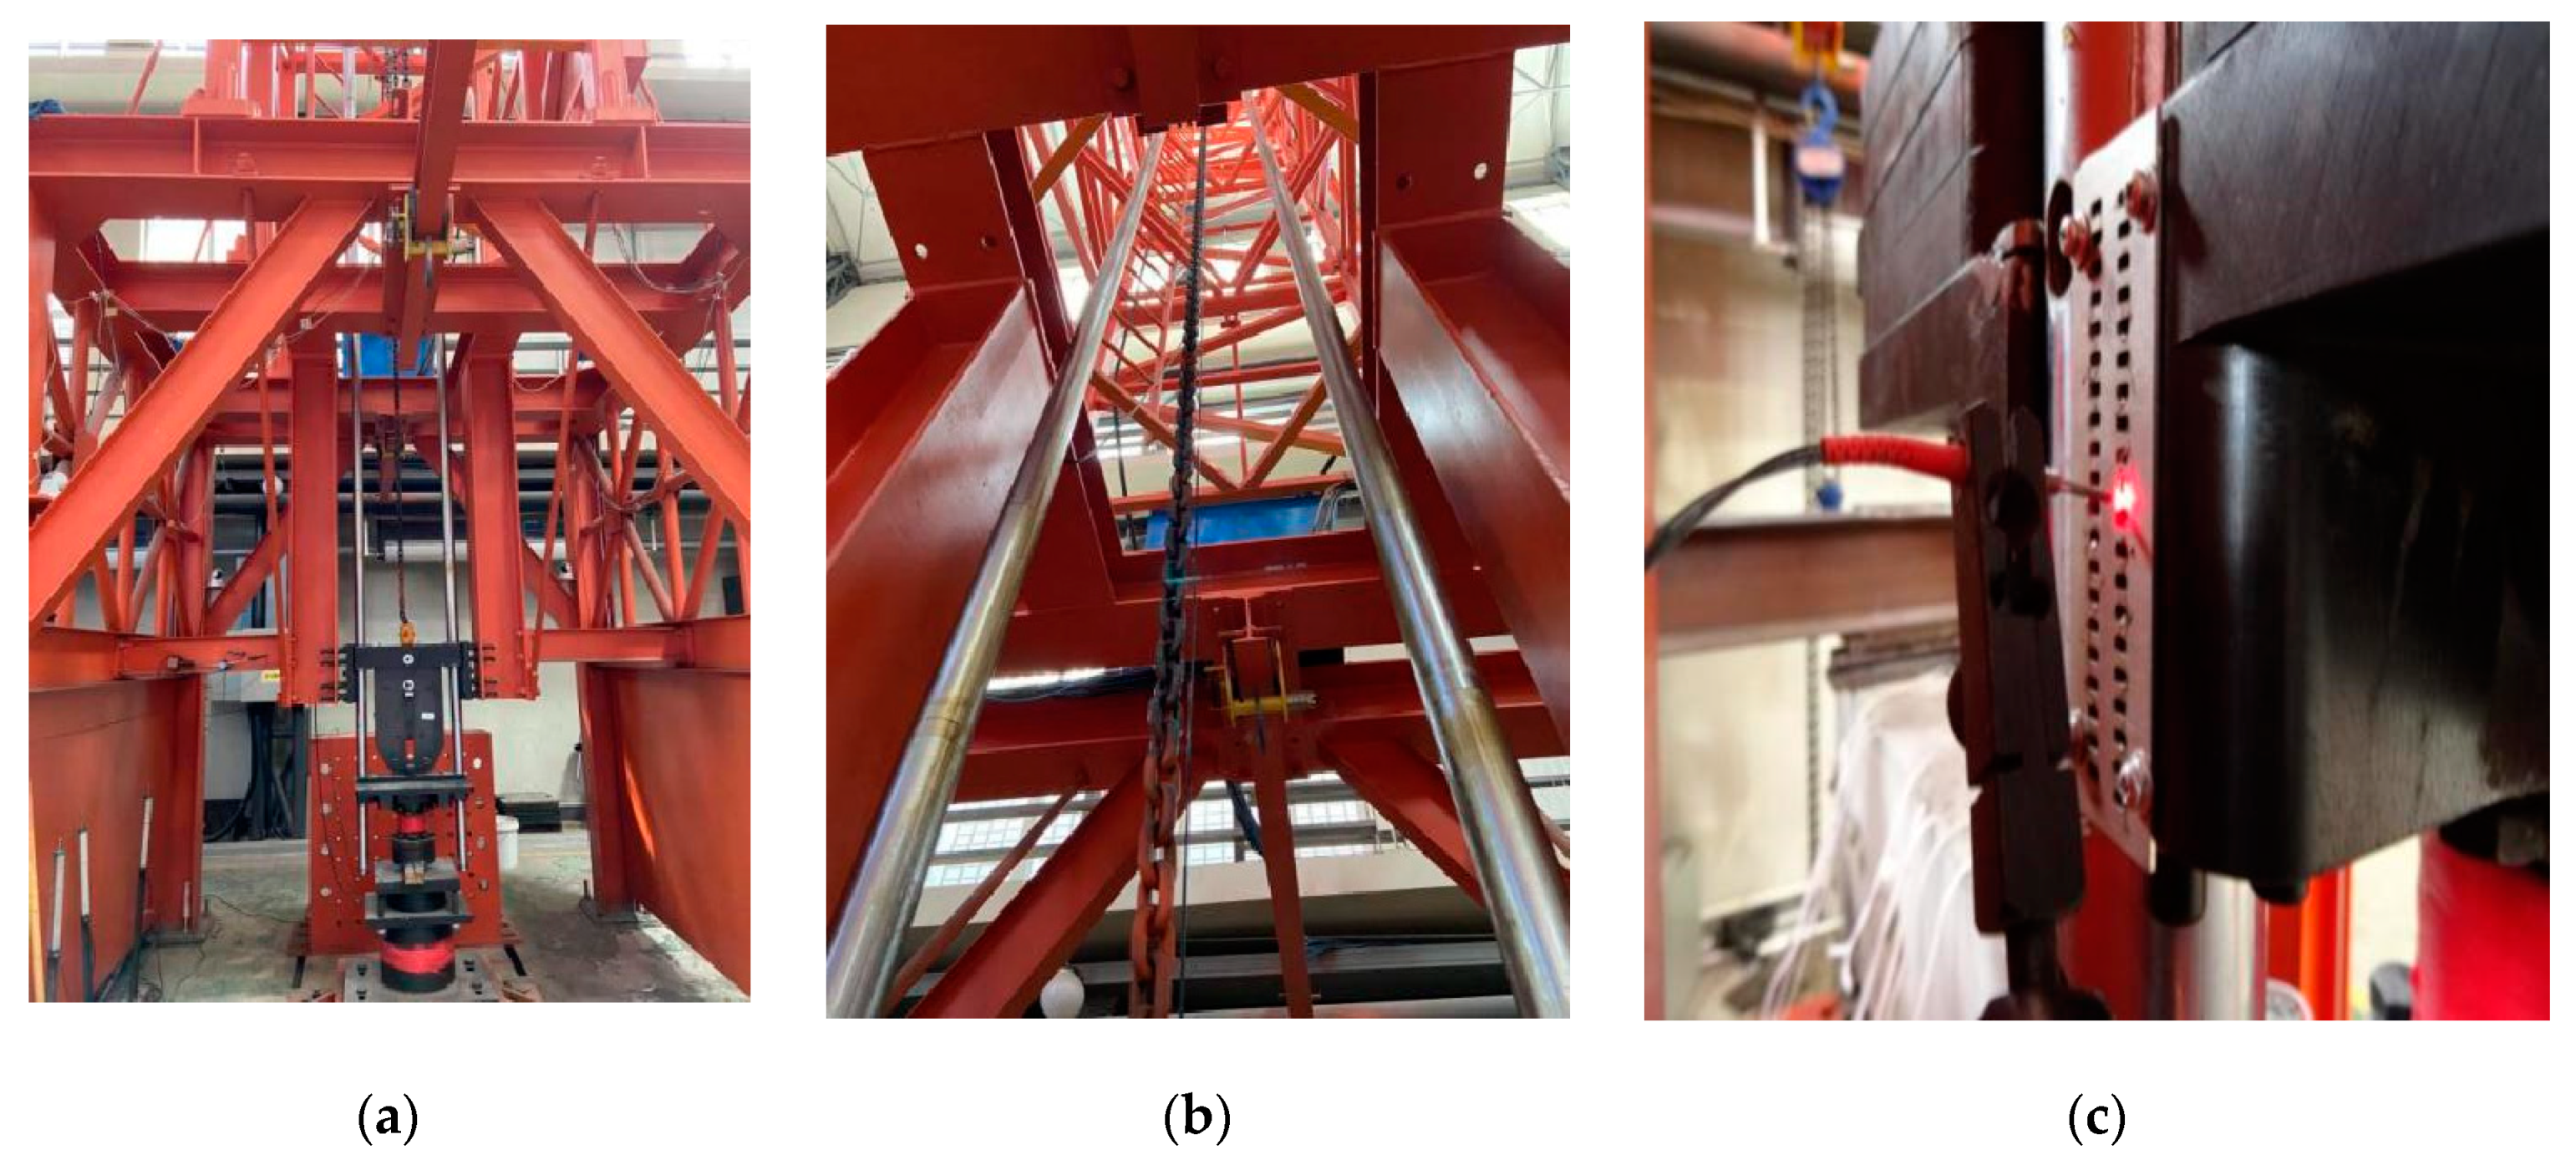
The falling hammer tester is shown in Figure 5. After the test begins, the grating reflector above the hammer head causes a change in the reflected signal when the infrared probe is routed, triggering the data acquisition system to record the strain signal generated by the impact. After the hammerhead makes contact with the column, the impact force is measured by the force sensor above the hammerhead. The data acquisition system is the NIPXI e-1006Q from NI, which is acquired by LabView Signal Express 2015 software with a sampling rate of 1 MHz.

Figure 5.
Drop hammer tester device: (a) hammer head; (b) guide rail; (c) infrared laser probe.
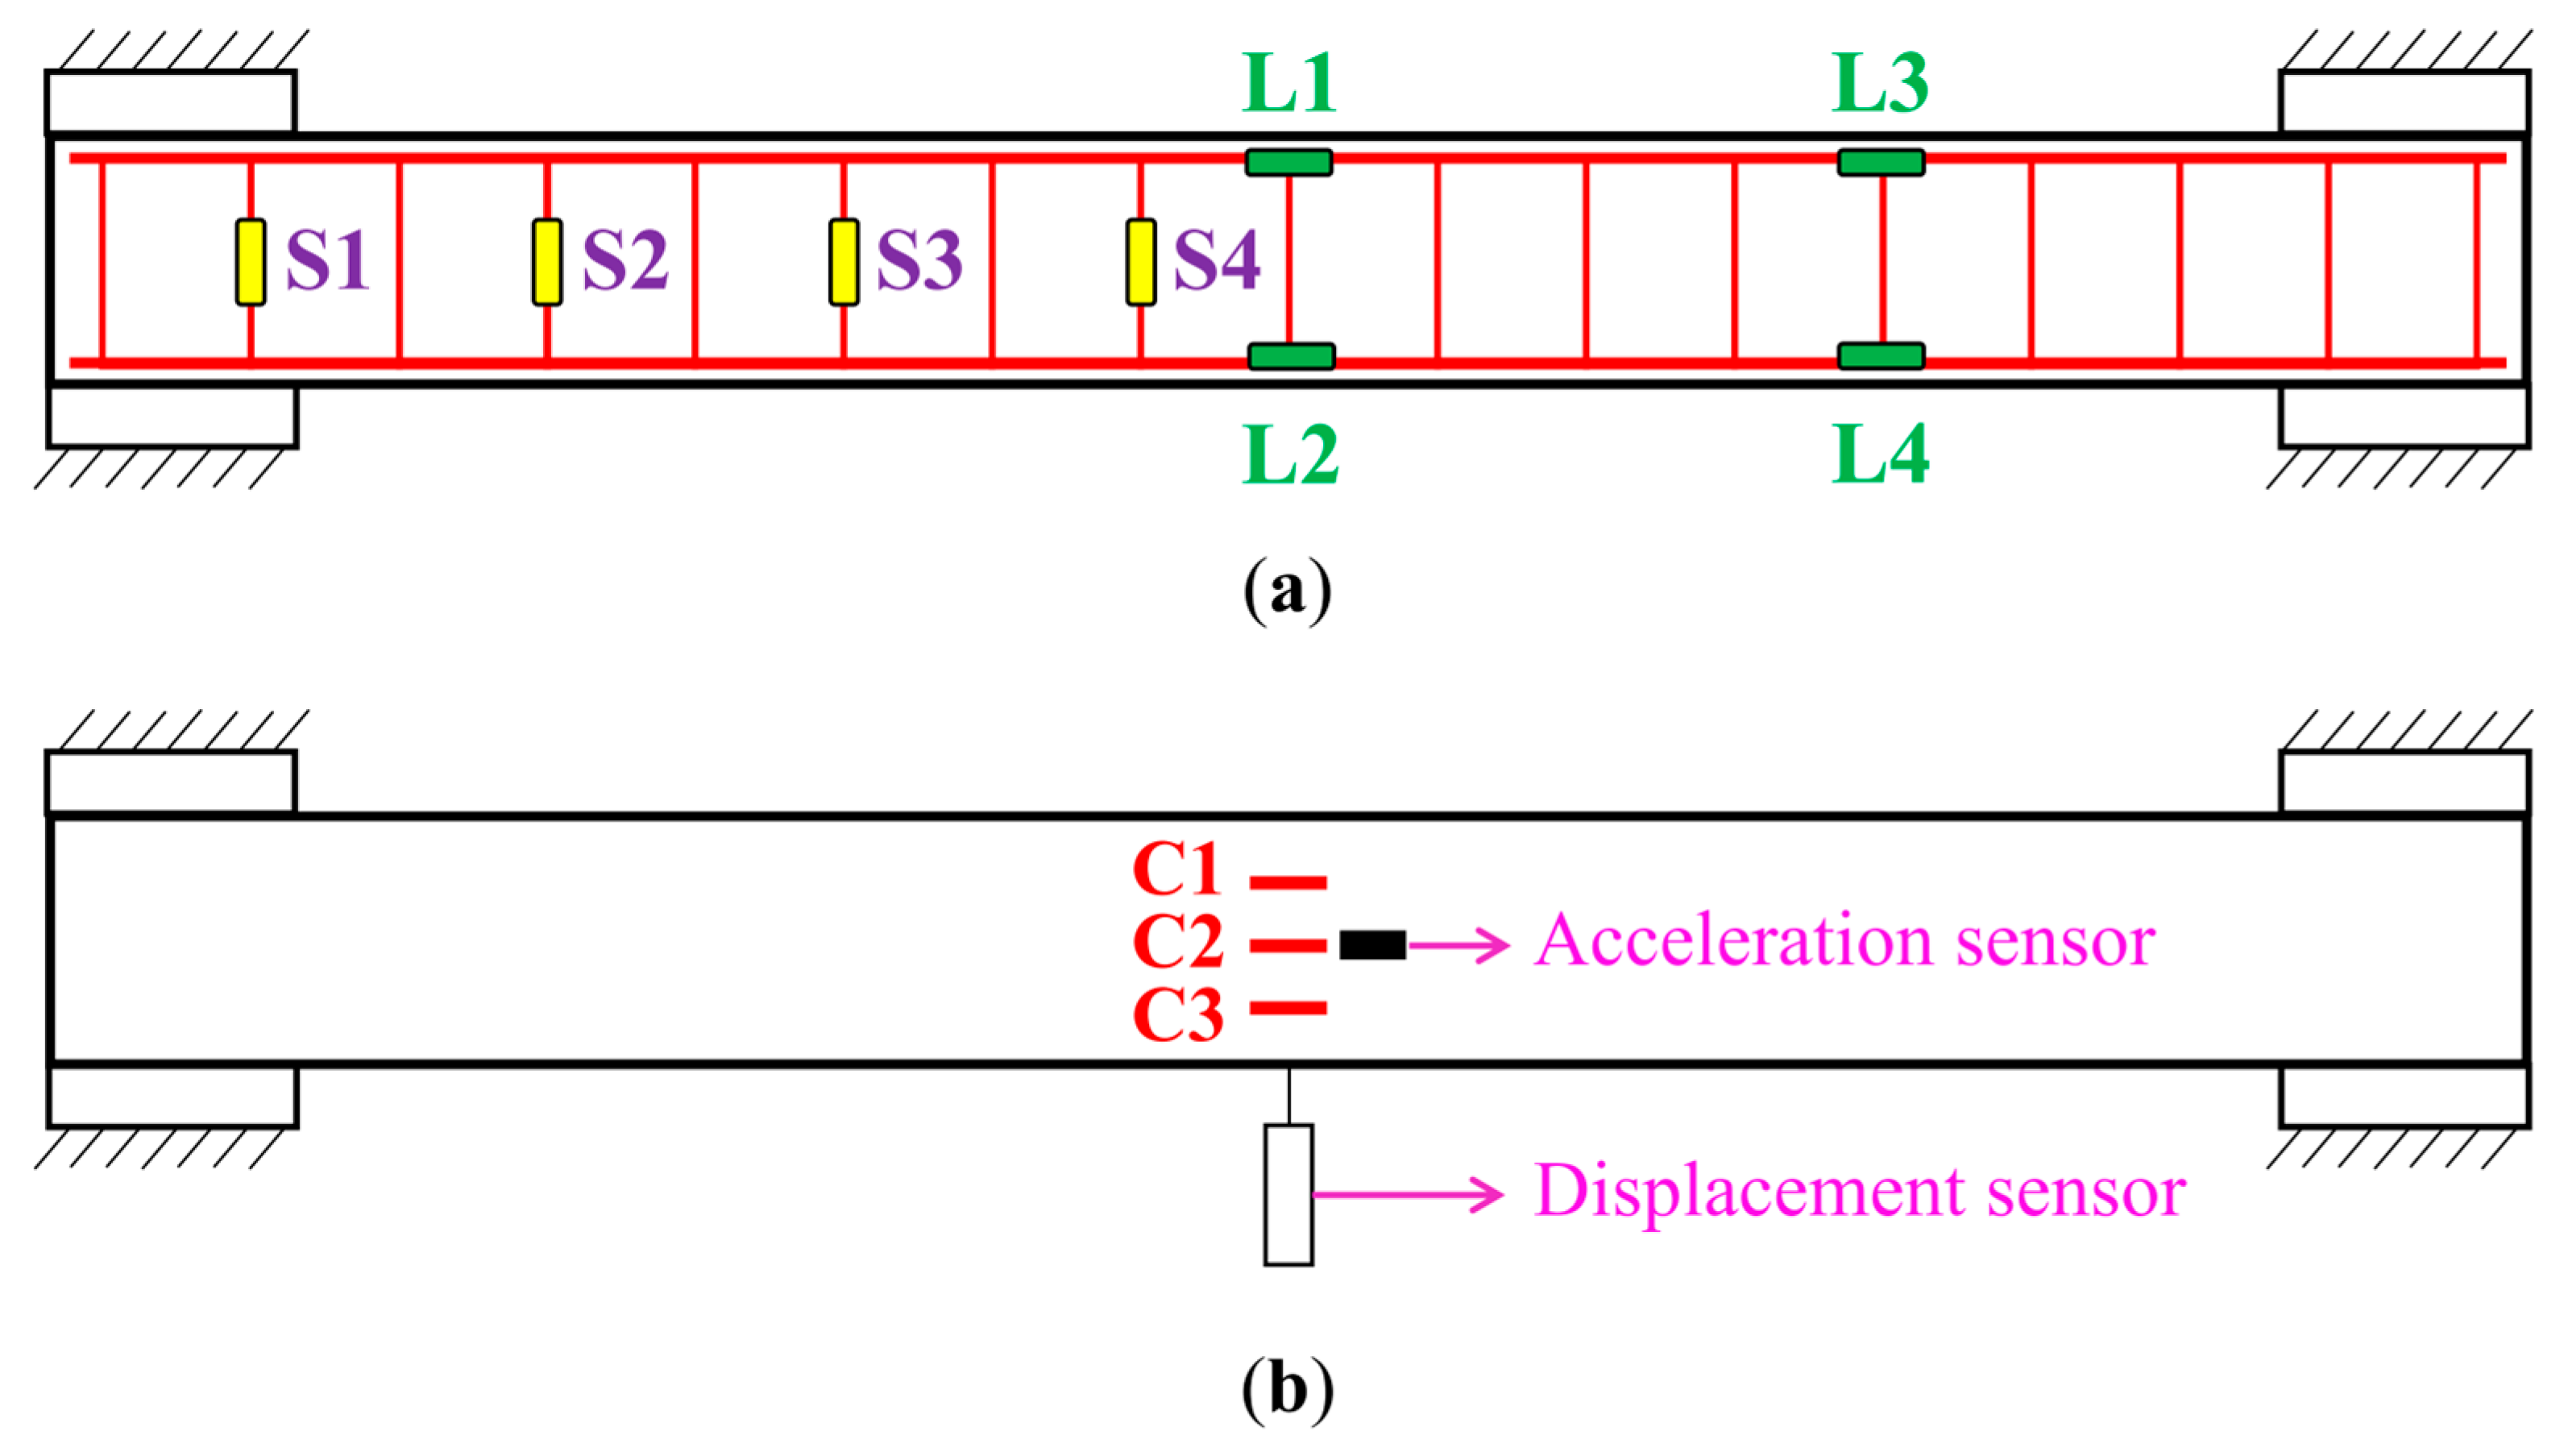
The steel and concrete strain gauges, as well as the acceleration and displacement sensors, are arranged as shown in Figure 6. Among them, strain gauges S1~S4 are used to measure the hoop strain, strain gauges L1~L4 are used to measure the longitudinal reinforcement strain, and strain gauges C1~C3 are used to measure the concrete strain in the span. Acceleration sensors are arranged to the right of strain gauge C2 to measure acceleration changes. A pull rod displacement sensor is arranged at the bottom of the mid-span to measure the mid-span displacement.

Figure 6.
Layout of test points: (a) Layout of strain measurement points of reinforcement; (b) Layout of measurement points on the outer surface of concrete, acceleration transducer, and tie-bar displacement transducer.
3. Results and Discussion
3.1. Specimen Damage Pattern
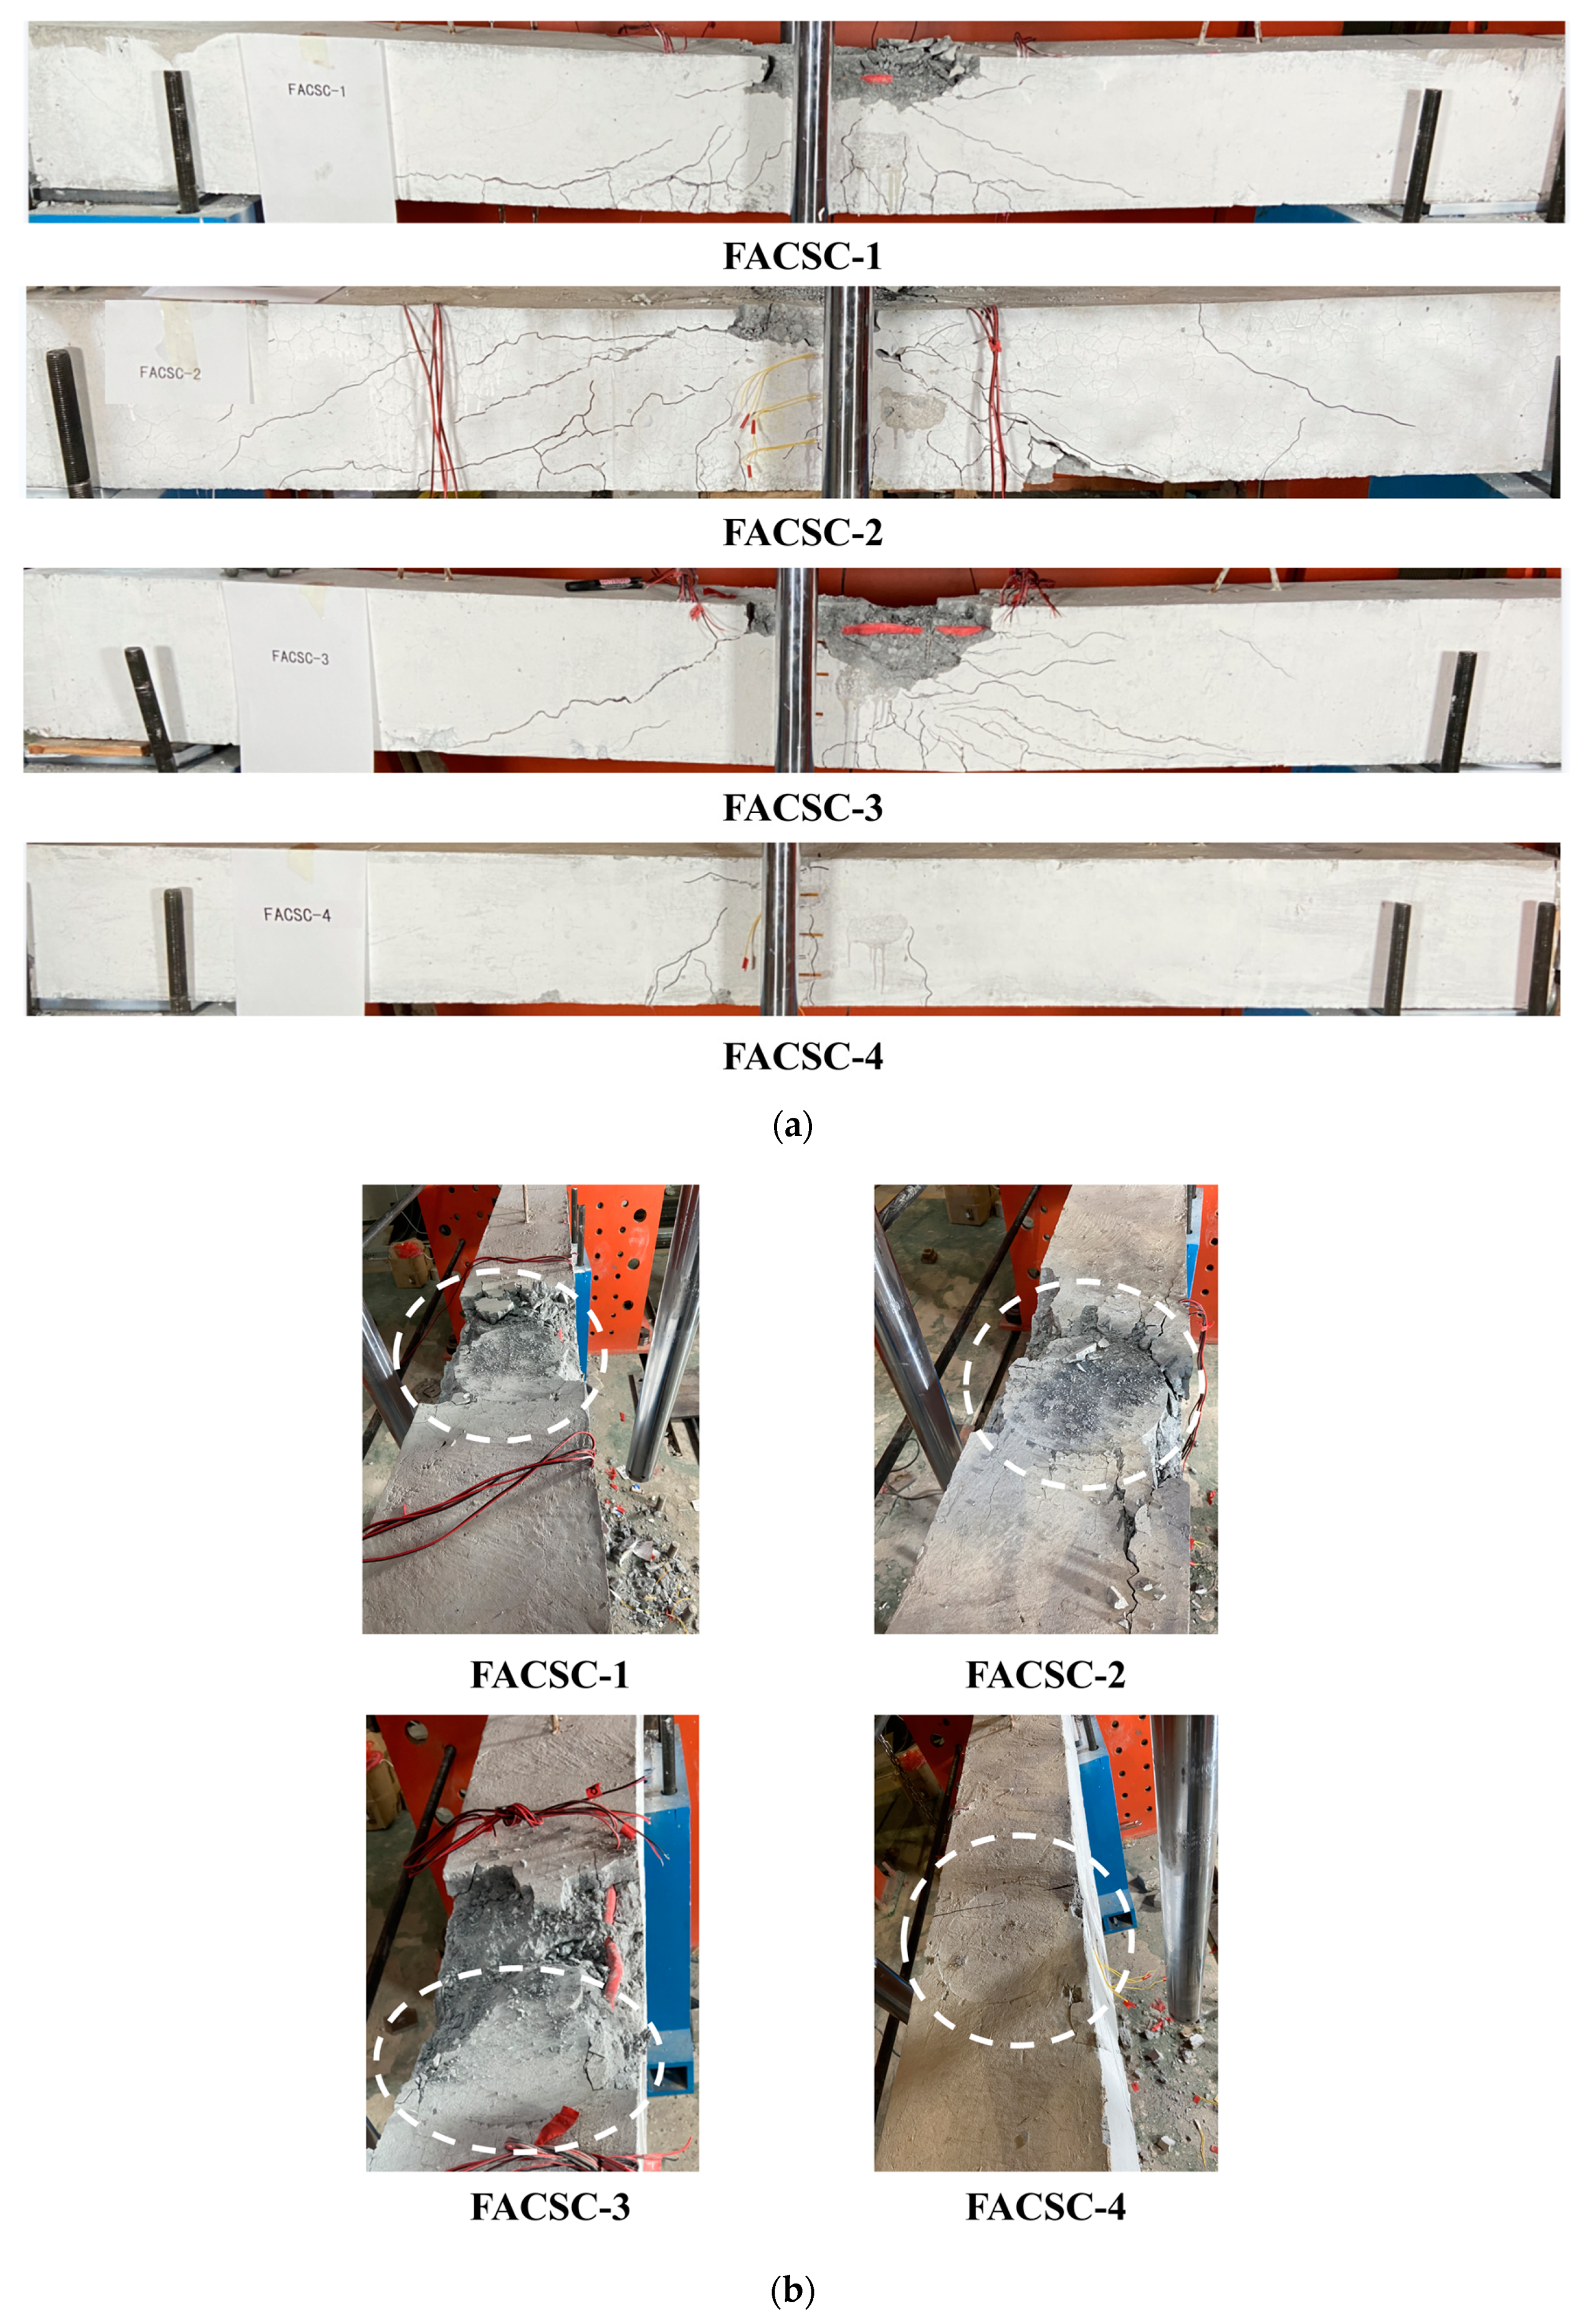
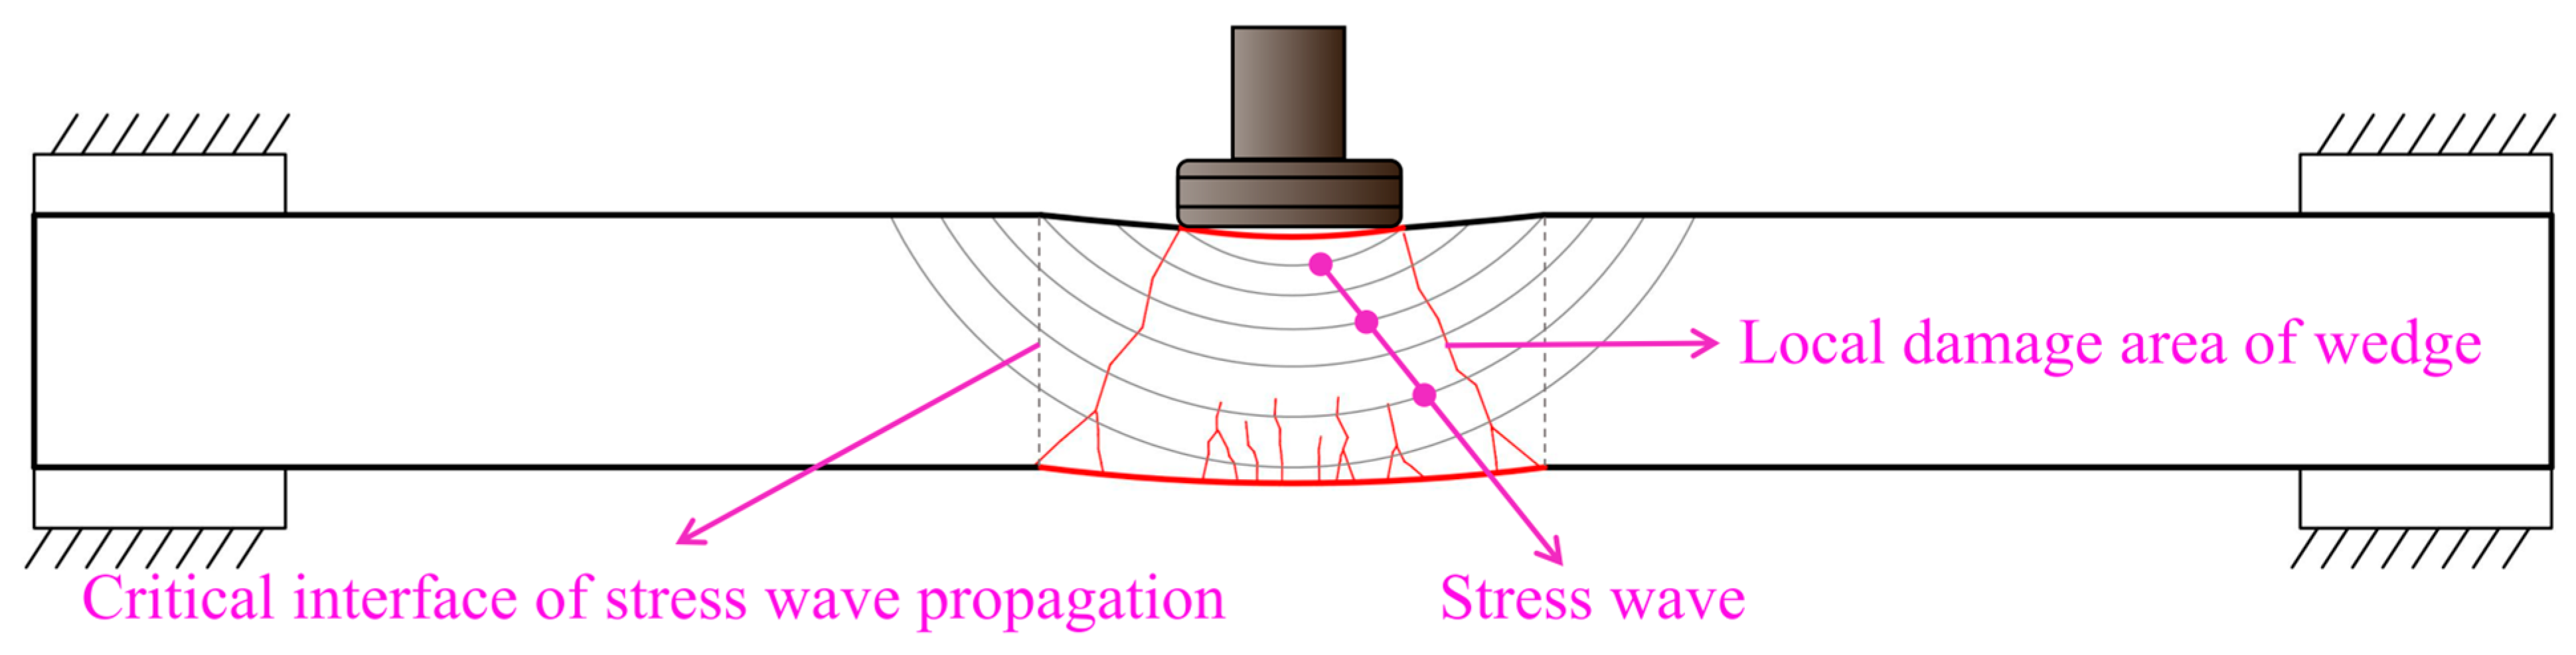
The final damage phenomena of the four specimens are shown in Figure 7. Figure 7 shows that vertical bending cracks and oblique shear cracks appear in the local area in the span of the specimen after being subjected to the impact load [28,29], forming a wedge-like local damaged area [30,31,32], which is caused by the stress wave propagation and reflection in the thickness direction first at the initial moment of impact hammer contact with the specimen. The diffusion pattern of the stress wave is similar to a spherical or wedge shape [33], as shown in Figure 8. At this time, the impact causes the material points in the local area across the middle to receive the same downward acceleration. It is worth noting that at this time, the motion of the column outside the local area in the middle of the span has not yet started to respond, and the specimen is in a stress mode similar to that of the column embedded at both ends under concentrated static load, which is a local response mode. The stress wave diffuses from the impact contact point, which leads to the influence of longitudinal waves, reflected waves and shear waves in the mid-span, and then all material points in this range begin to respond. The component is deflected by the normal stress and shear stress produced by impact, and a local punching zone similar to a wedge is formed in the mid-span, accompanied by a large number of bending cracks at the bottom of the specimen and shear cracks around the impact zone. With the repeated reflection and unloading of stress waves, the disturbance caused by impact gradually spreads to the far end of the column and finally stably balances in the column. The column at the support rotates slightly, and the embedded columns at both ends evolve into a stress mode similar to a simple pillar, defined as the overall response mode. At this stage, the component will deform and move as a whole, caused by the inertia effect.
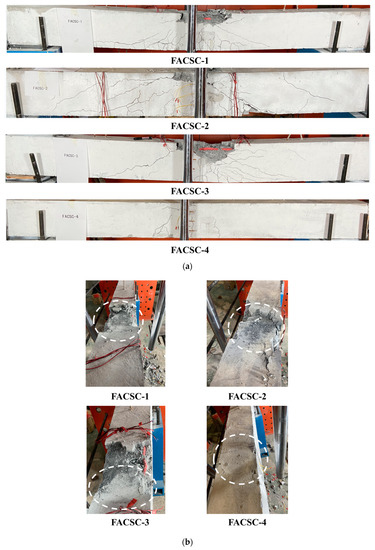
Figure 7.
Final failure modes of ALWC columns: (a) crack modes of specimens; (b) failure at the impact point at the top of the specimen.
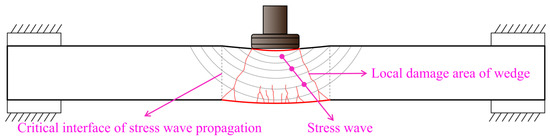
Figure 8.
Diagram of stress wave diffusion morphology.
Specimen FACSC-1 has an axial compression ratio of 0.1. The acceleration-induced impact energy causes intrusion damage to the concrete in the impact contact zone, while the surrounding protective layer spalling leads to partial exposure of the longitudinal reinforcement. These exposed reinforcement bars deformed less under the impact and have not yet yielded. The cracks of the specimen were concentrated in the mid-span region, showing a radial pattern, and the primary forms of cracks included shear cracks and bending cracks, with bending cracks dominating. The bending cracks originated from the cracking of the concrete in the tensile zone at the bottom of the column span. Although these cracks extended toward the impact point, they did not cause damage through the column section. According to the damage morphology of the specimens, it is known that the specimens have bending and shear damage, and the bending damage accounts for a more significant percentage.
Under an axial pressure ratio of 0.2, the concrete in the contact area of specimen FACSC-2 was damaged in the same way as FACSC-1. During the test, the concrete at the bottom showed a splash ejection phenomenon caused by the stress wave shooting through the concrete material interface. The damage to the specimen mainly took the form of diagonal shear cracks, and most of the shear cracks penetrated through the cross-section. The cracks on the left side of the span mainly show two forms: the outermost is an arch-shaped compression crack, while the rest are shear cracks with an inclination of 60 degrees to the neutral axis section. The cracks on the right side of the span are concentrated in the area near the middle of the span with an inclination of 45 degrees, showing the typical punching and shearing damage characteristics. Compared with the whole column, the anchor bolts embedded in the right end of the column play the role of reinforcement, directly or indirectly, which increases the shear resistance of the concrete within the right end of the column and thus inhibits the occurrence of shear damage in this region. Finally, the damage mode of the specimen is shear damage.
The axial compression ratio of specimen FACSC-3 was 0.3. At the end of the test, the compression and tension waves generated by the impact caused the concrete protective layer of the longitudinal reinforcement on the right side of the span to be torn, and the upper longitudinal reinforcement was exposed and entered into yielding, resulting in large plastic deformation. It is important to emphasize that only the longitudinal reinforcement on the right side of the span was exposed and yielded. The cracks in the specimen are mainly manifested as shear cracks, while the vertical bending cracks are almost not visible. An obvious shear crack is produced on the span centre position’s left side. In contrast, a dense shear diagonal crack appears on the right side of the span’s center position. This is due to the defective concrete casting at the hammering point on the right side of the span; the hammering contact instantly causes local damage, and the upper longitudinal reinforcement yields too quickly after losing the protection of the concrete layer and cannot withstand sufficient load, resulting in overloading of the bearing components in the adjacent area, i.e., the reinforcement and concrete are directly redistributed for stress. The shear stress along the stress wave propagation path on the concrete increases, causing shear damage to the ALWC and resulting in many cracks in the oblique shear plane. The damage mode is dominated by punching and cutting damage.
Under the axial compression ratio of 0.2, the impact toughness of specimen FACSC-4 was better than that of specimen FACSC-2 after adding 1% volume rate of shear wave-type steel fiber. No significant deflection deformation or aggregate spalling were observed in the specimen, and only a slight round depression intrusion corresponding to the shape of the hammerhead was observed at the impact point. Two transverse cracks were observed at the bottom of the specimen, which were shallow and did not undergo further extension at the height of the section. The bearing capacity of the specimen was retained to the maximum extent, and the damage was relatively mild. The steel fibres enhance the impact toughness of the ALWC columns because the specimens are subjected to temperature and chemical shrinkage stresses during curing, which can produce invisible micro-cracks within the concrete. Under low working environment stress, steel fibers effectively consume this stress in an elastic state and strengthen the adhesion between steel fibers and concrete aggregates through their unique shape, resulting in a higher load-bearing capacity of the formed specimens [34,35,36]. During the damage to the specimen, tiny cracks are generated inside the concrete, and the steel fibers can bridge or pass through these cracks to form microscopic crack beams, thus effectively preventing further expansion of the tiny cracks. At the same time, steel fibers also make up for the shortcomings of concrete’s lack of tensile strength. When the concrete tensile damage occurs, the stress generated inside the concrete is partially transferred to the nearby steel fibers, forming a tensile steel fiber influence zone. The steel fiber is stretched in the process, and its end is caught in the concrete, transferring the stress to other areas, driving the crack surrounding area to participate in stress consumption, restraining the further expansion of the crack, and reducing the stress concentration at the crack [37,38,39].
3.2. Time Course Analysis of Impact Force
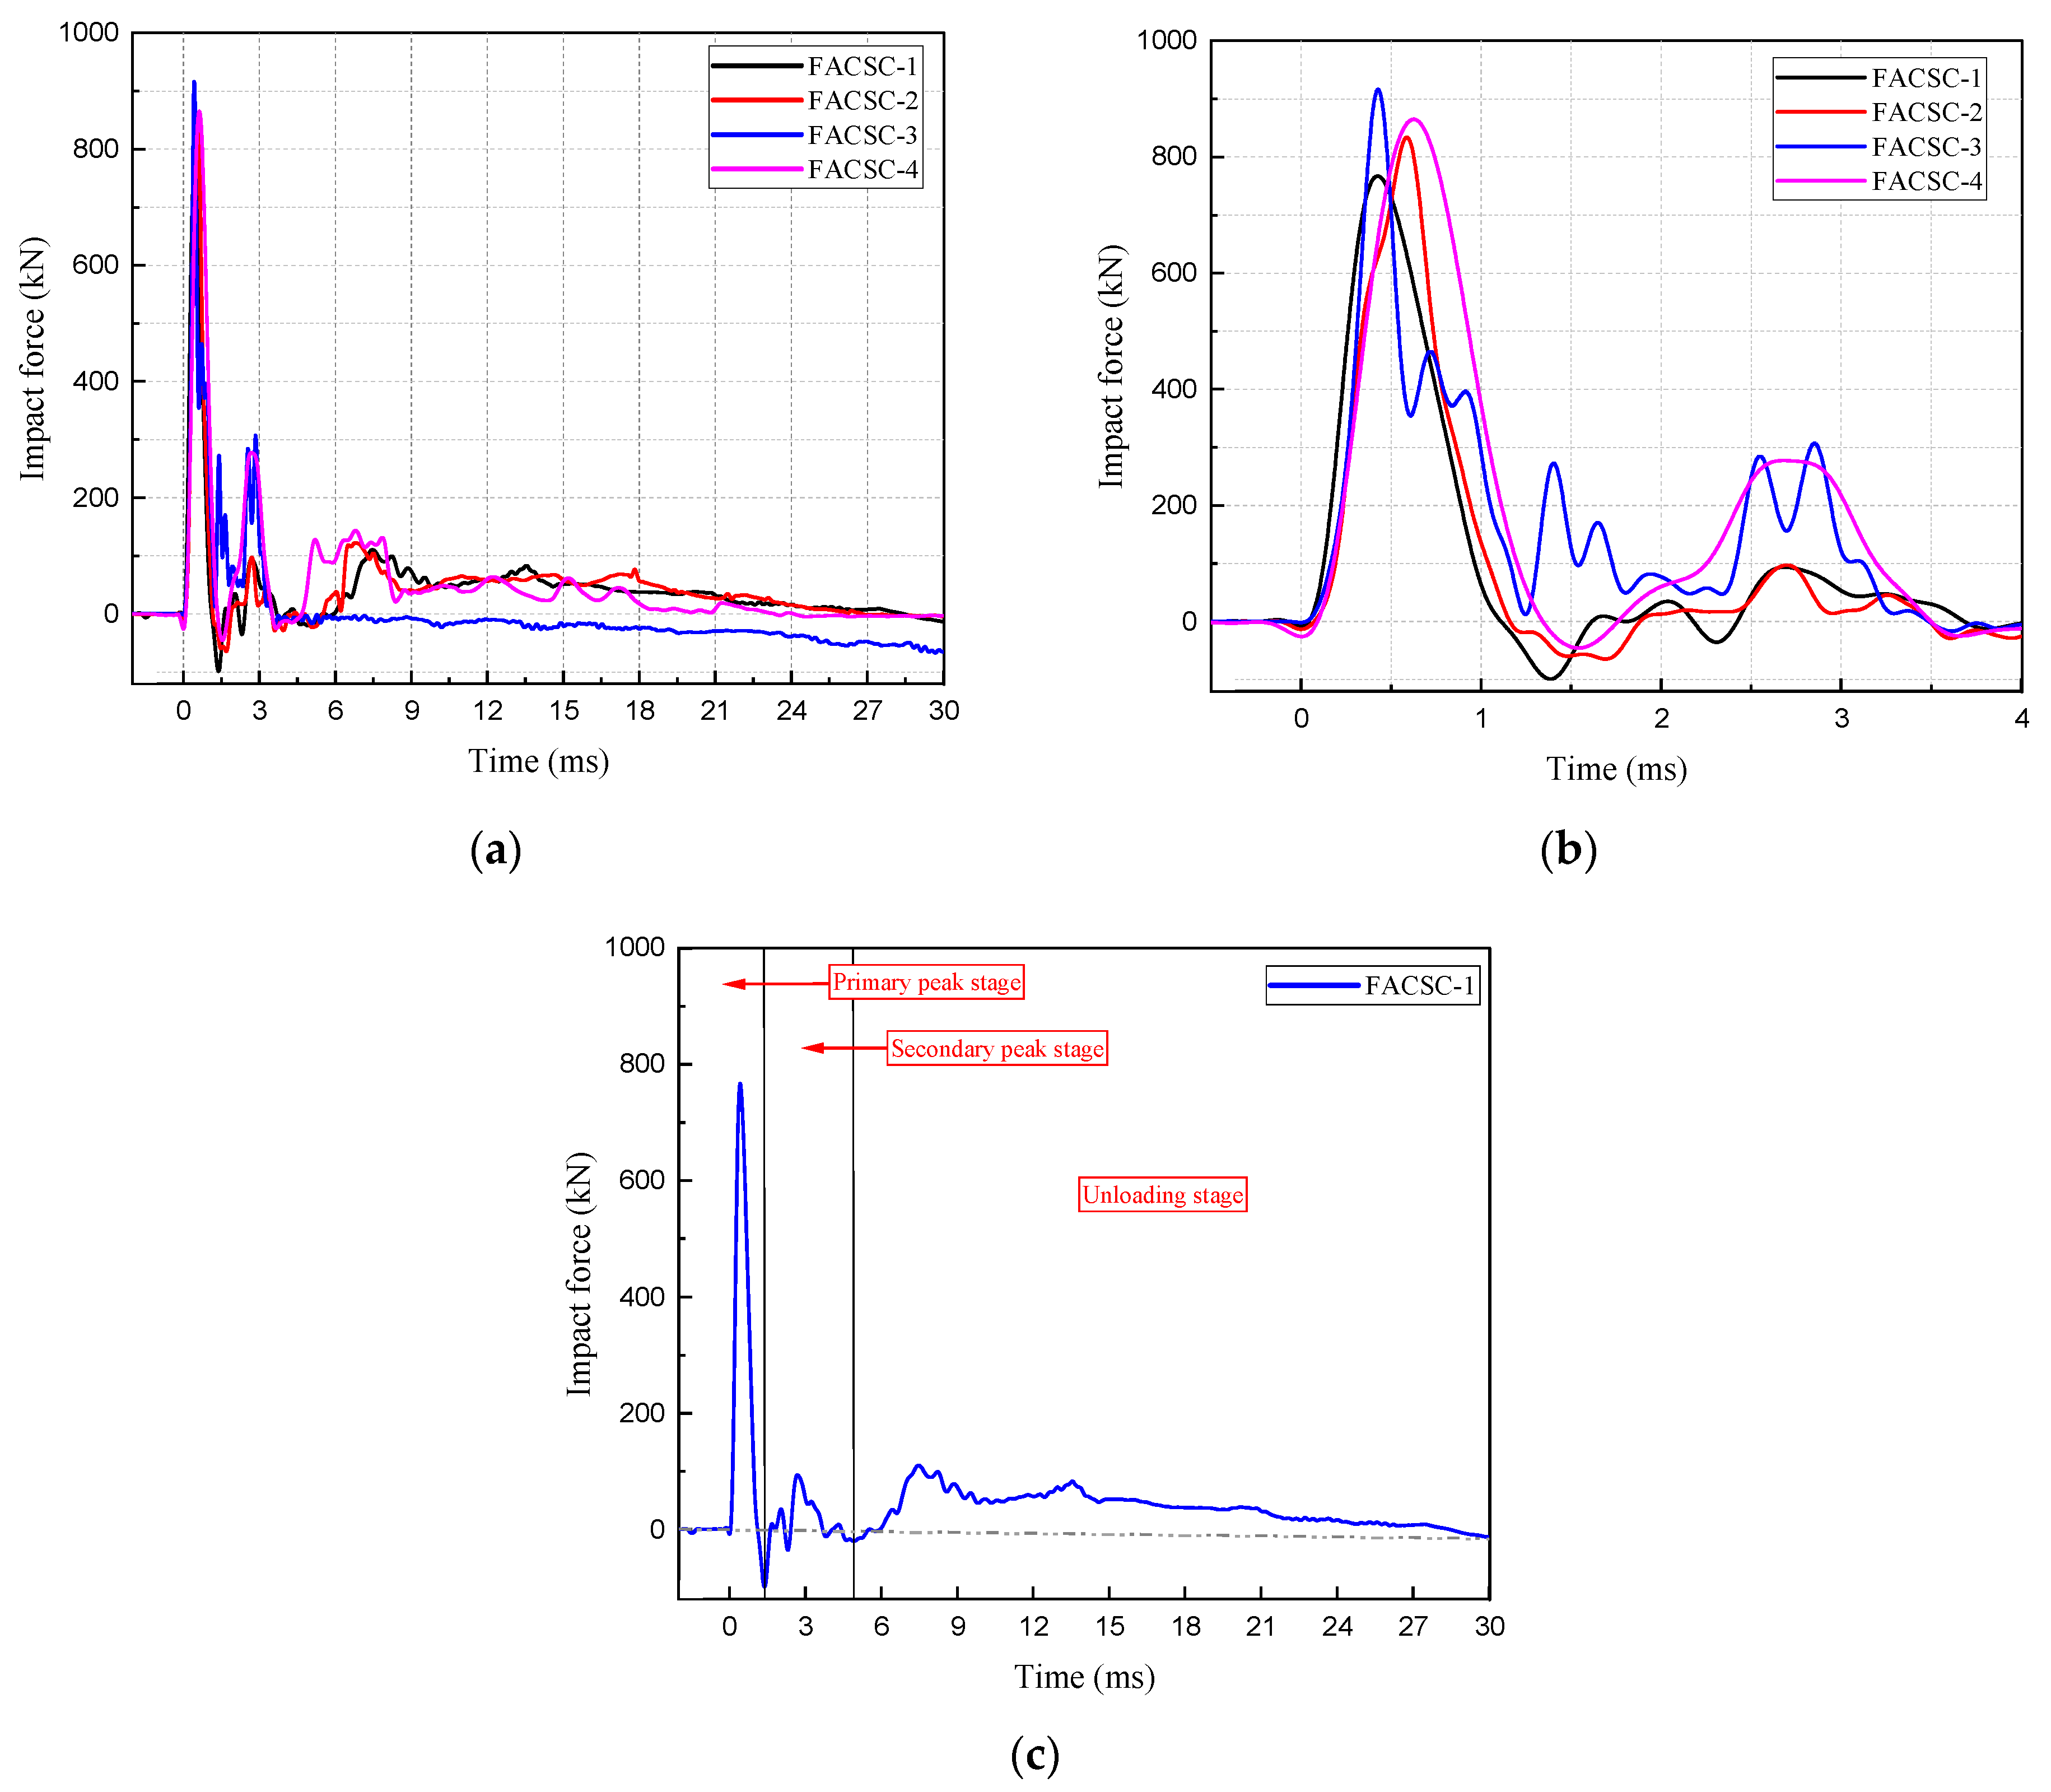
The time history curve of impact force can accurately reflect the specimen’s response under impact load. Information on the strength, stiffness, and failure stage of the specimen can be obtained through this curve. Figure 9a shows the time history curve of the impact force of each specimen under impact obtained from the test, and Figure 9b is a partially enlarged view of Figure 9a from 0 to 4 ms. The specimen FACSC-1 was selected as a typical specimen, and it was observed that the curve development process was roughly divided into the primary peak stage, secondary peak stage, and unloading stage, as shown in Figure 9c. First, when the hammer touches the specimen for the first time, the impact can be released quickly, the impact force instantly climbs to its maximum, and the hammer and the cylinder accelerate downward together. Affected by inertial resistance, the contact between the hammer and the specimen will weaken rapidly and bounce up, and the impact force will drop sharply from the peak to 0, which is the primary peak section. Subsequently, a secondary peak section occurs, and the hammer falls again to contact the cylinder, resulting in a secondary peak. Finally, the hammerhead keeps contact with the cylinder and oscillates up and down, and the impact force gradually decreases and enters the unloading section.
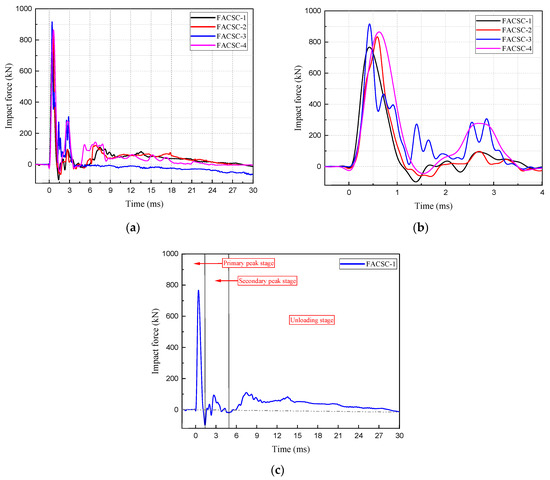
Figure 9.
Impact time-course curves: (a) Impact time-course curves for all specimens; (b) localized magnification of the impact time-course curves from 0–4 ms; (c) impact time-course curves for specimen FACSC-1.
The peak impact force reflects the stiffness of the local contact area between the hammer and the specimen. In general, the greater the stiffness of the specimen, the higher the stress level in the contact area, increasing the peak impact force. It can be observed from Figure 9 that under impact load, the specimens show a main wave pattern with a duration of about 1.5 ms and a secondary wave pattern with a duration of about 2.5 ms. It should be noted that the curve of the FACSC-3 specimen basically stops fluctuating at 3.6 ms and then develops in a horizontal straight-line state. The rest of the specimens stopped fluctuating in about 10 ms and descended in the form of a slow inclined straight line and dropped to 0 scales in about 30 ms, forming an unloading section of impact force. The specimen FACSC-3 stopped fluctuating at 3.6 ms, then decreased slowly and stabilized at a negative value. The main reason is that after the FACSC-3 specimen is impacted twice, the mid-span damage is serious, the contact position of the hammerhead is obviously bent, the center area of the round hammerhead is separated from the concrete, and only the edge of the hammer head is in contact with the length direction of the specimen, which forms a reaction force supporting both ends of the hammerhead, resulting in a negative value, which shows that the size and shape of the hammerhead will have an impact on the test results.
The magnitude of the primary peak and the secondary peak of the four columns and their changing trends are presented in Figure 10, from which it can be seen that with the increase in the axial pressure ratio, the local stiffness of the contact area gradually increases, leading to a gradual increase in the primary peak of the impact force and showing a linear growth trend. When the axial pressure ratio is raised from 0.1 to 0.2, the primary peak of impact force is raised by 8.7%, and the secondary peak is raised by 3.2%; when the axial pressure ratio is raised from 0.2 to 0.3, the primary peak of impact force is raised by about 9.8%, and the rebound occurs in the decreasing section of the primary peak, where the impact force drops to the position of 354 kN, which is due to the large deformation of the specimen when it is subjected to the impact load. This deformation is stored in elastic or plastic form as strain energy. The incomplete release of strain energy formed a rebound force inside the specimen, leading to the specimen’s deformation and energy release again, resulting in the curve rebound phenomenon.
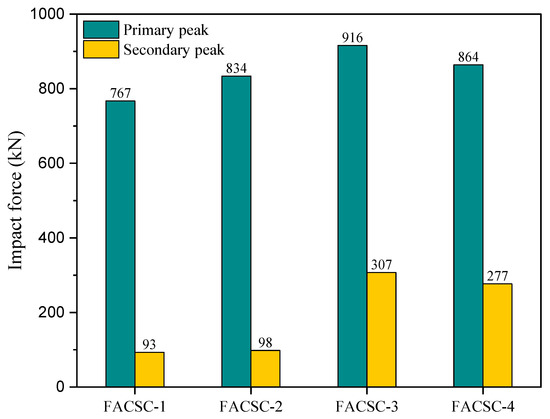
Figure 10.
Comparison of primary and secondary peaks of ALWC columns.
Comparing specimens FACSC-2 and FACSC-4, the primary peak of the specimen with the addition of steel fibers increased by 3.2%, and the secondary peak increased by 186% at the axial compression ratio of 0.2. From the material performance test, it can be seen that the incorporation of steel fibers increased the static axial compressive strength of ALWC by 14.1% and the increase in splitting tensile strength by 33.8%, which means that the low tensile strength of concrete was significantly improved, thus enhancing the load-bearing capacity and crack resistance of concrete under impact, reducing impact damage, and maximizing the retention of member stiffness, prompting the increase of the primary peak and secondary increase in the peak value.
3.3. Acceleration Time Course Analysis
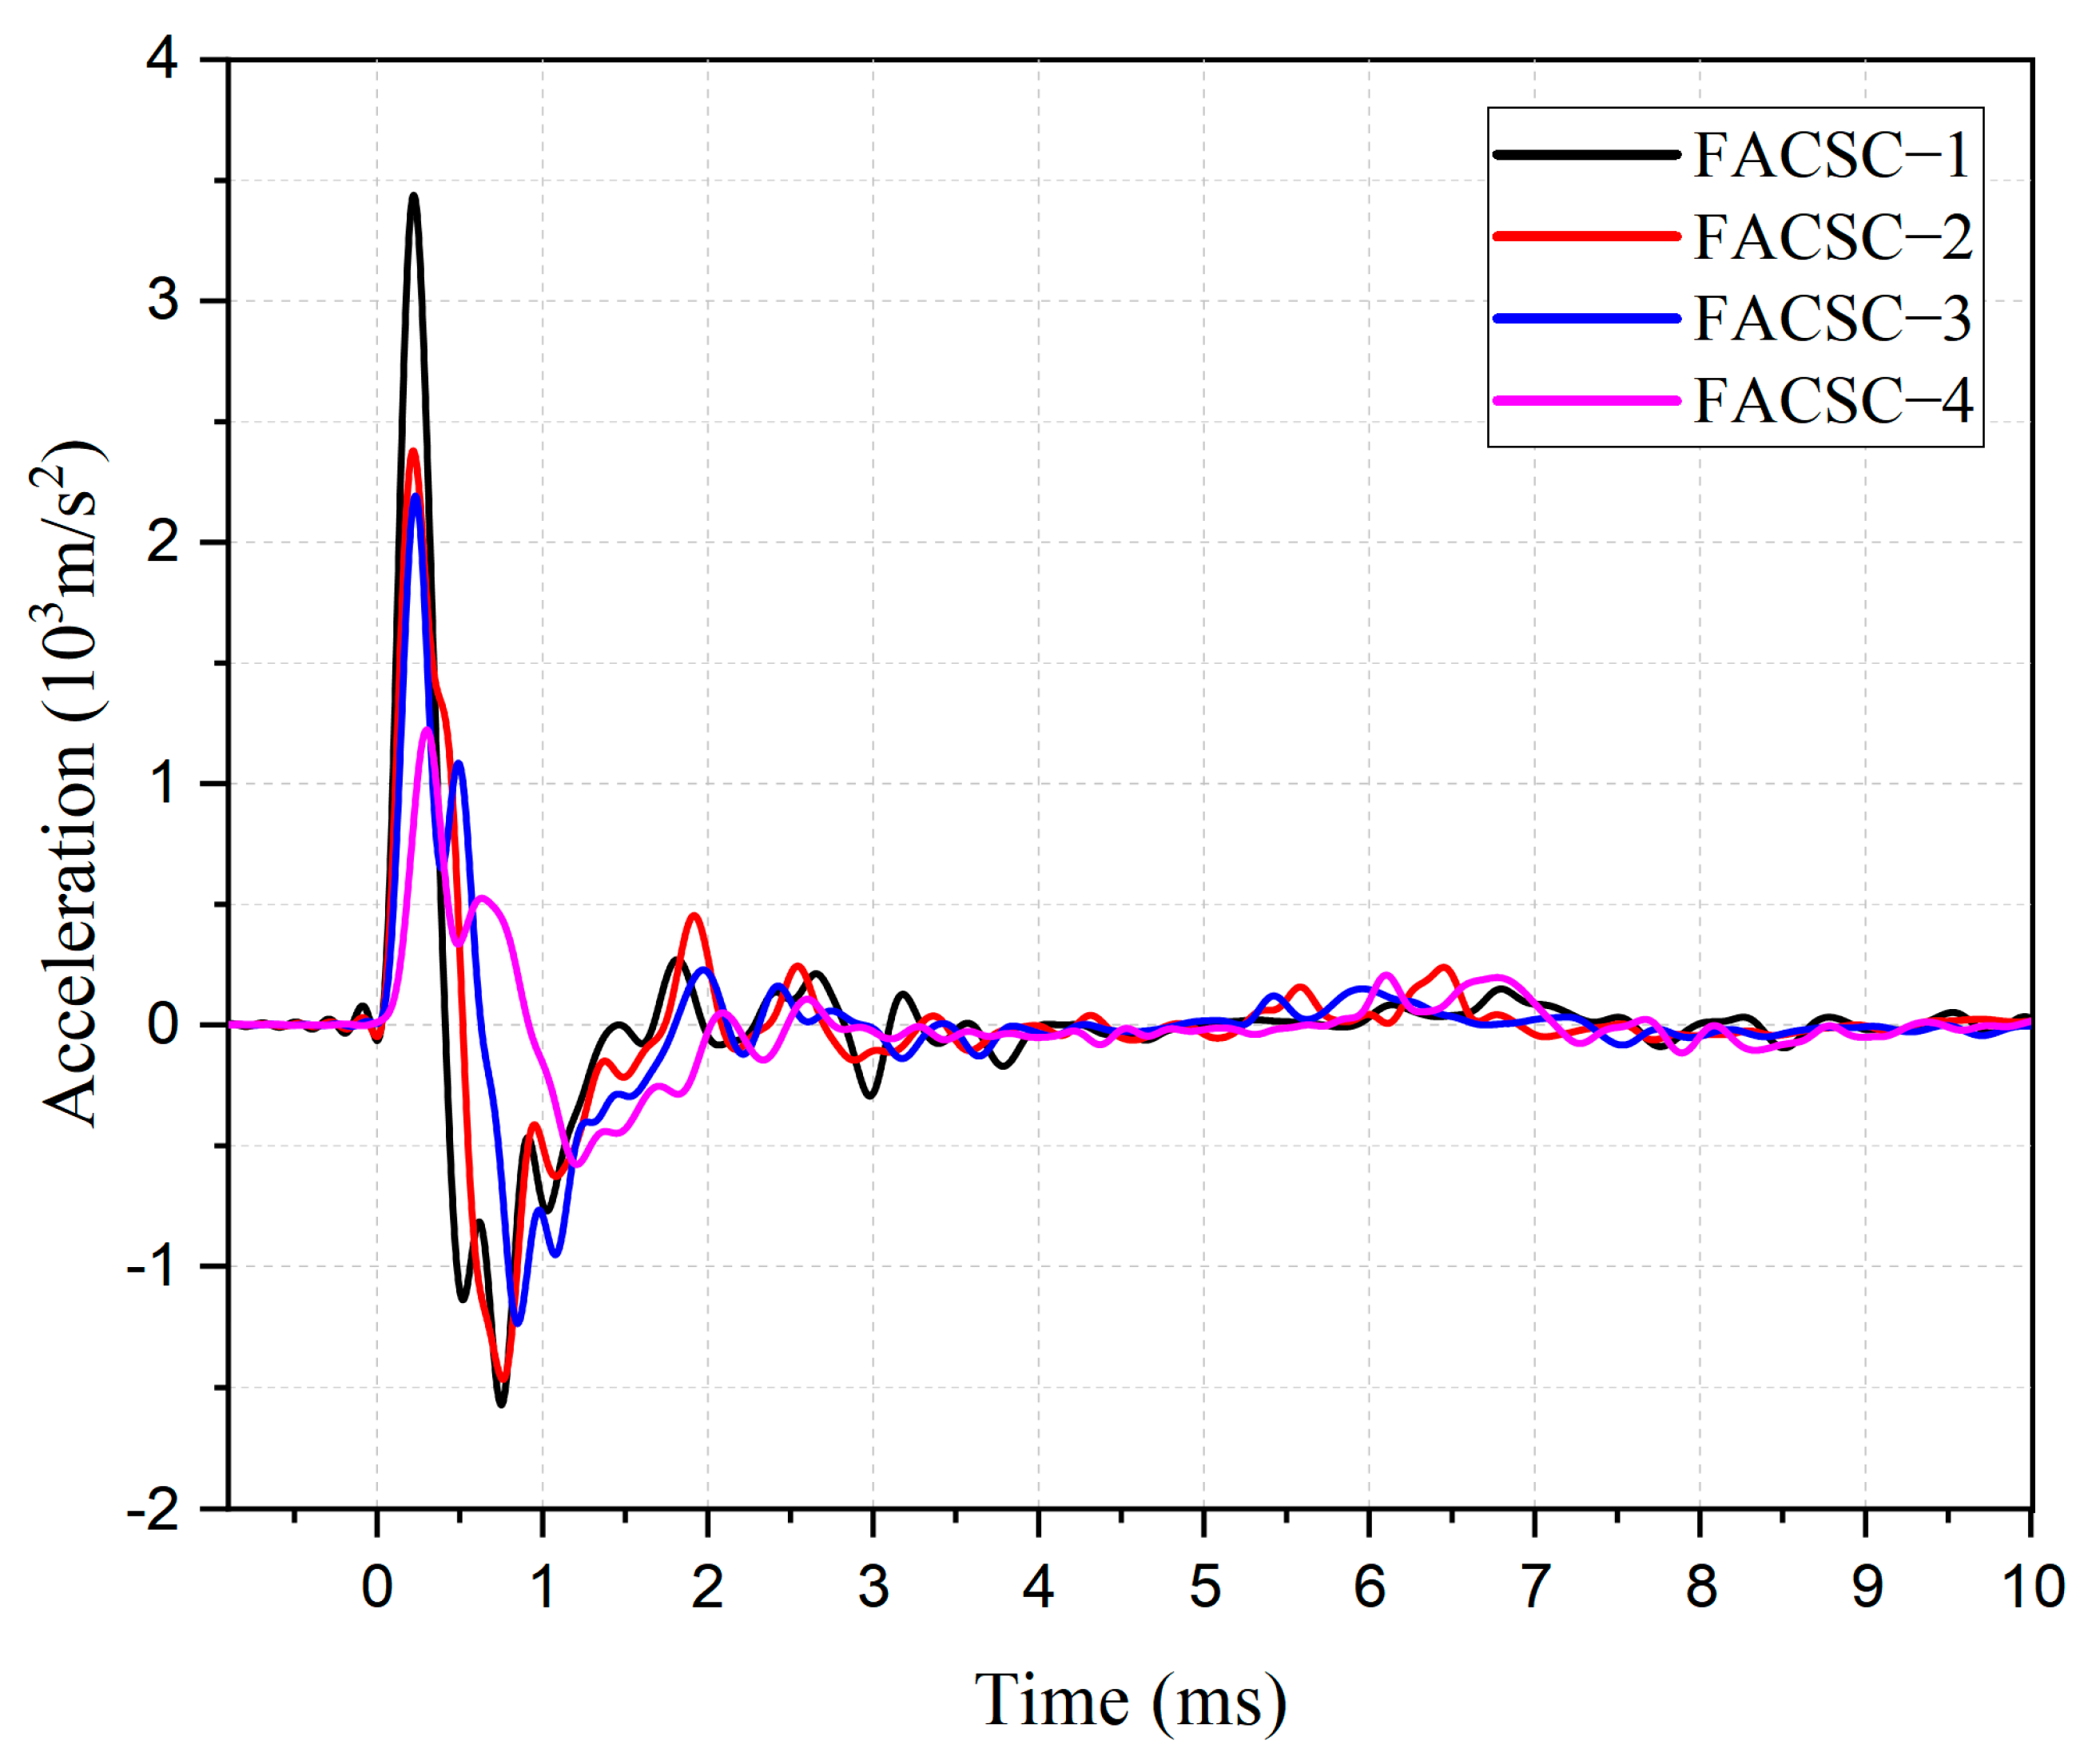
Figure 11 shows the time-course curve of acceleration across the specimen collected by the accelerometer. The acceleration of the specimen rises rapidly from 0 scales and reaches its peak at 0.22 ms. After that, the specimen acceleration drops below the 0 scale and forms a negative peak with a long duration. During the negative peak time, the acceleration undergoes several oscillations and finally rises back toward the 0 scale.
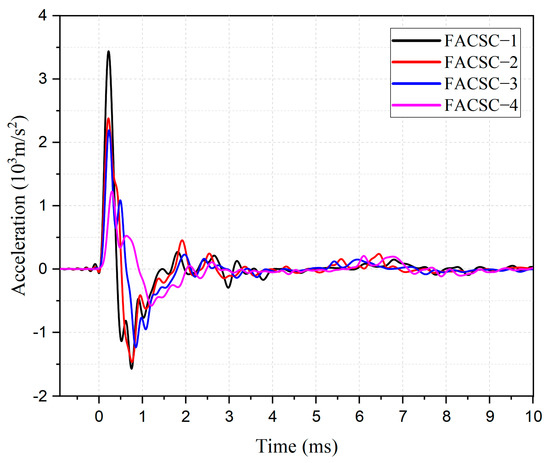
Figure 11.
Acceleration time course curve.
Figure 11 shows that the specimens exhibit a nonlinear change in impact toughness at different axial pressure ratios. When the axial pressure ratio was increased from 0.1 to 0.2, the peak acceleration of the specimen decreased by 30.81%, indicating that increasing the axial pressure ratio could effectively improve the impact toughness of the specimen. However, when the axial pressure ratio was increased from 0.2 to 0.3, the peak acceleration of the specimens decreased by 8.4%, which was significantly smaller, indicating that increasing the axial pressure ratio could improve the impact toughness of the specimens within a certain range. However, when a certain threshold was exceeded, the effect of increasing the axial pressure ratio on the peak acceleration of the specimens became less significant. It should be noted that this conclusion is only based on the data given, and more experimental data are needed to more accurately assess the magnitude of the effect of different axial pressure ratios on the impact toughness of the specimens.
The specimen FACSC-4 reinforced with steel fibers exhibited significant characteristic differences in acceleration time response compared to FACSC-2. The peak acceleration of the specimen was reduced by 48.74%, the time of peak acceleration was significantly delayed, and the oscillation range of the curve was significantly reduced, indicating that the addition of steel fibers could improve the impact resistance of the specimen and the toughness of its internal structure.
3.4. Time History Analysis of Mid-Span Displacement
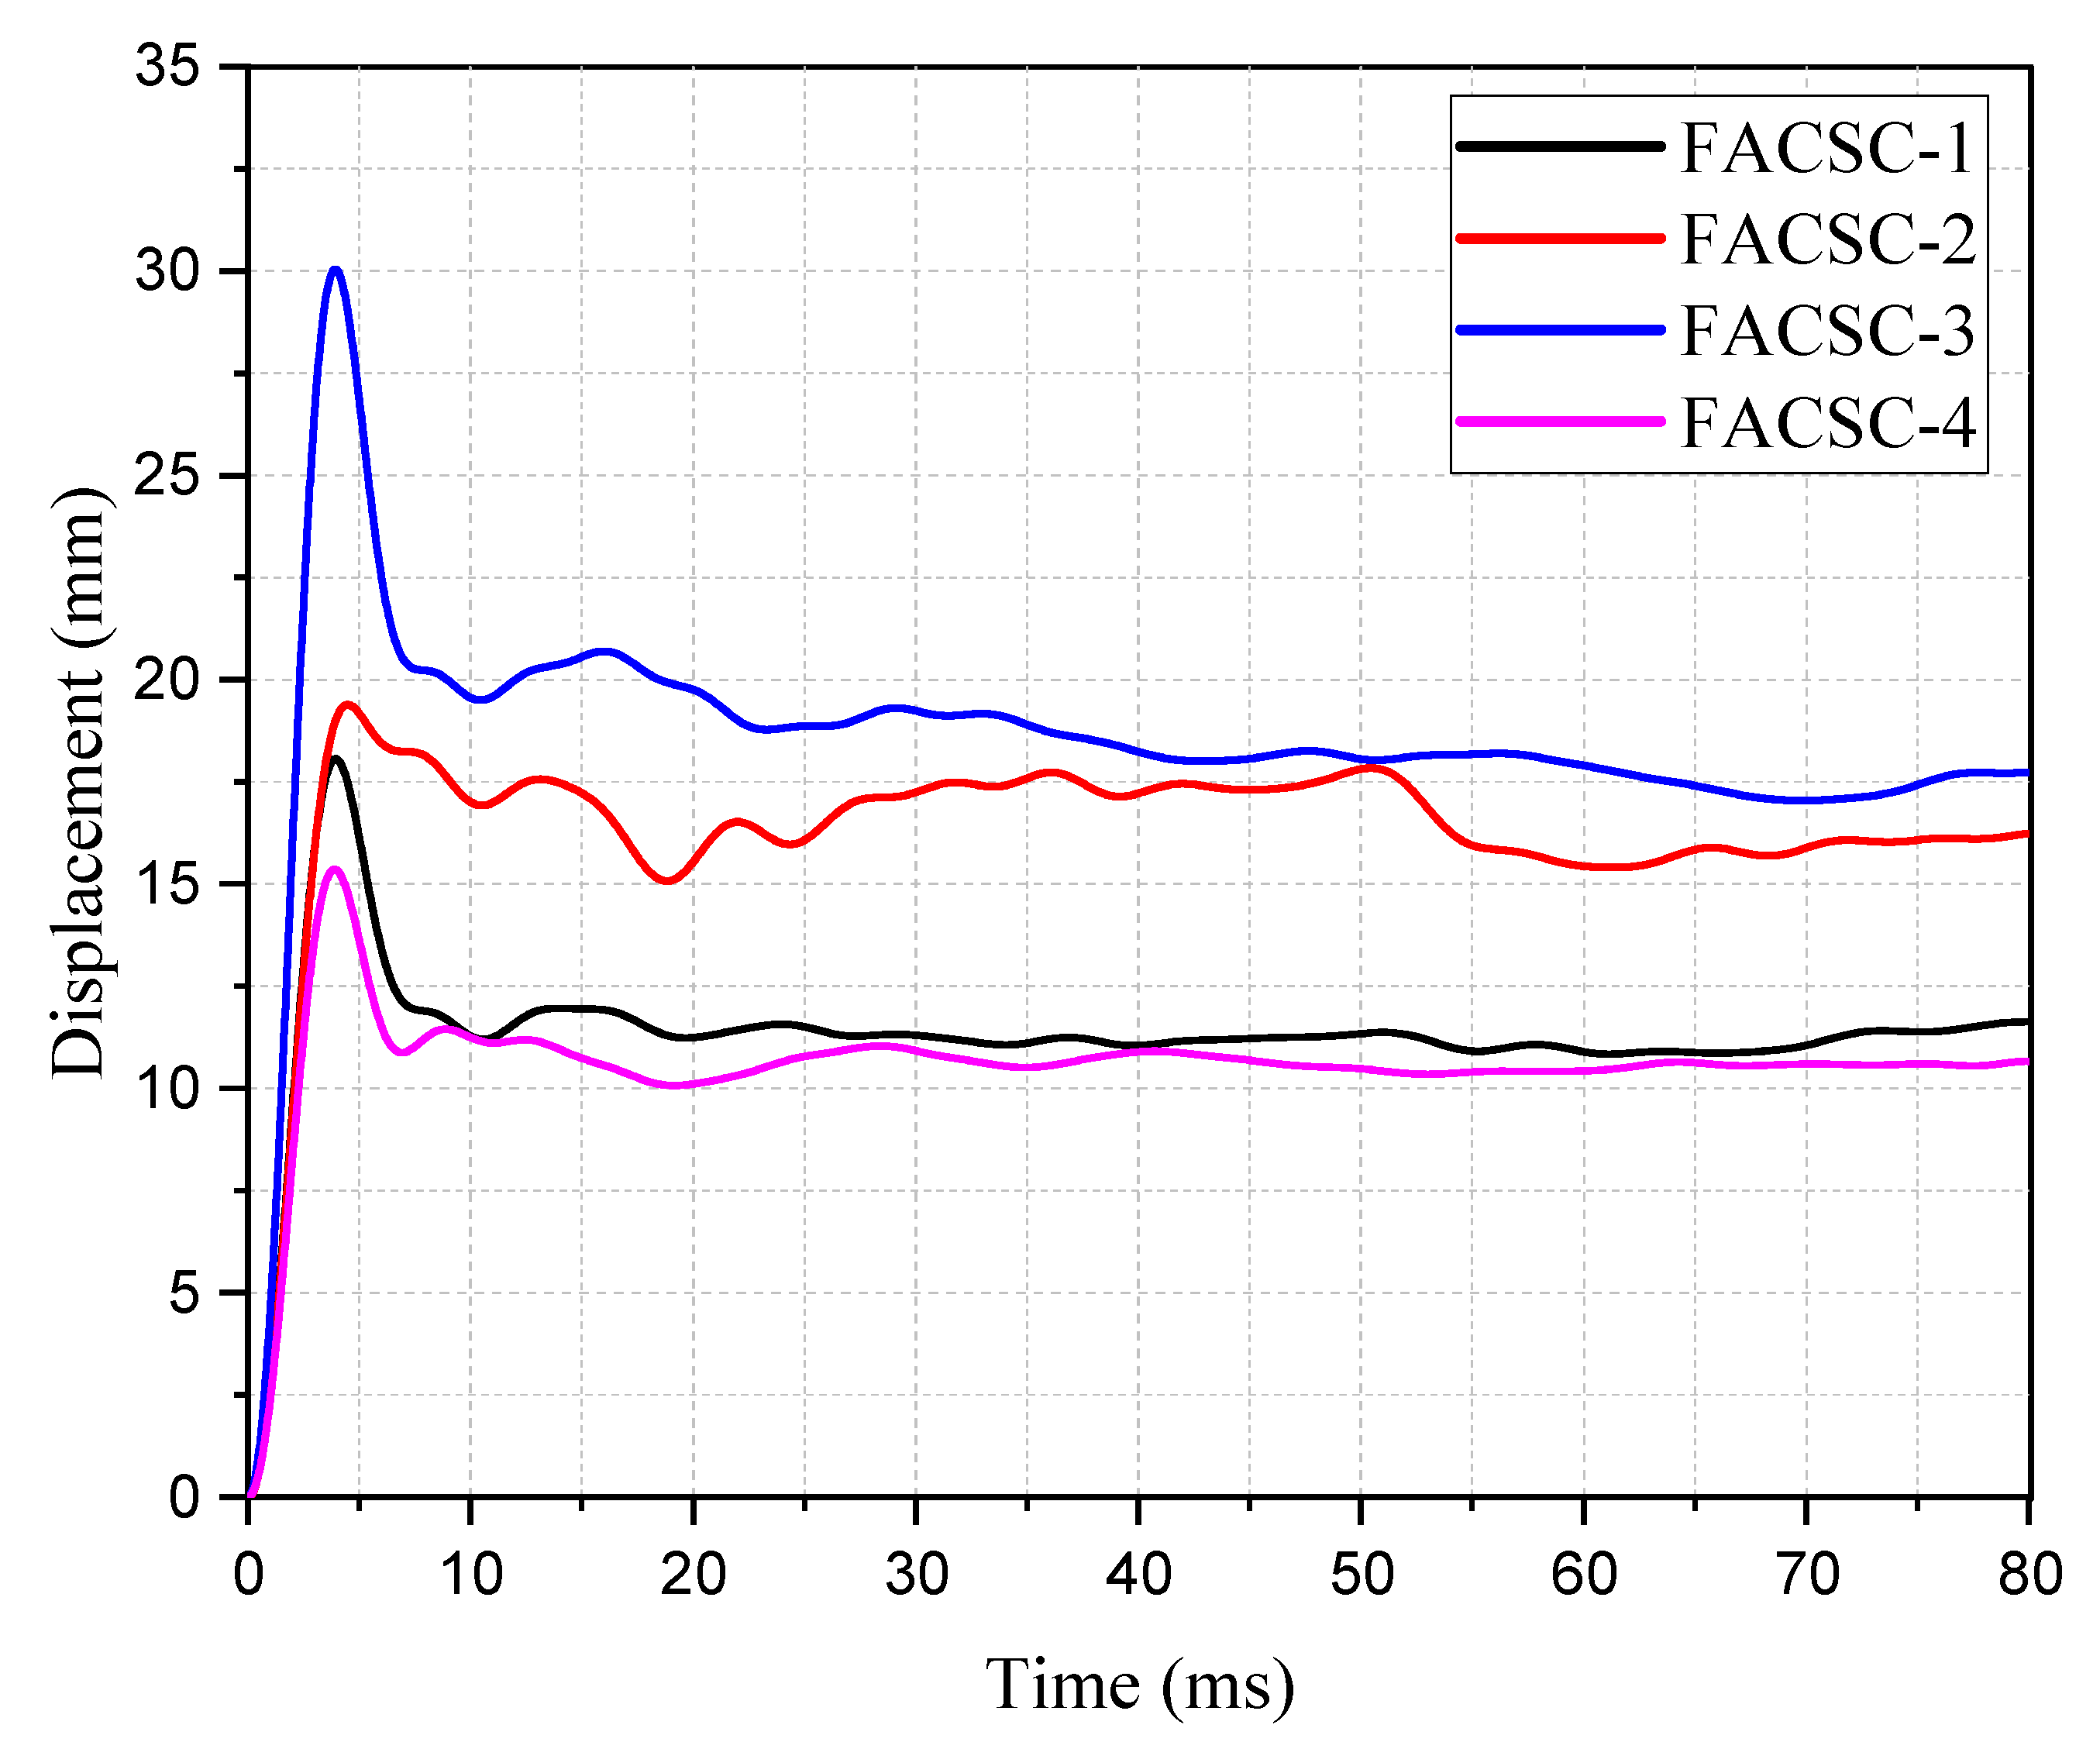
The curve of the spanwise displacement of the specimen obtained from the impact test with time is shown in Figure 12. The curve has the characteristics of sinusoidal development, which contains two parts: the peak displacement phase and the plastic deformation phase. The peak displacement phase reflects the specimen’s maximum deformation amplitude when subjected to impact loading. The plastic deformation stage reflects the process of free vibration of the specimen after eliminating the external force relying on inertia.

Figure 12.
Mid-span displacement time course curve.
According to the information in Figure 9 and Figure 12, the peak displacement stage can be further divided into two stages: the elastic deformation stage and the transitional deformation stage. The specimen shows a local response mode in the primary peak stage of the impact force, and the deformation response in the span is relatively small, mainly relying on its own stiffness and inertia force to resist the impact load, which indicates that the specimen is in the elastic deformation stage. With time, the impact load on the specimen continuously oscillates and decays. The specimen is transformed from the local response mode to the overall response mode, in which the deformation of the specimen is gradually transformed from elastic deformation to plastic deformation. This process is called the transitional deformation stage. At a moment of 5 ms, the impact force develops toward the unloading stage, and the hammerhead and the specimen maintain contact and move together. In contrast, the deflection deformation of the specimen reaches the maximum and springs back toward the equilibrium state. At this stage, the displacement effect of the impact load on the specimen has been largely eliminated, and the specimen enters the plastic deformation stage.
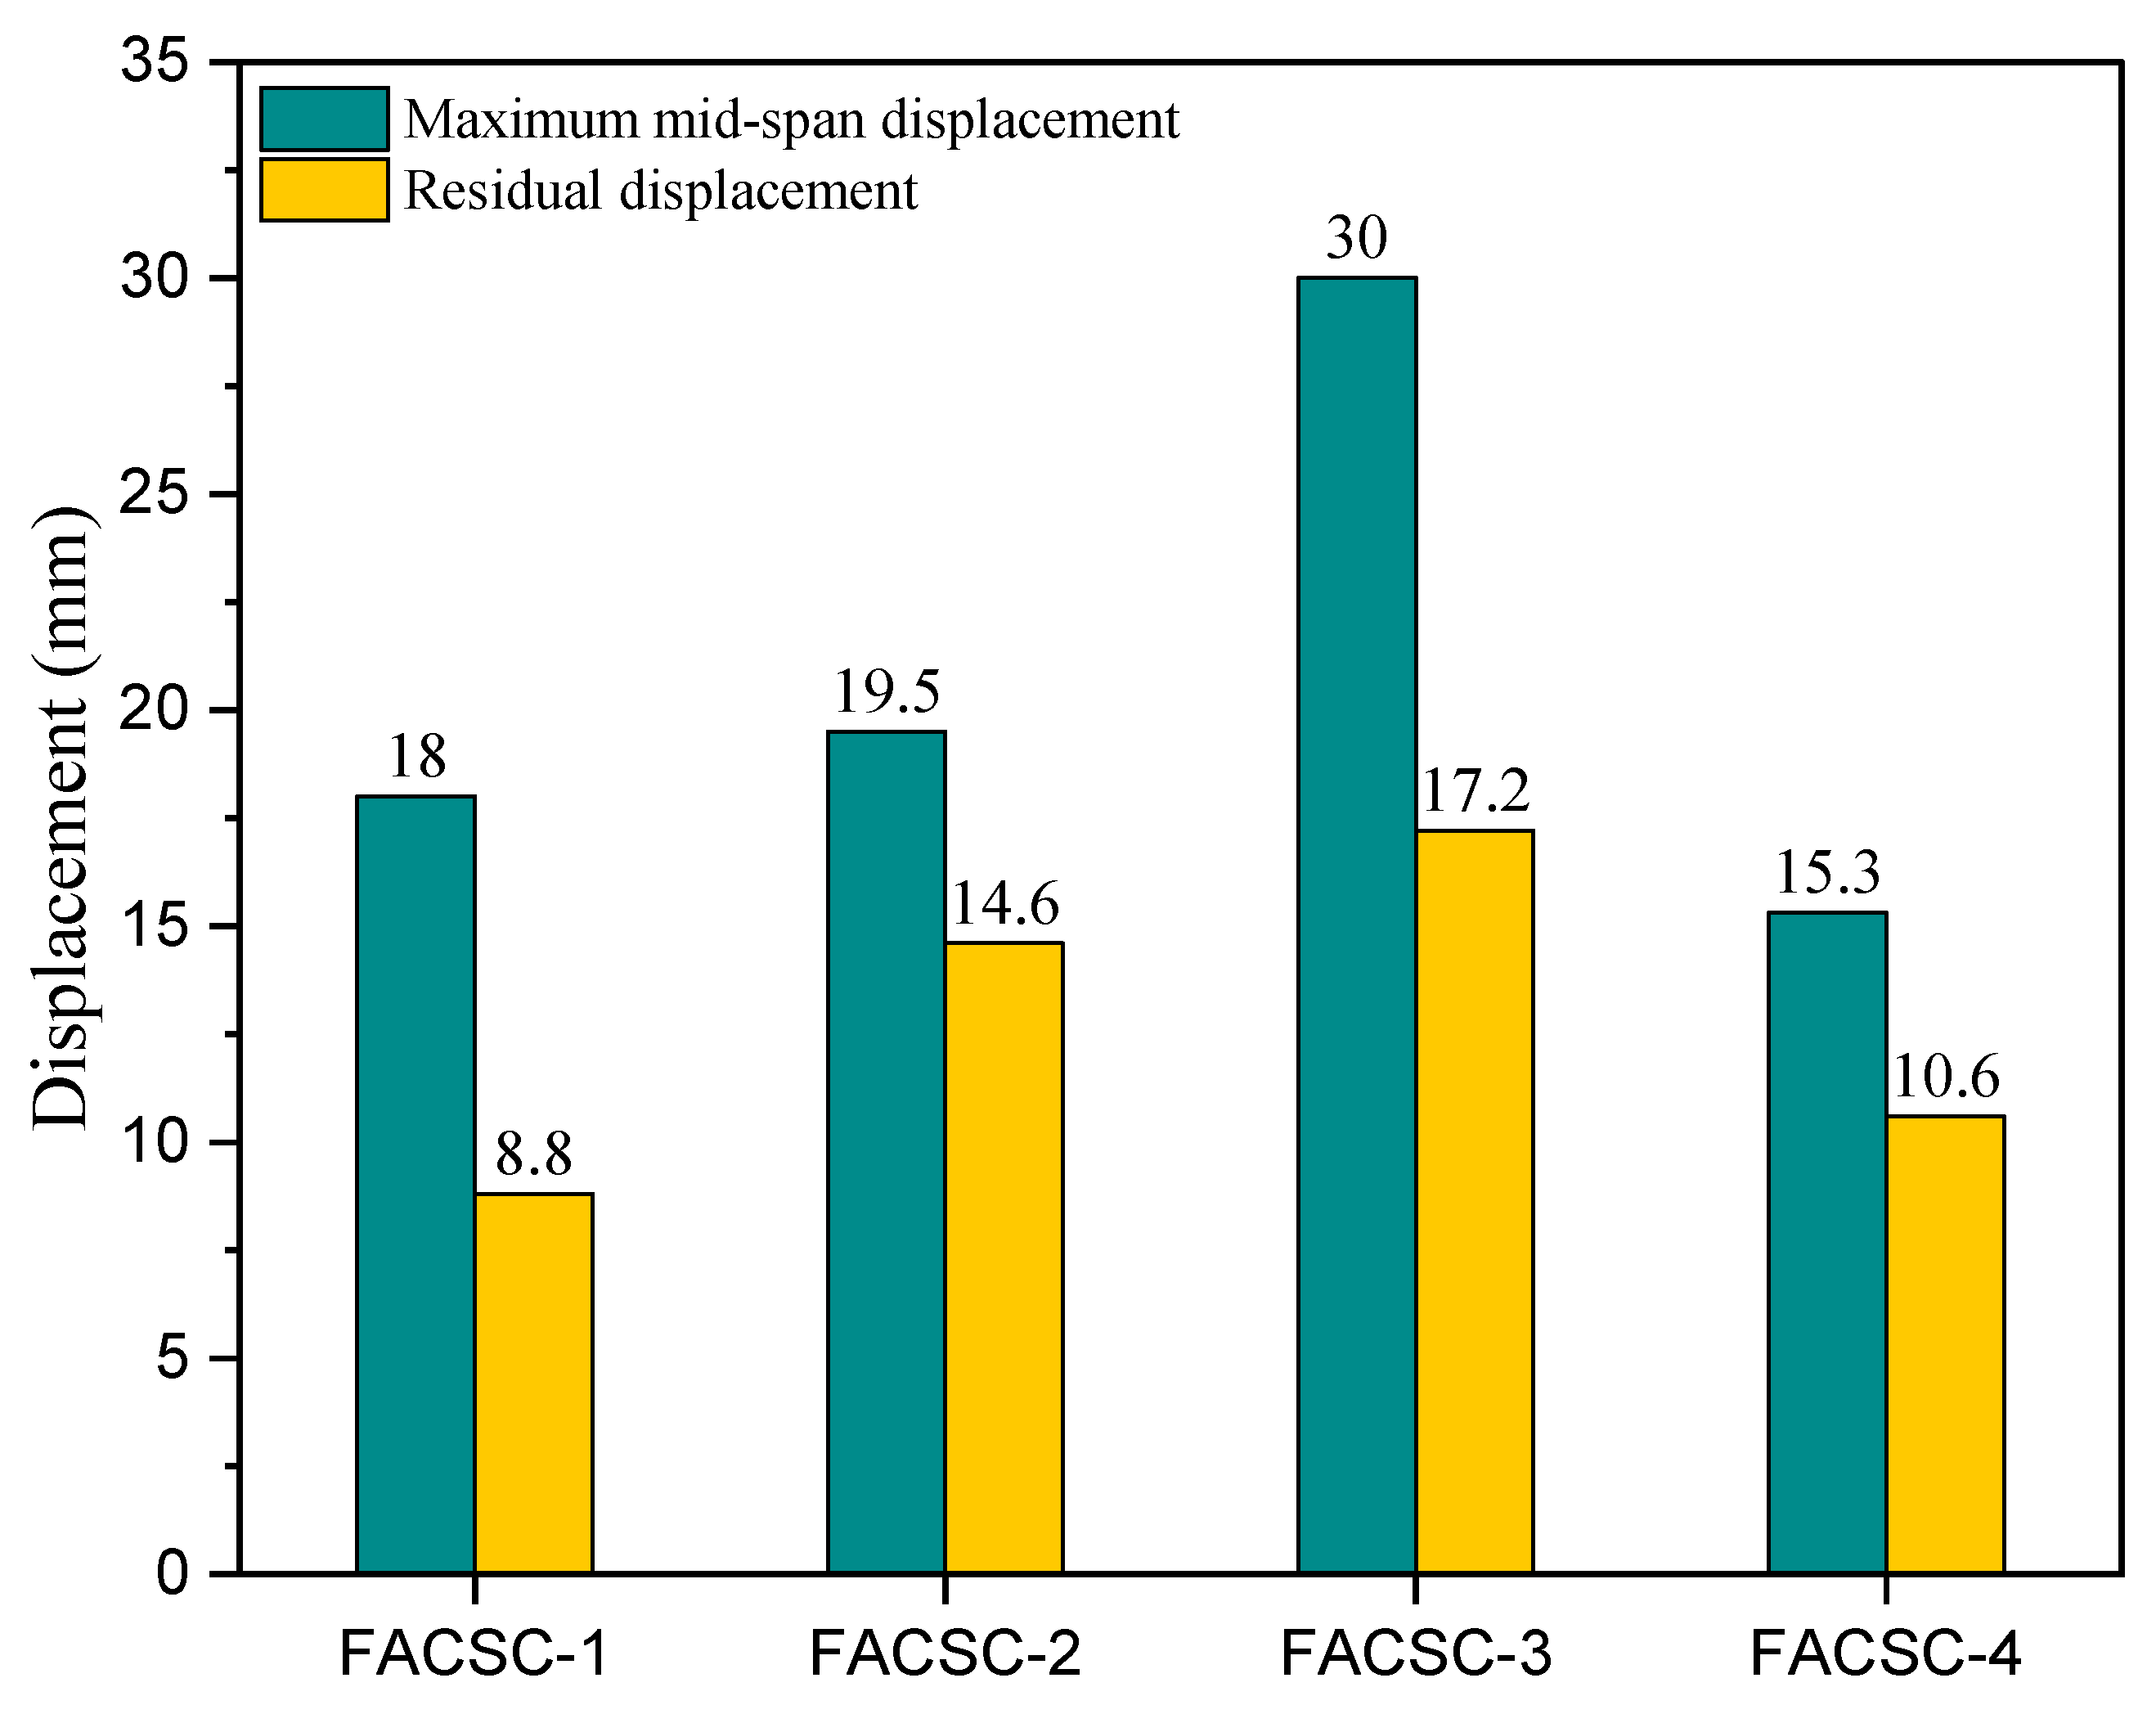
The data in Figure 13 shows that when the axial pressure ratio increases from 0.1 to 0.2, the maximum displacement in the span increases by 8.3% and the residual displacement increases by 65.9%; when the axial pressure ratio increases from 0.2 to 0.3, the maximum displacement in the span increases by 53.8% and the residual displacement increases by 17.8%. The results show that the maximum displacement in the span increases nonlinearly with the increase of the axial compression ratio. From the damage morphology of the specimens, the overall damage in the net span range of FACSC-2 is serious. In contrast, the damage of FACSC-1 and FACSC-3 is biased toward the local damage in the span. This may be the main reason for the large amplitude of curve oscillation of specimen FACSC-2 and the difficulty in recovering toward the pre-deformation.

Figure 13.
Comparison of maximum and residual displacements in the mid-span.
More studies have shown that an appropriate axial load can improve its stiffness and damping and effectively reduce the displacement amplitude of the specimen when subjected to impact loading. In this test, an increase in the axial compression ratio led to an increase in the displacement deflection of the ALWC column, which may be due to the P-δ effect causing a decrease in the overall stiffness of the structure, which in turn leads to greater deformation or instability of the structure. Therefore, when using ALWC materials as structural materials, attention needs to be paid to the effect of axial loading on its strength and toughness to ensure that the structure has adequate impact resistance and stability under impact loading.
The failure degree of the FACSC-4 specimen is relatively light. There is no large amplitude in the plastic deformation stage of the specimen’s mid-span displacement time history curve, and it stops oscillating at about 170 ms. This shows that FACSC-4 has higher residual stiffness and bearing capacity after being subjected to impact load and can eliminate inertia force caused by the inertia effect faster. Compared with FACSC-2, the maximum displacement and residual displacement of FACSC-4 decrease by 21.5% and 27.4%, respectively, which indicates that steel fiber can significantly improve the impact resistance of specimens and improve the brittle failure characteristics of specimens.
3.5. Dynamic Strain Time Analysis
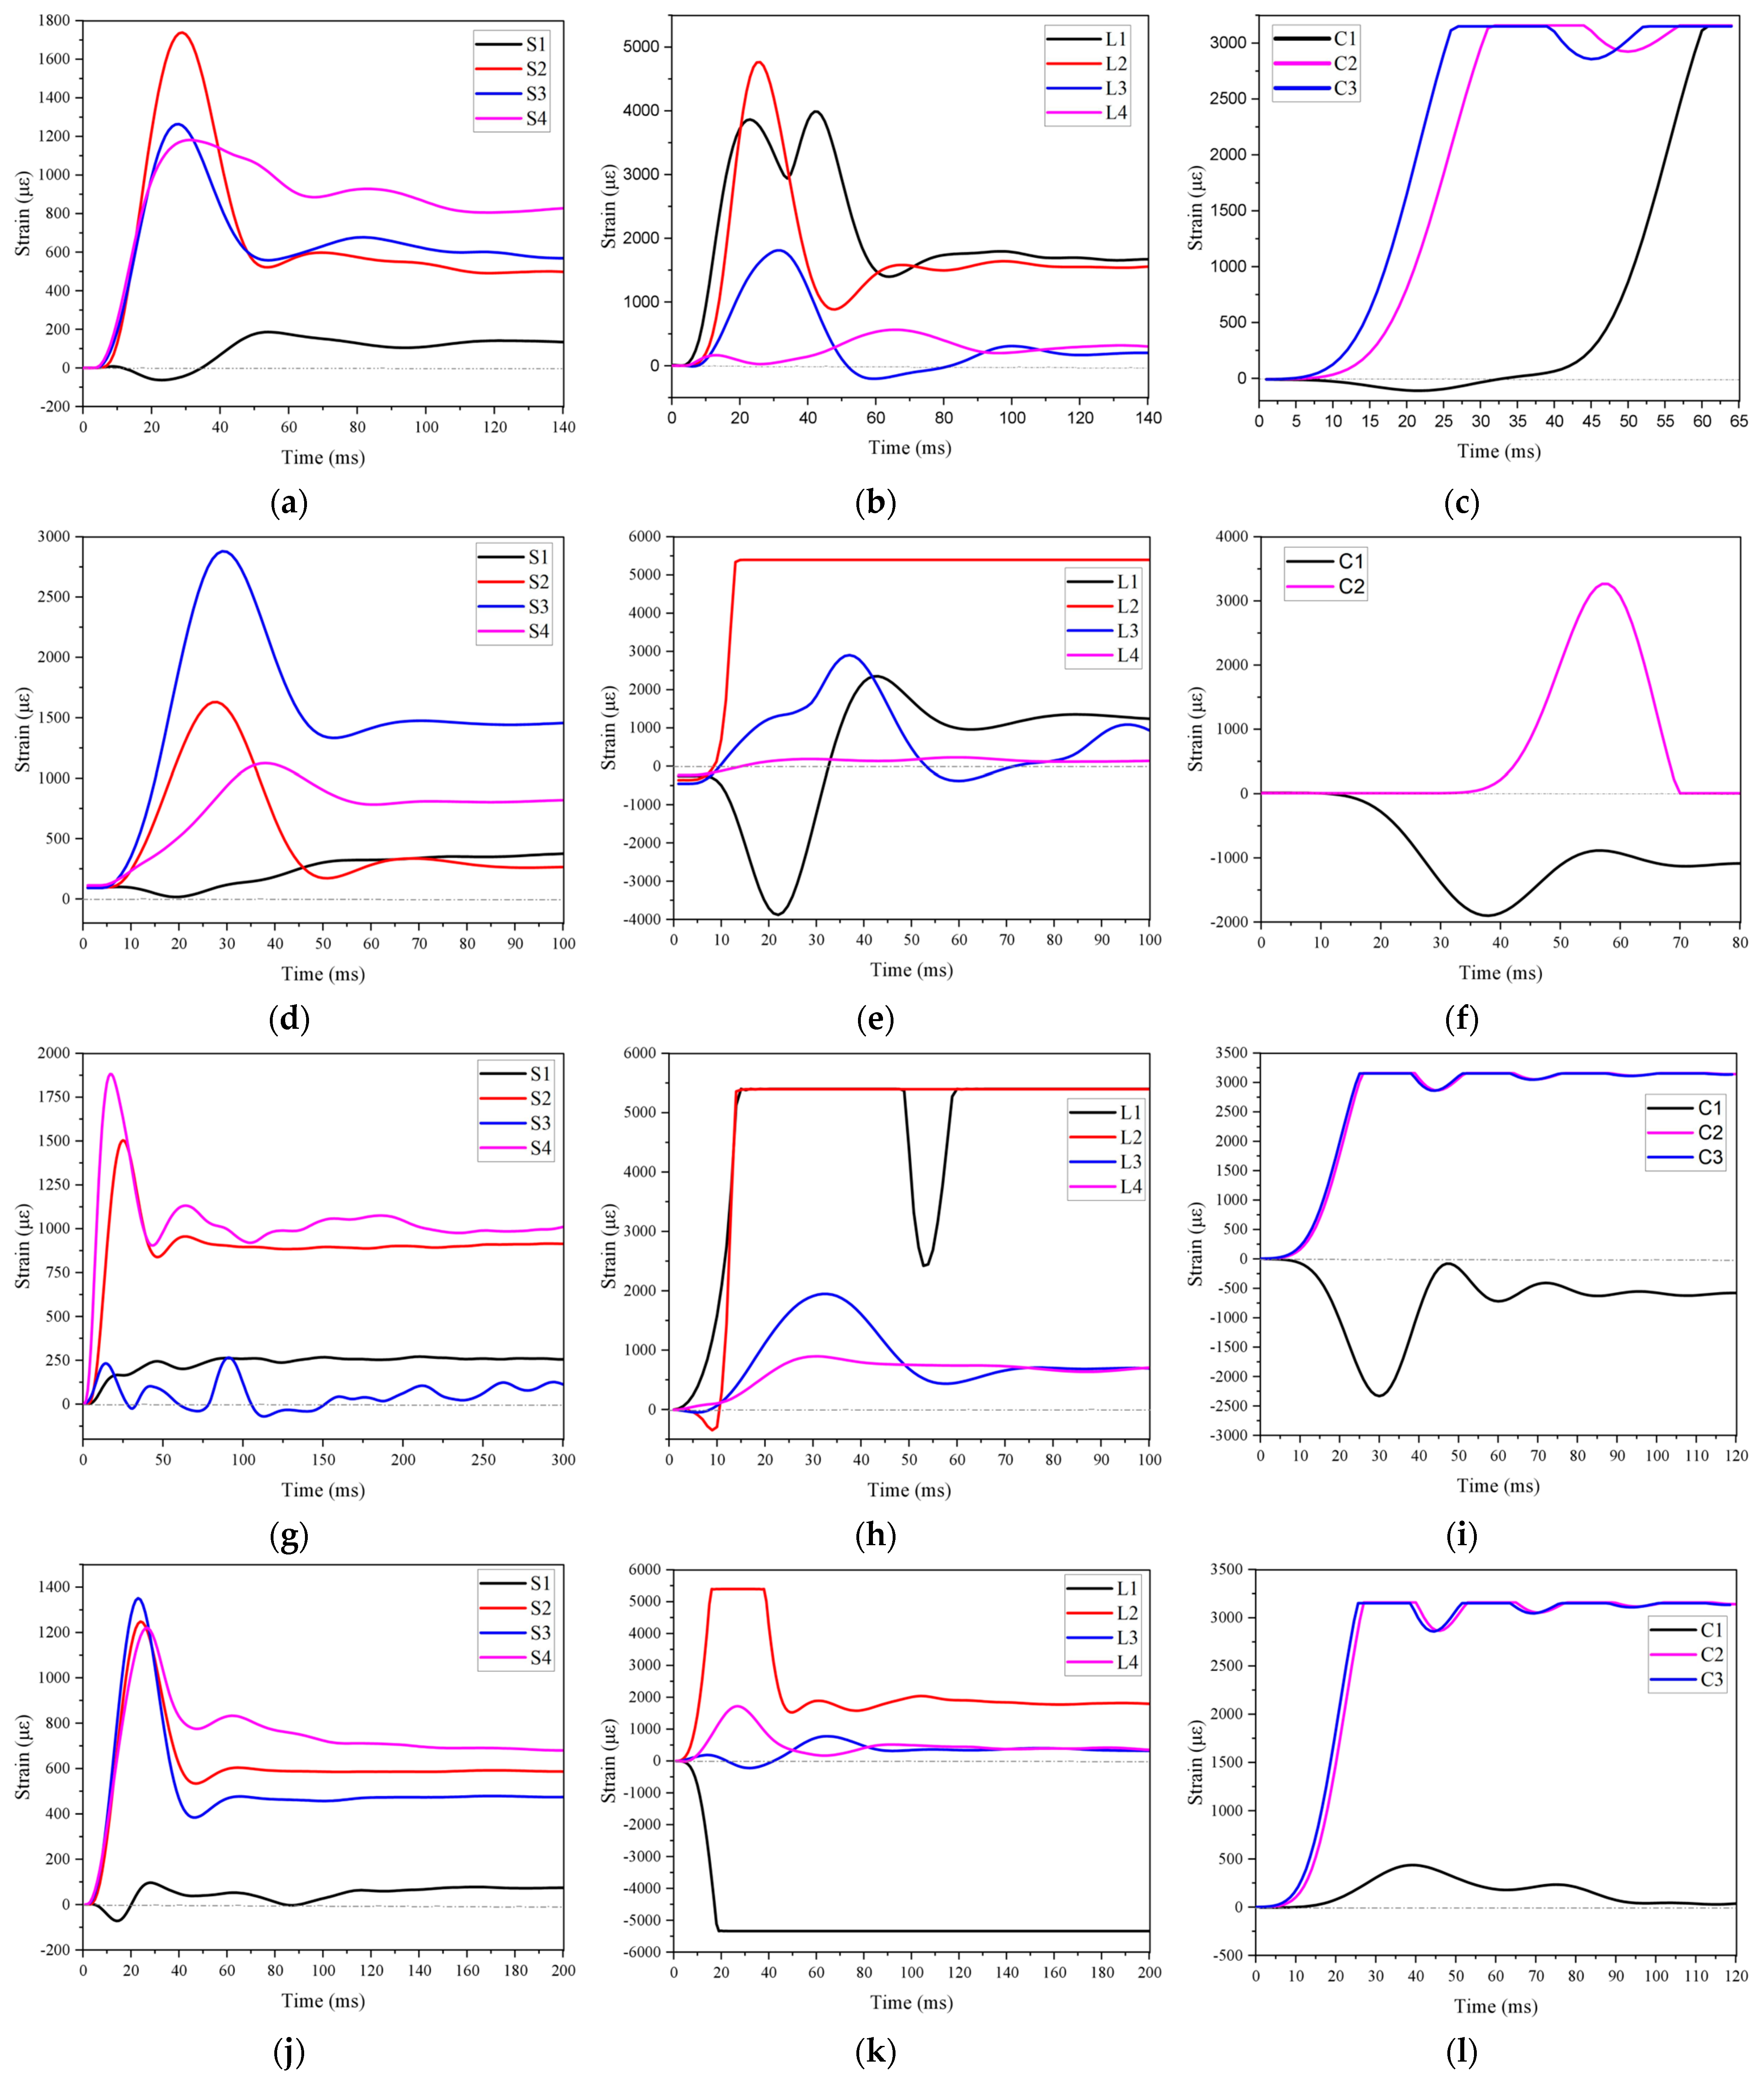
The steel and concrete strain curves are shown in Figure 14. Positive values indicate tension and negative values indicate compression. Because the drop hammer impact test is a rapid loading test method, a large amount of energy will be released in a very short time, causing a large impact load on the specimen, and the strain at the location of the strain gauge will increase sharply, which may lead to the failure or failure of some strain gauges.
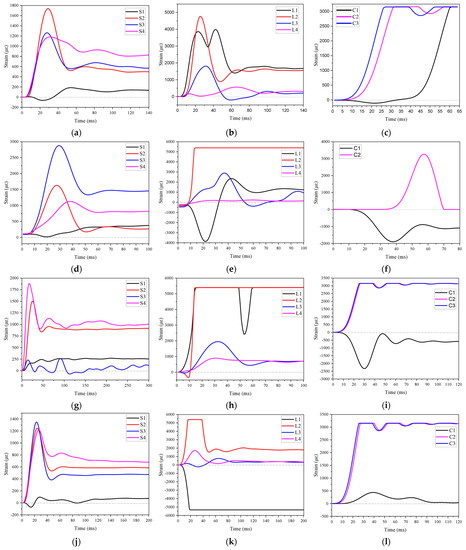
Figure 14.
The strain curve of steel bar and concrete: (a–c) is the dynamic strain time history of specimen FACSC-1; (d–f) is the dynamic strain time history of specimen FACSC-2; (g–i) is the dynamic strain time history of specimen FACSC-3; (j–l) is the dynamic strain time history of specimen FACSC-4.
By observing Figure 14, it can be found that when subjected to impact, the stirrup bears transverse shear stress, and the longitudinal steel bar shares the overall bending formed by the impact load through tension and compression. The strain value of the longitudinal steel bar is much higher than that of the stirrup. In addition, due to the greater compression and shear stress on the concrete at the mid-span, the strain of the longitudinal reinforcement in this area is more significant. By comparing the changes in the stirrup strain of the specimen, it is found that with the increase of the axial compression ratio, the stress distribution of the concrete inside the specimen will gradually shift to the mid-span position, resulting in the strain value of the stirrup on the cross-section of the specimen gradually increasing to the mid-span.
Observing the strains of the hoop reinforcement, it was found that due to the end restraint of the specimens by the fixtures, the strain at the S1 position varied less over time, and the hoop reinforcement at that location did not reach the yield strength. Under the impact loading, the strains generated by S2, S3, and S4 quickly exceeded the material’s yield strength over time and underwent a rapid growth process, eventually reaching a peak value. This process can be described as the material rapidly entering the inelastic deformation region after being externally excited, followed by continuous plastic yielding and sustained plastic deformation until it reaches the maximum load-carrying capacity. As the impact loading weakened or disappeared, a rapid decrease in strain occurred, referred to as the stress-release process experienced by the reinforcement. Finally, at the end of the impact, even in the absence of external forces, the hoop reinforcement still exhibited significant residual strains. This phenomenon indicates that the reinforcement has transitioned to a nonlinear stress state, where its stress behavior no longer conforms to the description of linear elasticity theory.
Observations from Figure 14 indicate the occurrence of a significant stress surge in the longitudinal strain gauges L1 and L2 during the initial loading phase of the experiment. Even at the conclusion of the impact force, both L1 and L2 exhibit considerable residual strain, signifying substantial yielding and plastic deformation in the longitudinal reinforcement at these respective locations. Conversely, the residual strain in strain gauges L3 and L4 is exceedingly small, even approaching zero.
The impact wave on the concrete induces instantaneous peak tensile and compressive stresses and lateral expansion within an extremely short timeframe. Notably, the electrical signals in regions C2 and C3 experience a sudden and substantial increase during the changing process, surpassing the upper limit of the measurement device’s range. This is attributed to the occurrence of penetrating concrete cracks from bottom to top in the tensioned region at the mid-span. However, these penetrating cracks do not propagate to the location of C1. Consequently, the strain measured at C1 is relatively small, indicating a compressive state.
3.6. Energy Dissipation Analysis
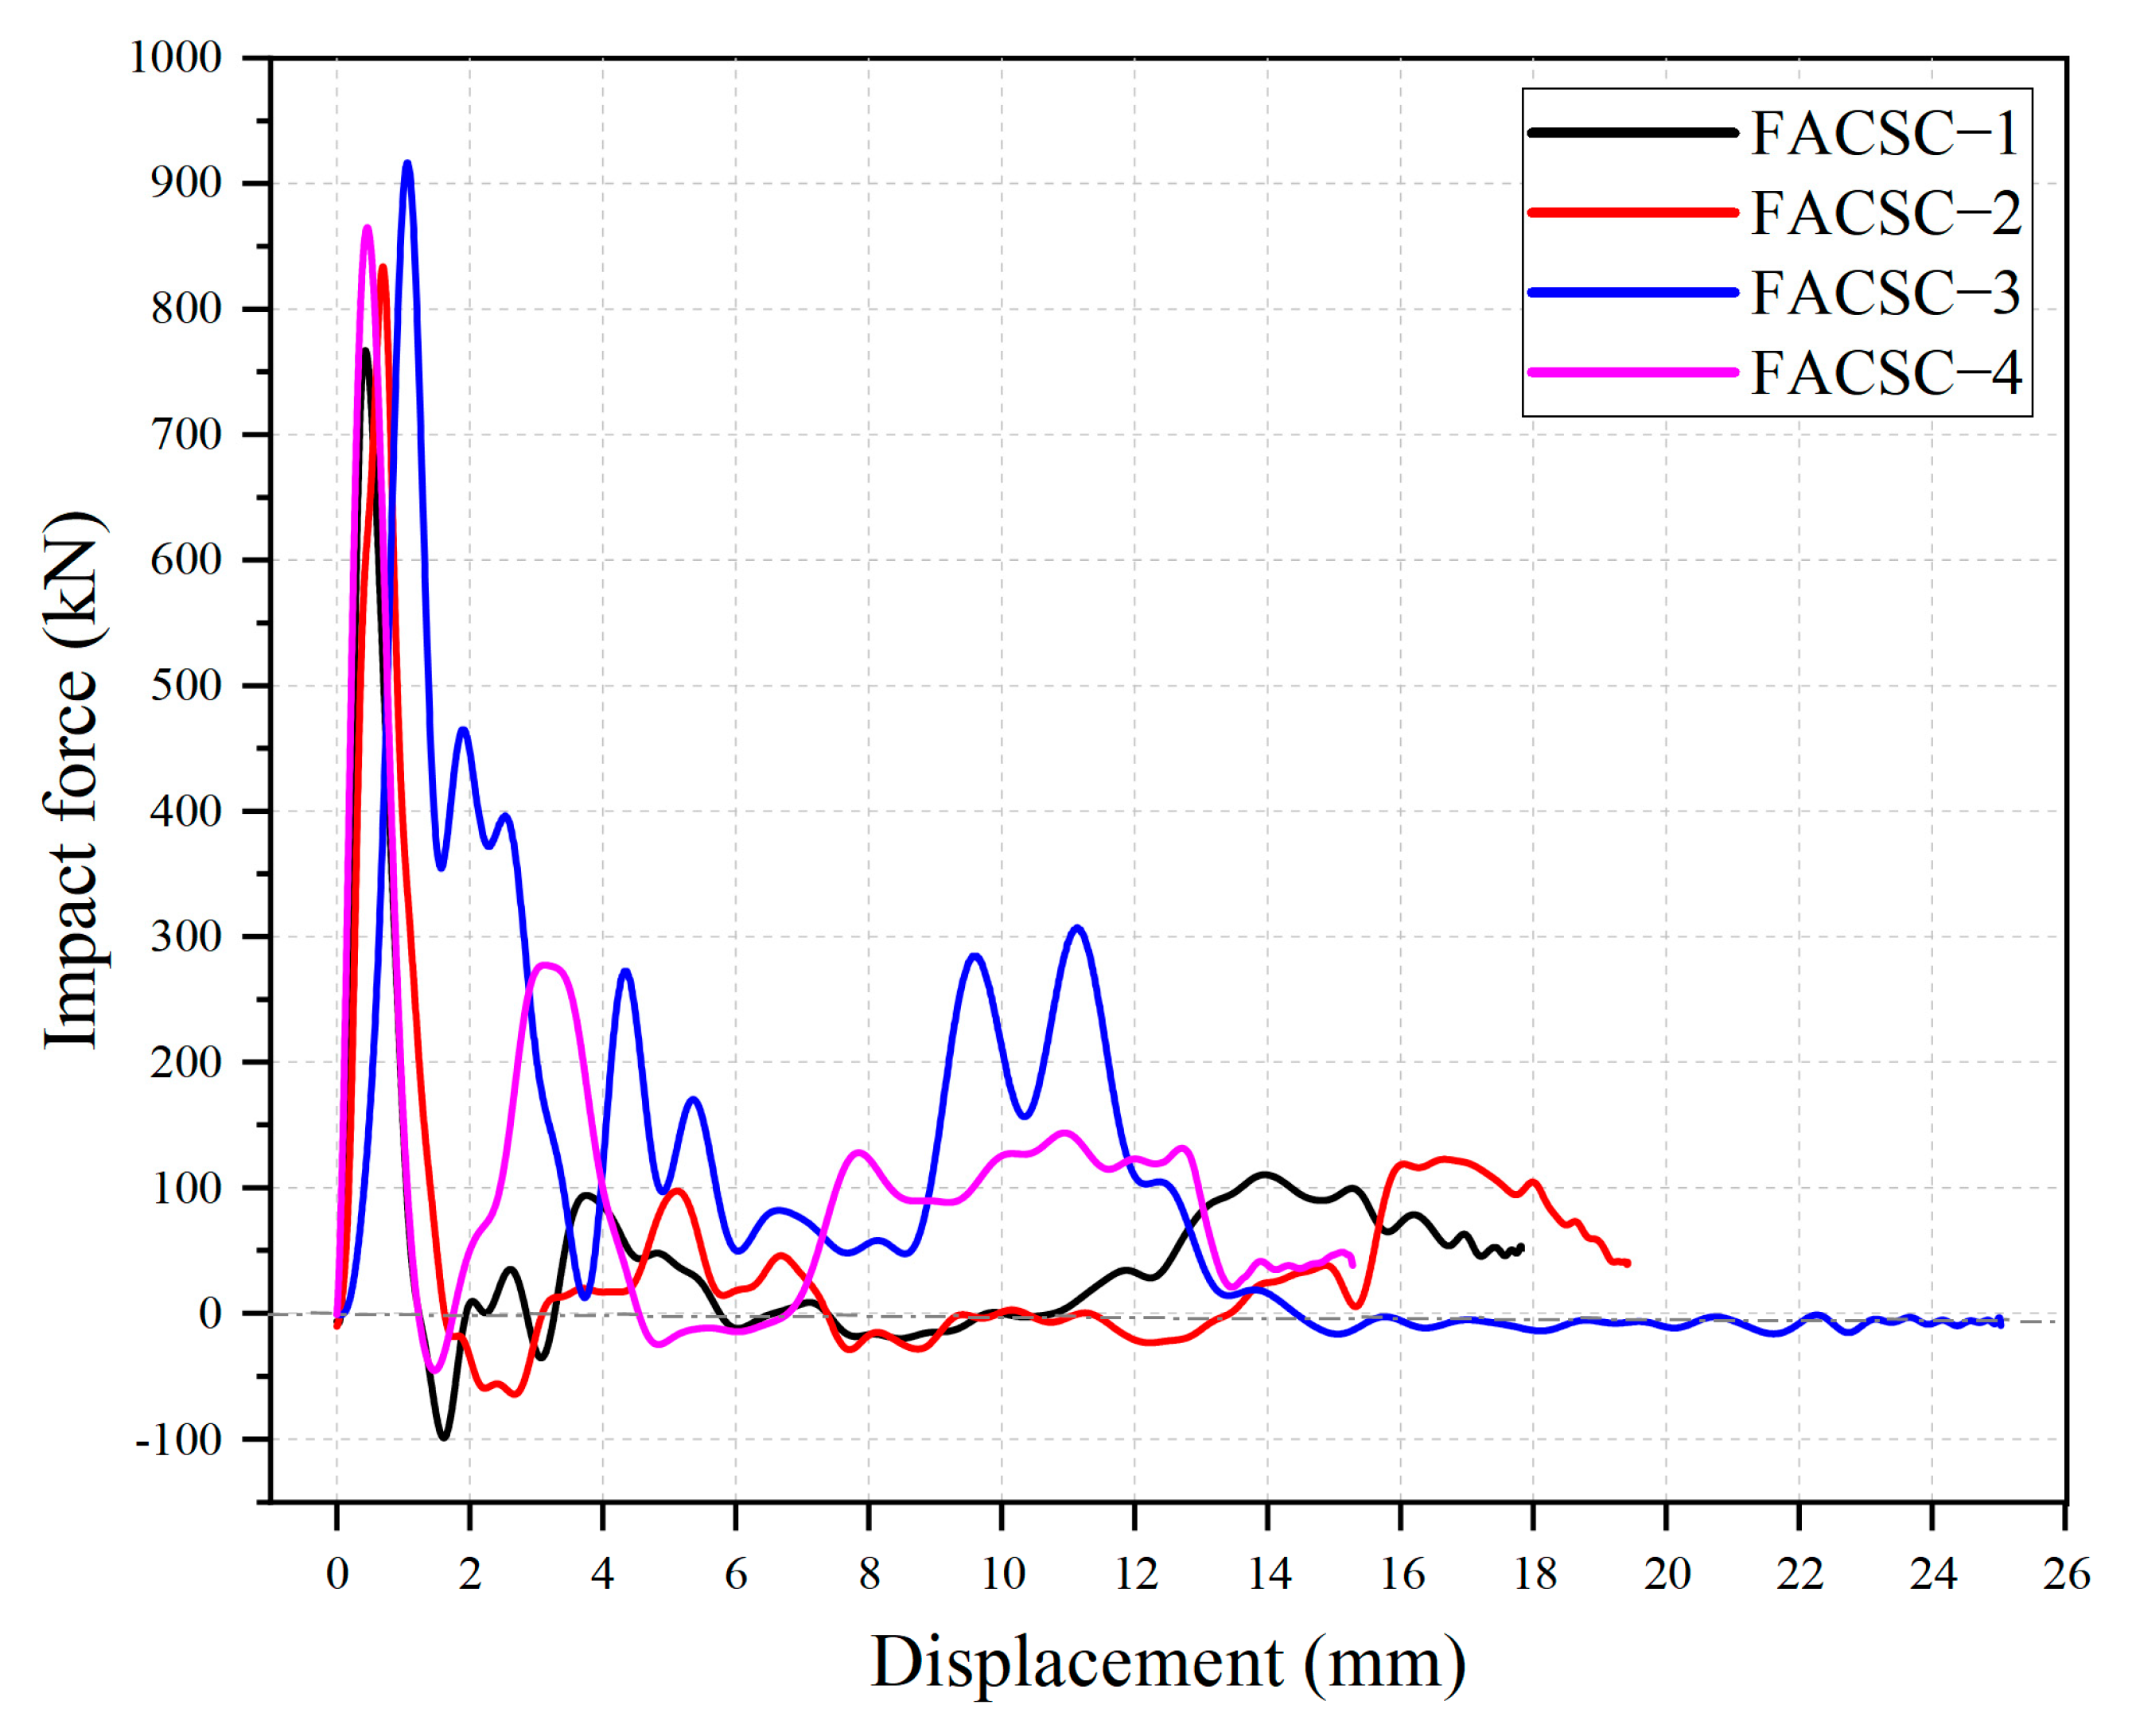
Figure 15 illustrates the displacement-impact force curve of the specimen under impact load. Among them, the horizontal coordinate indicates the specimen displacement, and the vertical coordinate indicates the impact load applied. The envelope area of the impact force-displacement curve is the work performed by the impact load, i.e., the energy Ep absorbed by the deformation of the specimen during the whole impact process. By integrating the displacement-impact force curve through Equation (2), the specimen’s deformation energy dissipation characteristic curve can be obtained, referred to as the energy dissipation curve in the following, as shown in Figure 16. Equation (2) in F (y) indicates the impact force at displacement y, and y is the displacement of the specimen. Figure 17 shows the magnitude of energy absorbed by the specimen.

Figure 15.
Displacement-impact force curve of ALWC columns.
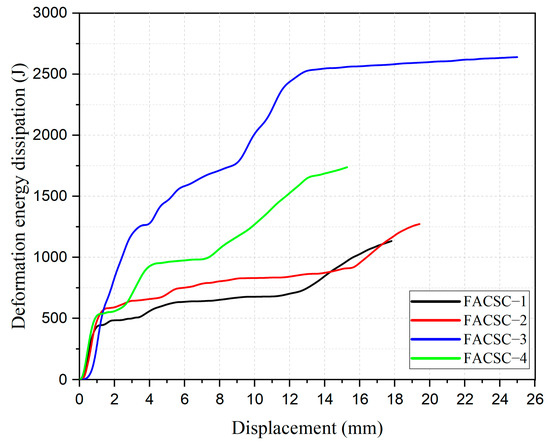
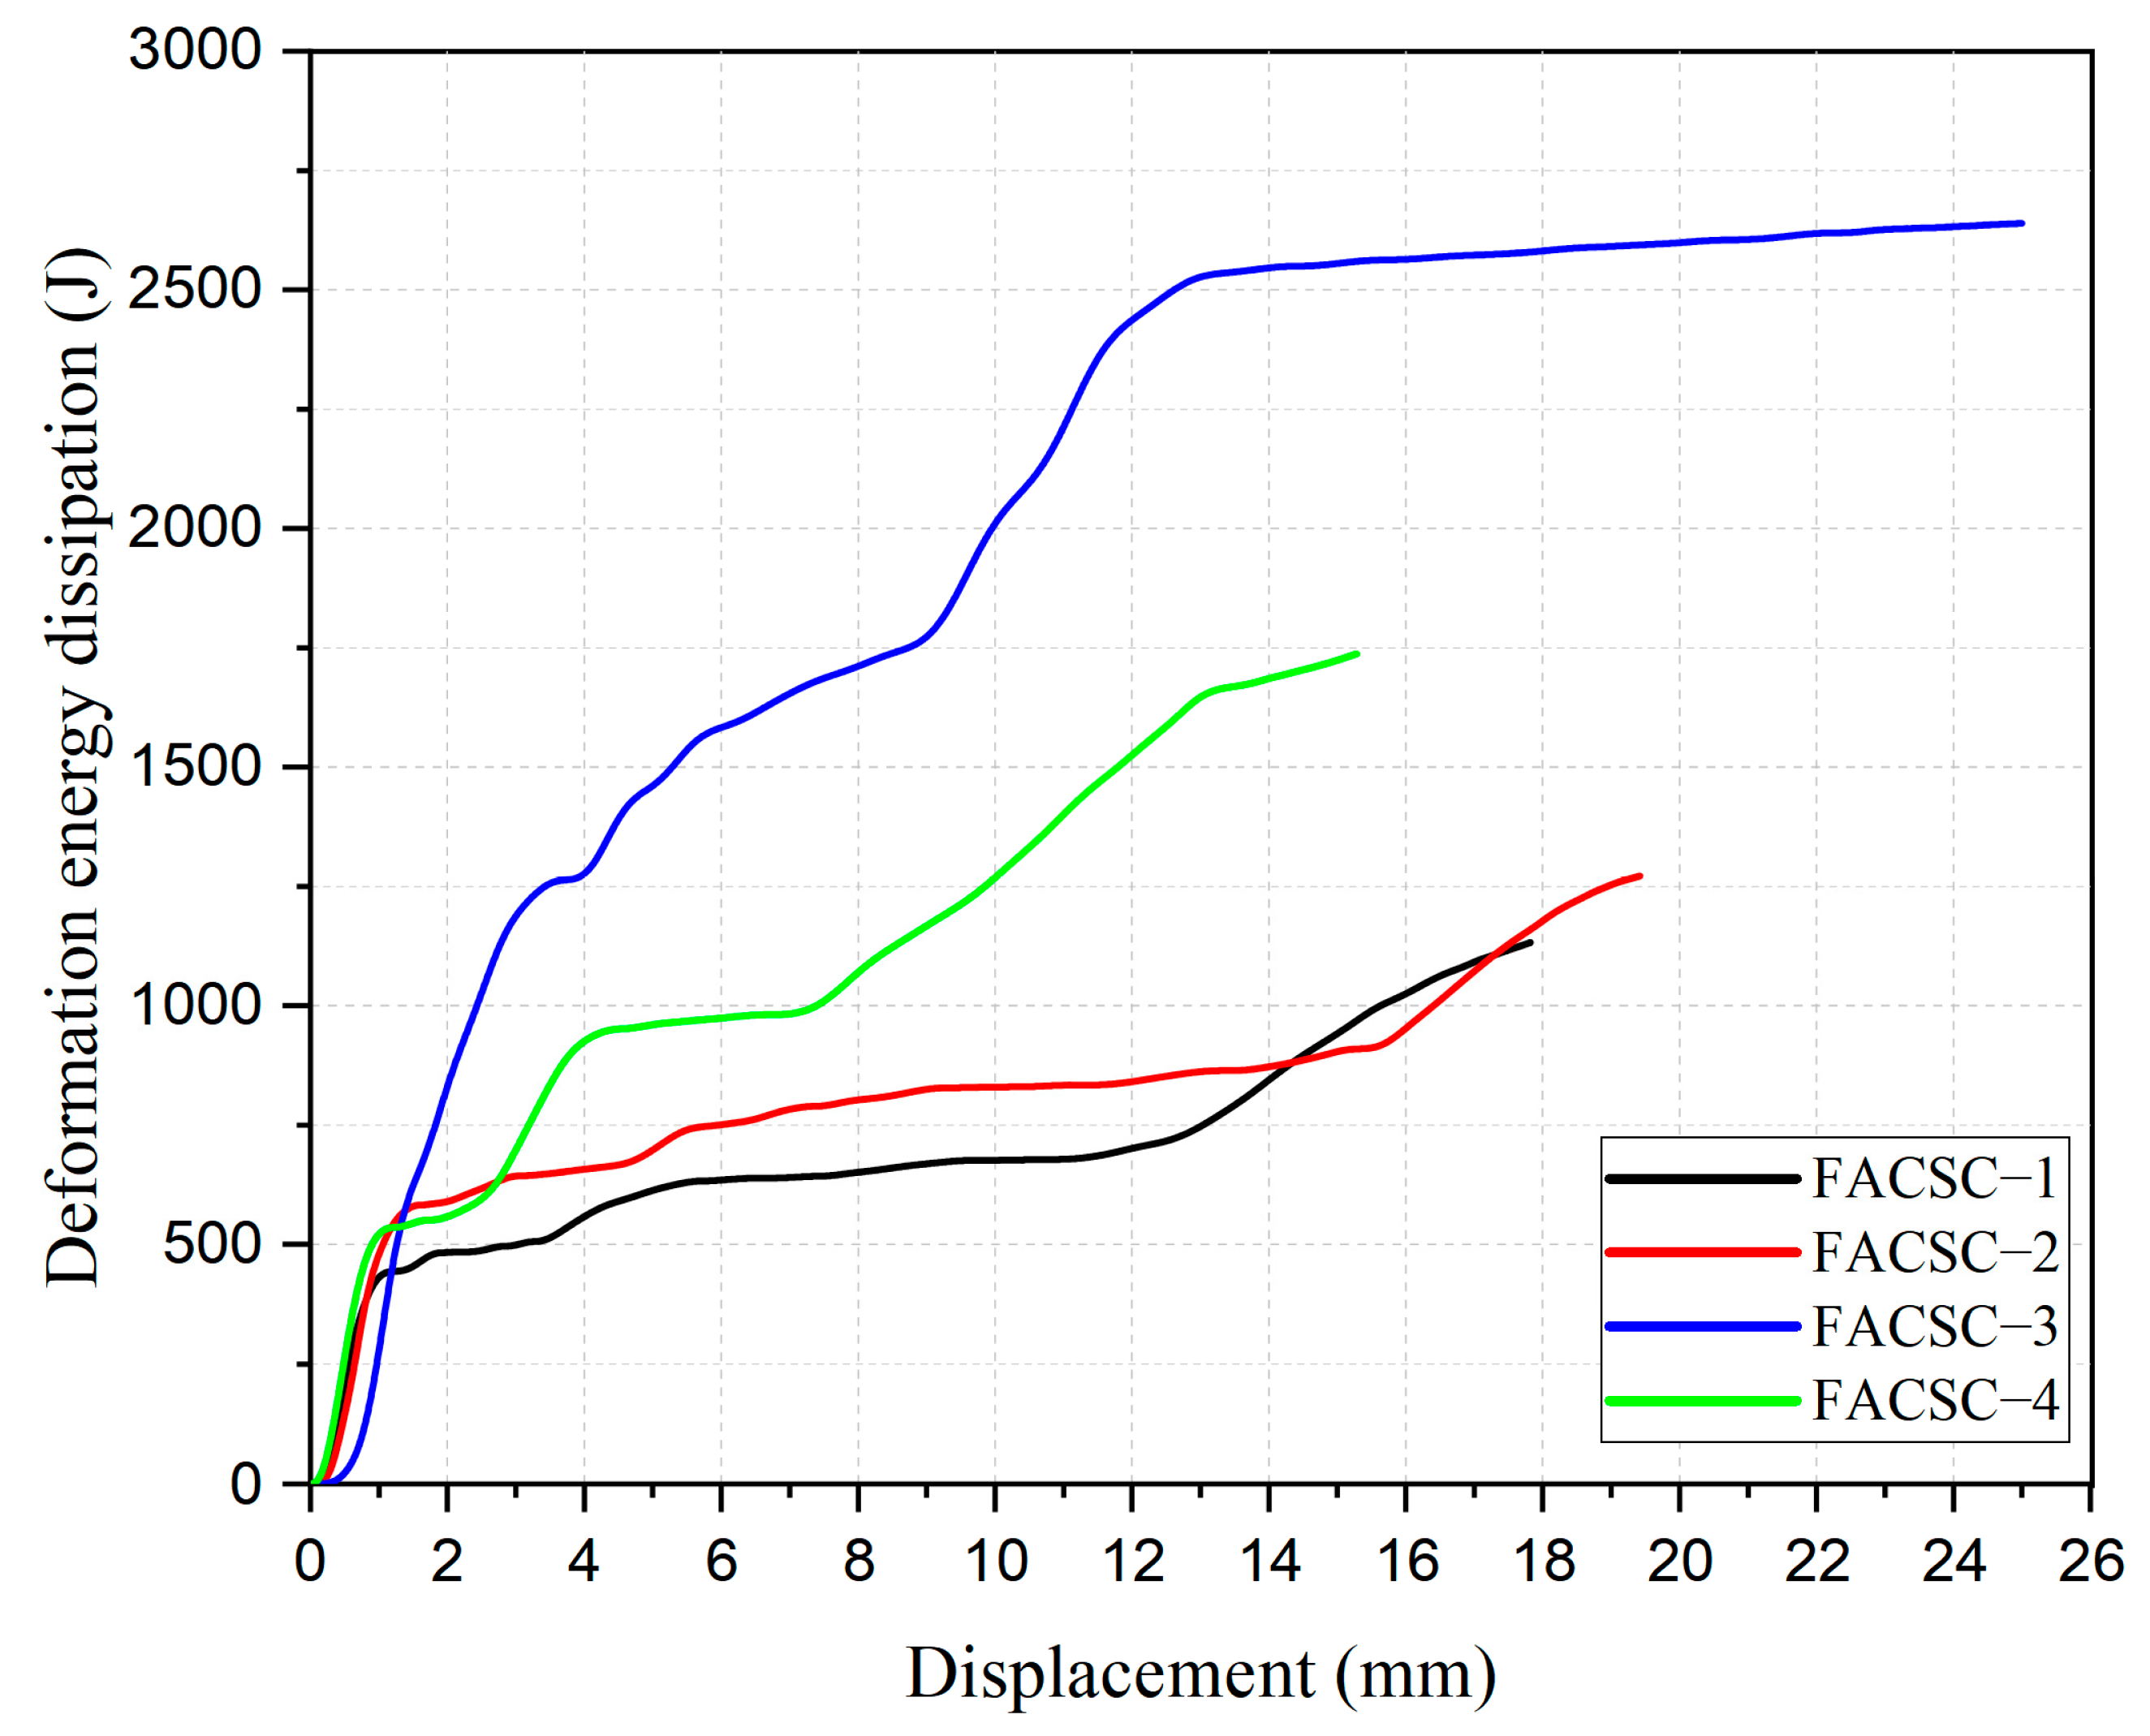
Figure 16.
Deformation energy dissipation characteristic curve.
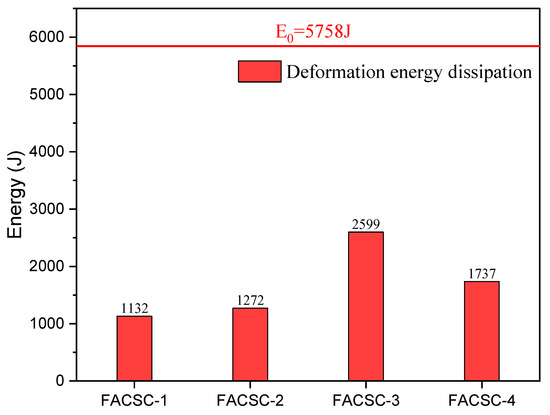
Figure 17.
Characteristic value of deformation energy dissipation of ALWC columns.
Based on the energy dissipation curves shown in Figure 16, the deformation energy dissipation curves for axial compression ratios of 0.1 and 0.2 show similar trends and develop in a parallel fashion. Specimens FACSC-1 and FACSC-2 show a higher slope of the energy dissipation curve at the early stage of deformation (elastic deformation stage) when the specimen’s stiffness is higher and can consume more energy. At the deformation of specimens FACSC-1 and FACSC-2 to 1.08 mm and 1.45 mm, respectively, the slope of the energy dissipation curve decreased significantly due to the accumulation of damage and the reduction of stiffness of the specimens. At this time, the deformation energy dissipation of specimen FACSC-1 is 439 J, while that of specimen FACSC-2 is 577 J. The difference between them is 138 J. When the specimen reaches the maximum deformation, the deformation energy dissipation of specimens FACSC-1 and FACSC-2 are 1132 J and 1272 J, respectively, and the difference is 140 J. Thus, it can be seen that the increase of axial compression ratio from 0.1 to 0.2 The deformation energy of specimen FACSC-1 and FACSC-2 is 1132 J and 1272 J, respectively, with a difference of 140 J. Thus, the increase of the axial compression ratio from 0.1 to 0.2 only significantly improves the initial deformation energy.
When the axial compression ratio is 0.3, the energy consumption curve keeps a high slope trend in the 0–13 mm deformation range. As shown in Figure 17, the deformation energy consumption of specimens FACSC-1, FACSC-2 and FACSC-3 is 19.66%, 22.09% and 39.23% of the initial impact energy E0, respectively. Among them, the deformation energy consumption of FACSC-2 was increased by 12.37% compared with FACSC-1, and the deformation energy consumption of FACSC-3 was increased by 104.32% compared with FACSC-2. The experimental results indicate that by increasing the axial compression ratio, the column relies more on deformation to consume the impact energy.
In this study, shear wave-shaped steel fibers were used as reinforcement material in fully lightweight concrete columns with an axial compression ratio of 0.2. After analysis, it was found that the deformation energy dissipation of specimen FACSC-4 was equivalent to 30.16% of the initial impact energy. Compared to FACSC-2, the deformation energy dissipation of FACSC-4 increased by 36.6%. This indicates that the steel fibers can absorb impact energy and play a significant bridging effect during the deformation process of the specimens, slowing down crack propagation and improving the deformation capacity and durability of the specimens. Observation of Figure 16 reveals that within the deformation range of 0–2.7 mm, the energy dissipation curves of specimens FACSC-2 and FACSC-4 overlap significantly, indicating that the energy dissipation capacity of the steel fibers has not been fully utilized at this stage. However, when the specimens deformed beyond 2.7 mm, the slope of the curve for FACSC-4 increased significantly, indicating that the steel fibers began to exert a greater influence. The bridging effect of the steel fibers was activated, preventing crack propagation and delaying the decrease in specimen stiffness, thereby further improving the deformation energy dissipation capacity of the specimens.
4. Conclusions
In this paper, the impact resistance of ALWC columns with axial compression ratios of 0.1, 0.2, and 0.3 was tested using a drop hammer testing machine, and the effect of shear-wave steel fibers on the impact resistance of ALWC columns with an axial compression ratio of 0.2 was also investigated. Impact force, acceleration, displacement, dynamic strain time course curves and energy dissipation curves, were obtained from the tests. Through an in-depth analysis of the test results, the following conclusions are drawn in this paper:
- (1)
- Under the impact load, many shear and bending cracks were generated in the local area of the span, resulting in the formation of a wedge-like local punching and shearing zone in the span. At the axial compression ratios of 0.1, 0.2, and 0.3, the specimens suffered bending shear damage, shear damage, and punching damage, respectively, and their crack patterns were dominated by bending cracks, shear cracks, and punching-type shear cracks, respectively.
- (2)
- When the axial compression ratio was increased from 0.1 to 0.2 and 0.2 to 0.3, respectively, the impact force primary peak increased by 8.7%, 9.8%, the secondary peak increased by 3.2%, 213.3%, the acceleration peak decreased by 30.81%, 8.4%, the maximum displacement in the span increased by 8.3%, 53.8%, and the residual displacement in the span increased by 65.9%. The deformation energy consumption is increased by 12.37% and 104.32%, respectively. The test results indicate that increasing the axial compression ratio can improve the specimen’s stiffness and damping, reduce the structure’s vibration amplitude, and make the structure have a better energy absorption capacity for impact loads. However, the effect of increasing the axial pressure ratio on the deformation and long-term stability of the structure needs to be carefully evaluated. There may be critical values in the range of axial pressure ratios increasing from 0.2 to 0.3, beyond which the impact response of the structure is significantly enhanced.
- (3)
- Under the impact load, the force distribution of the concrete inside the specimen gradually shifts toward the mid-span position as the axial compression ratio increases. This phenomenon leads to a gradual increase in the strain value of the hoop reinforcement in the specimen’s cross-section toward the span, which means that the strain will be more concentrated at the span center.
- (4)
- The addition of shear-wave steel fibers as reinforcing material to the ALWC columns with an axial compression ratio of 0.2 significantly improved the impact resistance and stiffness of the columns while reducing the generation of cracks. The concrete at the impact point did not show any stripping of aggregates. Compared with the specimens without steel fiber addition, the damage mode of the specimens changed from shear damage to bending damage, with a 3.2% increase in the primary peak, a 186% increase in the secondary peak, a 48.71% decrease in the maximum acceleration peak, 21.5% decrease in the maximum mid-span displacement, a 27.4% decrease in the residual displacement, and a 36.6% increase in the energy dissipation capacity.
Author Contributions
Conceptualization, X.W. and Z.G.; methodology, X.W. and L.S.; software, Z.G.; validation, X.W., Z.G. and Q.W.; formal analysis, X.W. and L.S.; investigation, Z.G.; resources, L.S.; data curation, Z.G. and Q.W.; writing—original draft preparation, Q.W.; writing—review and editing, X.W. and L.S.; visualization, X.W.; supervision, X.W.; project administration, X.W.; funding acquisition, X.W. All authors have read and agreed to the published version of the manuscript.
Funding
This research was funded by Key R & D Project of Jilin Provincial Science and Technology Department grant number 20210203145SF, and the APC was funded by X.W.
Data Availability Statement
Not applicable.
Conflicts of Interest
The authors declare no conflict of interest.
References
- Kiakojouri, F.; De Biagi, V.; Chiaia, B.; Sheidaii, M.R. Progressive Collapse of Framed Building Structures: Current Knowledge and Future Prospects. Eng. Struct. 2020, 206, 110061. [Google Scholar] [CrossRef]
- Yang, T.; Chen, W.; Han, Z. Experimental Investigation of Progressive Collapse of Prestressed Concrete Frames after the Loss of Middle Column. Adv. Civ. Eng. 2020, 2020, 8219712. [Google Scholar] [CrossRef]
- Abdelwahed, B. A Review on Building Progressive Collapse, Survey and Discussion. Case Stud. Constr. Mater. 2019, 11, e00264. [Google Scholar] [CrossRef]
- Xiang, S.; Zeng, L.; Liu, Y.; Mo, J.; Ma, L.; Zhang, J.; Chen, J. Experimental Study on the Dynamic Behavior of T-Shaped Steel Reinforced Concrete Columns under Impact Loading. Eng. Struct. 2020, 208, 110307. [Google Scholar] [CrossRef]
- Ye, J.-B.; Cai, J.; Chen, Q.-J.; Liu, X.; Tang, X.-L.; Zuo, Z.-L. Experimental Investigation of Slender RC Columns under Horizontal Static and Impact Loads. Structures 2020, 24, 499–513. [Google Scholar] [CrossRef]
- Cai, J.; Ye, J.-B.; Chen, Q.-J.; Liu, X.; Wang, Y.-Q. Dynamic Behaviour of Axially-Loaded RC Columns under Horizontal Impact Loading. Eng. Struct. 2018, 168, 684–697. [Google Scholar] [CrossRef]
- Gholipour, G.; Zhang, C.; Mousavi, A.A. Effects of Axial Load on Nonlinear Response of RC Columns Subjected to Lateral Impact Load: Ship-Pier Collision. Eng. Fail. Anal. 2018, 91, 397–418. [Google Scholar] [CrossRef]
- Sun, J.-M.; Yi, W.-J.; Chen, H.; Peng, F.; Zhou, Y.; Zhang, W.-X. Dynamic Responses of RC Columns under Axial Load and Lateral Impact. J. Struct. Eng. 2023, 149, 04022210. [Google Scholar] [CrossRef]
- Al-Bukhaiti, K.; Yanhui, L.; Shichun, Z.; Abas, H.; Daguang, H.; Nan, X.; Lang, Y.; Yu, Y.X. Effect of the axial load on the dynamic response of the wrapped CFRP reinforced concrete column under the asymmetrical lateral impact load. PLoS ONE 2023, 18, e0284238. [Google Scholar] [CrossRef]
- Pham, T.M.; Zhang, X.; Elchalakani, M.; Karrech, A.; Hao, H.; Ryan, A. Dynamic Response of Rubberized Concrete Columns with and without FRP Confinement Subjected to Lateral Impact. Constr. Build. Mater. 2018, 186, 207–218. [Google Scholar] [CrossRef]
- Fan, W.; Xu, X.; Zhang, Z.; Shao, X. Performance and Sensitivity Analysis of UHPFRC-Strengthened Bridge Columns Subjected to Vehicle Collisions. Eng. Struct. 2018, 173, 251–268. [Google Scholar] [CrossRef]
- Liu, Y.; Dong, A.; Zhao, S.; Zeng, Y.; Wang, Z. The Effect of CFRP-Shear Strengthening on Existing Circular RC Columns under Impact Loads. Constr. Build. Mater. 2021, 302, 124185. [Google Scholar] [CrossRef]
- Zhang, J.; Maalej, M.; Quek, S.T. Performance of Hybrid-Fiber ECC Blast/Shelter Panels Subjected to Drop Weight Impact. J. Mater. Civ. Eng. 2007, 19, 855–863. [Google Scholar] [CrossRef]
- Wu, Z.; Shi, C.; He, W.; Wu, L. Effects of Steel Fiber Content and Shape on Mechanical Properties of Ultra High Performance Concrete. Constr. Build. Mater. 2016, 103, 8–14. [Google Scholar] [CrossRef]
- Ren, G.M.; Wu, H.; Fang, Q.; Liu, J.Z. Effects of Steel Fiber Content and Type on Static Mechanical Properties of UHPCC. Constr. Build. Mater. 2018, 163, 826–839. [Google Scholar] [CrossRef]
- Jin, L.; Zhang, R.; Dou, G.; Du, X. Fire Resistance of Steel Fiber Reinforced Concrete Beams after Low-Velocity Impact Loading. Fire Saf. J. 2018, 98, 24–37. [Google Scholar] [CrossRef]
- Cao, Y.; Alyousef, R.; Baharom, S.; Shah, S.N.R.; Alaskar, A.; Alabduljabbar, H.; Mustafa Mohamed, A.; Assilzadeh, H. Dynamic Attainment of Mixed Aspect Ratio for Concrete Members Reinforced with Steel Fiber under Impact Loading. Mech. Adv. Mater. Struct. 2022, 29, 1986–1995. [Google Scholar] [CrossRef]
- Rafieizonooz, M.; Khankhaje, E.; Rezania, S. Assessment of environmental and chemical properties of coal ashes including fly ash and bottom ash, and coal ash concrete. J. Build. Eng. 2022, 49, 104040. [Google Scholar] [CrossRef]
- Mi, H.; Yi, L.; Wu, Q.; Xia, J.; Zhang, B. Preparation of High-Strength Ceramsite from Red Mud, Fly Ash, and Bentonite. Ceram. Int. 2021, 47, 18218–18229. [Google Scholar] [CrossRef]
- Liu, S.; Yang, C.; Liu, W.; Yi, L.; Qin, W. A Novel Approach to Preparing Ultra-Lightweight Ceramsite with a Large Amount of Fly Ash. Front. Environ. Sci. Eng. 2020, 14, 62. [Google Scholar] [CrossRef]
- Bernardo, L.F.A.; Nepomuceno, M.C.S.; Pinto, H.A.S. Flexural ductility of lightweight-aggregate concrete beams. J. Civ. Eng. Manag. 2016, 22, 622–633. [Google Scholar] [CrossRef]
- Zhou, Y.; Liu, X.; Xing, F.; Cui, H.; Sui, L. Axial Compressive Behavior of FRP-Confined Lightweight Aggregate Concrete: An Experimental Study and Stress-Strain Relation Model. Constr. Build. Mater. 2016, 119, 1–15. [Google Scholar] [CrossRef]
- Cui, H.Z.; Lo, T.Y.; Memon, S.A.; Xu, W. Effect of Lightweight Aggregates on the Mechanical Properties and Brittleness of Lightweight Aggregate Concrete. Constr. Build. Mater. 2012, 35, 149–158. [Google Scholar] [CrossRef]
- GB 50010-2010; Code for Design of Concrete Structures. Standards Press of China: Beijing, China, 2010.
- JGJ/T12-2019; Technical Standard for Application of Lightweight Aggregate Concrete. Standards Press of China: Beijing, China, 2019.
- JGJ/T12-2010; Technical Specification for Application of Fiber Reinforced Concrete. Standards Press of China: Beijing, China, 2010.
- GB/T 39147-2020; Steel Fiber for Concrete. National Standardization Management Committee: Beijing, China, 2020.
- Zhao, D.-B.; Yi, W.-J.; Kunnath, S.K. Shear Mechanisms in Reinforced Concrete Beams under Impact Loading. J. Struct. Eng. 2017, 143, 04017089. [Google Scholar] [CrossRef]
- Wei, J.; Li, J.; Wu, C. An Experimental and Numerical Study of Reinforced Conventional Concrete and Ultra-High Performance Concrete Columns under Lateral Impact Loads. Eng. Struct. 2019, 201, 109822. [Google Scholar] [CrossRef]
- Beppu, M.; Kataoka, S.; Mori, K.; Ichino, H. Local damage characteristics of reinforced concrete slabs subjected to hard/deformable projectile impact. Adv. Struct. Eng. 2022, 25, 1505–1518. [Google Scholar] [CrossRef]
- Sawamoto, Y.; Tsubota, H.; Kasai, Y.; Koshika, N.; Morikawa, H. Analytical Studies on Local Damage to Reinforced Concrete Structures under Impact Loading by Discrete Element Method. Nucl. Eng. Des. 1998, 179, 157–177. [Google Scholar] [CrossRef]
- Yan, Q.; Sun, B.; Liu, X.; Wu, J. The Effect of Assembling Location on the Performance of Precast Concrete Beam under Impact Load. Adv. Struct. Eng. 2018, 21, 1211–1222. [Google Scholar] [CrossRef]
- Smoller, J. Shock Waves and Reaction—Diffusion Equations (Vol. 258); Springer Science & Business Media: Berlin, Germany, 2012. [Google Scholar]
- Zhang, X.; Liu, Z.; Wang, F. Autogenous Shrinkage Behavior of Ultra-High Performance Concrete. Constr. Build. Mater. 2019, 226, 459–468. [Google Scholar] [CrossRef]
- Gholamhoseini, A.; Khanlou, A.; MacRae, G.; Scott, A.; Hicks, S.; Leon, R. An Experimental Study on Strength and Serviceability of Reinforced and Steel Fibre Reinforced Concrete (SFRC) Continuous Composite Slabs. Eng. Struct. 2016, 114, 171–180. [Google Scholar] [CrossRef]
- Wu, L.; Farzadnia, N.; Shi, C.; Zhang, Z.; Wang, H. Autogenous Shrinkage of High Performance Concrete: A Review. Constr. Build. Mater. 2017, 149, 62–75. [Google Scholar] [CrossRef]
- Zhan, Y.; Meschke, G. Multilevel Computational Model for Failure Analysis of Steel-Fiber–Reinforced Concrete Structures. J. Eng. Mech. 2016, 142, 04016090. [Google Scholar] [CrossRef]
- Kang, S.-T.; Lee, Y.; Park, Y.-D.; Kim, J.-K. Tensile Fracture Properties of an Ultra High Performance Fiber Reinforced Concrete (UHPFRC) with Steel Fiber. Compos. Struct. 2010, 92, 61–71. [Google Scholar] [CrossRef]
- Huang, H.; Gao, X.; Li, L.; Wang, H. Improvement Effect of Steel Fiber Orientation Control on Mechanical Performance of UHPC. Constr. Build. Mater. 2018, 188, 709–721. [Google Scholar] [CrossRef]


Disclaimer/Publisher’s Note: The statements, opinions and data contained in all publications are solely those of the individual author(s) and contributor(s) and not of MDPI and/or the editor(s). MDPI and/or the editor(s) disclaim responsibility for any injury to people or property resulting from any ideas, methods, instructions or products referred to in the content. |
© 2023 by the authors. Licensee MDPI, Basel, Switzerland. This article is an open access article distributed under the terms and conditions of the Creative Commons Attribution (CC BY) license (https://creativecommons.org/licenses/by/4.0/).