Abstract
With the continuous progress of urbanization, contemporary scholars are increasingly focusing their attention on the study of urban microclimates. This research aims to investigate the relationship between urban morphology and microclimates in regions characterized by hot summers and cold winters. Environmental meteorological data, including temperature, solar radiation, and wind speed during the spring and summer seasons, were collected through on-site monitoring in a specific area of Shanghai. Various methods, such as on-site surveys and drone photography, were employed to obtain and analyze a range of urban morphological parameters, including floor area ratio (FAR) and greenery ratio (GnPR). The sky view factor (SVF) was determined using a fisheye lens technique. Subsequently, the collected datasets were analyzed to assess the varying impact of distinct urban morphological factors on microclimates. The findings indicate a significant correlation between different building morphology factors and temperature and solar radiation during spring, while their associations with wind speed become more prominent in summer. Notably, greenery and pavement demonstrate stronger correlations with temperature and radiation in summer, aligning with the seasonal growth patterns of plants. These research findings provide both a theoretical foundation and practical guidelines for the urban design of environmental microclimates.
1. Introduction
Based on the primary data from the seventh National Population Census conducted by the National Bureau of Statistics, as of May 2021, China’s urbanization rate, reflecting the proportion of permanent residents living in urban areas, reached 63.89%. This signifies the emergence of an urban-oriented social structure, representing a profound societal transformation. In an environment where various resources, particularly land, are scarce, high-density development not only characterizes the present state of urban development in our country but also embodies a pivotal future trend that distinguishes it from foreign urban development models. While we reap the benefits of the conveniences afforded by the high-density urbanization process, this developmental paradigm imposes heightened demands and challenges on the comprehensive carrying capacity of the urban environment. Numerous environmental and climatic issues linked to high-density development, including the urban heat island effect, persistent and unresolved haze, extreme weather events, and inadequate urban ventilation, significantly compromise urban comfort, elevate energy consumption, and exacerbate pollution accumulation. Consequently, these factors exert substantial impacts on both social development and residents’ well-being.
The atmosphere encompasses a wide range of spatial and temporal phenomena. Climatic issues at different scales are distinguished by their unique representations of time and space for urban surfaces, giving rise to distinct equilibrium equations [1]. Recent years have witnessed significant advancements in the study of urban climate systems across multiple scales, including the urban and regional scale (meteorological mesoscale), neighborhood scale (meteorological local scale), and block scale (meteorological microscale). The meteorological mesoscale, covering several to hundreds of kilometers, captures weather phenomena such as storms. At the meteorological local scale, calculations and simulations typically operate within a range of hundreds of meters to a few kilometers, incorporating specific parameters such as surface reflectivity and roughness length to characterize the surface attributes of urban areas [2]. Meanwhile, the microscale level of meteorology involves precise computations of physical processes within a range spanning from a few meters to nearly 1 km.
With the advancement of research on urban microclimates, scholars have conducted extensive investigations into the impact of diverse urban forms on urban climates. The morphology and configuration of urban buildings play a direct role in shaping urban microclimates [3]. Descriptions of the urban thermal environment can be achieved through six urban form indicators, namely the sky view factor, pavement cover ratio, vehicle traffic density, green plot ratio, frontal area index, and proximity to heat sinks. In situ meteorological measurements enable the examination of spatial variations in microclimate parameters [4]. Different urban forms exert significant influence on the spatiotemporal dimensions of temperature [5,6]. Notably, various types of street trees have a profound impact on enhancing the thermal environment of road spaces and improving pedestrian thermal comfort [7]. Trees exhibit different effects under varying wind speeds, air conditions, solar radiation, and stomatal resistance. Higher wind speeds diminish the cooling effect of trees, while the regulation of stomatal resistance by trees can mitigate the impact of environmental changes on leaf surface temperature [8]. The representation and impact of vegetation in microclimate models provide a basis for assessing the thermal environment and comfort of outdoor microclimates in urban settings [9]. In terms of buildings, factors such as street interface density, size and location of open spaces, and the ratio of street width to building height significantly influence thermal comfort. Leveraging building shadows and creating ventilation corridors are crucial for improving thermal comfort [10]. Researchers have analyzed the correlation between urban form indicators and street-level wind environments [11], leading to the proposal of tailored planning strategies to address surface heat island effects based on different types of urban spatial forms [12].
In recent years, research has undergone a shift towards quantification, leading to a greater diversification of research methods and data sources. In terms of methodology, linear regression has predominantly been employed to analyze the correlation between urban morphology and temperature [13,14,15,16,17,18,19,20,21]. Factors such as proximity to the sea, sky view factor (SVF), vegetation cover, and impervious surfaces have been examined through linear regression analysis to evaluate temperature variations in Gothenburg, Sweden [17]. Additionally, stepwise linear regression has been utilized to investigate urban canopy temperatures [18]. Regarding data sources, remote sensing satellite imagery, mesoscale meteorological simulation software, traffic flow measurements, and GIS platform technologies are commonly utilized at the urban scale. The WRF/UCM system has been utilized to simulate urban heat islands and explore the relationship between urban form indicators and heat island intensity [22,23,24]. Moreover, digital technologies including RS and GIS have played a crucial role in assessing the climate regulation effects of green open spaces [25], as well as enabling spatial identification by integrating satellite remote sensing data with meteorological observations [26]. At the community level, research primarily involves computer numerical simulations and wind tunnel experiments. Drawing upon the local climate zone (LCZ) method, studies have examined the spatial distribution of urban heat islands and their association with urban morphology [27,28,29]. Low-altitude thermal infrared remote sensing and thermal climate wind tunnel experiments offer distinct advantages for studying outdoor environments, allowing for comprehensive investigations into thermal comfort by integrating these experimental approaches with traditional measurement methods [30,31,32]. At the block scale, common research methods include point measurements and questionnaire surveys. For instance, the relationship between thermal comfort and urban microclimate was analyzed by observing the outdoor activities of university students in extremely cold regions [33]. Likewise, correlation analyses were conducted to explore the link between thermal comfort in a commercial pedestrian street in cold regions and crowd behavior activities, utilizing on-site microclimate measurements, crowd behavior annotations, questionnaire surveys, and SPSS statistical analysis [34]. Scholars have also dedicated attention to the development of corresponding numerical calculation methods for urban climates at various scales [35,36,37,38].
In contrast to climate scale classification, this research addresses climate-related issues in urban planning and design, focusing on three distinct scales: city scale, block scale, and building scale. At the city scale, investigating “ventilation corridors” that incorporate urban geography and climate characteristics can enhance rational urban planning and green space system design. Ventilation corridors should align with prevailing wind directions and, where feasible, channel airflow towards developed areas, while considering natural airflows such as ocean, land, and valley winds [39]. Research teams in cities such as Stuttgart, Tokyo, and Hong Kong [40] have effectively employed “environmental climate maps” to propose measures for controlling and guiding ventilation corridors within urban environments. At the block scale, an example from Tianjin Eco-City (Figure 1, left) illustrates the use of 400 m × 400 m blocks with 20 m wide green belts as pedestrian spaces. Nevertheless, actual implementation faced challenges related to the application of public slow traffic systems due to encroachments from community roads, parking, and green spaces [41]. Adopting smaller 100 m × 100 m block units, coupled with ecological considerations such as vegetation and rivers within the block, and adjusting the road network based on daylighting standards, can lead to more sensible block module determination (Figure 1, right). The development of large blocks in Chinese new urban areas often leads to car-oriented layouts, resulting in increased energy consumption and carbon emissions, while blocks with overly small scales may suffer from ventilation and lighting issues. Therefore, block scale determination should encompass comprehensive factors such as daylighting, ventilation, and pedestrian travel time. At the building scale, higher floor area ratios contribute to a greater reduction in the sky view factor (SVF), and variations in building forms have a more pronounced impact on SVF, particularly in sites with high density requirements. Consequently, buildings in such areas should adopt simplified and compact designs to increase SVF, as observed in locations such as Central in Hong Kong and Lujiazui in Shanghai. Introducing concepts such as “aerial clusters”, “multiple ground layers”, and “green return rates” in building design can enhance the economic and ecological sustainability of vertical cities [42]. It is crucial to consider and appropriately adapt the concept of green return rates to local climates in architectural design practices.
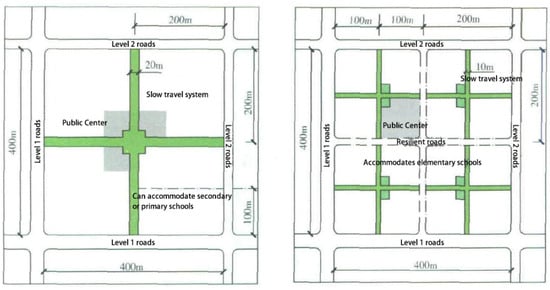
Figure 1.
Tianjin Eco-City’s basic unit model (left) and optimization mode (right).
In conclusion, the urban climate is a distinct climate influenced by human activities, particularly urbanization, and it directly affects the comfort of urban residents. The main causes of urban climate can be attributed to diverse underlying surfaces and emissions resulting from human activities. Extensive research has convincingly demonstrated the significant influence of urban morphology on the climatic conditions of urban spaces. While scholars have analyzed the climate factors in specific regions such as Harbin, Dalian, Beijing, Shanghai, Chengdu, and Guangzhou, further validation of these findings is necessary to ascertain their applicability to other areas within Shanghai and cities of different scales. In this study, a micro-scale campus located in Shanghai was selected as the research site, comprising 56 measurement points. Through on-site measurements and questionnaire surveys, data on local urban morphological parameters and environmental climate were collected for the spring and summer seasons. By conducting a comparative analysis of the varying impacts of different urban morphological factors on microclimates during different seasons, this study aims to establish a basis for environmentally conscious urban design in the Shanghai area.
2. Methodology
Field surveys were conducted to gather two types of data: (1) climate data, encompassing air temperature, humidity, solar radiation, wind speed, and wind direction; and (2) urban morphological factors, which encompass parameters associated with urban building density and form. The collected data underwent processing and analysis to derive results pertaining to urban morphological factors. Subsequently, the correlation between urban morphological factors and urban microclimate was examined and analyzed. Ultimately, conclusions were drawn to identify the factors that influence urban microclimate, providing a theoretical foundation and practical guidance for urban design.
2.1. Study Area
The Tongji University campus was chosen as the research site for this study due to its unique advantages. From an urban functionality perspective, the campus encompasses diverse functional zones, including residential areas, academic areas, administrative areas, and green spaces, each serving distinct purposes. The campus exhibits a varied mix of building heights, ranging from high-rise to mid-rise and low-rise structures, contributing to architectural diversity within its premises. The campus transportation network comprises different road types, such as carriageways and pedestrian walkways, featuring varying pavement materials. Furthermore, the campus boasts a rich variety of underlying surface materials, including buildings, paved areas, lawns, street trees, small forests, and water bodies, akin to a miniature urban model.
Located in Shanghai’s Yangpu District, the Siping Campus of Tongji University spans approximately 900 acres, with a length of around 856 m and a width of about 693 m. Shanghai falls within the subtropical monsoon climate zone, characterized by hot summers and cold winters, resulting in longer summer and winter seasons and shorter spring and autumn seasons. Summers are marked by high temperatures and humidity, while winters are damp and cold, with minimal diurnal temperature fluctuations. The region experiences substantial annual precipitation and limited sunshine duration. The late spring to early summer period corresponds to the rainy season, frequently accompanied by cloudy and wet weather, including heavy rain and storms. The coastal and Yangtze River regions are susceptible to tropical storms and typhoons during the summer and autumn, resulting in intense rainfall and strong winds [43].
2.2. Site Research
For this study, 56 points were chosen, including 55 measurement points (Figure 2) and one reference point. The field survey aimed to measure and analyze urban morphological factors at these locations, including sky view factor (SVF), greenery ratio (GnPR), paved area (PAVE), building height-to-area ratio (HBDG), and others. The field survey encompassed the collection of sky hemisphere photographs, as well as surveys focusing on greenery and pavement conditions.
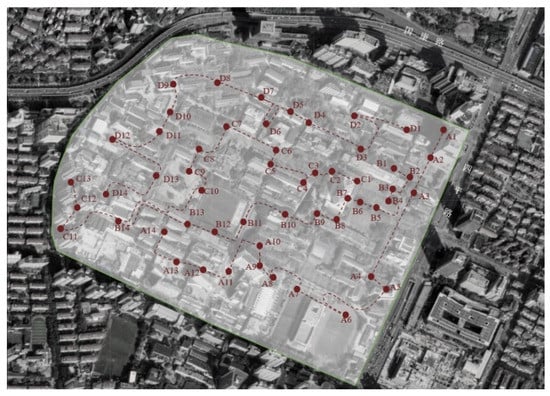
Figure 2.
Distribution map of measurement points.
Sky view factor (SVF) photographs were captured at the measurement points using a horizontally positioned fisheye camera aimed at the sky. Two sets of photographs were taken, one during spring and the other during summer. The SVF was subsequently computed using Solweig(solar and longwave environmental irradiance geometry) software. The disparity in SVF between the two seasons primarily arises from variations in leaf quantity and density. Changes in leaf growth and senescence exert a notable influence on SVF, especially at measurement points with abundant vegetation. The greenery survey aimed to assess the vegetation surrounding the measurement points, including the types, quantities, and areas of trees, shrubs, and grasslands, which were measured and mapped. The pavement survey focused on identifying pavement materials and mapping the paved areas.
2.3. Field Measurement
To capture the significant influence of urban morphology on air temperature during clear and calm weather, measurement days were carefully selected to ensure clear conditions with weak winds. The study spanned 8 days, with 5 days allocated for spring measurements and 3 days for summer measurements. The influence of urban morphology on microclimates is most evident under specific conditions, such as clear skies, calm winds, no rain, and limited cloud cover. During the spring season in Shanghai, the temperature range varies significantly, ranging from 13 to 24 degrees Celsius. Recognizing the human body’s heightened sensitivity to temperature fluctuations, we deliberately increased the number of measurements during the spring season using this unbalanced design to ensure focused and pertinent data collection. Each day, measurements were conducted from 8:00 AM to 20:00 PM, encompassing fixed-point measurements at the reference location as well as mobile measurements. The reference point employed the HOBO weather station U30, while the measurement points utilized the HOBO micro weather station H21, supplemented by two portable Kestrel data loggers. A team of 7 members was divided into 4 groups to assist with the measurements. One member was assigned to conduct fixed-point measurements at the reference point, overseeing the weather station and conducting comfort-related questionnaire interviews. The mobile measurements were conducted by 3 groups, each consisting of 2 members. One member was responsible for transporting the weather station, while the other conducted the questionnaire interviews. The mobile measurement points on the campus were divided into 4 routes, with 3 routes surveyed each day. By selecting different routes over the 3 days, each route was measured at least twice. Measurements were conducted in two time periods: morning (8:00 AM to 14:00 PM) and afternoon (14:30 PM to 20:00 PM). At 8:00 AM, the four weather stations were automatically initiated, and the three mobile groups commenced their measurements simultaneously. Upon reaching a measurement point, a timed interval of 8–10 min began, aligned with the arrival time of the last group. Subsequently, all groups departed the point simultaneously. This ensured that each measurement point had a minimum of 8 min of synchronized data, facilitating comparative analysis. While continuous fixed-point measurements would have been ideal, budget constraints and equipment safety considerations made this approach impractical. Hence, the study adopted a combination of fixed-point measurements at the reference location and mobile measurements. We made a conscious effort to carry out the measurements primarily during weekends to maximize the number of questionnaire responses. Despite the measurement period being limited to just eight days, we set up 56 measurement points and took two measurements at each point every day. This approach allowed us to obtain a robust and credible dataset consisting of 490 data entries.
The selection of measurement points aimed to represent diverse urban morphologies, vegetation forms, pavement types, and sky view variations. Functional areas, including residential, administrative, and high-rise areas, were deliberately chosen. Pavement types consisted of grass lawns, cement tiles, and asphalt roads. Vegetation types included lawns, trees, and shrubs, emphasizing the interaction and combination of these elements. Weather station sensors were uniformly positioned 2 m above the ground. The reference point was situated on the main lawn of the campus. Each weather station measured parameters such as air temperature (Ta), humidity (RH), globe temperature (GT), solar radiation (Solar), wind speed (WV), and wind direction (WD). Measurements were recorded at 10 s intervals. All equipment (refer to Table 1) was newly acquired and underwent factory calibration prior to testing. Calibration was conducted on all devices to ensure temperature discrepancies between weather stations were within a tolerance of 0.5 °C or an acceptable range. The meteorological data collected at the reference point served as the benchmark for establishing prediction models.

Table 1.
List of device parameters.
2.4. Calculation of Urban Morphological Factors
Urban form encompasses the spatial distribution and composition of different elements within a city [44]. Professor Meta Berhauser Pont from Delft University of Technology in the Netherlands has introduced an indicator system known as “Spacemate” [45]. This system integrates the floor space index (FSI), ground space index (GSI), average number of floors (L), and open space ratio (OSR) to create a chart that assesses the correlation between building density and urban form.
2.4.1. Methods for Calculating Urban Form Factors
Urban form factors can be classified based on the objects they describe. Factors associated with open space and visual perception include the sky view factor (SVF) and the open space ratio (OSR). Factors related to building form encompass the floor area ratio (FAR), wall surface area (WALL), average number of floors (L), building space coverage (BSC), and height-to-building area ratio (HBDG). Factors concerning vegetation encompass the greenery provision rate (GnPR). Factors related to pavement comprise the paving ratio (PAVE).
(1) Open Space Factors
SVF: The sky view factor is a numerical representation of the openness of urban three-dimensional space. It is a dimensionless value ranging from 0 to 1 [46], indicating the ratio of the sky area visible from a measurement point to the total area of the hemisphere. The fisheye photograph method is the most traditional approach for calculating the SVF, involving capturing a 180-degree fisheye photograph of the sky from a tripod at a height of 1 m and then using algorithms to compute the SVF based on the sky area in the fisheye photograph [47].
In the equation, Sv represents a small interface of the visible sky sphere; θ is the angle between Sv and the vertex of the sphere; R is the radius of the hemisphere.
OSR: open space ratio refers to the ratio of the total built-up area to the undeveloped open land area within a given site.
OSR = (1 − BSCx)/FARx
In the equation, OSR represents the open space ratio, FARx denotes the floor area ratio of the land, and BSCx refers to the building space coverage of the land.
(2) Building Form Factors
FAR: the floor area ratio, also known as the gross floor area ratio, represents the ratio of the total built-up area of a development to the land area.
FAR = Fx/Ax
In the equation, Fx represents the gross floor area in square meters (m2), and Ax represents the area of aggregation, which refers to the land area in square meters (m2).
WALL: the wall surface area represents the total surface area of building walls and, in another aspect, indicates urban building density.
L: the average number of floors refers to the ratio of the total floor area of buildings to the footprint area of the land parcel.
L = FARx/BSCx
In the equation, ARx represents the floor area ratio of parcel x, and BSCx represents the building space coverage of parcel x.
BSC: Building site coverage refers to the ratio of the total footprint area of buildings to the total land area within a given range, expressed as a percentage. It reflects the open space ratio and the degree of building density within a specific land area.
BSC = B/A
In the equation, B represents the gross building footprint area in square meters (m²), and A represents the land area of aggregation.
HBDG: height-to-building area ratio refers to the average ratio of building height to building area within a site, representing the thermal capacity of the buildings.
(3) Vegetation Factor
GnPR: Greenery provision rate is a parameter proposed by Ong [48] which calculates the average vegetation within a site using the leaf area index (LAI). It is determined by the sum of the products of each vegetation type and its corresponding LAI, divided by the total site area.
GnPR = Σ(nnAn × LAIn)/Site Area
In the equation, LAI_n represents the leaf area index for vegetation type n, A_n represents the canopy area for vegetation type n, and n_n represents the identification number of vegetation type n within the site.
(4) Paving Factors
PAVE: paving ratio refers to the proportion of hard-surfaced paving within a certain radius.
2.4.2. Results of Urban Form Factors
We conducted a comprehensive data collection of architectural, landscape, vegetation, and water body maps, complemented by on-site observations to enhance the accuracy of the time-delayed information in the maps. Relevant data, such as green space area, building area, and paved area, were directly extracted from the maps. Subsequently, we established a data processing workflow using FME (Feature Manipulate Engine) to calculate and extract urban geometric data for 55 designated measurement points.
A 50 m radius is considered optimal for influencing air temperature [5,49,50], and we developed a geographic information system (GIS) model that represents the urban form encompassing these 55 points. This model incorporates comprehensive information regarding buildings, roads, pavement, water bodies, and vegetation. By utilizing FME, a specialized data processing workflow tool was created based on this model to extract the urban form factors specific to each of the 55 measurement points, subsequently generating corresponding maps (Figure 3, Figure 4 and Figure 5).
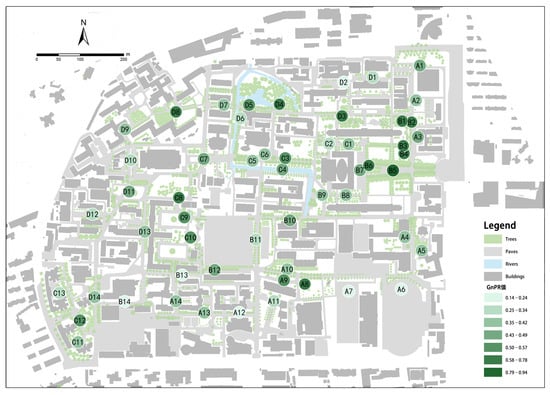
Figure 3.
Green space ratio (GnPR) for each measurement point.
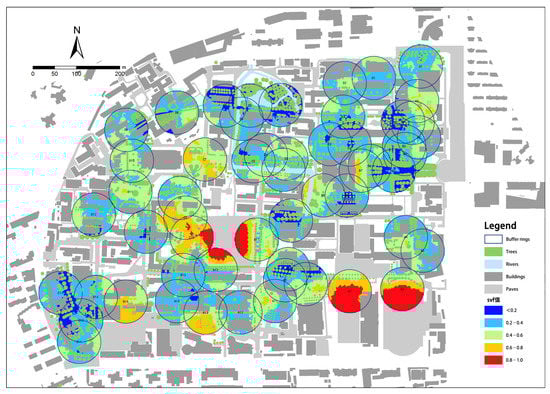
Figure 4.
Sky view factor (SVF) for each measurement point.
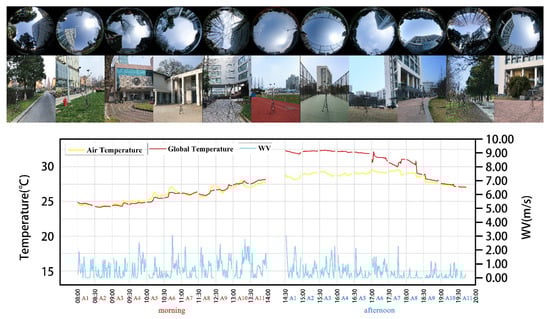
Figure 5.
A1–A11 of fisheye lens images, on-site measurement point images, and meteorological data throughout a day.
3. Correlation Study between Urban Morphology and Microclimate
This section focuses on examining the correlation between meteorological parameters (such as temperature, solar radiation, and wind speed) at the measurement points and both environmental meteorological factors and urban morphology factors. We assume that these meteorological parameters are influenced by both the environmental meteorological factors and the urban morphology factors. To address equipment limitations, this study employed mobile measurements, resulting in non-simultaneous data collection for the meteorological parameters at the measurement points. The temporal variations in the meteorological environmental factors have a significant impact on the monitoring data at the measurement points. Therefore, we utilize partial correlation analysis to mitigate the interference of environmental meteorological parameters on the meteorological parameters at the measurement points. Moreover, we compare the impact of controlling environmental meteorological parameters (reference point meteorological parameters) and the meteorological parameters at the measurement points on the correlation with urban morphology factors.
3.1. Correlation Analysis between Urban Morphology and Temperature
Temperature plays a pivotal role in influencing human thermal comfort. The thermal environment, a vital metric for assessing urban environmental quality, has a profound impact on individuals’ health and activity patterns. A pleasant outdoor thermal environment promotes mobility and activities, whereas excessively high urban temperatures can significantly affect urban development. When exploring the correlation between urban morphology factors and temperature, it is crucial to consider the influence of environmental meteorological parameters on urban morphology factors. To account for this, a pairwise correlation analysis was conducted, controlling for relevant variables. The findings are presented in Table 2.
Table 2.
Correlation between temperature at measurement points and urban morphology factors during spring and summer with controlled variables.
After controlling for the influence of reference point meteorological parameters, the data in Table 2 indicate that, in both spring and summer, the bivariate Pearson correlation analysis between sky view factor (SVF) and temperature (Ta) yields a significance level (two-tailed) of less than 0.05. The correlation coefficients are 0.264 and 0.467, respectively, signifying a significant positive correlation between SVF and Ta. In spring, there is no significant correlation between green naturalness percentage (GnPR), paved ratio (PAVE), open space ratio (OSR), and Ta. However, in summer, GnPR exhibits a significant negative correlation with Ta, while PAVE and OSR display a significant positive correlation. The correlation between building shape compactness (BSC), floor area ratio (FAR), building height (L), wall ratio (WALL), and Ta transitions from a significant negative correlation in spring to a non-significant correlation in summer.
Based on the aforementioned analysis, it is evident that the correlation between building morphology factors and environmental temperature is more significant in spring, whereas in summer, the correlation between pavement, vegetation, and environmental temperature becomes more significant. The correlation between vegetation parameters and temperature shifts from non-significant in spring to significant in summer, aligning with the seasonal growth and decline of plants. The correlation between pavement ratio, openness index, and temperature changes from non-significant in spring to significant in summer, likely attributable to the increased solar radiation during summer. This results in the absorption of heat by pavements and surrounding building materials, as well as the release of long-wave radiation, leading to a significant increase in near-surface temperature.
3.2. Correlation Analysis between Urban Morphology and Solar Radiation
Solar radiation plays a crucial role in determining human thermal comfort. Urban surfaces absorb a significant amount of solar radiation, which is primarily used for heating the surrounding air and solid materials. The thermal response of different surface types to solar radiation varies, leading to significant impacts on the urban thermal environment. When examining the correlation between urban morphology factors and solar radiation, it is essential to consider the influence of environmental meteorological parameters on these factors. To address this issue, ordinary pairwise correlation analysis was performed with controlled variables, and the results are presented in Table 3.
Table 3.
Correlation between solar radiation at measurement points and urban morphology factors in spring and summer with controlled variables.
After controlling for the influence of reference point meteorological parameters, the table data reveal significant positive correlations between the open space ratio (OSR) and solar radiation, as well as between the sky view factor (SVF) and solar radiation, during both spring and summer. Conversely, a significant negative correlation is observed between building height (L) and solar radiation. In spring, no significant correlation is found between the green naturalness percentage (GnPR) and solar radiation, whereas in summer, a significant negative correlation exists between these two variables. The paved ratio (PAVE) demonstrates a significant positive correlation with solar radiation in spring, while building shape compactness (BSC), floor area ratio (FAR), and wall ratio (WALL) exhibit significant negative correlations. However, during summer, these factors do not show a clear correlation with solar radiation.
Based on the analysis above, it can be observed that the correlation between building morphology factors and solar radiation is more significant in spring, whereas in summer, the correlation between vegetation and solar radiation becomes more prominent. The correlation between urban morphology factors related to buildings and pavements and solar radiation weakens from being significant in spring to non-significant in summer. This can be attributed to the dense tree canopy during summer, which exhibits a significant correlation with solar radiation at the measurement points, resulting in a diminished correlation between factors related to buildings and pavements and solar radiation.
3.3. Correlation Analysis between Urban Morphology and Wind Speed
Urban ventilation has a direct impact on human thermal comfort and indirectly affects factors such as temperature and humidity. Efficient ventilation plays a crucial role in mitigating the urban heat island effect. When analyzing the correlation between urban morphology factors and wind speed, the influence of environmental meteorological parameters on urban morphology is relatively limited. After comparing the results of ordinary pairwise correlation analysis conducted prior to controlling for variables, the findings are presented in Table 4.
Table 4.
Correlation between wind speed and urban morphology factors in spring and summer without controlling variables.
In the absence of controlled variables, the data in the table reveal significant positive correlations between floor area ratio (FAR), building height (L), and wall ratio (WALL) with wind velocity (WV). No significant correlation is found between other morphology parameters such as paved ratio (PAVE) and open space ratio (OSR) with WV. Additionally, in spring, there is no significant correlation between building shape compactness (BSC) and sky view factor (SVF) with WV. However, in summer, BSC exhibits a significant negative correlation with WV, while SVF shows a significant positive correlation. The correlation between green naturalness percentage (GnPR) and height-based density gradient (HBDG) with WV changes from a significant negative correlation in spring to a non-significant correlation in summer.
Based on the above analysis, it is evident that the correlation between vegetation and wind velocity is more pronounced in spring, whereas the relationship between building morphology factors and wind velocity becomes more significant in summer. The correlation between sky view factor and wind velocity transitions from non-significant in spring to significant in summer. This can be attributed to the increased obstruction caused by dense vegetation during summer, resulting in a stronger association with wind velocity. In contrast to environmental temperature and solar radiation, wind velocity is less affected by seasonal variations. Moreover, controlling environmental meteorological parameters does not significantly influence the correlation between wind velocity and morphology factors, unlike temperature and solar radiation.
4. Multivariate Linear Regression Analysis of Urban Morphology and Microclimate
This section aims to investigate the potential impact of parameters that are significantly correlated with the meteorological variables at the measurement points on those variables and explore the feasibility of developing effective regression models based on these relationships. The dependent variables considered in this analysis are “Measurement Point Air Temperature (Ta)”, “Measurement Point Solar Radiation (Solar)”, and “Measurement Point Wind Velocity (WV)”. The independent variables comprise meteorological parameters at the reference point, namely “Reference Point Air Temperature (RefTa)”, “Reference Point Solar Radiation (RefSolar)”, and “Reference Point Humidity (RefRH)”, along with urban morphology factors that exhibit significant correlations with the respective meteorological variables. Prior to conducting the multivariate linear regression analysis, it is essential to examine the collinearity among the independent variables. In this study, correlation analysis is employed, with variables displaying correlation coefficients equal to or greater than 0.75 being considered as indicative of collinearity.
4.1. Multivariate Linear Regression Analysis of Urban Morphology and Temperature
In the multivariate linear regression analysis of urban morphology and temperature, a strong linear relationship was observed among the variables FAR, SVF, and GnPR, as indicated by Pearson correlation coefficients exceeding 0.75. The dependent variable in this analysis is Ta (measurement point air temperature), while the independent variables include reference point meteorological parameters (RefTa, RefRH, and RefSolar) and urban morphology factors (FAR, SVF, and GnPR). The results for both spring and summer seasons are summarized in Table 5.
Table 5.
Multivariate regression models of urban morphology factors and temperature for spring and summer seasons.
SVF significantly impacts Ta in both spring and summer seasons. In spring, there is a significant influence of FAR on Ta, with a higher floor area ratio (FAR) correlating with lower air temperatures. This relationship can be attributed to the reduction in solar radiation within the street canyon due to building obstructions, leading to a decrease in temperature. In summer, GnPR has a significant effect on Ta, with higher green naturalness percentage (GnPR) associated with lower air temperatures. Consequently, it can be concluded that reducing FAR can increase environmental air temperature and enhance comfort in early spring, while increasing green area, particularly tree coverage, helps lower environmental air temperature and improve comfort during summer.
4.2. Multivariate Linear Regression Analysis of Urban Morphology and Solar Radiation
In the study of multivariate linear regression analysis on urban morphology and solar radiation, it was found that SVF, L, and “Tree Canopy Area” exhibited Pearson correlation coefficients exceeding 0.75, indicating a strong collinearity among these variables. After considering different combinations of independent variables, solar radiation was chosen as the dependent variable, while reference point meteorological parameters (RefSolar, RefRH, and RefWV) and urban morphology factors (SVF, L, and Tree) were selected as independent variables for the multivariate linear regression analysis. The results for both spring and summer seasons are presented in Table 6.
Table 6.
Multivariate regression models of urban morphology factors and solar radiation in spring and summer seasons.
In both spring and summer, the sky view factor (SVF) emerges as the dominant urban morphology factor influencing solar radiation. A higher SVF corresponds to increased solar radiation received at the measurement points. In summer, the significance test confirms the influence of the parameter L, indicating that taller buildings result in reduced solar radiation reaching the measurement points. Additionally, although the green parameter Tree exhibits a significant correlation with solar radiation during both seasons, it fails to meet the significance test. This discrepancy may be attributed to the direct impact of tree canopies directly above the specific measurement points, outweighing the influence of the tree canopy area within a 50 m radius. Consequently, SVF encompasses the obstruction information arising from buildings and trees at the measurement points. Hence, the solar radiation models for both spring and summer do not incorporate the representation of green parameters.
4.3. Multivariate Linear Regression Analysis of Urban Morphology and Wind Velocity
The present study conducted a multivariate linear regression analysis to investigate the relationship between urban morphology and wind velocity. Wind velocity (WV) was selected as the dependent variable, while the independent variables consisted of RefRH, RefWV, and urban morphology factors HBDG, L, Tree, SVF, and BSC. These variables exhibited significant correlations with the wind speed at the measurement points. The obtained dataset was then used for the multivariate linear regression analysis. The results for both spring and summer seasons are summarized in Table 7.
Table 7.
Multivariate regression models of urban morphology factors and wind velocity in spring and summer seasons.
In both spring and summer seasons, RefRH had a significant impact on wind velocity among the environmental meteorological factors (under calm wind conditions). Among the urban morphology factors, L exerted the greatest influence on wind velocity at the measurement points in both seasons. Additionally, HBDG had a significant impact on wind velocity during both seasons. Moreover, in spring, Tree had a significant influence on wind velocity, indicating a negative relationship between larger tree canopy areas and wind speeds. In summer, both SVF and BSC demonstrated a significant impact on wind velocity at the measurement points.
4.4. Validation of the Multivariate Linear Regression Model
4.4.1. Spring Air Temperature Regression Verification
Upon obtaining the aforementioned regression models, a rigorous evaluation of their goodness of fit becomes imperative. Linear regression necessitates the consideration of various assumptions, such as error normality and homoscedasticity, warranting a thorough investigation to ascertain their conformity with the observed data.
Assumption 1: In multiple linear regression, a fundamental assumption pertains to the residuals adhering to a normal distribution. The histogram of residuals for the linear regression model is illustrated in Figure 6, revealing a striking resemblance between the frequency distribution of residuals and the standard normal curve. Consequently, Assumption 1 is deemed satisfied for this multiple linear regression model.
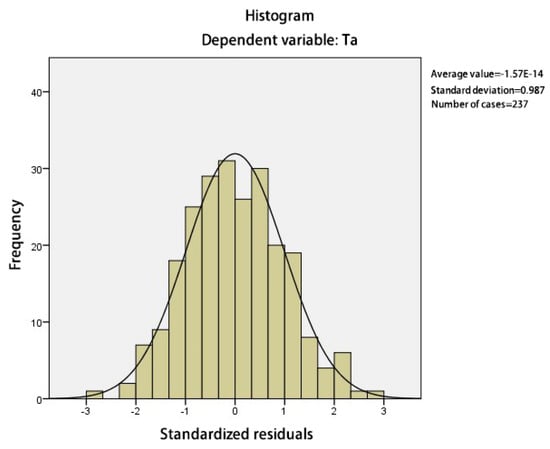
Figure 6.
Residual histogram.
Assumption 2: In multiple linear regression, it is postulated that the residuals exhibit homoscedasticity, indicating consistent residual variance. Conversely, the presence of heterogeneous residual variance is referred to as “heteroscedasticity”. To diagnose the existence of heteroscedasticity in the linear regression model, a scatter plot of residuals is examined (refer to Figure 7). The scatter plot showcases a relatively uniform distribution of residuals, providing evidence of the absence of significant heteroscedasticity. Thus, Assumption 2 is met.
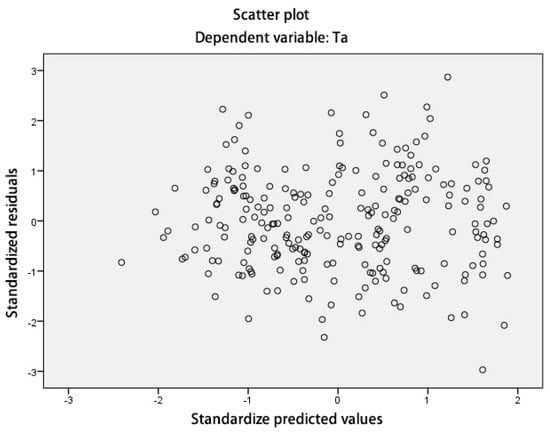
Figure 7.
Residual scatter plot.
Based on the comprehensive diagnostic analysis of the linear regression model, we can confidently conclude that the results obtained from this model are valid, and the derived linear regression equation holds practical value.
4.4.2. Summer Air Temperature Regression Verification
In multiple linear regression models, the assumption is made that the residuals conform to a normal distribution. As depicted in Figure 8, the residual histogram of this particular linear regression model exhibits a close resemblance to the standard normal curve, validating this assumption. Another critical assumption in multiple linear regression models pertains to the homoscedasticity of residuals. The scatter plot for this equation (Figure 9) reveals a relatively uniform distribution of residuals, indicating the absence of significant heteroscedasticity. Furthermore, independence of residuals is also assumed in multiple linear regression models. Although there is a slight presence of autocorrelation in this model, it does not exert a substantial impact on the parameter estimates of the regression model. Upon conducting a thorough diagnostic assessment of the linear regression model, we can confidently assert the validity of the results, signifying the practical value of the derived linear regression equation.
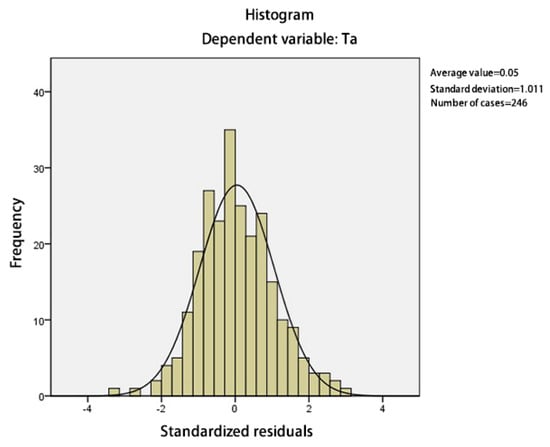
Figure 8.
Residual histogram.
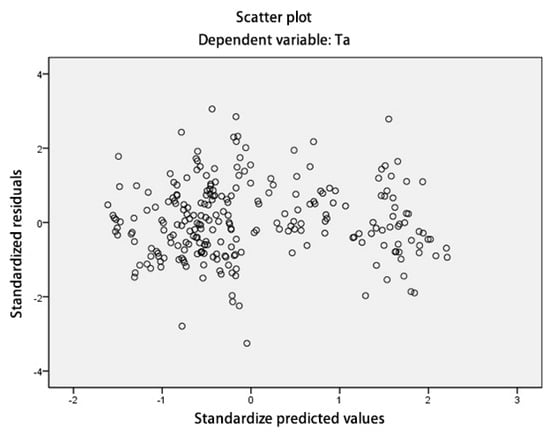
Figure 9.
Residual histogram.
4.4.3. Spring Solar Radiation Regression Verification
Figure 10 presents the residual histogram of this linear regression model, displaying a clear alignment between the frequency distribution of residuals and the standard normal curve. The scatter plot of the regression equation (Figure 11) reveals a relatively uniform distribution of residuals, indicating the absence of significant heteroscedasticity. Additionally, there is no observed autocorrelation in this model. Based on a thorough diagnostic evaluation of the linear regression model, we can confidently affirm the validity of the results, thus emphasizing the practical significance of the derived linear regression equation.
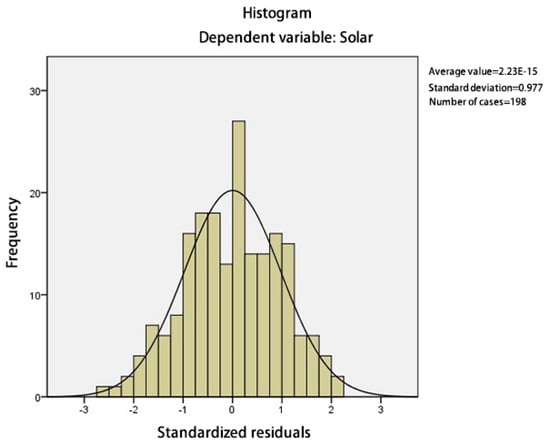
Figure 10.
Residual histogram.
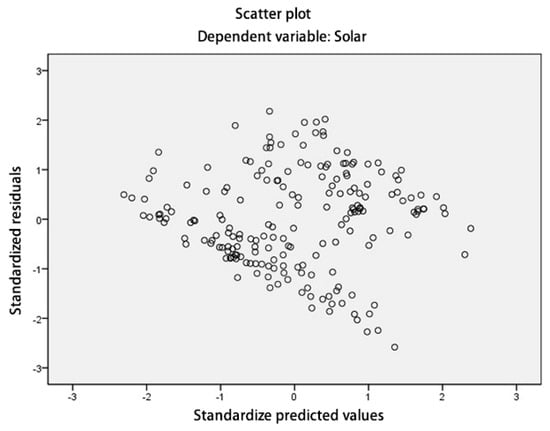
Figure 11.
Residual histogram.
4.4.4. Summer Solar Radiation Regression Verification
Figure 12 displays the residual histogram of this linear regression model, revealing a close resemblance between the frequency distribution of residuals and the standard normal curve. Within the context of the multiple linear regression model, an assumption is made regarding the independence of residuals. Notably, no autocorrelation is present in this model, as affirmed by the scatter plot (Figure 13), which demonstrates a relatively uniform distribution of residuals, indicating the absence of significant heteroscedasticity. Based on a comprehensive diagnostic assessment of the linear regression model, we can confidently assert the validity of the results, underscoring the practical significance of the derived linear regression equation.
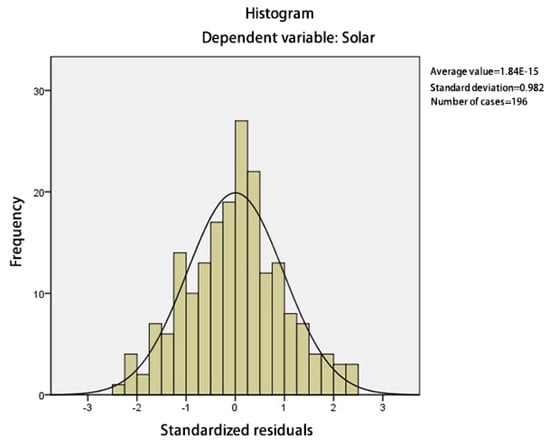
Figure 12.
Residual histogram.
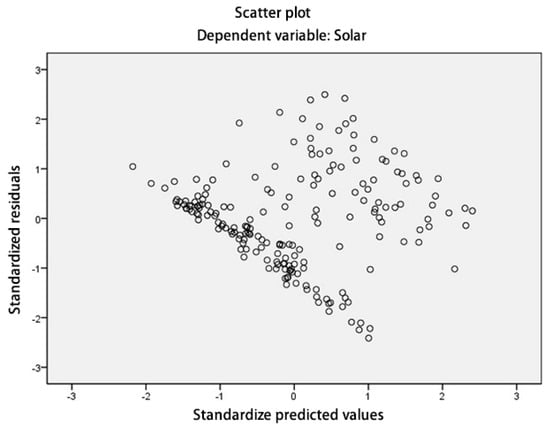
Figure 13.
Residual histogram.
4.4.5. Spring Wind Speed Regression Verification
Figure 14 illustrates the residual histogram of this linear regression model. It is evident that the frequency distribution of residuals deviates from the strict adherence to the normal distribution curve. However, there is a noticeable increase in the frequency of residuals with a value of 0, suggesting proximity to a normal distribution. In the context of the multiple linear regression model, an assumption is made concerning the independence of residuals, and no autocorrelation is detected in this model. Additionally, the scatter plot of the regression equation (Figure 15) displays a relatively uniform distribution of residuals, indicating the absence of significant heteroscedasticity. Based on a comprehensive diagnostic evaluation of the linear regression model, we confidently conclude that the results obtained from this linear regression model are valid, underscoring the practical value of the derived linear regression equation.
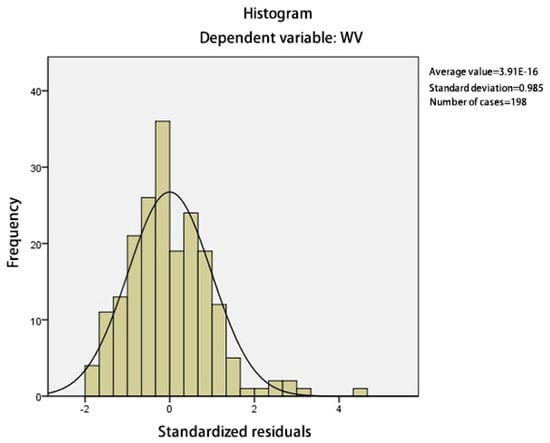
Figure 14.
Residual histogram.
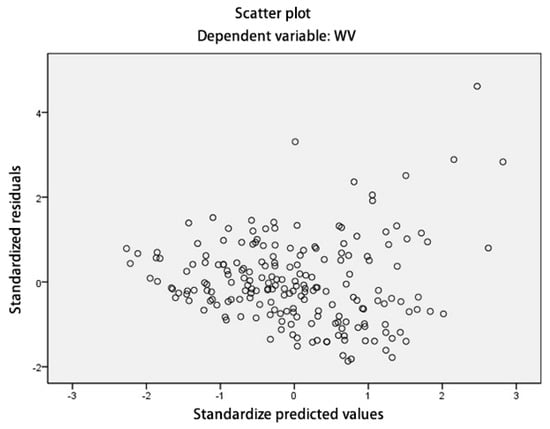
Figure 15.
Residual histogram.
4.4.6. Summer Wind Speed Regression Verification
Figure 16 displays the residual histogram of this linear regression model. The frequency distribution of residuals is not strictly aligned with the normal distribution curve. Nevertheless, a noteworthy increase in the frequency of residuals with a value of 0 suggests proximity to a normal distribution. In the context of the multiple linear regression model, an assumption is made concerning the independence of residuals. In linear regression models, it is a standard assumption that the error terms are uncorrelated. Moreover, no autocorrelation is evident in this model. The scatter plot of this model (Figure 17) illustrates a relatively uniform distribution of residuals, indicating the absence of significant heteroscedasticity. A comprehensive diagnostic evaluation of the linear regression model leads us to confidently affirm the validity of the results obtained, emphasizing the practical significance of the derived linear regression equation.

Figure 16.
Residual histogram.
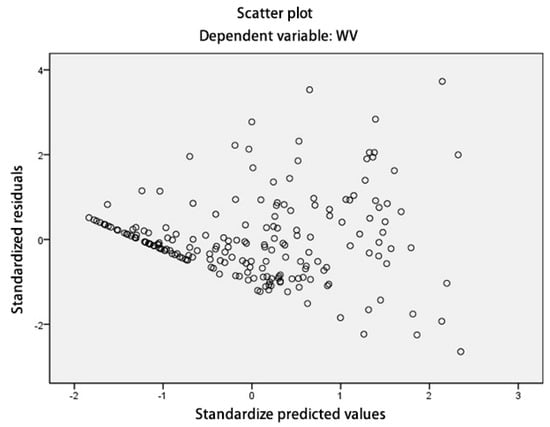
Figure 17.
Residual histogram.
5. Discussion
Based on the comparison of the air temperature model during spring and summer, the study reveals the following key findings. Firstly, irrespective of the season, the sky view factor (SVF) exerts a significant influence on the temperature at the measurement points. Secondly, in spring, the floor area ratio (FAR) notably impacts the air temperature (Ta) at the measurement points, with higher FAR values associated with lower air temperatures. This effect is attributed to the increased FAR leading to reduced solar radiation received within the street canyon, resulting in lower temperatures. Conversely, during summer, the green planting ratio (GnPR) significantly affects the air temperature (Ta) at the measurement points, with higher GnPR values being correlated with lower air temperatures. Consequently, it can be deduced that reducing the floor area ratio proves beneficial in elevating environmental air temperatures and enhancing comfort levels in early spring. Furthermore, during summer, enhancing green areas, particularly with higher leaf area index (LAI) values for trees, serves as an effective approach to lowering environmental air temperatures and improving comfort levels.
Based on the comparison of the solar radiation models during spring and summer, it is evident that the sky view factor (SVF) significantly influences solar radiation in both seasons, with weights of 0.444 and 0.483, respectively. A larger SVF corresponds to higher solar radiation received at the measurement points. In summer, the average building height (L) also exhibits statistical significance, with a weight of −0.12, indicating that taller buildings result in reduced solar radiation at the measurement points. Additionally, the greenery parameters “Tree crown area” and “Green Planting Ratio (GnPR)” demonstrate significant correlations with solar radiation during both spring and summer. However, they fail to pass the significance test. This discrepancy arises from the fact that, at a specific measurement point, the presence of tree crown shading directly impacts solar radiation more than the tree crown area within a 50 m radius around the point. Consequently, the SVF inherently accounts for information about both buildings and trees obstructing the measurement points, rendering the inclusion of greenery parameters unnecessary in the solar radiation models for both spring and summer.
Based on the comparison of wind speed (WV) models during spring and summer, it is evident that, under calm wind conditions, the environmental meteorological factor, specifically the reference humidity (RefRH), significantly impacts the wind speed at the measurement points. The weights for RefRH are 0.251 and 0.384 in spring and summer, respectively. Among the urban morphological factors, the “average building height (L)” exerts the most substantial influence on wind speed at the measurement points in both seasons, with impact weights of 0.333 and 0.313, indicating that higher L values are associated with greater wind speeds. The “average building height-to-area ratio (HBDG)” also significantly affects wind speed at the measurement points in both seasons, with weights of −0.214 and −0.150, respectively, suggesting that higher HBDG values correspond to lower wind speeds. In spring, the “tree crown area (Tree)” notably impacts wind speed at the measurement points, with a weight of −0.198, indicating that larger tree crown areas are associated with lower wind speeds. In summer, both the “Sky View Factor (SVF)” and the “building shape coefficient (BSC)” significantly influence wind speed at the measurement points, with weights of 0.244 and −135, respectively. Hence, higher SVF values and lower BSC values are correlated with higher wind speeds at the measurement points.
While this paper has made preliminary research progress, further comprehensive investigations are necessary to address several aspects. The key points for further discussion are as follows:
- (1)
- The study has successfully established a predictive model for urban microclimate and comfort based on real measurements. However, the model’s training demands a substantial amount of long-term data. Due to constraints related to time, weather conditions, personnel, budget, and safety, the measurements were limited to clear and slightly cloudy weather with calm winds during spring and summer, utilizing mobile measurement methods. In future research, it is imperative to augment meteorological data for autumn and winter, as well as daytime, by utilizing an adequate number of fixed meteorological stations.
- (2)
- As the study’s investigations into microclimate and subjective comfort are rooted in empirical studies conducted in the Shanghai region, the drawn conclusions are applicable solely to Shanghai and areas with similar climates. For regions with differing climates, further comparative studies are essential.
- (3)
- Considering the growing popularity of artificial neural network models, it is essential to explore the utilization of smart city data to acquire urban meteorological big data and to compare the fitting robustness of multiple linear regression analysis models using alternative modeling approaches.
6. Conclusions
This study utilizes meteorological data obtained through field measurements and urban morphology data acquired from a geographic information system (GIS) to analyze the impact of urban morphology factors on microclimate parameters. Partial correlation analysis and multiple linear regression analysis were performed using the SPSS 27 software, with measured temperature, solar radiation, and wind speed as dependent variables and meteorological parameters at reference points and urban morphology factors at measurement points as independent variables. Predictive models were developed accordingly. Ultimately, a set of seven urban morphology factor indicators that influence the microclimate was established, including sky view factor (SVF), floor area ratio (FAR), average building height (L), greenery ratio (GnPR), height-to-built area ratio (HBDG), building site coverage (BSC), and tree canopy area (Tree).
The findings are as follows: (1) Open spaces with high spatial openness, such as squares, playgrounds, and lawns, exhibit better comfort levels during early spring and other transitional seasons, while the opposite is true during summer. Therefore, planting deciduous trees in these areas is advisable to mitigate high summer temperatures. (2) To maximize solar radiation intake during transitional seasons such as spring, permanent structures such as buildings should be designed to increase the sky view factor. Simultaneously, the dense canopies of deciduous trees provide effective shading during summer. (3) The correlation between greenery and wind speed is more significant in spring, whereas the relationship between building morphology factors and wind speed is more significant in summer. Outdoor public spaces should be strategically positioned around buildings in sheltered locations to minimize wind exposure.
In conclusion, this empirical study confirms the substantial influence of urban morphology factors on urban microclimate. In the future, it is important to consider specific factors based on regional environmental characteristics, combining building morphology factors such as floor area ratio and exterior wall surface area with greening factors. This integration will improve the natural climatic conditions of urban spaces, enhance the thermal comfort for users, and provide a scientifically guided approach to urban design.
Author Contributions
Conceptualization, R.W. and C.X.; methodology, R.W.; software, R.W.; validation, R.W. and Z.C.; formal analysis, R.W. and C.X.; investigation, R.W.; resources, R.W.; data curation, R.W. and C.X.; writing—original draft preparation, C.X. and R.W.; writing—review and editing, D.S. and H.T.; project administration, R.W. and H.T.; funding acquisition, H.T. All authors have read and agreed to the published version of the manuscript.
Funding
Shandong Jianzhu University Doctoral Fund Project, Research on the Correlation between Urban Morphological Factors and Microclimate (X20006Z). China Ministry of Housing and Urban-Rural Development 2022 Scientific and Technological Project Plan (2022-K-184, 2022-K-148). China National Natural Science Foundation General Project (52078341, 51878392). China Ministry of Education Humanities and Social Sciences Research Youth Fund Project (21YJC840038).
Data Availability Statement
No new data were created.
Conflicts of Interest
The authors declare no conflict of interest.
References
- Oke, T.R. Boundary Layer Climates; Routledge: London, UK, 1987. [Google Scholar]
- Masson, V.; Heldens, W.; Bocher, E.; Bonhomme, M.; Bucher, B.; Burmeister, C.; de Munck, C.; Esch, T.; Hidalgo, J.; Kanani-Sühring, F.; et al. City-descriptive input data for urban climate models: Model requirements, data sources and challenges. Urban Clim. 2020, 31, 100536. [Google Scholar] [CrossRef]
- Ding, W.; Hu, Y.; Dou, P. Research on the correlation between urban morphology and urban microclimate. J. Archit. 2012, 7, 16–21. [Google Scholar]
- Yang, F.; Chen, L. Developing a thermal atlas for climate-responsive urban design based on empirical modeling and urban morphological analysis. Energy Build. 2016, 111, 120–130. [Google Scholar] [CrossRef]
- Chen, S.; Wong, N.H.; Zhang, W.; Ignatius, M. The impact of urban morphology on the spatiotemporal dimension of estate-level air temperature A case study in the tropics. Build. Environ. 2023, 228, 109843. [Google Scholar] [CrossRef]
- Yu, Z.; Chen, S.; Wong, N.H.; Ignatius, M.; Deng, J.; He, Y.; Hii, D.J.C. Dependence between urban morphology and outdoor air temperature: A tropical campus study using random forests algorithm. Sustain. Cities Soc. 2020, 61, 102200. [Google Scholar] [CrossRef]
- Xu, M.; Hong, B.; Jiang, R. Study on the impact of campus roadside trees on outdoor pedestrian thermal comfort in summer. Chin. Landsc. Archit. 2020, 36, 139–144. [Google Scholar]
- Li, R.; Zeng, F.; Zhao, Y.; Wu, Y.; Niu, J.; Wang, L.L.; Gao, N.; Shi, X. CFD simulations of the tree effect on the outdoor microclimate by coupling the canopy energy balance model. Build. Environ. 2023, 230, 109995. [Google Scholar] [CrossRef]
- Yang, Y.; Gatto, E.; Gao, Z.; Buccolieri, R.; Morakinyo, T.E.; Lan, H. The “plant evaluation model” for the assessment of the impact of vegetation on outdoor microclimate in the urban environment. Build. Environ. 2019, 159, 106151. [Google Scholar] [CrossRef]
- Liu, J.; Tang, H.; Zheng, B. Simulation study of summer microclimate in street space of historic conservation areas in China—A case study in Changsha. Front. Environ. Sci. 2023, 11, 1146801. [Google Scholar] [CrossRef]
- Hu, X.; Wei, D.; Li, B. Study on the correlation between urban spatial morphological indicators and street wind environment. New Archit. 2020, 139–143. [Google Scholar] [CrossRef]
- Cai, Z.; Tang, Y.; Liu, C.; Matthias, D. Planning responses to the three-dimensional urban spatial morphological evolution and surface heat island effect: A case study of Beijing. Int. Urban Plan. 2021, 5, 61–68. [Google Scholar]
- Krüger, E.; Givoni, B. Outdoor measurements and temperature comparisons of seven monitoring stations: Preliminary studies in Curitiba, Brazil. Build. Environ. 2007, 42, 1685–1698. [Google Scholar] [CrossRef]
- Giridharan, R.; Lau, S.S.Y.; Ganesan, S. Nocturnal heat island effect in urban residential developments of Hong Kong. Energy Build. 2005, 37, 964–971. [Google Scholar] [CrossRef]
- Shashua-Bar, L.; Tzamir, Y.; Hoffman, M.E. Thermal effects of building geometry and spacing on the urban canopy layer microclimate in a hot-humid climate in summer. Int. J. Climatol. 2004, 24, 1729–1742. [Google Scholar] [CrossRef]
- Giridharan, R.; Ganesan, S.; Lau, S.S.Y. Daytime urban heat island effect in high-rise and high-density residential developments in Hong Kong. Energy Build. 2004, 36, 525–534. [Google Scholar] [CrossRef]
- Eliasson, I.; Svensson, M.K. Spatial air temperature variations and urban land use—A statistical approach. Meteorol. Appl. 2003, 10, 135–149. [Google Scholar] [CrossRef]
- Alcoforado, M.J.; Andrade, H. Nocturnal urban heat island in Lisbon (Portugal): Main features and modelling attempts. Theor. Appl. Climatol. 2006, 84, 151–159. [Google Scholar] [CrossRef]
- Tong, S.; Wong, N.H.; Jusuf, S.K.; Tan, C.L.; Wong, H.F.; Ignatius, M.; Tan, E. Study on correlation between air temperature and urban morphology parameters in built environment in northern China. Build. Environ. 2018, 127, 239–249. [Google Scholar] [CrossRef]
- Lu, J.; Li, C.; Yu, C.; Jin, M.; Dong, S. Regression analysis of the relationship between urban heat island effect and urban canopy characteristics in a mountainous city, Chongqing. Indoor Built Environ. 2012, 21, 821–836. [Google Scholar] [CrossRef]
- Vuckovic, M.; Kiesel, K.; Mahdavi, A. Toward advanced representations of the urban microclimate in building performance simulation. Sustain. Cities Soc. 2016, 27, 356–366. [Google Scholar] [CrossRef]
- Yan, T.; Jin, H. Study on urban heat island effect in severe cold regions based on WRF/UCM numerical simulation. Build. Sci. 2020, 36, 107–113. [Google Scholar]
- Zhang, H.; Tang, J.; Guo, F. WRF/UCM assessment method for the impact of urbanization on thermal environment. J. Dalian Univ. Technol. 2019, 59, 372–378. [Google Scholar]
- Zhang, H.; Tang, J.; Guo, F.; Lu, X. Heat island mitigation strategies for high-density historic blocks based on ventilation corridors. J. Archit. 2020, 17–21. [Google Scholar]
- Tang, Y.; Chen, K. Research on urban design strategies for green open spaces based on climate adaptation zoning. Urban Archit. 2017, 33–37. [Google Scholar] [CrossRef]
- Liu, S.; Yu, B.; Song, D.; Wang, S.; Wu, B. A preliminary exploration of the construction method for urban ventilation systems based on climate analysis: A case study of Xiamen City. Urban Archit. 2019, 16, 61–66. [Google Scholar]
- You, X.; Li, Q.; Meng, Q. Research on spatial pattern and differentiated regulation strategies of urban heat island: A case study of downtown Guangzhou. Landsc. Archit. 2021, 28, 74–79. [Google Scholar]
- Huang, Y.; Liu, J.; Chen, F.; Shen, L.; Stewart, I. Study on urban morphology and its heat island intensity based on local climate zoning theory. New Archit. 2019, 126–131. [Google Scholar] [CrossRef]
- Yuan, X.; Meng, Q. Analysis and evaluation of urban underlying surface temperature based on thermal infrared remote sensing. Build. Energy Effic. 2020, 48, 112–117+146. [Google Scholar]
- Yuan, X.; Meng, Q. Study on regional surface temperature distribution based on low-altitude thermal infrared remote sensing. Build. Energy Effic. 2019, 47, 145–151+182. [Google Scholar]
- Li, L.; Meng, Q.; Zhang, L. Research on large-scale solar radiation simulation system based on climatic wind tunnel. Build. Energy Effic. 2020, 48, 75–79+138. [Google Scholar]
- Jiang, Y.; Zhao, L.; Meng, Q. Research on thermal comfort of urban pedestrian spaces in hot and humid regions during summer. J. Civ. Environ. Eng. 2020, 42, 174–182. [Google Scholar]
- Jin, H.; Qiao, L.; Cui, P. Research on winter thermal comfort of campus in severely cold regions based on outdoor activities. Build. Sci. 2021, 37, 87–92+103. [Google Scholar]
- Sun, C.; Luo, X.; Liu, L. Study on the correlation between microclimate thermal comfort and crowd behavior in cold region commercial pedestrian streets: A case study of Harbin Central Street. Build. Sci. 2022, 38, 240–249. [Google Scholar]
- Taleghani, M.; Crank, P.J.; Mohegh, A.; Sailor, D.J.; Ban-Weiss, G.A. The impact of heat mitigation strategies on the energy balance of a neighborhood in Los Angeles. Sol. Energy 2019, 177, 604–611. [Google Scholar] [CrossRef]
- Morakinyo, T.E.; Lau, K.L.; Ren, C.; Ng, E. Performance of Hong Kong’s Common Trees Species for Outdoor Temperature Regulation, Thermal Comfort and Energy Saving. Build. Environ. 2018, 137, 157–170. [Google Scholar] [CrossRef]
- Santamouris, M.; Haddad, S.; Saliari, M.; Vasilakopoulou, K.; Synnefa, A.; Paolini, R.; Ulpiani, G.; Garshasbi, S.; Fiorito, F. On the Energy Impact of Urban Heat Island in Sydney. Climate and Energy Potential of Mitigation Technologies. Energy Build. 2018, 166, 154–164. [Google Scholar] [CrossRef]
- Sasaki, Y.; Matsuo, K.; Yokoyama, M.; Sasaki, M.; Tanaka, T.; Sadohara, S. Sea breeze effect mapping for mitigating summer urban warming: For making urban environmental climate map of Yokohama and its surrounding area. Urban Clim. 2017, 24, 529–550. [Google Scholar] [CrossRef]
- Chao, R.; Chao, Y.; He, Z.; Wu, E. Research on Urban Ventilation Corridors and Their Planning Application. Urban Plan. J. 2014, 3, 52–60. [Google Scholar]
- Ng, E. Towards planning and practical understanding of the need for meteorological and climatic information in the design of high-density cities: A case-based study of Hong Kong. Int. J. Climatol. 2012, 32, 582–598. [Google Scholar] [CrossRef]
- Zang, X. Research on Green Block Urban Design Strategies and Methods; Tianjin University: Tianjin, China, 2014. [Google Scholar]
- Song, D.; Wei, R. Green Building Design Strategies for High-Density Cities in Tropical Climates: The Case of WOHA Architecture Firm’s Hostel Practice in Singapore. Huazhong Archit. 2017, 78–87. [Google Scholar]
- Ministry of Housing and Urban-Rural Development of the People’s Republic of China, Thermal Design Code for Civil Buildings; China Planning Press: Beijing, China, 1993.
- Li, Z. Research on Urban Street Layout Index System: Taking 1000 m × 1000 m Grids as an Example; Nanjing University: Nanjing, China, 2016. [Google Scholar]
- Dong, C. High-Density Architecture; China Architecture & Building Press: Beijing, China, 2012. [Google Scholar]
- Yuan, C. Exploring Planning Methods to Alleviate the Urban Heat Island Effect in High-Density Cities: A Case Study of Hong Kong. J. Archit. 2010, 120–123. [Google Scholar]
- Chen, J.M.; Black, T.A. Measuring leaf area index of plant canopies with branch architecture. Agric. For. Meteorol. 1991, 57, 1–12. [Google Scholar] [CrossRef]
- Ong, B.L. Green plot ratio: An ecological measure for architecture and urban planning. Landsc. Urban Plan. 2003, 63, 197–211. [Google Scholar] [CrossRef]
- Jusuf, S.K.; Wong, N.H. Development of empirical models for an estate-level air temperature prediction in Singapore. In Proceedings of the Second International Conference on Countermeasures to Urban Heat Islands, Berkeley, CA, USA, 21–23 September 2009; pp. 21–23. [Google Scholar]
- Jin, H.; Cui, P.; Wong, N.H.; Ignatius, M. Assessing the Effects of Urban Morphology Parameters on Microclimate in Singapore to Control the Urban Heat Island Effect. Sustainability 2018, 10, 206. [Google Scholar] [CrossRef]


Disclaimer/Publisher’s Note: The statements, opinions and data contained in all publications are solely those of the individual author(s) and contributor(s) and not of MDPI and/or the editor(s). MDPI and/or the editor(s) disclaim responsibility for any injury to people or property resulting from any ideas, methods, instructions or products referred to in the content. |
© 2023 by the authors. Licensee MDPI, Basel, Switzerland. This article is an open access article distributed under the terms and conditions of the Creative Commons Attribution (CC BY) license (https://creativecommons.org/licenses/by/4.0/).