Abstract
To study the cold-forming effect on the yield strength distribution of cold-formed thick-walled steel, material tensile tests and axial compression tests were conducted on steel-lipped channels. To undertake the material tensile tests, five types of cold-formed lipped channel sections with varied thicknesses and nominal yield strengths were selected. The material test samples were taken from the web, flange, curled edge, and corner of the lipped channel sections, respectively. Next, a corresponding distribution model for the yield strength of cold-formed thick-walled lipped channel sections was developed. Following this, axial compression tests of five short columns with the same section as the coupon tests were conducted to further investigate the cold-forming effect. Finally, the results from the short column tests, the results based on the proposed yield strength distribution model, and the results calculated for related codes in various countries were compared. These revealed that the yield strength distribution, bearing capacity, and ductility were considerably influenced by the cold-forming effect and mainly depended on the width-to-thickness ratio (h/t) of the plate involved. When h/t was less than 34, the curve slowly decreased after reaching the peak load and had good ductility. Conversely, when h/t was greater than 71, local buckling had an obvious influence on the bearing capacity of the specimen, and the column ductility was poor. Overall, the results based on the Chinese code GB 50018-2002 were closest to the experimental values with the smallest variation coefficient, and therefore this code has the best applicability.
1. Introduction
Cold-formed steel is an efficient material, with flexible and abundant cross-sectional forms. It is widely used in construction, transportation, machinery manufacturing, electric power, and other industries [1]. Research reveals that a reasonable consideration of the impact of the cold-formed strengthening effect is conducive to improving the efficiency of the steel [1,2,3,4,5,6,7].
As early as 1968, the American AISI provided cold-formed steel specifications for the design of cold-formed steel with a wall thickness not exceeding 25.4 mm, rather than a few millimeters. In 1973, Yu Weiwen conducted an experiment on thick-walled steel (12.7 mm and 25.4 mm) at the University of Missouri in Rolla to confirm the applicability of AISI specifications for cold-formed steel sections with wall thicknesses exceeding 6.35 mm. In recent years, multiple scholars [4,5,6,7,8,9,10,11,12,13,14] have extensively researched cold-formed thick-walled steel, including the structural behavior of extremely thick-walled cold-formed square steel columns [6,7], the residual stress of rectangular hollow sections [8], the mechanical properties of cold-formed steel tubular sections at elevated temperatures [9,10], the buckling resistance of cold-formed thick-walled steel columns under combined axial compression and bending [11], the overall stability of axially compressed cold-formed thick-walled steel tubes [12], the design reliability of cold-formed thick-walled steel members under axial compression [13], and the hysteretic behavior of axially loaded cold-formed thick-walled steel members [5,14].
Currently, the Chinese National Standard Technical Code of Cold-formed Thin-wall Steel Structures (GB 50018-2002) is being revised [15] and can now be applied to cold-formed steel with a thickness of 0.6–25 mm. For a more comprehensive understanding of the performance of various types of cold-formed steel in terms of the cold-forming effect, and to provide a test basis for standard revision, it is necessary to expand the scope of cross-sectional research. In this study, a tensile test of material properties was conducted on typical parts of five kinds of cold-formed lipped channel steel, and the strengthening effect of each part was examined. Following this, a yield strength distribution model of a channel section with thick-walled cold-formed steel was developed. Next, axial compression tests of five short columns with the same section as the coupon test were performed to further investigate the cold-forming effect. Finally, through comparative analysis, the applicability of the cold-formed strengthening formulae in each country’s specification for the calculation of thick-walled cold-formed rolled-edge channels was verified.
2. Tensile Tests of Material Properties
2.1. Specimen Design
Taking into consideration the influence of the plate’s width–thickness ratio (h/t) and steel strength grade, five kinds of cold-formed steel with a lipped channel section were selected for the tensile test of material properties. These are detailed in Table 1, and the symbols denoting each section size are depicted in Figure 1.

Table 1.
Parameters of steel sections in the tests.
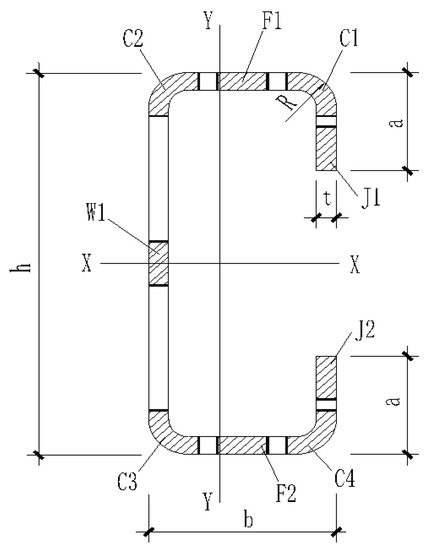
Figure 1.
Symbols for section sizes and coupons in a typical location.
The material test samples were taken at the web, edge, flange, and corner of the channel steel; the sampled specimens and their positions in the channel section are displayed in Figure 1. There was one web specimen (W1), two edge specimens (F1 and F2), two flange specimens (J1 and J2), and four corner specimens (C1, C2, C3, and C4) in the channel section. To reduce the test error, we repeated sampling three times for each of the five sections. Thus, a total of 135 material specimens were obtained. The base metal of each channel section was also sampled three times prior to cold-roll forming, resulting in a total of fifteen samples from base metal (M0). Therefore, there were 150 specimens overall.
All these specimens were evaluated according to the Chinese code GB/T 228 [16], and the parameters for each sample were calculated according to Formula (1):
where L0 is the length of the specimen gauge section, A0 is the section area of the specimen gauge section, and K is a coefficient; according to the standard [16], K = 5.65.
The shape of the specimen is depicted in Figure 2, revealing that it was processed into a dumbbell shape.

Figure 2.
Size diagrams for material specimen fabrication (unit: mm): (a) flat-plate specimen; (b) corner specimen.
The plate specimens, such as the web, edge, and flange plates, were obtained along the length of the steel tubes and the sampling of the base material followed the rolling direction of the steel plate, the shape of which is presented in Figure 2.
According to the regulation [16], arc specimens can be used for corner parts, as used in a previous study [5]. However, round-bar specimens can also be used for corner parts, such as those used in [4]. Usually, arc specimens are easier to fabricate than round-bar specimens. In this experiment, the round-bar specimen was selected, the shape of which is illustrated in Figure 2b.
All the specimens were obtained using a wire electrical cutting machine, and each specimen was numbered and marked as soon as it was cut. The fabricated specimens are displayed in Figure 3.
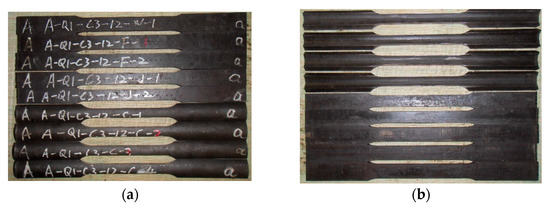
Figure 3.
Fabricated material specimens: (a) front side; (b) reverse side.
2.2. Tensile Test Process and Phenomenon
The initial geometric dimensions such as width, thickness, and gauge length of each sample were measured before the tensile test. The width and thickness were measured at the two ends of the plate specimen and the middle of the gauge section. Next, the minimal size was selected as the cross-sectional area of the gauge section. The cross-sectional area of the corner was calculated using the cutting and weighing method [5].
The tensile test of material properties was conducted in the Structural Laboratory of the Department of Building Engineering, Tongji University. The stress–strain curves of each specimen were recorded using an extensometer.
To eliminate the influence of small eccentricity due to the deviation caused by installation during stretching, two strain gauges were attached to both sides of the specimen to measure its strain value. The test loading rate was adopted according to the Chinese code. The position and form of the fractures in the specimens are illustrated in Figure 4.

Figure 4.
Specimen fractures: (a) overall fracture; (b) part fracture.
Figure 4 reveals that most fracture positions of the plate specimens were located inside the extensometer, and only a few specimen fractures were located outside the extensometer. This phenomenon may be attributable to the non-uniform material properties of the coupon, the machining error of the wire-cutting machine, and the small eccentric tension that occurred during the test.
2.3. Stress–Strain Relationship Curves
The stress–strain (σ–ε) curves of the five lipped channel steel sections are presented in Figure 5. All curves were the average of three repeated test groups.
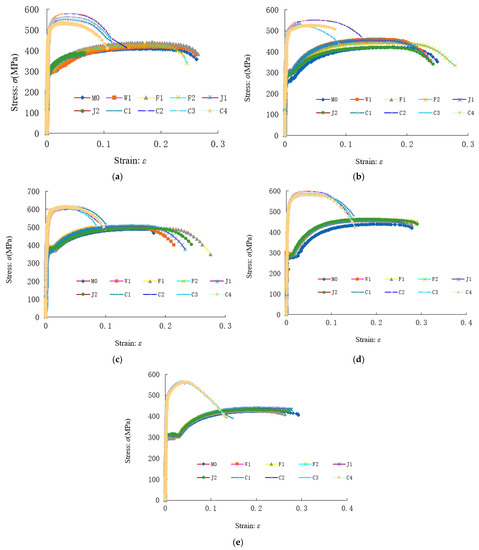
Figure 5.
Stress–strain curves of different sections: (a) Section C-1; (b) Section C-2; (c) Section C-3; (d) Section C-4; (e) Section C-5.
The following three conclusions can be drawn from Figure 5:
- (1)
- The tensile strength of the corner specimens C1~C4 is significantly higher than that of other plate specimens, while the elongation of the corner specimens is significantly reduced, and there is no obvious yield platform.
- (2)
- The curves of the specimens in the flat plate are coincident, suggesting that the mechanical properties of the web, flange, and edge are close to each other.
- (3)
- The curve of the flat part (F1~F2) is slightly higher than that of the base metal (M0), which demonstrates that there is a certain cold-formed effect in the flat part, but this is weaker than the effect in the corner parts.
2.4. Analysis of the Test Results
The yield point was used as the yield strength of the material for the specimen with a yield platform, while the stress corresponding to 0.2% plastic strain was used as the yield strength of the material for the specimen without a yield platform [17].
Table 2 displays the yield strength fy, ultimate strength fu, elongation δc, and elastic modulus E for all the specimens. All data are the average values of three groups of repeated tests for each specimen. In this table, fym, fum, δm, and Em are the yield strength, tensile strength, elongation ratio, and elastic modulus of the base metal, respectively.

Table 2.
Summary of material property test results for various parts.
The following conclusions can be drawn from Table 2:
- (1)
- By calculating the ratio of fy/fu, we found that the yield-to-tensile strength ratio of the base metal (M0) was less than 0.85, and the elongation ratio was greater than 20%. This met the requirements of the Chinese seismic code [18] for steel performance, demonstrating that the steel material selected in this test was acceptable.
- (2)
- The ratio of the yield strength of the web, flange, and curling edge parts to the base metal varied (fy/fym) from 1.01 to 1.15, thus indicating that there was a certain cold-formed strengthening effect in the plate part. The ratio of the flat parts was close to 1.0, meaning that the strengthening degree of the flat plate was not particularly strong. The ratio of the yield strength of the corner to the base metal varied (fy/fym) from 1.42 to 1.65, and the degree of strengthening was significantly higher than that of the plate parts.
- (3)
- The ratio of the ultimate strength of the plate parts (web, flange, and edge) to the base metal varied (fu/fum) between 0.96 and 1.06 but was concentrated near 1.0, indicating that the cold-formed strengthening effect did not increase the ultimate strength of the plate specimen. The ratio of the average ultimate strength of the corner parts to the base metal varied from 1.15 to 1.38, and the degree of strengthening was greater than that of the plate parts. The main reason for this may be that the corner is greatly affected by cold bending and the internal iron element lattice structure changes, which further improves its ultimate tensile strength.
- (4)
- The elongation of the plate parts decreased compared with the base metal. Notably, the corner parts decreased the most, exceeding 50%.
The elastic moduli (E) of different parts were very close to 2.06 × 10⁵ MPa. This difference can be ignored in the calculation. Therefore, the cold-formed process has little effect on the elastic modulus of cold-formed thick-walled steel, which is consistent with the conclusions of [5,7,10].
3. Yield Strength Distribution Model
Yield strength is one of the most important parameters in cold-formed steel calculation. Therefore, given the influence of the cold-forming effect, it is immensely important to propose a simple and practical yield strength distribution model for steel calculations.
A yield strength distribution model for the cold-formed thick-walled steel was proposed, which is shown in Figure 6. The model was based on the research methods in [5] and took into consideration the material test results. In this figure, R is the outer diameter of the corner parts, fym is the average yield strength of the base metal, and the other symbols are the same as in Figure 1.
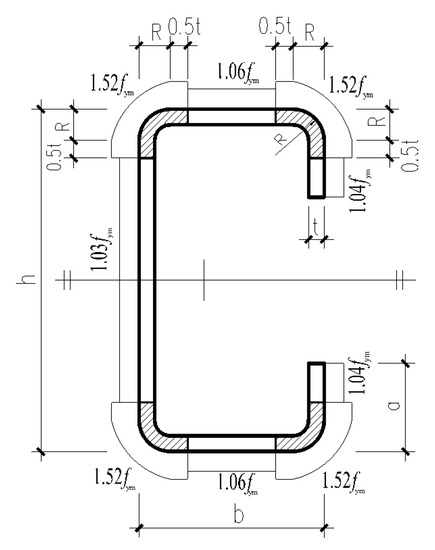
Figure 6.
Yield strength distribution model for cold-formed channel steel sections.
Cold working can cause the distortion and deformation of the metal lattice, resulting in the shear and slip of grains, as well as the elongation of grains. These can increase the hardness of the surface layer metal and reduce the plasticity of surface layer metal deformation, known as the cold-forming effect. As indicated in Figure 6, the degree of the cold-forming effect at different positions of the section was different, which is mainly caused by the width–thickness ratio of the plate and the sequence of the cold-formed process. A large width–thickness ratio (such as that of the web) is less affected by the cold-forming effect, and vice versa. However, some parts of the plate were subjected to the cold-forming effect twice (such as the flange) due to bending hardening, and this effect was stronger than that of only one-time parts (such as the curling edge).
Among the three flat plates, the web part exhibited the weakest strengthening because the web width–thickness ratio (h/t) was the largest, far away from the corner parts; hence, the cold bending process had the least influence. The flange was the part most affected by the cold-forming strengthening effect in the flat plate because its width–thickness ratio (b/t) was small, close to both corners, and this was influenced by cold bending in the two corners. The cold-forming effect at the curled edge was intermediate because the width-to-thickness ratio (a/t) of the curled edge was the smallest, and the position from the bending angle was the closest, but it only underwent one-time cold bending.
Based on Figure 6, we can calculate the full section yield load of cold-formed thick-walled channel steel. We only need to know the yield strength of the base metal (fym) and then multiply the strength distribution coefficient of each part by the area of the corresponding part.
4. Axial Compression Tests of Short Columns
To further investigate the cold-forming effect, the axial compression tests of five short columns with the same section as the coupon test were performed. The load-carrying capacity of the full section was obtained by performing these axial compression tests and could verify the accuracy of the yield strength distribution model and the standard calculation.
4.1. Specimen Design
To ensure the comparability of the column test results, the axial compression tests of short columns also used the five kinds of section steel listed in Table 1. The measured parameters of the short columns are presented in Table 3, where L is the measured length of the short column.

Table 3.
Parameters of short columns.
4.2. Test Setup and Measurement
4.2.1. Test Setup
The short columns axial compression tests were performed in the Construction Engineering Structure Laboratory of Tongji University, as this facility has a 5000 kN electro-hydraulic servo testing machine. The ends of the short column were milled using a milling machine to ensure that the two end faces of the column were flat. During the tests, the short columns were directly placed on the bottom loading plate of the testing machine, and the upper and lower centroids of the short column were aligned to the center of the loading plate to ensure axial compression. The entire test set-up of the specimen installed on the testing machine is depicted in Figure 7.
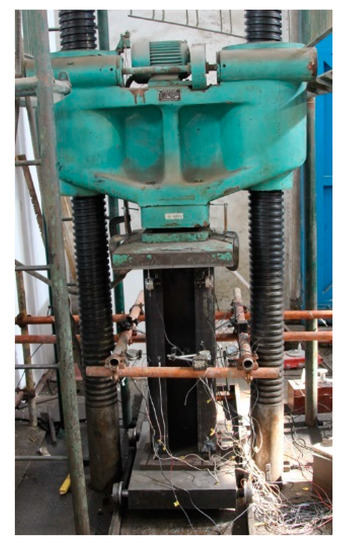
Figure 7.
The entire test set-up.
4.2.2. Measuring Point Arrangement
The cross-section of the channel member was single axisymmetric, rendering it more complicated to determine its centroid than that of the bisymmetric cross-section. Therefore, the accuracy of short column installation on the test device was ensured by using several strain gauges and displacement meters.
Overall, twelve strain gauges (S1~S12) were arranged on the column, as shown in Figure 8. S1, S3, S5, S7, and S9 were arranged in the middle of each plate, and S2, S4, S6, and S8 were arranged in each corner. To monitor the web deformation, two strain gauges (S11, S12) were arranged at half web height (h/2) from the upper and lower ends. The strain gauges played a central role at the beginning of the test and during the monitoring of the stress state.
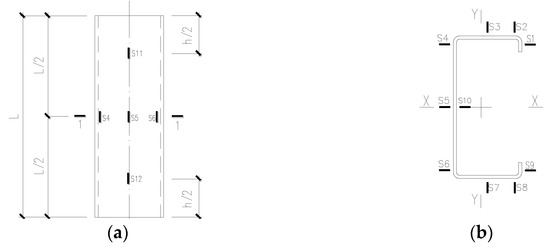
Figure 8.
Arrangement of strain gauges: (a) vertical arrangement; (b) Section 1-1.
Ten displacement meters (D1~D10) were arranged on the column, as depicted in Figure 9. To obtain the load–displacement relationship curve for the entire process of short column compression, four vertical displacement meters (D1~D4) were arranged at each corner of the column to measure the vertical displacement. To measure the horizontal deformation of the column, six horizontal displacement meters (D5~D10) were arranged in the middle of the short column.
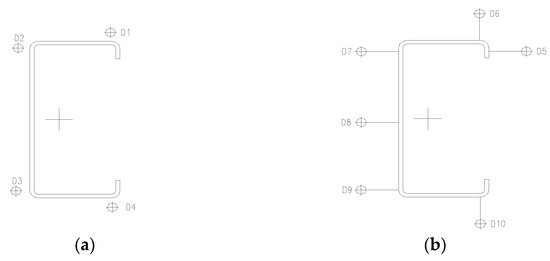
Figure 9.
Arrangement of displacement meters: (a) vertical arrangement; (b) horizontal arrangement in middle height of column.
4.3. Axial Compression Test Phenomena and Analysis of Results
There were two failure modes in the five specimens of the short column: the distortional buckling failure and full-section yield failure. The width-to-thickness ratio (h/t = 66.7) of the ZC1 web was the largest, which was a distortional buckling failure, while the others were full-section yield failures. Figure 10, Figure 11, Figure 12, Figure 13 and Figure 14 display the failure modes of ZC1~ZC5.
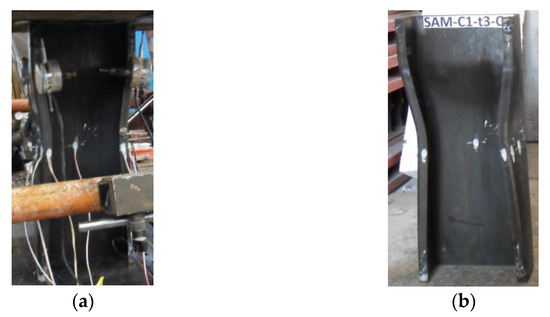
Figure 10.
Failure mode of ZC1: (a) ultimate failure state; (b) final failure mode.
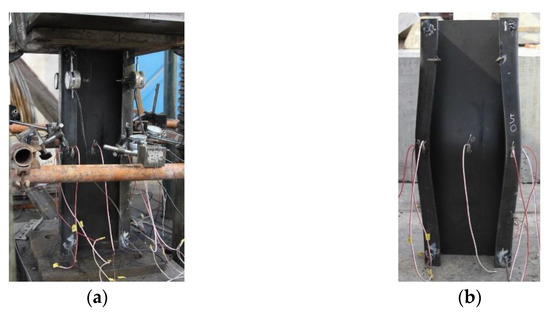
Figure 11.
Failure mode of ZC2: (a) ultimate failure state; (b) final failure mode.
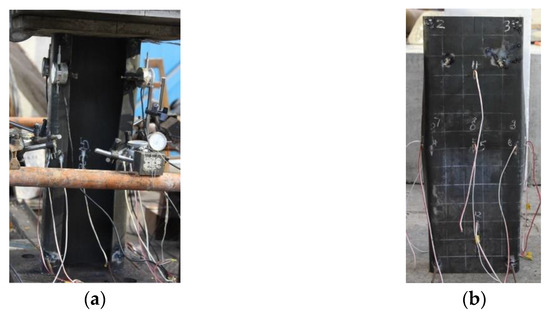
Figure 12.
Failure mode of ZC3: (a) ultimate failure state; (b) final failure mode.
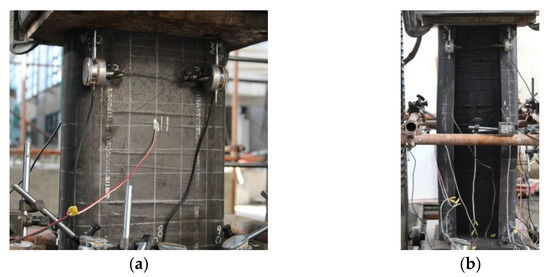
Figure 13.
Failure mode of ZC4: (a) ultimate failure state; (b) final failure mode.
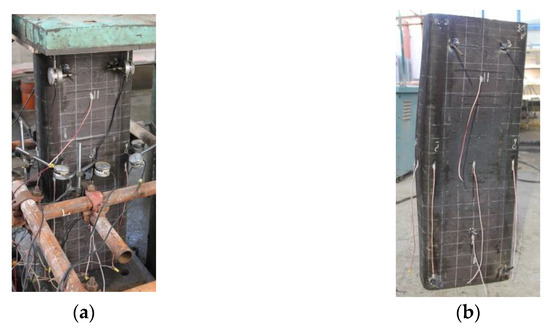
Figure 14.
Failure mode of ZC5: (a) ultimate failure state; (b) final failure mode.
When the peak load was reached, the displacement meter readings of D6, D8, and D10 of ZC1 were significantly larger than those of other horizontal directions, which indicated clear distortional buckling. The horizontal displacement meter readings of other thick-walled columns were small and were full-section yield failures. When the load was applied to the ultimate bearing capacity of the short columns, all exhibited obvious surface iron peeling except for ZC1. The test phenomena suggested that the thick-walled columns were in a full-section compression state, and the plate had no obvious local buckling deformation. The strain gauge readings indicated that the strain of ZC1 was less than the yield strain, while the strains of others were greater than the yield strain. All the test results revealed that different failure modes were affected by the width–thickness ratio of the column plate.
4.4. Stress–Strain Relationship Curves
The load–displacement curves (N–Δ) and the nominal stress–strain curves (σ–ε) of the short-column specimen are depicted in Figure 15, where the nominal stress was obtained by dividing the test load by the cross-sectional area. From the figure, the following conclusions are drawn:
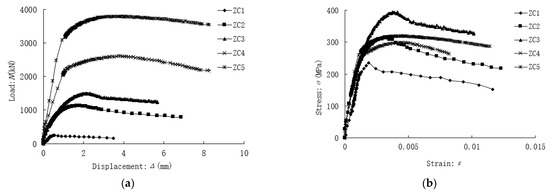
Figure 15.
Relationship curves of short columns: (a) the load–displacement curves (N-Δ); (b) the nominal stress–strain curves (σ-ε).
- (1)
- The sections of ZC2 and ZC3 are the same; only the strength grade of materials differs, which leads to the curve of ZC3 being higher than that of ZC2, although the trend is close.
- (2)
- The width-to-thickness ratio of specimen ZC4 is slightly larger than that of ZC5, so the curve of ZC4 decreases slightly faster after the peak point but slower than ZC1, ZC2, and ZC3.
- (3)
- Compared with the other four full-section yield failure specimens, the curve of ZC1 displays a sudden drop after the peak, and the stress peak point cannot reach the material yield strength (see Table 2), exhibiting obvious instability failure characteristics.
5. Comparison of Different Results
To verify the accuracy of the yield strength distribution model in Figure 6 and compare the applicability of the codes [15,19,20], the calculation results were compared with the short column test results. The comparison results are listed in Table 4. In the table, ft is the average yield strength test value of the whole section, fmod is the yield strength calculated using the distribution model, f1 is the yield strength calculated using the Chinese standard formula [15], f2 is the yield strength calculated using the North American standard formula [19], and f3 is the yield strength calculated using the European standard formula [20].

Table 4.
Comparison between test results with the proposed yield strength distribution model and formulas for the main codes.
The following conclusions can be drawn from Table 4:
- (1)
- Compared with the yield strength of the base metal, the yield strength of the whole section of the short column increased by 2.8–10.2%. Therefore, it is reasonable to consider the increase in yield strength caused by the cold-forming effect when we calculate the yield strength of the cold-formed thick-walled steel.
- (2)
- The results calculated using the distribution model and different codes were close to the results for the short columns test. Their mean values were greater than 1.0 and between 1.004 and 1.097, which was slightly unsafe, but the coefficient of variation was small, and the calculation results were stable.
- (3)
- The mean value calculated using the distribution model was 1.039, which was smaller than the North American standard formula [19] and the European standard formula [20] but larger than the Chinese standard formula [15]. The above results suggest that the distribution model proposed in this paper is feasible.
- (4)
- With respect to the different codes in various countries, the mean value of the calculation results of the Chinese code, 1.004, was the smallest, and the dispersion coefficient was also small, so the Chinese code is optimal in terms of applicability.
6. Conclusions
Material properties tensile tests were conducted on each part of five cold-formed channel steel sections, and axial compression tests were completed on five short columns with corresponding sections. By comparing the test results with the yield strength distribution model proposed in the article and the formula calculation results for different codes, the following main conclusions can be drawn:
- (1)
- The ratio of the yield strength of the plate parts to the base metal varied between 1.01 and 1.15, indicating that the strengthening degree of the plate parts was not obvious. The ratio of the yield strength of the corner parts to the base metal varied between 1.42 and 1.65; therefore, the degree of strengthening of the corner parts was much higher than that of the plate parts.
- (2)
- The width–thickness ratio (h/t) of the plate greatly influenced the shape of the stress–strain relationship curve of the short column. When the width–thickness ratio of the column was less than 34, such as in specimen ZC2, the curve slowly decreased after reaching the peak load and had good ductility. By contrast, when the width-to-thickness ratio was greater than 71, such as in specimen ZC1, local buckling had an obvious influence on the bearing capacity of the specimen, and column ductility was poor.
- (3)
- The yield strength of the short column was 2.8–10.2% higher than that of the base metal; hence, it is reasonable to consider the cold-forming strengthening effect in cold-formed thick-walled steel.
- (4)
- The average value of the ratio between the calculated results of the yield strength distribution model and the short column test results was 1.039, demonstrating that the distribution model proposed in this paper is reasonable and feasible.
- (5)
- In every country code used to calculate the equivalent yield strength of cold-formed thick-walled steel, the average value of the ratio of their calculated results to the test results was slightly greater than 1.0. Among these, the Chinese code was the smallest, 1.004 and therefore can be used in the calculation of the cold-formed thick-walled steel well.
Author Contributions
Conceptualization, X.F. and S.Y.; methodology, X.F.; investigation, X.F. and X.M.; data curation, W.X.; writing—original draft preparation, X.F. and W.X.; writing—review and editing, W.X., S.Y. and X.M.; project administration, X.F.; funding acquisition, S.Y. All authors have read and agreed to the published version of the manuscript.
Funding
This research was supported by research funds from Shanghai Urban Construction Vocational College, grant number AA-05-2023-01-03-05-16; the “Chen Guang” project supported by Shanghai Municipal Education Commission and Shanghai Education Development Foundation, grant number 22CGB12; and the Shanghai Rising-Star Program, grant number 21QB1406400.
Data Availability Statement
Data will be made available on request.
Conflicts of Interest
The authors declare no conflict of interest.
References
- Yu, W.; LaBoube, R.; Chen, H. Cold-Formed Steel Design, 5th ed.; John Wiley & Sons: New York, NY, USA, 2019. [Google Scholar]
- Cao, H.P.; Huu, N.T.; Gwénaëlle, P. Effect of manufacturing process on microstructures and mechanical properties, and design of cold-formed G450 steel channels. Thin-Walled Struct. J. 2021, 162, 107620. [Google Scholar]
- Kaijalainen, A.; Mourujärvi, J.; Tulonen, J.; Steen, S.; Kömi, J. Effect of direct quenching on the mechanical properties of cold formed S500 rectangular hollow section. Procedia Manuf. 2020, 20, 777–783. [Google Scholar] [CrossRef]
- Li, Y.Q.; Li, G.W.; Shen, Z.Y. Modification method for yield strength of cold-formed thick-walled steel sections considering cold-forming effect. J. Build. Struct. J. 2015, 36, 1–7. (In Chinese) [Google Scholar]
- Wen, D.H. Research on Seismic Performance of Cold-Formed Thick-Walled Steel Tubular Beam-Columns. Ph.D. Thesis, Tongji University, Shanghai, China, 2014. (In Chinese). [Google Scholar]
- Liu, Z.; Liu, H.; Chen, Z.; Zhang, G. Structural behavior of cold-formed thick-walled rectangular steel columns. Constr. Steel Res. J. 2018, 147, 277–292. [Google Scholar] [CrossRef]
- Liu, D.; Liu, H.; Chen, Z.; Liao, X. Structural behavior of extreme thick-walled cold-formed square steel columns. J. Constr. Steel Res. J. 2017, 128, 371–379. [Google Scholar] [CrossRef]
- Zhang, X.; Liu, S.; Zhao, M.; Chiew, S.-P. Residual stress of cold-formed thick-walled steel rectangular hollow sections. Steel Compos. Struct. J. 2016, 22, 837–853. [Google Scholar] [CrossRef]
- Imran, M.; Mahendran, M.; Keerthan, P. Mechanical properties of cold-formed steel tubular sections at elevated temperatures. Constr. Steel Res. J. 2018, 143, 131–147. [Google Scholar] [CrossRef]
- Liang, Z.; Wang, W.; Wang, Z. Effect of cold-form and tensile strain rate on mechanical properties of Q345 steel at elevated temperatures. Constr. Steel Res. J. 2022, 191, 107192. [Google Scholar] [CrossRef]
- Yi, Z.; Huang, D.; Li, T.; Li, Y. Buckling resistance of cold-formed thick-walled steel columns under combined axial compression and bending. J. Build. Eng. J. 2022, 51, 104300. [Google Scholar]
- Li, G.; Li, Y. Overall stability behavior of axially compressed cold-formed thick-walled steel tubes. Thin-Walled Struct. J. 2018, 125, 234–244. [Google Scholar] [CrossRef]
- Li, Y.Q.; Li, G.W.; Shen, Z.Y. Design reliability analysis of cold-formed thick-walled steel members under axial compression. J. Build. Struct. J. 2015, 36, 8. [Google Scholar]
- Li, G.W.; Li, Y.Q. Investigation on the hysteretic behavior of axially loaded cold-formed thick-walled steel members. Struct. J. 2022, 38, 1411–1425. [Google Scholar] [CrossRef]
- GB 50018-2002; Technical Code of Cold-Formed Thin-Wall Steel Structures. China Planning Press: Beijing, China, 2002.
- GB/T 228.1-2010; Metallic Materials-Tensile Testing Part 1: Method of Test at Room Temperature. China Standard Press: Beijing, China, 2010.
- Afshan, S.; Rossi, B.; Gardner, L. Strength enhancements in cold-formed structural sections—Part I: Material testing. J. Constr. Steel Res. 2013, 83, 177. [Google Scholar] [CrossRef]
- GB 50011-2010; Code for Seismic Design of Buildings. China Architecture & Buildings Press: Beijing, China, 2010.
- AISI S100-2018; North American Specifications for the Design of Cold-Formed Steel Structural Members. American Iron and Steel Institute: Washington, DC, USA, 2018.
- BS EN 1993-1-6; 2006 Eurocode 3: Design of Steel Structures. Britain Standards Institute: London, UK, 2006.
Disclaimer/Publisher’s Note: The statements, opinions and data contained in all publications are solely those of the individual author(s) and contributor(s) and not of MDPI and/or the editor(s). MDPI and/or the editor(s) disclaim responsibility for any injury to people or property resulting from any ideas, methods, instructions or products referred to in the content. |
© 2023 by the authors. Licensee MDPI, Basel, Switzerland. This article is an open access article distributed under the terms and conditions of the Creative Commons Attribution (CC BY) license (https://creativecommons.org/licenses/by/4.0/).