Abstract
The color of urban streets plays a crucial role in shaping a city’s image, enhancing street appeal, and optimizing the experience of citizens. Nevertheless, the relationship between street color environment and residents’ perceptions has rarely been deeply discussed, and most of the existing studies adopt qualitative methods. To accurately and effectively assess the connection between street color environment and residents’ emotional perceptions, this paper introduces a quantitative research framework based on multi-source data called “Color Emotion Perception with K-Means, Adversarial Strategy, SegNet, and SVM (CEP-KASS)”. By combining K-Means unsupervised machine learning and SegNet computer vision techniques, it captures and analyzes visual elements and color data from Baidu Street View Images (BSVI). It then employs a human–machine adversarial scoring model to quantify residents’ perceptions of BSVI and uses the support vector machine regression model to predict the final perception scores. Based on these data, a Pearson correlation analysis and visual analysis were conducted on the elements and color in the urban environment. Subsequently, the streets were classified based on perception frequency and perception scores by integrating multi-source data, and areas within the third ring of Xuzhou City were selected for validating the research framework. The results demonstrate that utilizing street-view images and the CEP-KASS framework can quantitatively analyze urban color perception and establish a connection with residents’ emotions. In terms of color perception, red, orange, and blue all have a strong positive correlation with the interesting score, whereas black is positively correlated with a sense of safety. Regarding color attributes, low-saturation bright colors result in higher fun perception scores in urban spaces; too low saturation and brightness can affect their attractiveness to residents; brightness has an inverse relationship with the perception of safety, and adjusting brightness inversely can improve the perceived safety experience in certain urban external spaces. The street classification criteria based on perception frequency and perception scores proposed herein can provide references for planners to prioritize color transformation decisions, with a priority on emulating HSHF streets and transforming LSHF streets. When formulating color planning, suggestions for color adjustment can be given based on the correlation study of color with visual elements and perception scores, optimizing urban residents’ spatial perception and their emotional experiences. These findings provide robust theoretical support for further enhancing the visual quality of streets and refining urban color planning.
1. Introduction
In the contemporary quest for superior quality development, the generation of refined urban public spaces has emerged as a subject of paramount interest for urban planners and administrators. Serving as public arenas that foster physical activity and routine social engagement among city dwellers [1], the caliber of urban streets (encompassing both tangible spatial quality and intangible psychological perception) constitutes a vital benchmark for gauging a city’s habitability and its commitment to human-centered principles [2]. Interdisciplinary investigations have corroborated the positive influence of exceptional streets on residents’ well-being, bolstering morale whilst effectively diminishing the prevalence of assorted maladies [3,4,5,6]. Gaining a genuine and precise understanding of the current quality of street spaces and residents’ emotional perception towards urban areas is of paramount importance to government officials and urban planners. This knowledge dictates how they should optimize and enhance the environment, thereby attracting a greater influx of talents, investors, and enterprises. Such attraction, in turn, serves as a robust catalyst for propelling urban development [7]. Streets, being the carriers of numerous urban functions, garnered attention from the academic sector quite early on. In the 1960s, the burgeoning phenomena of urban space segregation, quality decline, and loss of vitality became prevalent, leading a group of pioneering individuals in urban research, including Jane Jacobs [8] and Henri Lefebvre, to begin exploring the quality of street spaces and their impact on society and economy. Subsequently, the dimensions of research concerning street spaces diversified. Allan Jacobs conducted an extensive analysis of hundreds of streets located around the world from various physical spatial perspectives including plan, section, scale, street D/H ratio, and the degree of refinement in street furniture. Through this meticulous examination, he summarized and identified the physical attributes inherent to great streets [9].
The methodologies for assessing street quality have continually evolved with the advancement of science and technology. Early street perception research relied on random sampling [10,11,12], surveys, or field investigations [13]. McGinn and his colleagues conducted telephone interviews to gather perceptions of the built environment from diverse groups [14], and Sallis et al. conducted an evaluation of travel route spatial environments via 43 questionnaires [12]. Nonetheless, these modest-scale empirical investigations, rooted in local spaces, lack robust universality, and the protracted process data of acquisition and challenges in quantification render them ill-suited to support more rigorous, large-scale research on street quality. The maturation of scientific knowledge and the widespread adoption of computer technology have engendered a novel data landscape, paving the way for meticulous street studies. The procurement of high-resolution streetscape imagery and the alleviation of quantification difficulties have spurred a growing body of scholars to undertake the quantitative depiction of urban built space environmental characteristics and quality using streetscape images as a foundation [15,16,17,18]. The advancement of machine learning algorithms furnishes technical backing for more fine-grained inquiries. Deep learning algorithms like SegNet and ResNet, in tandem with deep convolutional neural networks and support vector machines, facilitate the efficient deep processing of streetscape images. Multiple elemental features within images, including sky, road, buildings, and landscape, can be effectively identified [19,20,21]. With streetscape data serving as the blueprint, researchers such as Li Xiaojian have validated the significance of streetscape data in quantifying and mapping urban environmental features [22], prompting extensive inquiries into green view indices and street sequences. Scholars including Yang Zhuo [18], Long Ying [19,20,21], Ye Yu [20], and Zhao Qing [23] employed these data for comprehensive quantitative examinations of street spatial quality.
The perceptual research highlighted above primarily focuses on qualitatively and quantitatively describing the objective spatial quality from a user’s physiological standpoint. With the advent of human-centric ideologies, studies exploring users’ subjective psychological perceptions of space have gradually emerged. The notable psychological experiment by experimental psychologist Treichler indicates that humans obtain 83% of perceptual information through vision, compared to other sensory modalities such as hearing and touch [24]. This substantiates that users’ perception of urban street spaces predominantly hinges on visual cues rather than auditory, olfactory, or tactile cues. The external features of space, encompassing its shape, color, and geometric structure, significantly impact users’ psychological perception.
In his book The Luminous Ground [25], architect Alexander mentions that the foundation of every act of construction or creation should be rooted in genuine conscious emotions and personal experiences. Under the human-centered developmental orientation in urban spaces, it is imperative to have designs based on the authentic emotional perceptions of the users. In order to gauge the impact of the urban visual environment on the emotional states of perceivers, the MIT Media Lab, in collaboration with machine learning, initiated a project named Place Pulse, which employed numerous streetscape images to discern and evaluate urban spatial quality across six dimensions, constructing psychological perception maps of urban residents’ street spaces [26]. A multitude of urban perception studies have ensued [27,28], with researchers such as Liu Liu, Zhang Fan [29], and others developing a streetscape image perception scoring model based on deep convolutional neural networks, analyzing the visual elements representing the characteristics of Beijing and Shanghai from the aforementioned six dimensions. Based on a human–machine adversarial model, Wang Lei and his colleagues [30] delineated the urban perception map of the Binjiang District of Hangzhou City and conducted an analysis of the spatial elements affecting residents’ perceptions based on emotion scoring. Moreover, there are researchers concentrated on aspects such as street vitality [31], safety [32,33], happiness [34], and even the link between streetscape quality and geriatric depression from a medical standpoint [35]. Ann Sussman and colleagues have bridged biology with architecture and environmental design, innovatively employing eye-tracking devices and visual attention simulation software through a series of experiments. By capturing users’ authentic experiences, they have unveiled the factors that render streets most conducive to walking, thereby serving human health and well-being [36,37,38,39,40,41,42,43,44,45].
In existing research, the perception of residents regarding the visual aesthetic quality of urban spaces and its impact on their emotions is seldom discussed. Recognized as a complex structure that operates across various dimensions [46], color’s effect on human emotions is a fact well acknowledged within academia, thereby sparking discussions across multiple disciplines. The choice of color in advertising and promotional campaign posters can influence consumers’ perception of products or services, and might even prove more effective than marketing slogans in generating sales [47]. In the medical realm, mounting evidence reveals that plants of different colors can have varying impacts on emotions, psychological and physiological well-being [48,49]. Color psychology also indicates that color can exert varying degrees of influence on human psychological health and emotions, which in turn relate to the quality of residents’ lives [50,51] and levels of physical and mental health [52,53], while also affecting the degree to which users favor a certain location. People aspire to be in environments that enhance work efficiency, and contribute to physiological and psychological well-being, and are inclined to visit spaces that can significantly improve their emotional states. Evans’s study also confirms that color is a key solution for enhancing urban experiences and enjoyment [54].
In human visual perception, color is perceived foremost, with individuals typically noticing the color of a building prior to its architectural form. Image clarity and quality have minimal influence on color, and even at lower resolutions, people can correctly perceive colors and the object outlines they form. Thus, color, being an indispensable component of aesthetics, occupies a significant position in the realm of spatial design. Presently, there exists an abundance of studies concerning urban color; however, scholarly attention appears to be more oriented towards the perception of color within indoor spaces and related issues [55,56,57]. At the urban scale, pertinent research predominantly centers around architectural color, urban color planning, and engages in both qualitative and quantitative inquiries into urban imagery. In Chapter 7 of Christopher Alexander’s book—The Luminous Ground—he gives detailed instructions on how to use the most appropriate colors in architectural creation [25]. Scholars such as Ye Yu [58], Ding Meichen [59], Jiang Bo [60], Zhong Teng [61], and others have harnessed streetscape images and computer recognition technology to execute large-scale quantitative analyses and evaluations of urban and architectural colors. Zhu Xiaoyu and her colleagues [62] have fine-tuned the investigation of color luminosity and chromaticity, drawing upon the extraction of buildings’ dominant colors, thereby offering a constructive reference for urban color planning. Danaci and colleagues embarked from the perspective of color perception, analyzing the attitude changes of subjects towards three major streets in Antalya before and after painting. Consequently, they discerned the impact of the color of architectural facades on urban aesthetics [63].
Although color is an inherent feature of every object’s surface, there remains a gap in empirical studies investigating the impact of color in urban external spaces on residents’ emotional perceptions, with little deep exploration into the dimensions of color composition. Although some studies have ventured into employing street-level imagery data to quantitatively evaluate the relationship between urban street environments and residents’ psychological well-being in major urban regions, the majority of these case studies are based in cities across North America and Europe, with a noticeable paucity of such research conducted in Asian cities.
The existing body of research has amply demonstrated the feasibility of urban spatial perception prediction based on subjective human perception and machine learning. Hence, utilizing street-view imagery along with the CEP-KASS framework outlined in this document, we strive to establish a connection between color and emotion, evaluating the relationship between the street environments within the core urban area of Xuzhou and residents’ emotions from the angle of color perception. Our research homes in on the following questions: How can one accurately delineate the predominant colors of urban streets across a broad scope? Do the environmental traits and compositional elements of various streets, together with their respective colors, impact residents’ emotional perception of the space? What sort of influence do the color characteristics of urban spaces exert on residents’ emotions? Additionally, the study identifies priority areas for urban color planning and renewal based on multi-dimensional data (including spatial syntax, POI, and mobile signaling data), an imperative for second-tier cities like Xuzhou. The findings herein could significantly guide the progression of urban renewal projects and the distribution of related construction funds. This investigation extends the current body of research, filling a void concerning residents’ color perception within urban settings and, from the perspective of color planning, holds practical significance for urban planners aimed at fostering urban environments conducive to enhancing mental well-being. This perspective enables planners to better sculpt urban spaces from the users’ viewpoint.
2. Methods
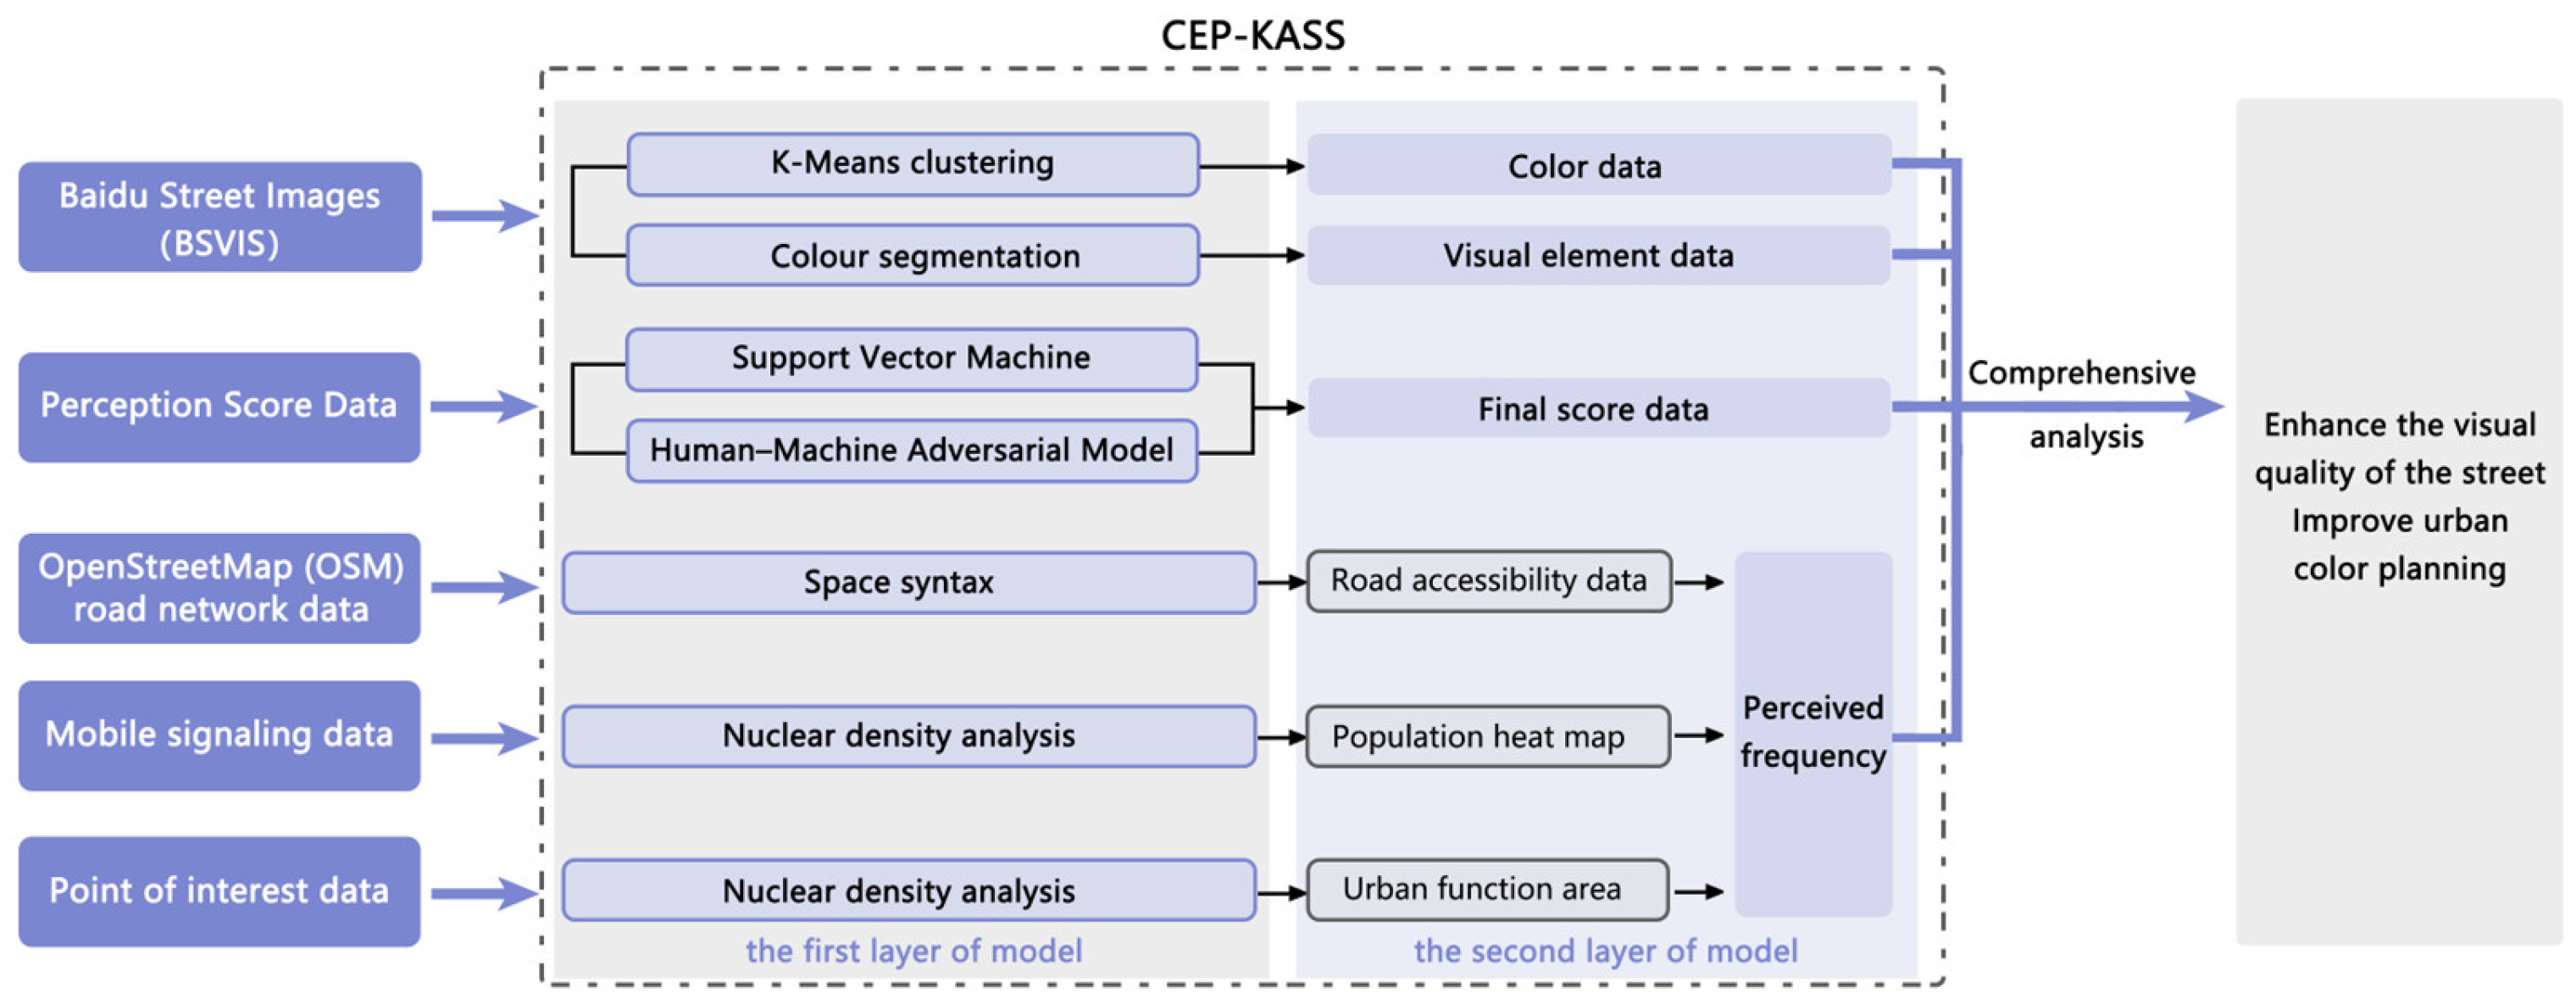
As illustrated in Figure 1, we have structured the CEP-KASS framework into three segments: (1) Acquisition of diverse foundational data. (2) Establishment and training of the integrated model. (3) Data analysis and visualization. The primary segment is focused on procuring the foundational data necessary for the models and methodologies. This encompasses BSVI data, POI (points of interest) data, mobile signaling data, accessibility data, road grid data, and perceptual score data. The second segment aims to transform this foundational data into analyzable data via an integrated model. This involves extracting visual elements and color data from BSVI data using the SegNet model and K-Means, deriving perceptual score data via adversarial human–machine models and SVM, and determining the perceptual frequency of streets using POI data, mobile signaling data, and road accessibility data. The final segment delves into the analysis and visualization of the data resulting from model training, encompassing the examination of color data and perception scores, the analysis of street color environments, and the segmentation of streets based on perception frequency and perception ratings, aiming to ascertain the construction sequencing within the city. Through these analytical endeavors, a nuanced understanding of how color dynamics interact with resident perceptions is anticipated, which in turn, is instrumental in guiding phased developmental initiatives within the urban landscape.

Figure 1.
Research framework of the present study.
2.1. Semantic Segmentation of BSVI
The study employs the MIT ADE20K dataset and the SegNet model for semantic segmentation. This dataset comprises over 150 object categories, such as streets, buildings, and trees, along with over 20,000 images featuring pixel-level semantic labels. It is widely utilized in computer vision research and has been proven to deliver commendable performance in semantic segmentation tasks. The visual element labels produced post-semantic segmentation serve as data for subsequent investigations.
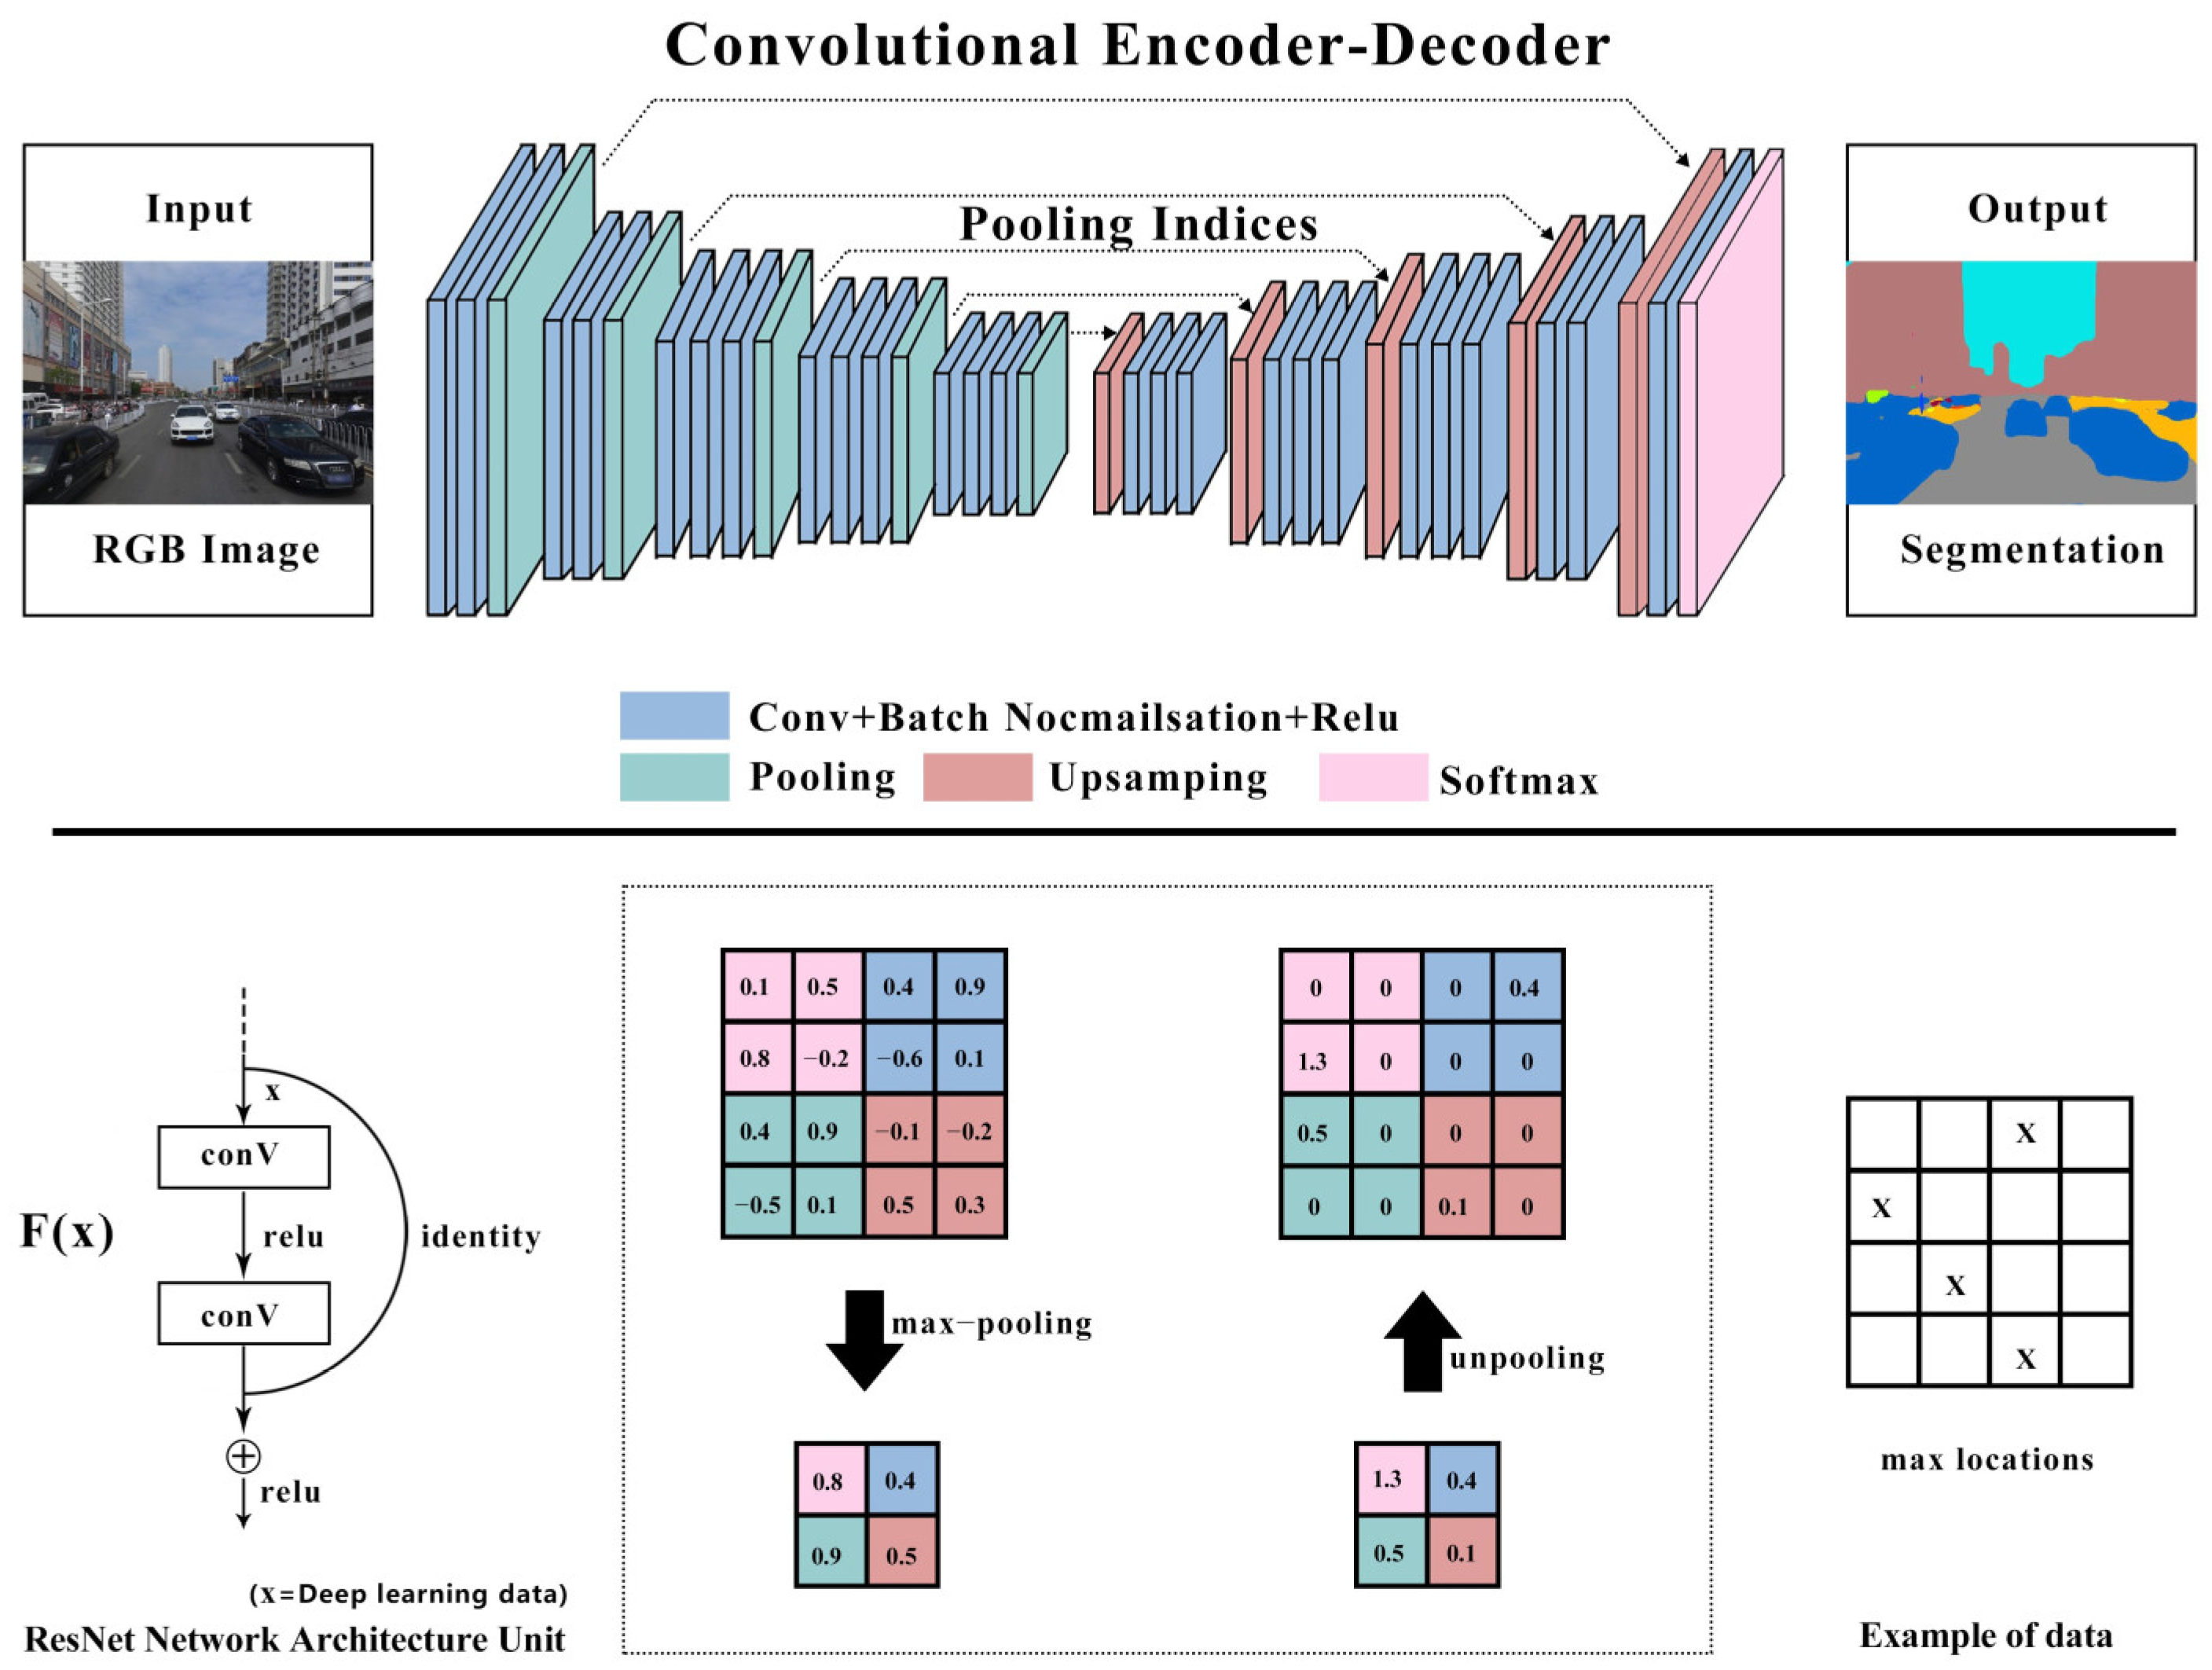
SegNet is a neural network based on an encoder–decoder architecture (Figure 2), proficient in handling street-view images through pixel-wise semantic segmentation [64]. The encoder captures high-dimensional semantic features through convolution and max-pooling, and the decoder utilizes max-pooling indices to execute nonlinear upsampling, eliminating the need to learn upsampling. Subsequently, it generates dense feature maps to preserve high-frequency details in images via convolution operations, and then employs a SoftMax classifier to predict the category of each pixel [65], thus achieving image segmentation. Within SegNet, ResNet50 serves as the backbone network for feature extraction, pinpointing intricate image features, such as edges, corners, and textures, facilitating a more precise segmentation.
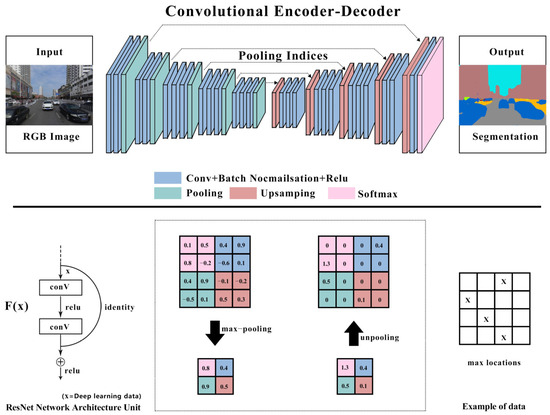
Figure 2.
SegNet calculation principle.
2.2. Human–Machine Adversarial Model and SVM for Score Prediction
2.2.1. Human–Machine Adversarial Model Framework
In recent years, numerous scholars have conducted extensive research related to urban perception [26,27,60,65] based on the six emotional perceptions (beauty, boredom, depression, liveliness, wealth, and safety) of the Place Pulse project [66]. Upon referencing the human–machine adversarial model proposed by Yao [67], and aligning it with the objectives of this study, we fine-tuned the six emotional perceptions from the Place Pulse project and transitioned them to the study of color perception in urban streets. Specifically, we delineated human color perception into five pairs of dimensions, namely: boring–interesting, danger–safe, depressing–lively, poverty–wealthy, and ugly–beautiful, quantifying the perception within a measurement range of 0–100. These five pairs of dimensions serve as a refinement and adjustment of the original six emotional perceptions, aligning more closely with our goal to study the perception of urban street color and emotional responses in a relatively objective manner. For instance, when testers are prompted to evaluate an image on the aspect of “beauty” in color perception, they might provide ratings based on their subjective aesthetic standards. However, when requested to assess the image from the “ugly–beautiful” dimension, testers would consider not only the level of aesthetic appeal during perception but also the degree of ugliness, thereby achieving a more comprehensive and objective rating. Consequently, in the delineation of emotional perception dimensions concerning color, we adhered to the dimensions employed by predecessors in urban perception studies and incorporated antonymous prompt words to form a pair of emotional perception dimensions. The pair depressing–lively can constitute antonymous prompt words in the realm of color emotional perception, and hence, is amalgamated into a single pair of dimensions.
We recruited 30 volunteers acquainted with the research area to evaluate the color environment of streets using the human–machine adversarial model. The model framework is demonstrated in Figure 3.
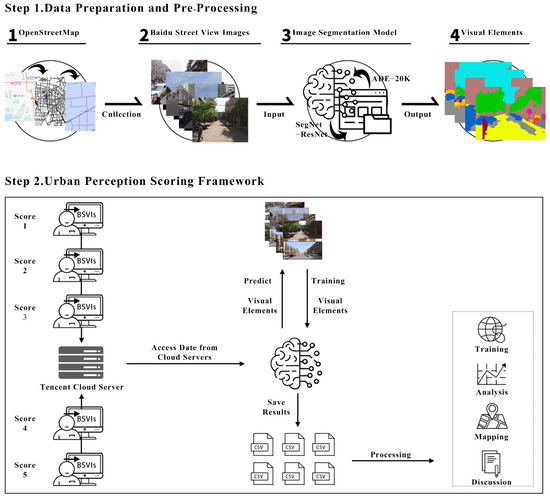
Figure 3.
Overview of the spatial perception scoring process for urban streets based on machine learning.
Each volunteer was tasked with subjectively scoring between 400–2000 street-view images for each emotional dimension. The number of images to be scored depended on the difference between the model-recommended score and the expected human score. Scoring ceased when the score difference for 10 consecutive images stayed within a 5-point range. To ensure a minimum data volume, each volunteer was required to rate at least 400 images. Starting from the 50th street-view image, the model recommended a score for the particular perception dimension based on the volunteer’s previous ratings. Volunteers could either accept this score or provide their own rating.
2.2.2. Support Vector Machine (SVM) for Score Prediction
After performing semantic segmentation on street images and obtaining the percentage of visual elements for each image, Yao [67] utilized a random forest within the human–machine adversarial model framework for predicting perception scores. In contrast, our study selected the support vector machine model, which exhibited a smaller MSE value, to handle the regression problem and predict the relationship between BSVIs data and perception scores, as shown in Table 1.

Table 1.
Comparison of random forest and support vector machine prediction.
The support vector machine (SVM) model employs a radial basis function kernel (RBF kernel) for multi-output regression. The relevant mathematical formulas are as follows:
where x and x′ represent two data points, and σ is the width parameter of the kernel.
The optimization problem for SVM is:
where symbolizes the weight vector; b signifies the bias term; represents the slack variable; C indicates the penalty parameter (regularization parameter); n refers to the number of training samples; yi corresponds to the target value; and constitutes the function mapping data point xi to a high-dimensional feature space.
This SVM is used for regression problems, meaning its optimization objectives and constraints slightly differ from those of the SVM used for classification. In the regression context, the SVM attempts to find a function that minimizes the error between predicted and actual values while maintaining the function’s smoothness. The top 15% of street-view images with the highest predicted scores for each color perception dimension are filtered out, and the proportions of visual elements within these images are weighted and averaged.
2.3. K-Means Clustering and Colour Segmentation
The study employs the K-Means clustering method to extract the primary environmental colors from BSVIs. K-Means clustering is an unsupervised machine learning algorithm widely applied in image segmentation and color quantization. It groups similar colors together and identifies the primary colors in an image. The basic steps and associated mathematical formulas for the K-Means algorithm are as follows:
(1) Choose K data points as the initial cluster centers (in this study, each pixel in BSVIs).
(2) For each data point xi, find the closest cluster center μj and assign it to that cluster.
(3) For each cluster, compute the mean of all its data points and set it as the new cluster center.
(4) Convergence criteria: If the cluster centers do not change significantly, or a pre-defined number of iterations is reached, the algorithm terminates. Otherwise, return to step 2. The objective function to minimize the variance within each cluster is as follows:
After extracting the RGB color data from BSVIs using K-Means clustering, the data are stored. These data are then converted from RGB to HSV format. During the conversion, referencing OpenCV standards [68], the H, S, V values are mapped to ranges [0,180], [0,255], and [0,255] respectively. Following this, the color data are categorized based on the criteria in Table 2. For a more detailed trisection of the luminance and saturation of the colors, “low” corresponds to 1, “medium” corresponds to 2, and “high” corresponds to 3 (e.g., Gray_V2_S1 indicates medium luminance and low-saturation gray).
Table 2.
HSV format color division table in OpenCV.
3. Case Study
3.1. Research Area
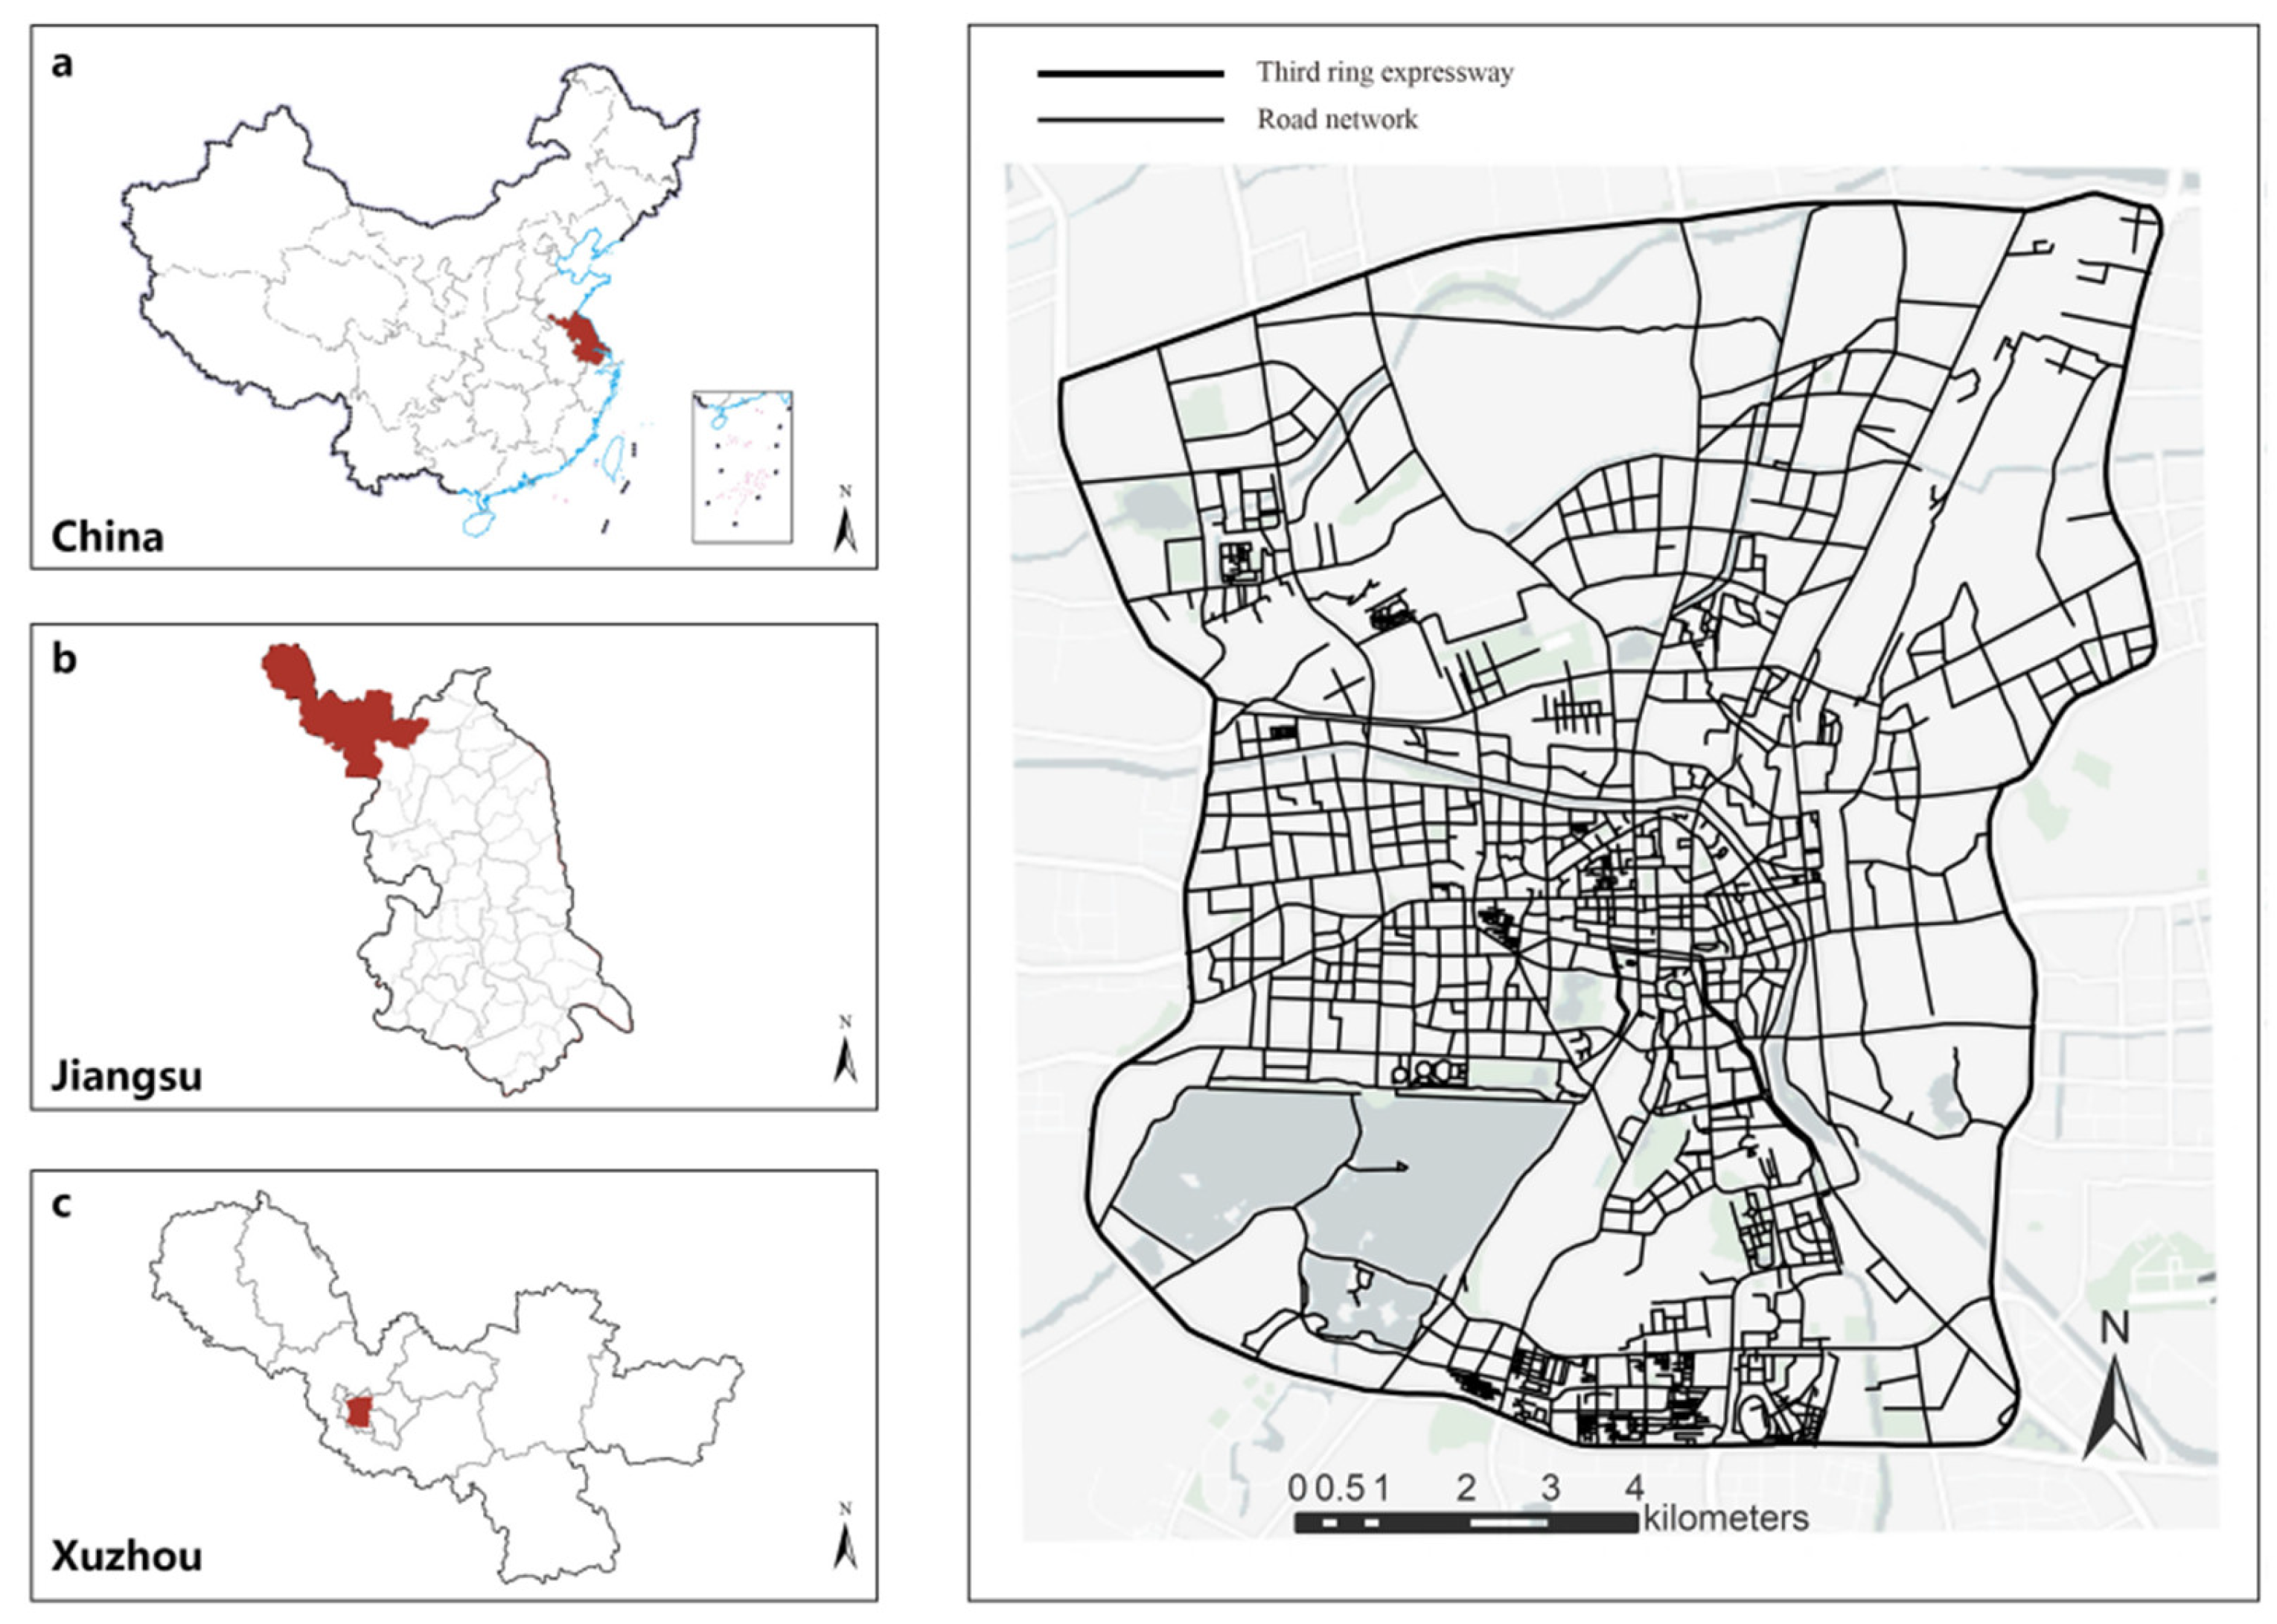
To validate the feasibility and universality of the proposed CEP-KASS framework, we selected the area within the third ring of Xuzhou city, Jiangsu province, China as the case study for this research. As shown in Figure 4, Xuzhou, which is recognized as a second-tier city, is located in the northwest of Jiangsu Province and is an essential railway transportation hub in eastern China. Previous studies have predominantly chosen well-developed first-tier cities with rich street-view image data as subjects, to affirm the feasibility of utilizing street-view imagery for urban research. However, as per recent data statistics, first-tier cities in China represent merely 3% of the total count of cities, suggesting that by validating the proposed methodological framework in second- and third-tier cities, it could be better propagated to a more extensive array of cities. Concurrently, the less-explored second- and third-tier cities harbor about 64% of China’s populace. Under the human-centric development paradigm, conducting research on the living environment health of these residents is highly meaningful and could fill the current research void concerning second- and third-tier cities. By extending the scope of study to cities like Xuzhou, this research endeavor not only broadens the applicability and relevance of the CEP-KASS framework but also contributes to a more inclusive understanding of urban color perception and emotional responses across diverse urban settings, thereby reflecting a more comprehensive picture of urban living environments across China.
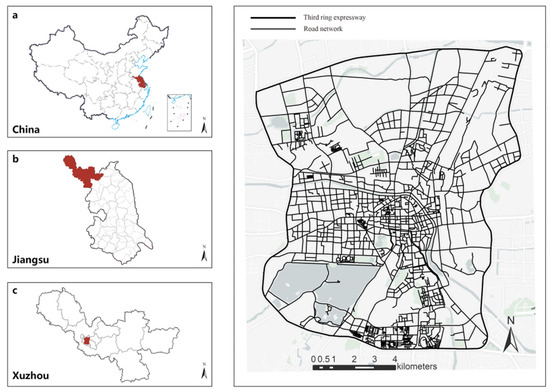
Figure 4.
Overview of the study area: (a) location of Jiangsu Province in southern China, (b) lo-cation of Xuzhou within Jiangsu Province, (c) administrative districts of Xuzhou, highlighting inner ring area.
Fortunately, with the enhancement of street-view image data, the feasibility of street-view-based research has been extended to more non-first-tier cities. Compared to smaller-scale cities, second- and third-tier cities, with their ample street-view images and suitable urban size, emerge as optimal choices for case studies. Hence, on fulfilling the aforementioned conditions, selecting a city with a rich historical and cultural heritage, which has also undergone modernization, over a city solely characterized by modern development, can yield more scientifically accurate conclusions in color environment perception research. Furthermore, such a selection can unveil a greater spectrum of traditional colors, thereby augmenting the robustness of the models within the CEP-KASS framework. This nuanced approach not only enriches the dataset with a diverse range of color palettes reflective of both traditional and modern urban aesthetics but also potentially fosters a more comprehensive understanding of how historical and contemporary urban color schemes influence emotional perceptions amongst urban dwellers. With a history of more than 2000 years, Xuzhou has its unique urban cultural context and derived urban color tone. After undergoing modern construction, the city possesses a wealth of BSVI data. These conditions are favorable for carrying out research on street color environment and perception, and therefore, upon validating the methodological framework, it can be extended to other second- and third-tier cities.
3.2. Data Collection
The core data used in the CEP-KASS framework include: (1) road data, (2) BSVI data, (3) perception score data, and (4) multivariate data: POI data, mobile signaling data.
The first type of data are used to draw street maps, set street-view collection points, and measure street accessibility. The second type are for extracting street color data and visual element data and drawing street color environmental maps. The third type serve the study of the relationship between street color environment and perception. The fourth type are used to determine the frequency of street environment perceptions for overlay analysis. Below are the specific data types and preprocessing methods.
3.2.1. Road Data
Using OpenStreetMap (OSM) to collect street network data for the research area and importing them into ArcGIS, a street-view collection point is generated every 50 m, totaling 31,527 collection points. After merging, simplifying, and topologizing the road network, spatial syntax is used to quantify urban street accessibility. Building upon previous studies on the walking distance of urban residents in China [69], a daily walking distance of 500 m was chosen as the accessibility radius.
3.2.2. BSVI Data
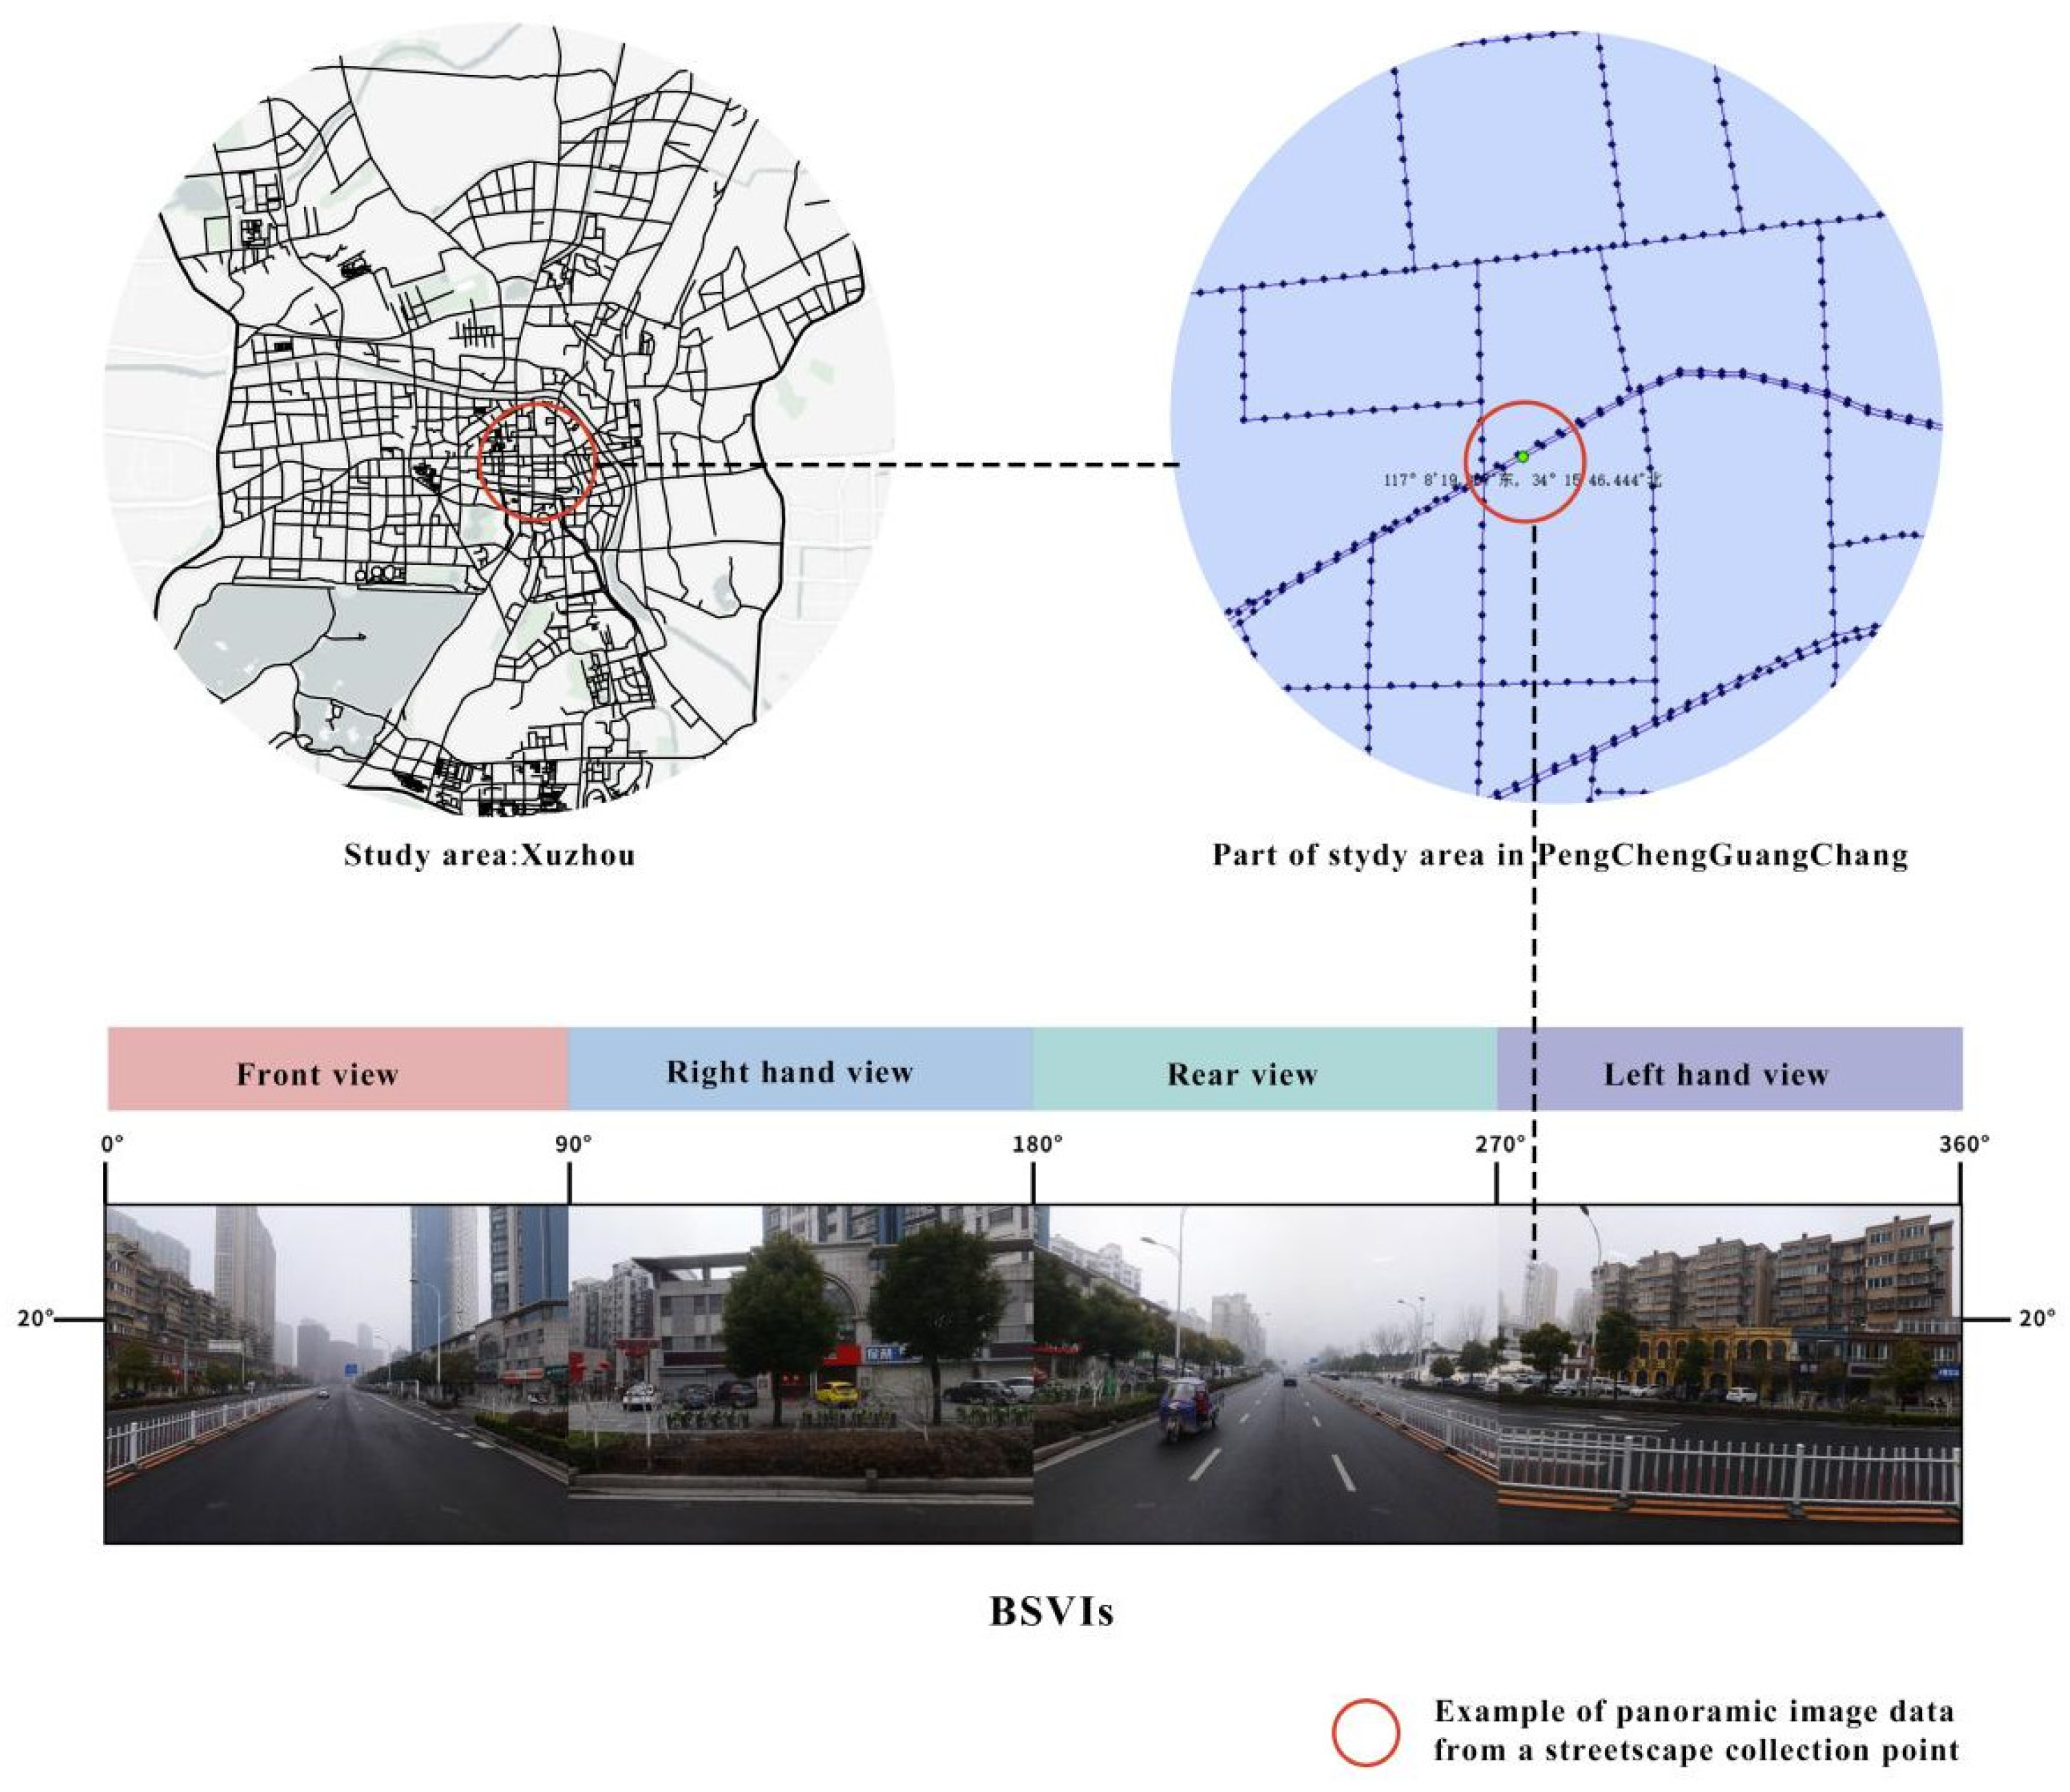
Urban science research is increasingly using street-view images that offer a human-centric observational perspective to analyze street and urban environment quality [70,71]. The BSVI data for this study were collected by using Python to call the Baidu API to search for street-view images in the research area. Specific collection parameters were set as: vertical angle (pitch) of 20° and field of view (fov) width of 90°. After data cleansing, a total of 108,940 valid street-view images were obtained, with each image set to a resolution of 600 × 480 pixels. Subsequent Python code was used to stitch images from four directions at each collection point, resulting in a 360° panoramic image that showcases the color environment of the street where the collection point is located. The detailed street-view collection point settings and collection examples are shown in Figure 5 shows the road network in the inner ring area.

Figure 5.
Example of the BSVI collection process.
3.2.3. Perception Score Data
Perception data obtained from the human–machine adversarial model was cleaned to remove invalid data. A total of 70% of the data was used for training the support vector machine (SVM) model, and the remaining 30% served as test data for model validation. The end result was an adversarial dataset. The accuracy of urban perception prediction trained by the SVM is presented in Table 3.
Table 3.
Training accuracy of the urban perception estimation via random forest.
3.2.4. Multivariate Data Perception Score Data
(1) POI Data: Using Python, data were scraped for 36,709 points of interest (POI) within the research area and categorized into seven types: dining, shopping and consumption, tourist attractions, daily life services, entertainment, healthcare, and fitness. Detailed classifications and data can be found in Table 4.
Table 4.
POI detailed classifications and data.
3.3. Model Training and Optimization
3.3.1. Model Ensembling
Stacking is an ensemble technique where the output of the first-layer models is used as input for the second-layer model (meta-model). Within the CEP-KASS framework, to ensure that the information extracted from the multivariate foundational data is accurately utilized for subsequent data analysis and visualization, we adopted the stacking ensemble modeling technique. As illustrated in Figure 1, the core of the CEP-KASS framework is the establishment and training of an integrated model. The purpose of the ensemble model is to combine predictions from multiple models, thus enhancing the overall model’s accuracy and robustness. In the first layer, the SegNet model, K-Means, human–machine adversarial model, and SVM model were integrated, ensuring the information extracted from various data sources can be accurately transformed into data usable for analysis by the second-layer meta-model.
3.3.2. Model Training
For the first layer of stacking, a bagging strategy was adopted to train multiple models in parallel and combine their predictions, reducing the variance of the final ensemble model. The final fine-tuned SegNet model achieved a mean Intersection over Union (mIoU) of 42.14, a pixel accuracy of 80.13%, and an overall score of 61.44. Table 5 elaborately displays the structure and parameter quantity of the SegNet model.
Table 5.
The structure and parameter quantity of the SegNet model.
To ensure the generalization capability of the model and prevent overfitting, multiple optimization strategies were adopted. We identified a suitable value by decaying the learning rate and periodically adjusting it, helping the model avoid local minima and converge towards global minima. Dropout regularization was employed during training, randomly discarding a portion of neurons to enhance model robustness. Additionally, weight regularization was introduced: L1 regularization adds sparsity to the model by penalizing large weight values, thereby minimizing the influence of unnecessary features. L2 regularization smoothens the model, aiding in preventing overfitting. Early stopping was employed when the validation set performance no longer improved or began to decline, ensuring the model was not overtrained. The final training parameters of the SegNet model are presented in Table 6. SVM, a model that consistently performs well in various scenarios, adopted a radial basis kernel function (kernel = ‘rbf’) in the first layer of stacking and set a penalty parameter C = 1 to control model complexity. Furthermore, based on experience and preliminary observation of the data, the kernel width parameter was chosen as the default. Default parameters were used for training the K-Means and human–machine adversarial models. Table 6 shows the training parameters of the SegNet model.
Table 6.
The final training parameters of the SegNet model.
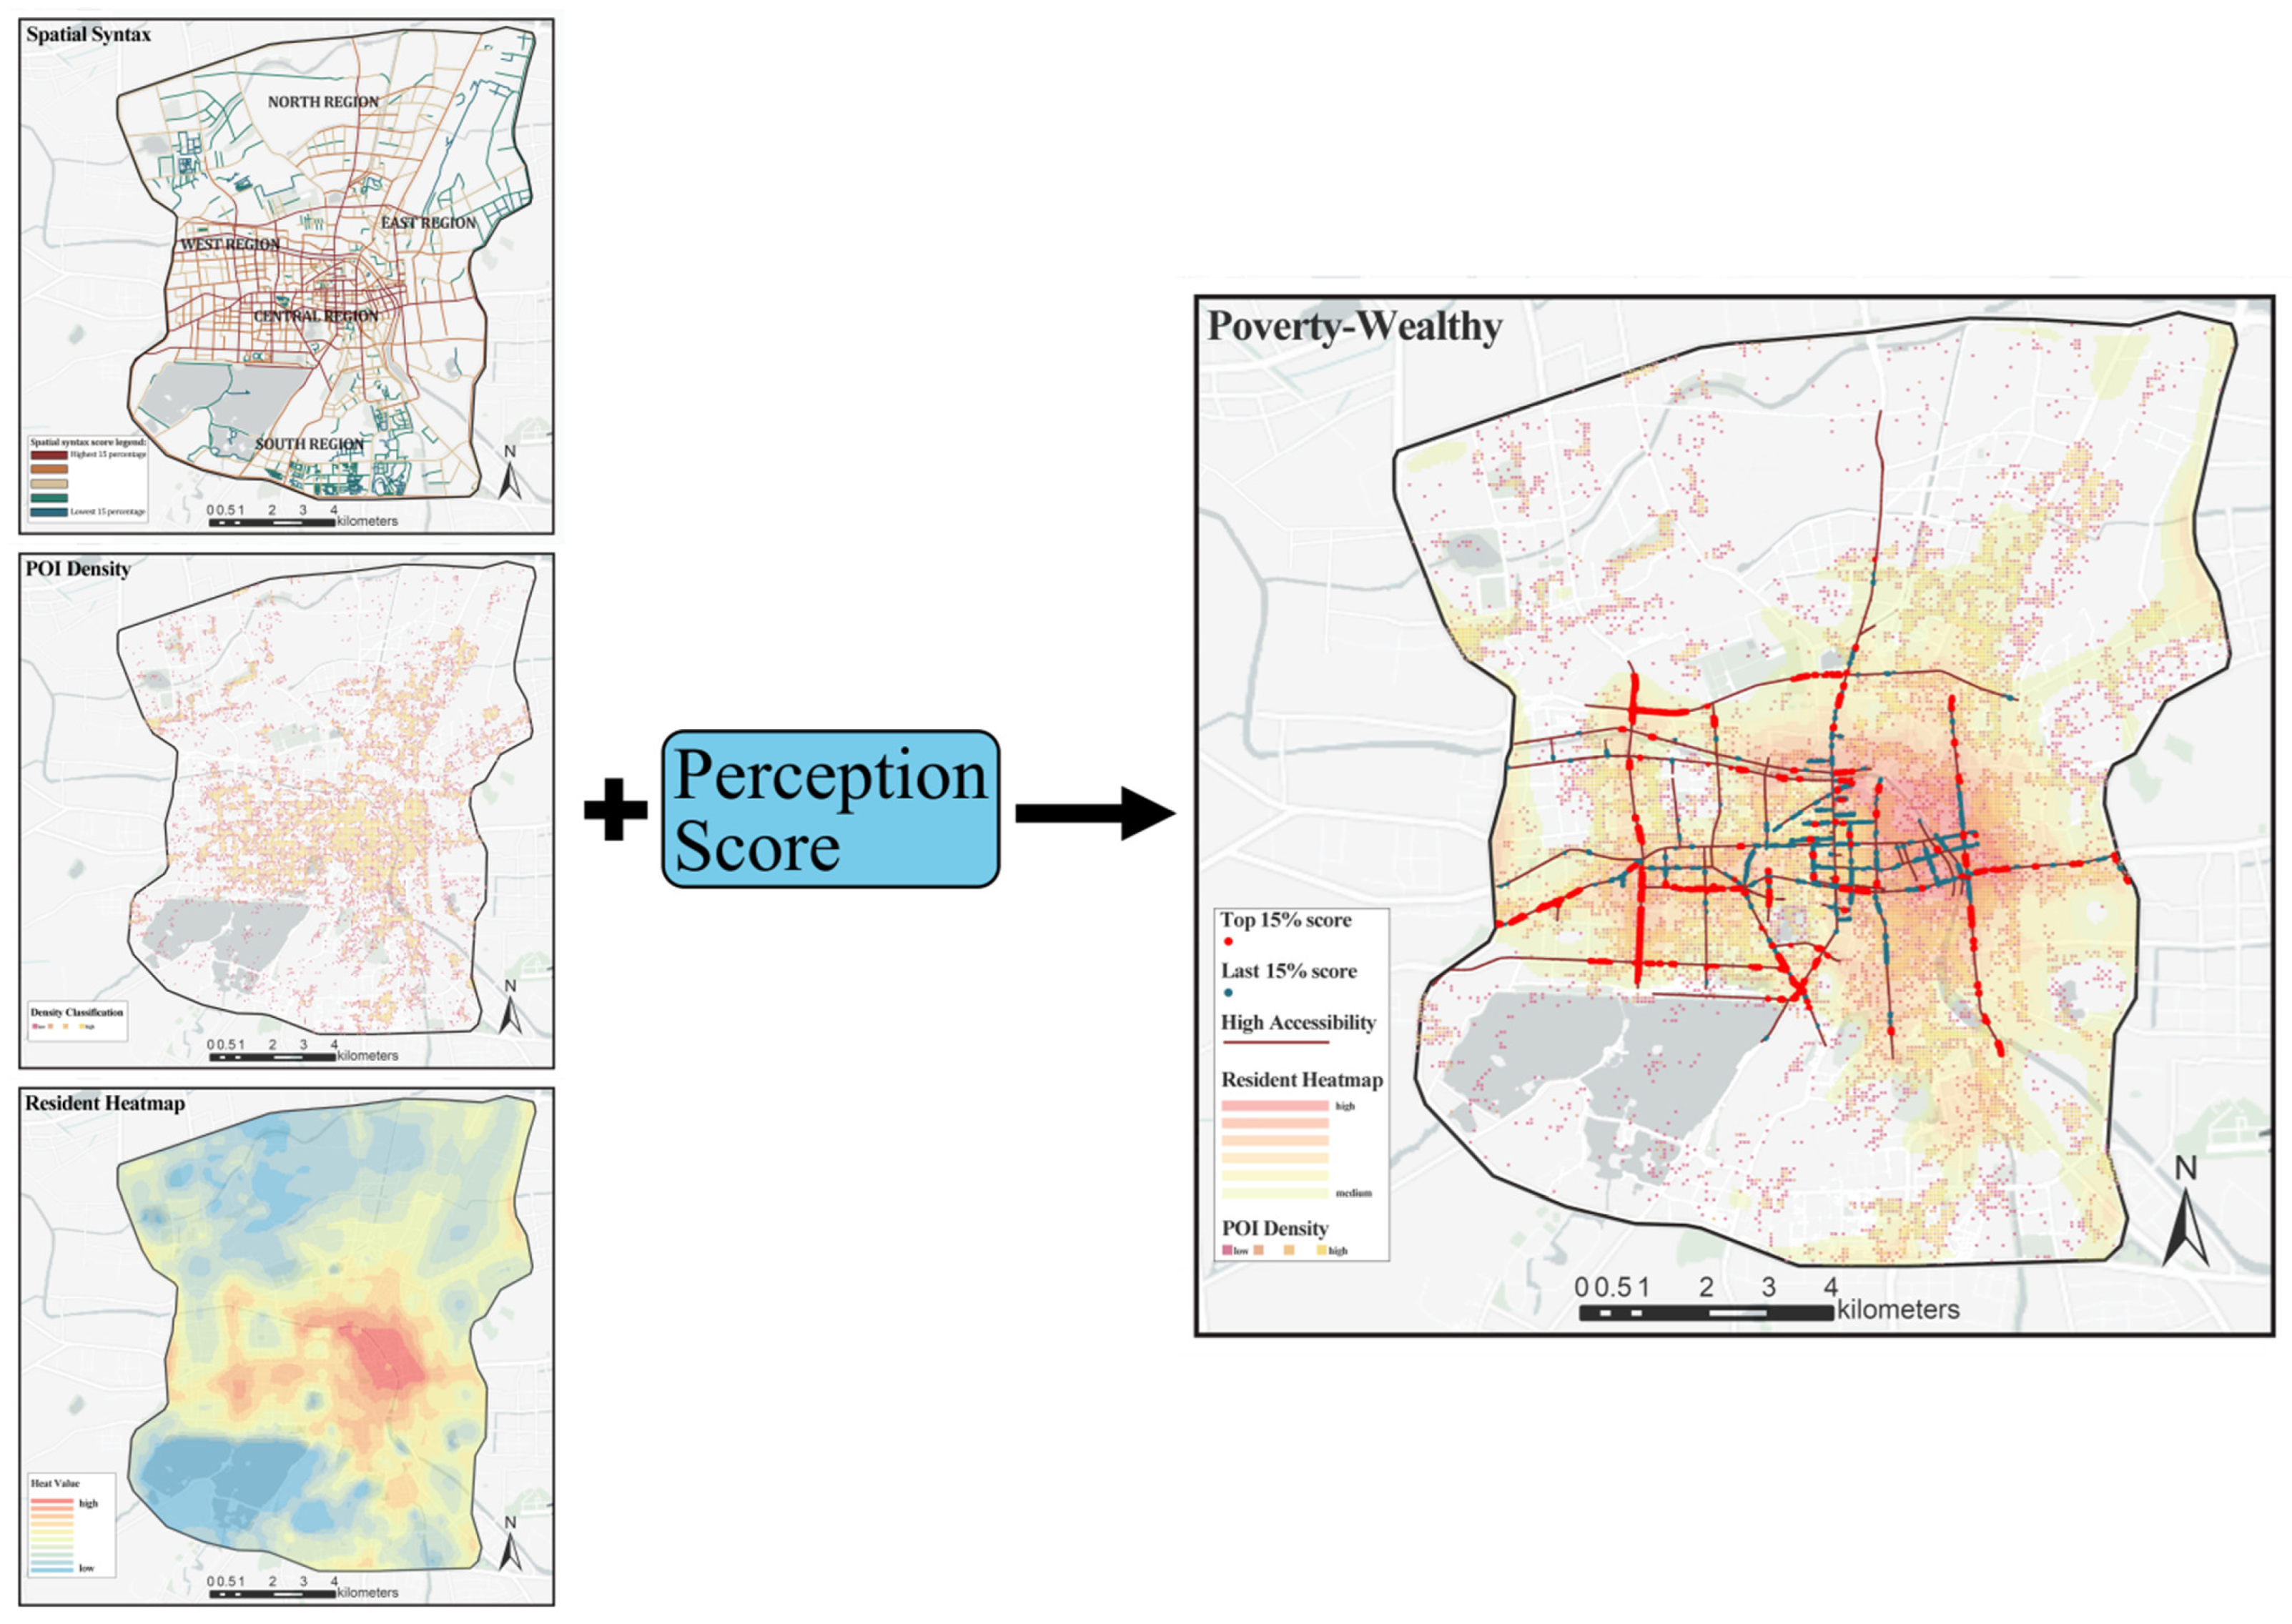
The second-layer model also adopted a bagging strategy for training. To comprehensively consider the frequency at which streets are perceived, spatial syntax analysis of street accessibility was conducted, population distribution heat maps were drafted using mobile signaling data, and the distribution of POIs around each street was analyzed. The perception frequency of streets was categorized into high frequency, medium frequency, and low frequency. High-frequency perception streets meet the criteria of being in the top 20% for accessibility, top 50% for population heat intensity, and having points of interest (POI) distribution around the collection points. On the other hand, low-frequency perception streets fall into the bottom 20% for accessibility, bottom 50% for population density, and lack POI distribution around the collection points. All other streets are categorized as medium-frequency perception streets. Based on the scores of color perception in street environments, a further subdivision was conducted using the top 15% and bottom 15% as thresholds to identify streets that serve as commendable references in color perception for urban renewal, and those that necessitate priority in color transformation (Figure 6). Ultimately, recommendations for color transformation were provided through an overall analysis of urban color.
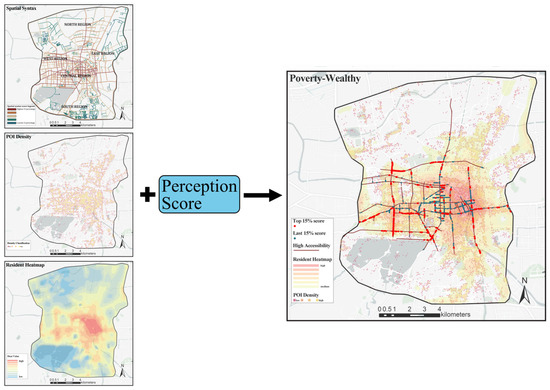
Figure 6.
The categorization of streets based on color perception scores and perception frequency.
4. Results and Discussion
4.1. Color and Visual Elements Correlation Analysis
In the CEP-KASS framework, the SegNet model, commonly used for street scene semantic segmentation, was applied on the MIT ADE20K dataset to semantically segment the concatenated BSVI. This provided visual element data, listing the top 12 visual elements by area percentage in BSVI, as seen in Table 7.
Table 7.
The ten most influential visual components on the perception of street quality.
Colors were extracted using K-Means and then categorized as per Table 1. A Pearson correlation was used to study the relationship between different colors and visual elements, thereby elucidating the relationships between various colors and visual elements within the urban streets of the study area. The results of which are shown in Table 8 with significance annotations. Given the diversity and complexity of colors constituting the visual elements, the findings only indicate a correlation between specific colors and some visual elements, but they aid urban planners and designers in understanding the primary color compositions of visual elements within the street environment. Based on correlation values: below 0.3 is considered almost no correlation, 0.3–0.5 is weak, 0.5–0.7 is moderate, and above 0.7 is strong. The positivity or negativity of the correlation is indicated by the positive or negative value, with different levels of significance marked by * in the table. The study unveils, at various levels of confidence, the correlation within the street environment of the inner ring in Xuzhou. We note that Gray_S1_V2 strongly correlates with walls and pavements, Black_S3_V1 moderately correlates with roads, pavements, and grounds, and Green_S2_V2 has a strong correlation with trees and plants.
Table 8.
Pearson’s correlation between different colors and visual elements.
4.2. Color and Perception Score Correlation Analysis
CEP-KASS correlated color data with scores from five perception dimensions using Pearson correlation, visualizing results in a table. Red indicates positive correlation, blue indicates negative, with color intensity representing correlation strength. After marking significance, the results are presented in Table 9. Planners and designers can refer to Table 8 for guidance on how to control specific colors and their associated attributes in the color renewal and planning of urban street environments. By modulating these color attributes, it is possible to regulate perceptions related to residents’ emotions, thereby ameliorating the emotional variations residents experience during their daily commutes due to the influence of urban colors.
Table 9.
Pearson’s correlation of color data with perceptual dimensions.
The table reveals relationships between the street color environment in the inner circle of Xuzhou and the five perception scores:
In terms of specific color selection:
- (1)
- Black_s3_v1 strongly and positively correlates with the beautiful score and safe score but negatively correlates with the wealthy score, all significant at p < 0.005. In Table 7, roads, pavements, and grounds are primarily associated with Black_s3_v1.
- (2)
- Red_s1_v3, orange_s2_v2, and blue_s1_v2 all strongly and positively correlate with the interesting score, whereas green_s1_v1 negatively correlates. This suggests that vibrant colors with medium-to-low saturation can capture attention, having a strong correlation with the interesting score. Existing studies have also demonstrated that colors with higher saturation may have a negative impact on emotions.
- (3)
- As for green, Green_s1_v1 and green_s1_v2 show a strong positive correlation with the lively score in visual perception, with green_s1_v1 also positively correlating with the wealthy score. In Table 7, trees, grass, and plants are mainly associated with these green shades. These conclusions corroborate with previous studies. But the strong negative correlation between green_s1_v1 and the interesting score suggests that, for the color green, excessively low saturation and brightness levels may diminish its appeal to the residents.
Within the specific attributes of color, the study also discovered that vivid colors with medium-low saturation and brightness negatively correlate with the beautiful score.
4.3. Division of Streets Based on Perception Scores and Perception Frequency
The study of urban street environment color perception can provide urban planners and designers with design and planning support from the perspective of resident perception, identifying streets worth referencing in urban renewal and color transformation, and those that need to be prioritized for remodeling. To achieve this goal, it is necessary to categorize the streets, assuming what the color perception score of each street and the perception frequency is. Through the perception scores, the top 15% of streets are defined as threshold, and the bottom 15% of streets are defined as threshold, based on multiple data to determine the perception frequency of different streets. According to Equation (7), streets are divided into five types: ① High Score High Frequency Perception (HSHF); ② High Score Low Frequency Perception (HSLF); ③ Low Score High Frequency Perception (LSHF); ④ Low Score Low Frequency Perception (LSLF); ⑤ Others.
HSHF (High Score High Frequency Perception) streets can serve as good references and models for the color environment of urban streets, requiring no re-planning in subsequent urban color transformations. We suggest designating these streets as urban color nodes and reference samples for the color transformation of other streets.
For HSLF (High Score Low Frequency Perception) streets, urban planners can compare them with HSHF streets to explore the differences in color environment between these two types of streets. However, due to the significant difference in perception frequency, certain factors such as high accessibility and points of interest (POIs) that can attract pedestrian traffic should be considered. If necessary, color adjustments can be made to enhance their appeal and guide pedestrians towards these streets. Any color transformation in this regard should primarily aim to increase street appeal and the frequency of pedestrian perception.
LSHF (Low Score High Frequency Perception) streets are frequently perceived during daily commutes, but the color perception score experience by pedestrians is subpar, thus having a high priority in color transformation and regulation. Optimizing the color environment of these streets can better exploit their functionality. Improvements can be made by referencing the characteristics of high-score streets.
LSLF (Low Score Low Frequency Perception) streets score low in color perception and also have a lower perception frequency, possibly due to their remote location or weaker functionality, which results in fewer visits by residents and pedestrians. When considering color transformation and regulation, these streets should be given lower priority.
Streets categorized as ‘Others’ have moderate scores and perception frequency in terms of color perception. Planners and designers should conduct detailed onsite inspections and analyses to determine the necessity of transformation and should reference the characteristics and experiences of HSHF streets in their decision-making process.
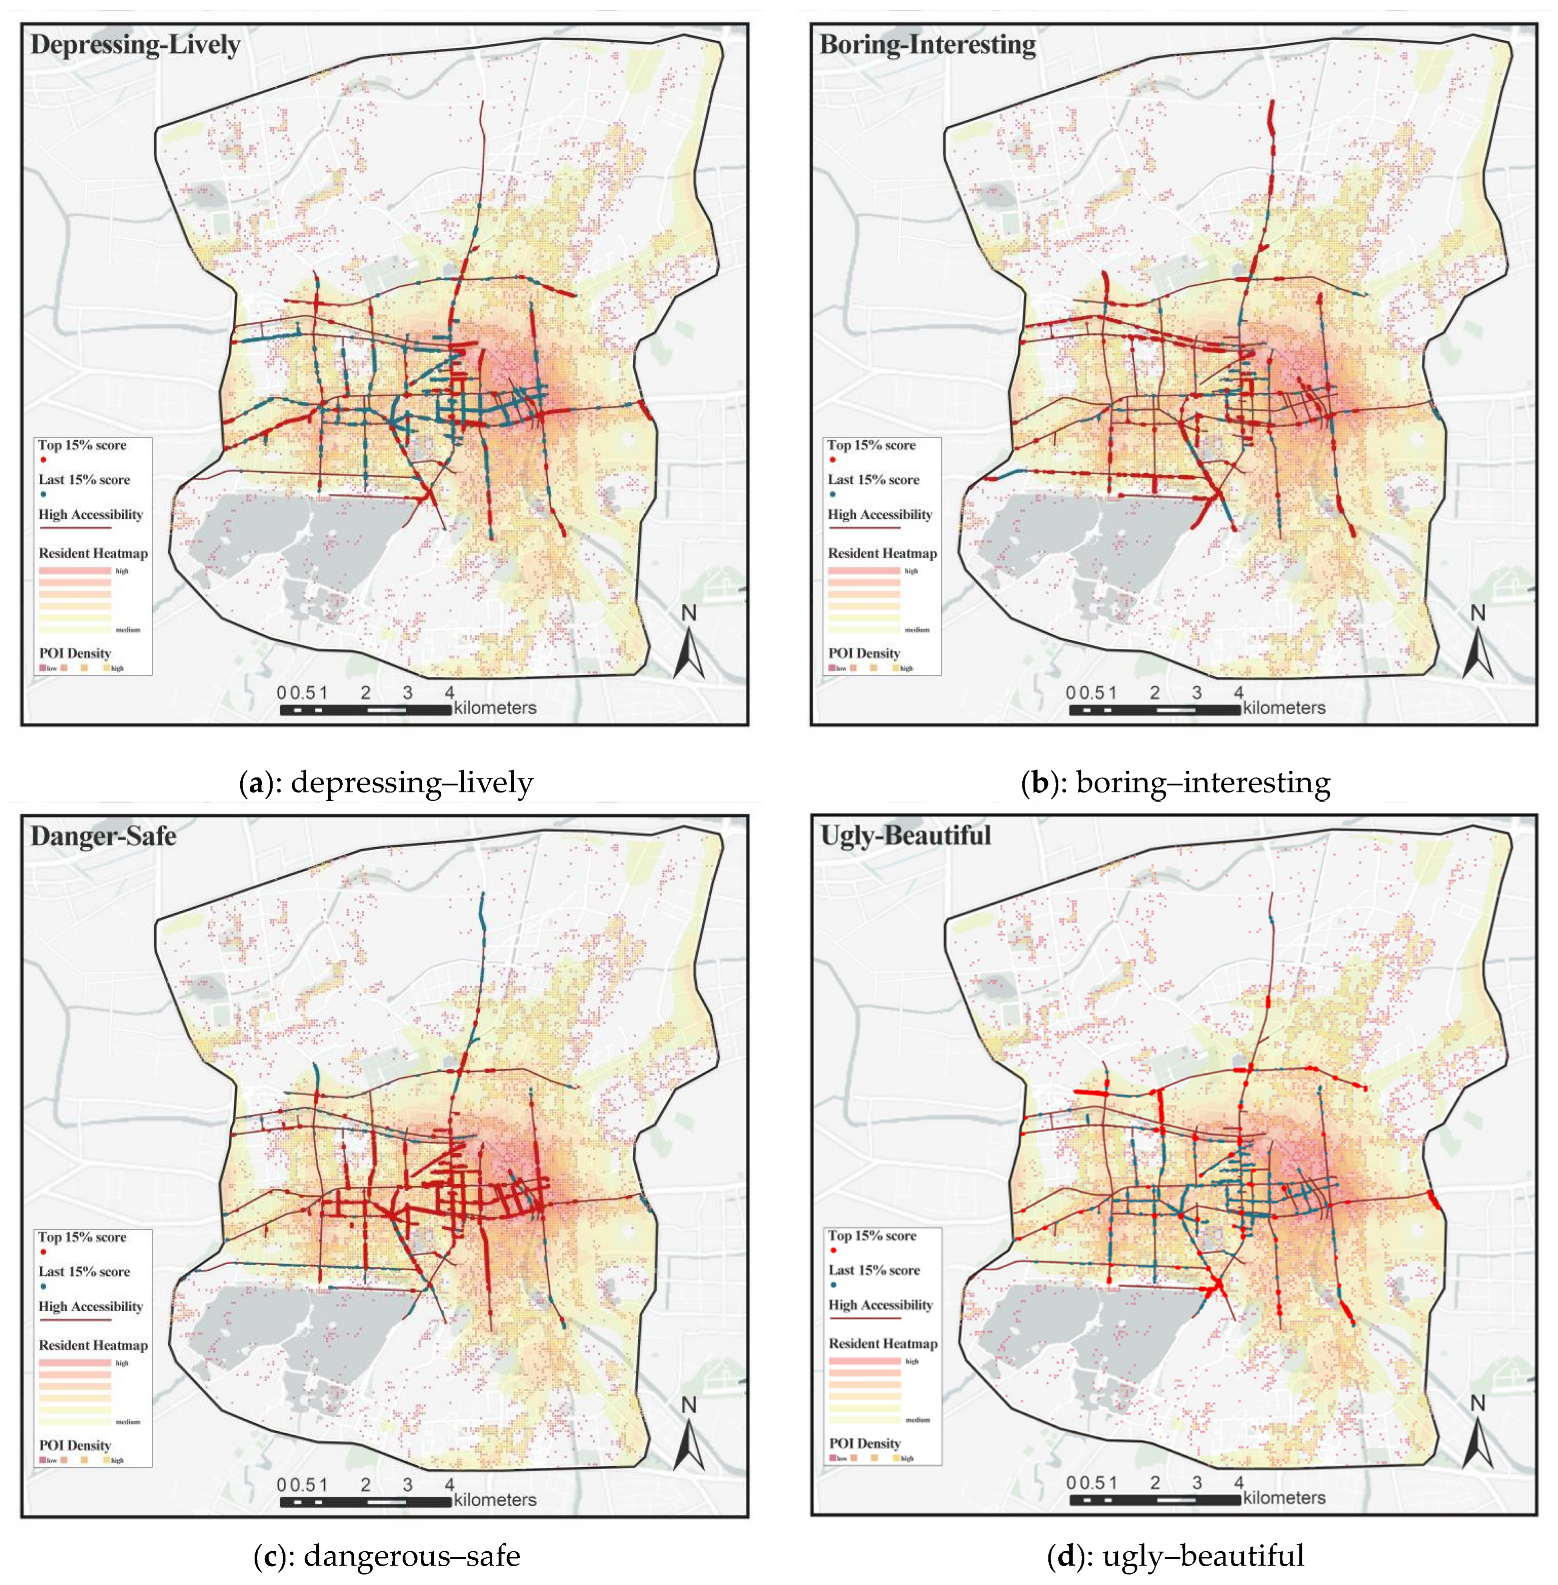
Figure 6 displays the division of HSHF (High Score High Frequency Perception) and LSHF (Low Score High Frequency Perception) streets under the poverty–wealthy dimension. Following this logic and visualizing the color perception and perception frequency for the remaining four dimensions, we obtained Figure 7. The study discovered that within the inner ring of Xuzhou, streets with high perception frequency and high accessibility tend to score higher in the danger–safe dimension of color environment perception. Previous research also confirms that street accessibility often plays a critical role in creating places and enhancing the quality of life, providing a set of urban street space quality measurement standards based on accessibility (Ye et al., 2019).
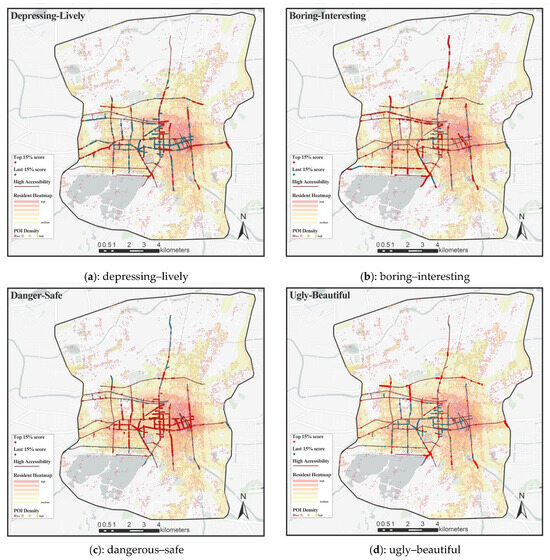
Figure 7.
HSHF and LSHF streets under different perceptual dimensions 4.4 street color environment perception division.
Additionally, streets scoring higher in color environment perception across the five dimensions often have urban nodes nearby. This conclusion is more evident in the overlay analysis of color environment perception and perception frequency in the ugly–beautiful dimension, corroborating that the aesthetic quality of street spaces around urban nodes is higher. Overlaying the depressing–lively score, boring–interesting score, and poverty–wealthy score dimensions with high-frequency perception streets revealed a continuous distribution of high-score points. Among these, the boring–interesting score dimension demonstrates a clustered distribution along the riverside areas. It is advisable for urban planners to prioritize referencing the color environment of these streets when shaping the city’s image and planning for color transformations.
Low perception scores in street environments overlap considerably in the ugly–beautiful score and depressing–lively score dimensions, with most overlaps occurring in the city center and western city regions. These areas largely comprise older urban districts with narrow streets, necessitating color transformations and adjustments to enhance the commuting experience for residents.
4.4. Street Color Environment Analysis
4.4.1. Analysis of H, S, V Relationships
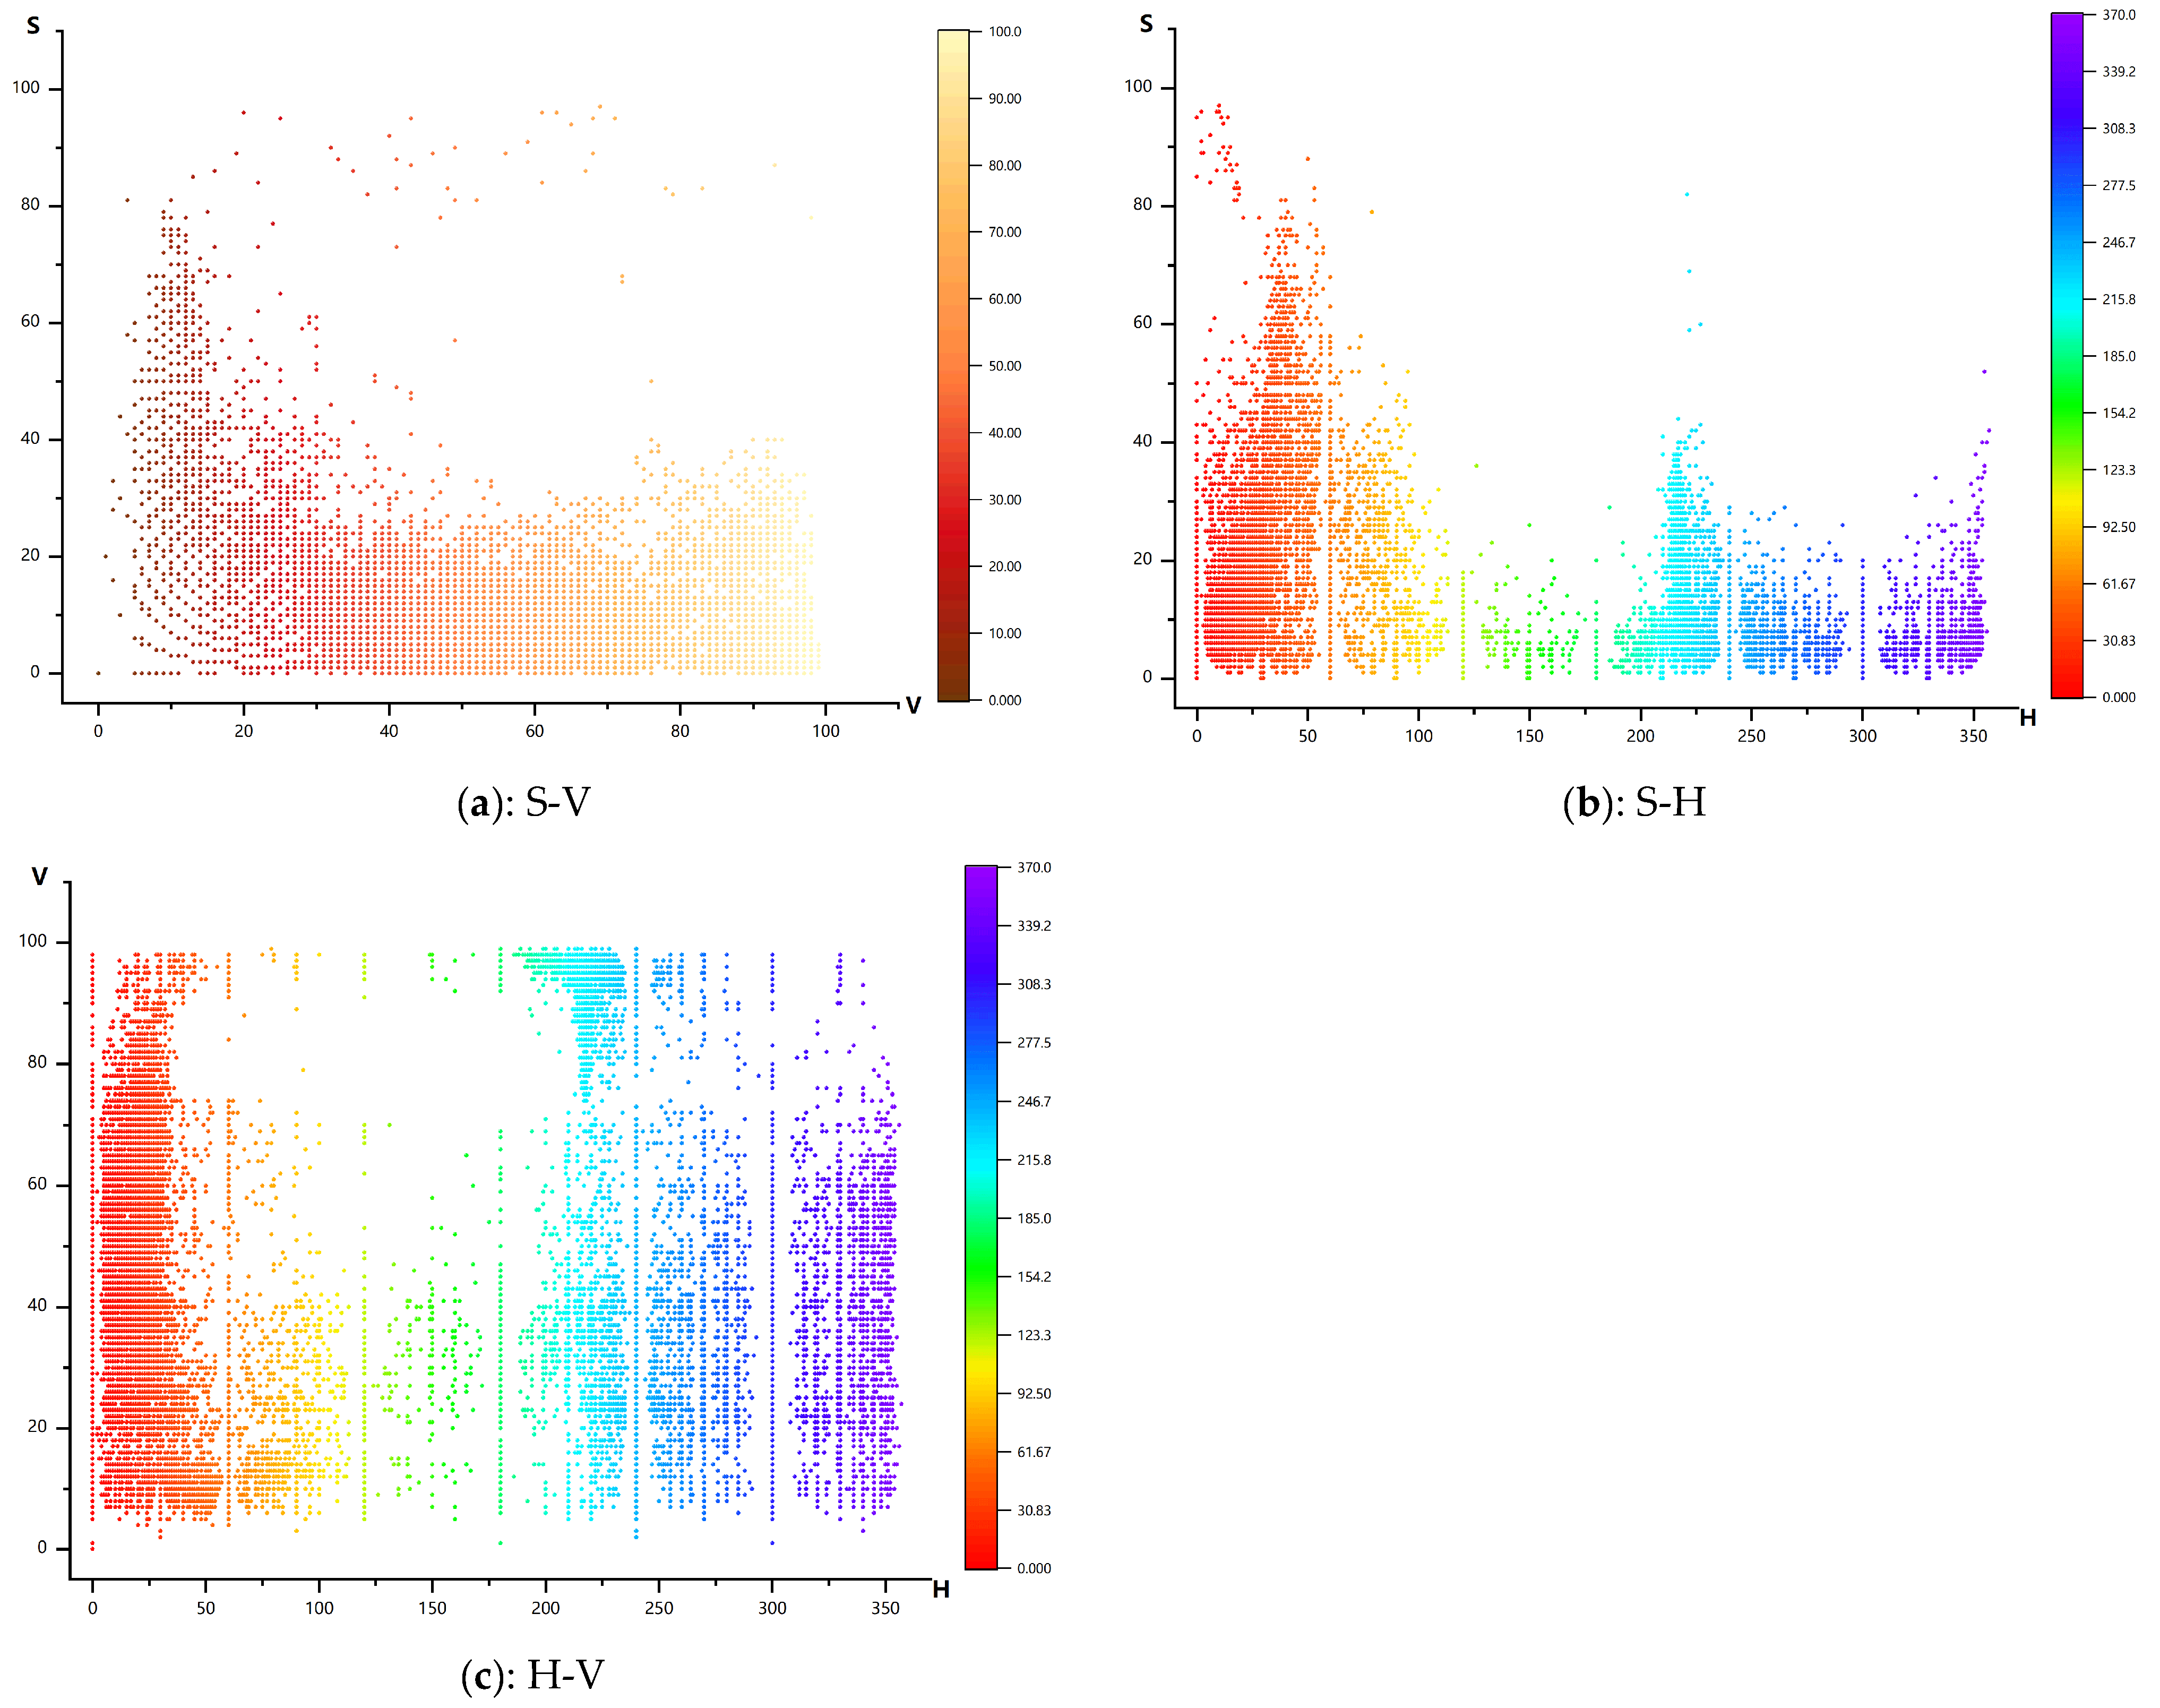
Scatter plots illustrating the relationships among H, S, V (hue, saturation, value) were constructed for the colors of the streets in the study area prior to converting them to the H, S, V range in OpenCV, resulting in Figure 8. In the V-H plot, there is an absence of data in the high-value range for the yellow-green-cyan colors. Cross-referencing with Table 7 reveals that the primary visual elements providing such colors in the city are vegetation, which finds it challenging to achieve high values in color representation. In the S-V plot, high saturation colors predominantly occupy the low-value range, and in the S-H plot, they are primarily situated in the red range. This demonstrates that the high saturation colors in street scenes are chiefly composed of reds with high saturation and low value.
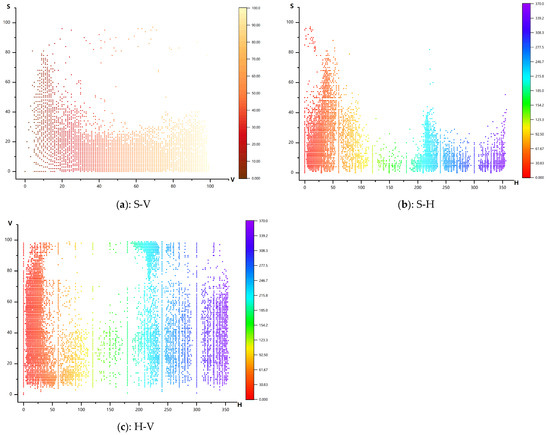
Figure 8.
Scatter plot of H, S, V relationships.
As saturation diminishes, the primary composition of medium saturation colors transitions to orange, where, as analyzed in Table 8, medium-saturation and medium-value orange holds the strongest positive correlation with the boring–interesting score. The colors manifesting as deep red, brownish-red, brown, and even brownish deep wooden hues in the street scenes of the study area are mainly derived from red soil, tree trunks, traditional Chinese wooden structures, and buildings adorned with traditional wooden color themes. The “Historical Records” document that the soil in Xuzhou is red, sticky, and fertile, and current geological studies corroborate the presence of a substantial amount of red soil in Xuzhou. This suggests that the deep wooden hues of traditional architecture and the local red soil colors continue to pique visual interest. Nonetheless, the medium-saturation and medium-value orange, while augmenting the perception on the interesting score dimension, causes a decrement in perception scores on the lively score and beautiful score dimensions. This might be attributed to the fact that modern constructions employing these colors do not utilize mud and wood materials, but rather opt for stone veneer or concrete plaster exterior walls. The extensive color facades adversely affect the lively score and beautiful score dimensions.
As saturation further recedes, medium-saturation colors now also encompass cyan, blue, and purple. These three colors, predominantly reflected in the glass and curtain walls of modern edifices in street scenes, do not exhibit any correlation with any perceptual dimensions in the correlation analysis. During the color renovation of urban street environments, planners can ascertain the relationship between colors and varying perceptual dimensions through the analyses in Table 8 and Figure 8, based on the perceptual dimensions necessitating optimization, thereby ameliorating color perception experience through color modulation.
4.4.2. Analysis of Street Color Attributes
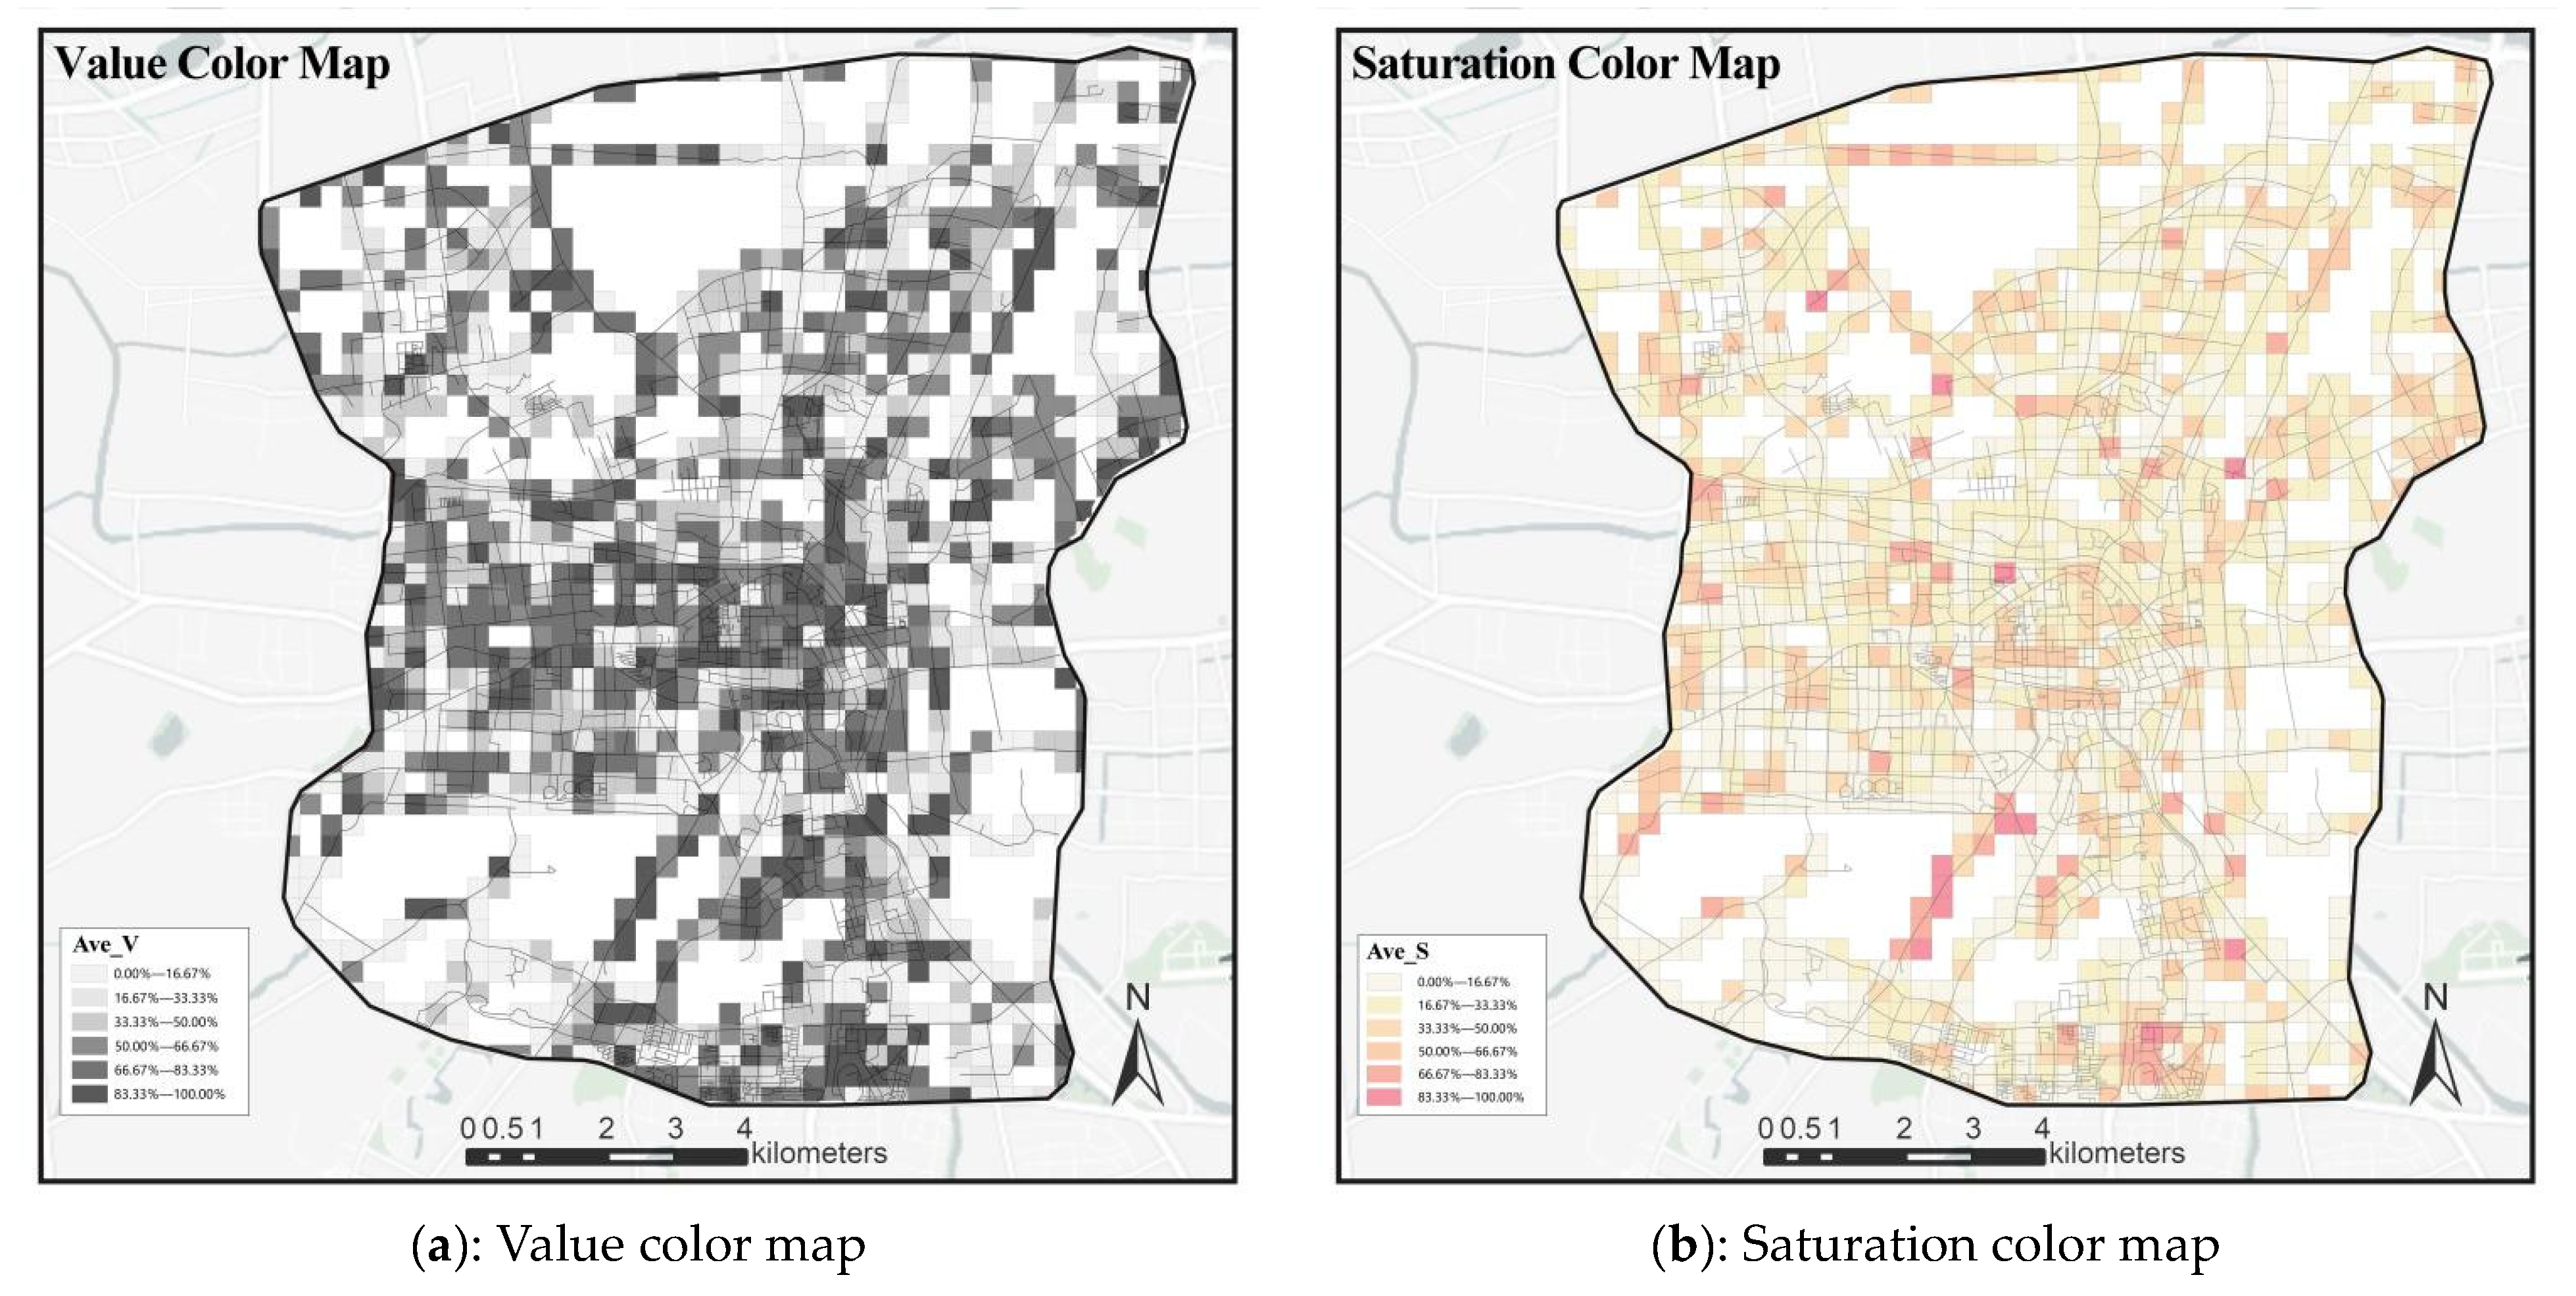
The research area was divided into grids of 300 m × 300 m, and then the color with the highest frequency of occurrence in each grid was calculated to fill the grid. After extracting the corresponding brightness and saturation of the color, it was visualized on the map as shown in Figure 9. From the distribution of brightness, it can be seen that the brightness is lower in the city center, the western urban area, and near the main roads, which is related to the large proportion of asphalt roads in the visual field in these places. In the saturation distribution map, there are exposed red soils along the east coast of Yunlong Lake and at Jiuli Mountain, whereas other places with high saturation have buildings with deep woody colors, such as the Qianlong Palace, being an ancient building, and the Wenchang Campus of China’s University of Mining and Technology, being a modern building with a large area decorated in these colors.
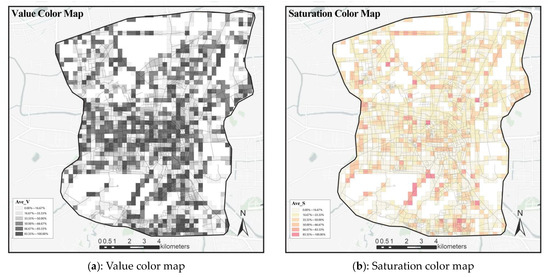
Figure 9.
The grid of 300 m × 300 m showing value and saturation maps.
Figure 10 shows a hotspot analysis of the distribution of brightness and saturation in urban spaces to intuitively display the areas of extreme value aggregation of saturation and brightness within the research area. Based on this, the relationship between the areas of extreme value aggregation of brightness, saturation, and emotional perception in the city is explored.
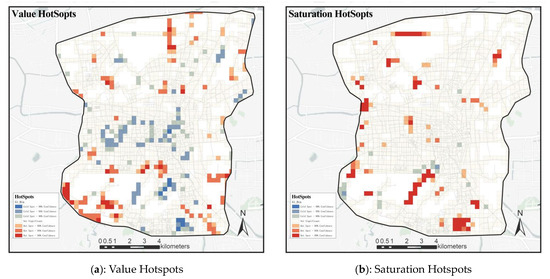
Figure 10.
Value and saturation Hotspots analysis.
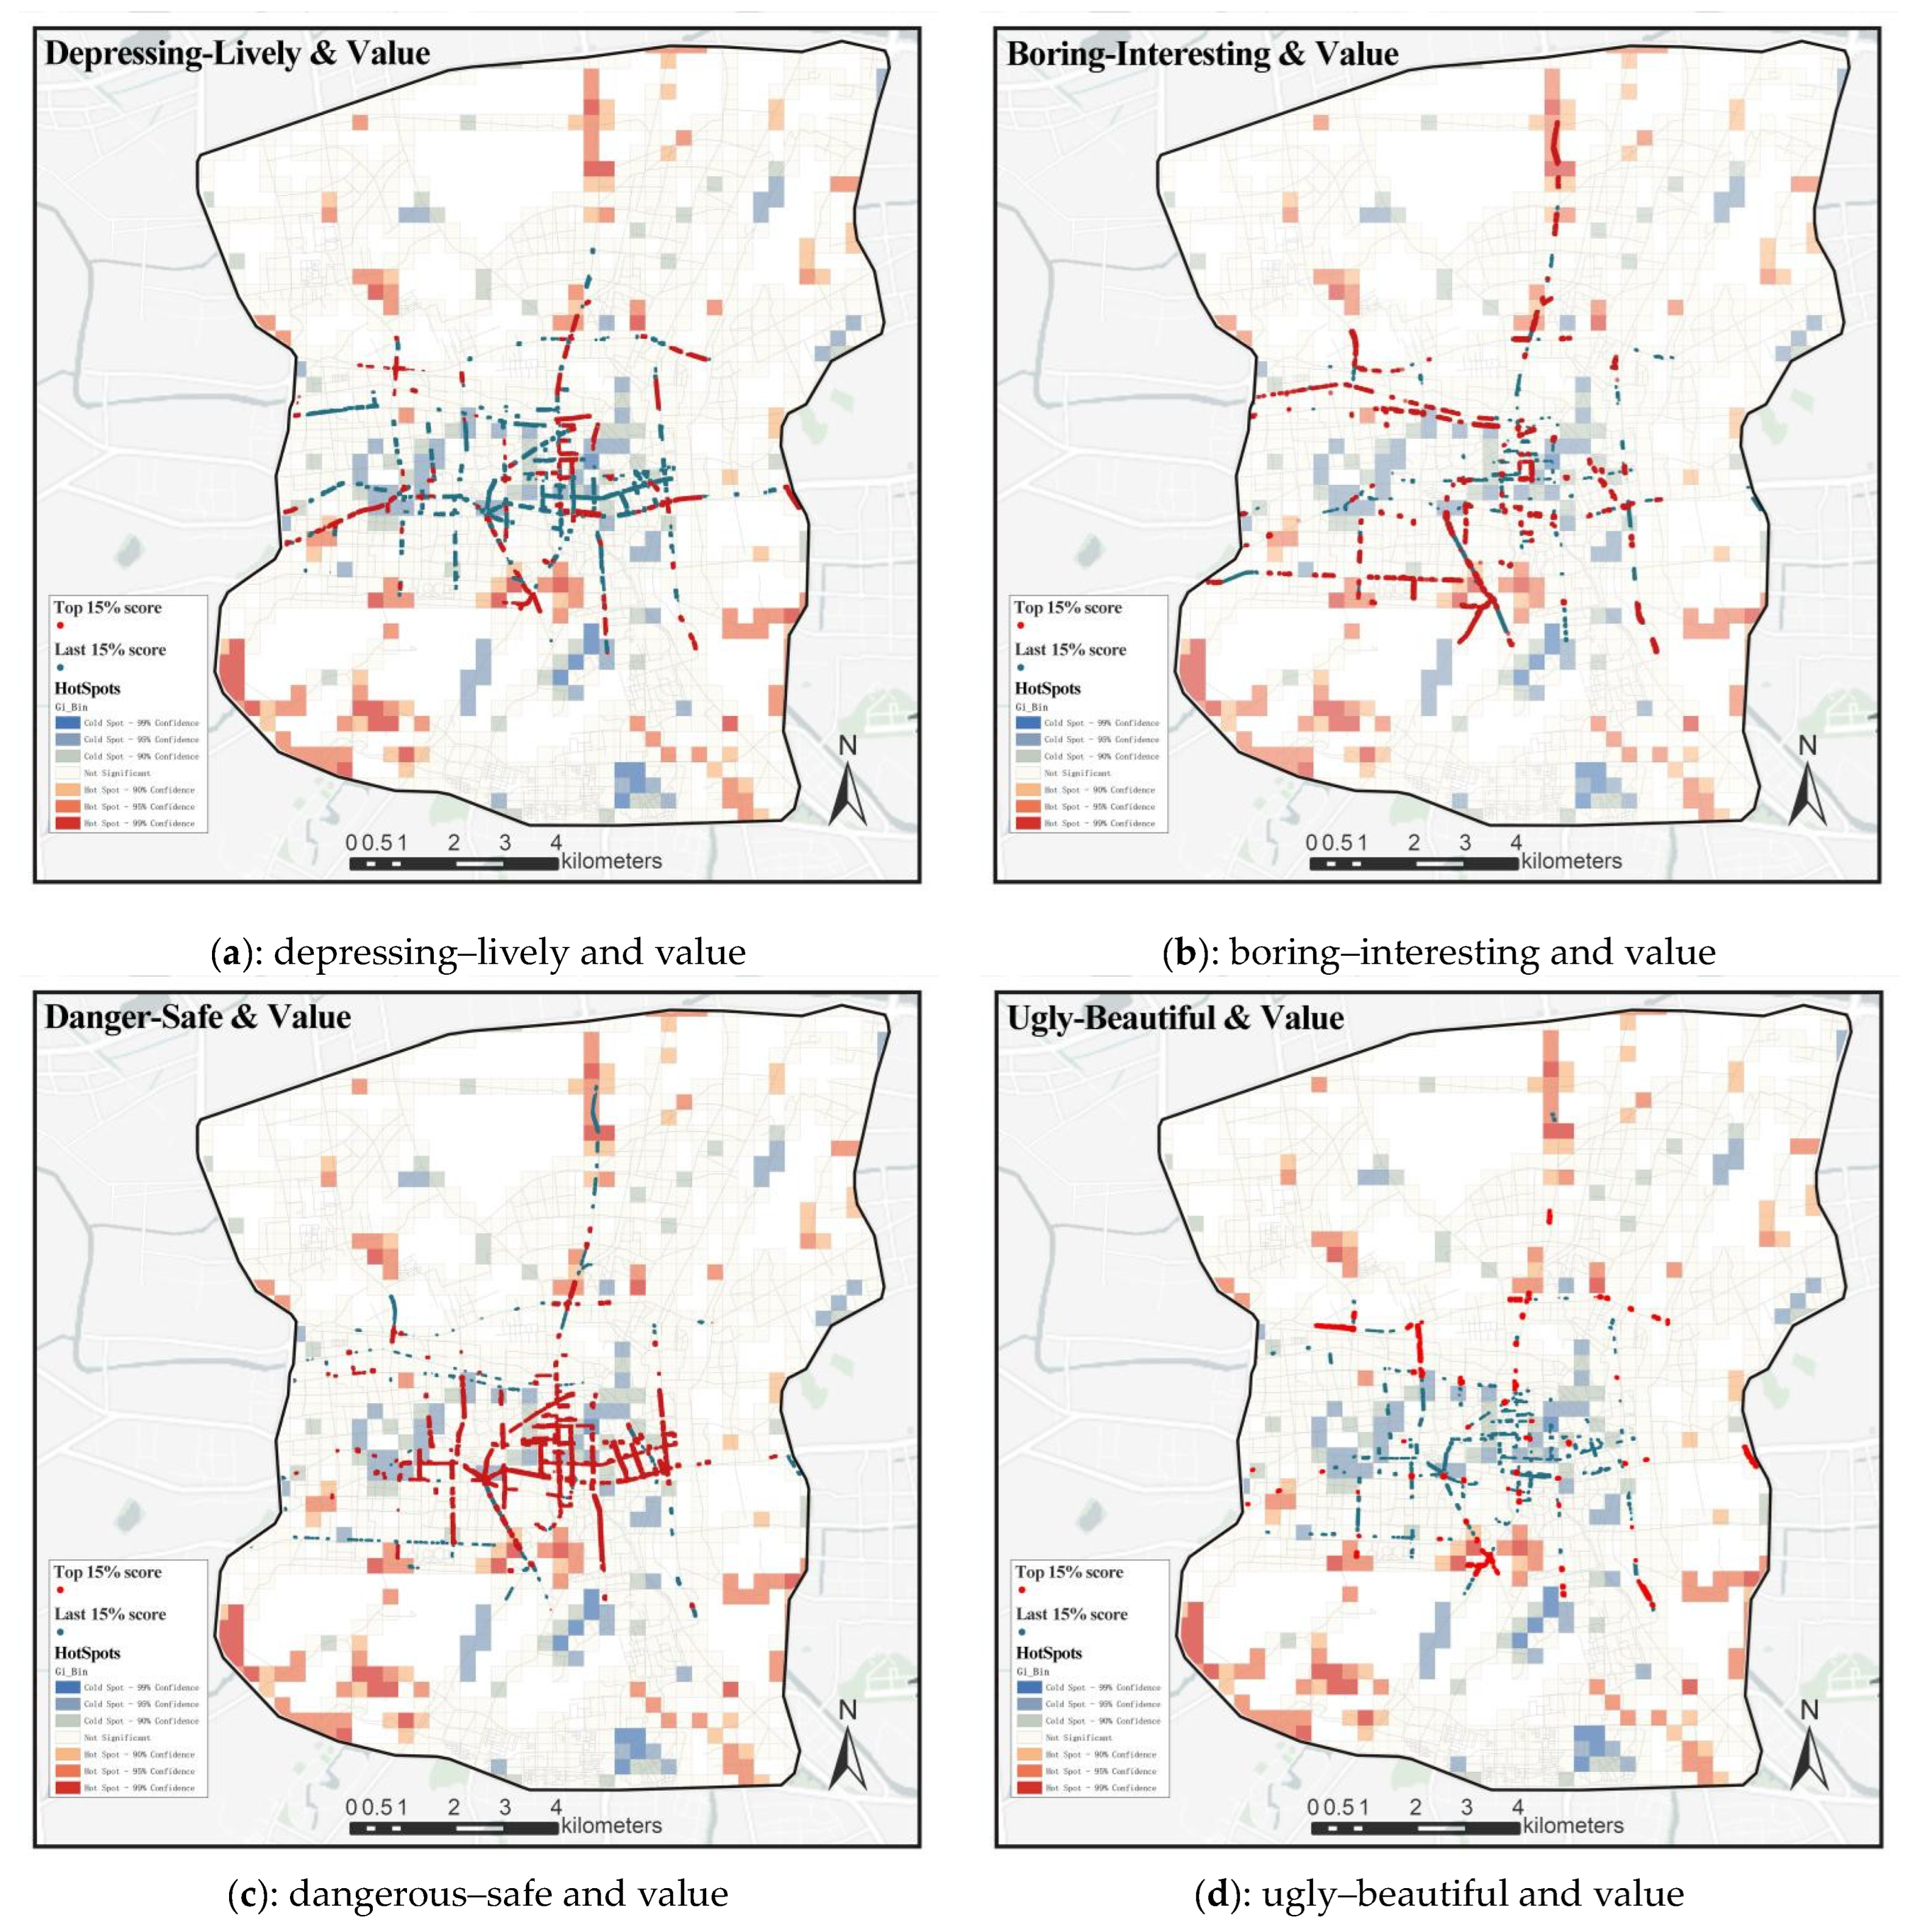
For the areas of interest, in conjunction with perceptual scores, Table 8 can be used to quickly determine the kind of color regulation required within each grid area. Furthermore, by considering the frequency of perception, the priority levels for color transformation and regulation can be established, and specific regulation schemes can be determined based on the correlation between color and perception. Figure 11 exemplifies this with an analysis of hot and cold spots in terms of brightness, where streets with the highest 15% and lowest 15% perceptual scores have significant overlap with the extreme value clusters, with the exception of the poverty–wealthy dimension. Specifically, points with a higher interesting score align to some extent with areas of higher brightness, suggesting that a continuous distribution of high-brightness colors can engage the interest of residents; points with a lower beautiful score and lively score overlap with areas of lower value, indicating that regulating value can improve color perception in these dimensions; points with a higher safe score overlap with areas of lower value, whereas points with lower scores overlap with areas of higher value, proving an inverse relationship between value and the perception of safety. Hence, by inversely regulating value, the perceptual experience in the safety dimension of some specific urban external spaces can be improved.
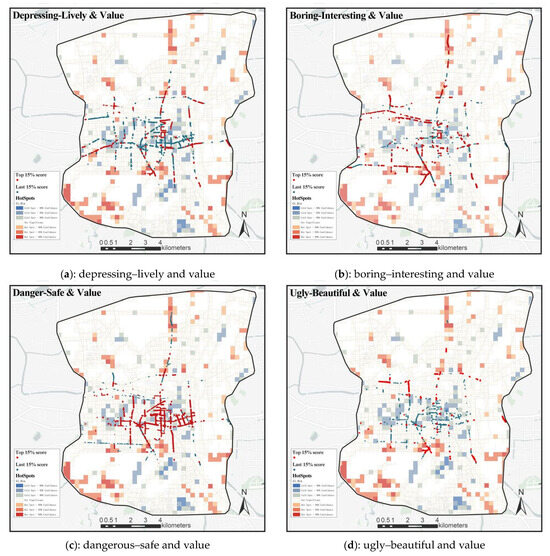
Figure 11.
Anomaly clustering and perception score superposition analysis.
4.5. Limitations and Future Research
Although this study explores color perception in urban street environments, there are some shortcomings that warrant further discussion in future work. Firstly, this study selected a single research area and employed the proposed CEP-KASS framework to investigate color perception in urban street environments. In reality, as long as there is a sufficient amount of street-view image data and the city reaches a certain scale, this framework can be applied to different cities, and by comparing multiple cities of the same level, more universal color rules can be elucidated. Additionally, this study did not provide multi-level explanations for the formation of the perceptual results of street environment colors. Future research could consider incorporating eye-tracking and visual attention simulation experiments, capturing participants’ eye movement paths precisely when observing urban scenes, and predicting and simulating people’s attention distribution while viewing urban scenes. This would reveal which spaces within the urban scene are noticed first when color environments impact perception, aiding researchers in the fields of urban science and anthropology to more intuitively understand the formation of perceptual outcomes caused by which visual elements and corresponding colors. Moving forward, we will consider more factors, increase the sample of cities, and combine some intuitive experiments to discuss urban street color planning.
5. Conclusions
The color environment of urban streets plays a significant role in optimizing residents’ daily travel perception experience. We should rationally plan the urban street color environment to enhance residents’ travel color perception experience and build a city color environment centered on human perception.
Previous research rarely studied street environment color from the perspective of urban color environment perception. To fill this research gap, we proposed a methodological framework named CEP-KASS and validated it using an area within the third ring of Xuzhou as the study subject. First, visual elements and color data of streets were extracted from BSVI. The model we used for segmentation was a fine-tuned SegNet model, achieving 42.14 in mIoU, 80.13% in pixel accuracy, and 61.44 in overall score.
Then, after obtaining the color environment perception score data through the adversarial model, we used the support vector machine to predict the perception scores of all streets. Its MSE and R square reached 0.2188 and 0.8327, respectively, showing good predictive results. Finally, by integrating road accessibility, population heatmaps, and POI distribution, we determined the perception frequency of streets. Combining this with color environment perception scores, we categorized streets into five types: HSHF, HSLF, LSHF, LSLF, and Others. Urban planners are advised to prioritize referencing HSHF streets and renovating LSHF streets when shaping the city’s image and planning its colors.
Furthermore, the study classified the street color environment extracted from BSVI and studied the relationship between color and visual elements as well as color and its related attributes with perception scores through Pearson correlation analysis and applied the conclusions to street environment color analysis. For instance, medium saturation and luminance of the color orange, while enhancing the perception score in the interesting score dimension also affected perception scores in the lively score and beautiful score dimensions. Therefore, color regulation can be employed to optimize residents’ emotions. After analyzing the perception scores of streets, combined with the classification rules of streets, it is feasible to determine whether color regulation is needed, and relevant color control suggestions can be provided based on the correlation study of color with visual elements and perception scores.
In summary, we selected the often-overlooked color aspect in urban design, applied the CEP-KASS framework to conduct research on color with visual elements, and perception scores, providing theoretical support for urban color planning from a resident-centric perspective on color perception. The five classification criteria for streets offer a reference for prioritizing color renovation, and the hot and cold spot analysis of street color elements helps ascertain how luminance and saturation affect residents’ perceptions. This contributes to the practical application of color perception conclusions and provides scientific color renovation suggestions based on the actual situations of streets, optimizing urban residents’ spatial perception and emotional experience within a city.
Author Contributions
Conceptualization, K.H., Z.X. and Y.Z.; Data curation, K.H., Z.X. and Y.W.; Formal analysis, K.H. and Z.X.; Funding acquisition, Y.Z.; Investigation, X.W., Y.W. and H.L.; Methodology, K.H. and Y.Z.; Project administration, Y.Z.; Resources, Y.Z.; Supervision, Y.Z.; Validation, K.H., Z.X. and Y.Z.; Visualization, K.H., Z.X., X.W. and Y.W.; Writing-original draft, K.H., Z.X. and H.L.; Writing-review and editing, K.H. and Z.X. All authors have read and agreed to the published version of the manuscript.
Funding
This research was Funded by “The Graduate Innovation Program of China University of Mining and Technology (Grant No. 2023WLJCRCZL312 & Grant No. 2023WLJCRCZL314 & Grant No.2023WLJCRCZL318)” and “Funded by the Postgraduate Research & Practice Innovation Program of Jiangsu Province (Grant No. SJCX23_1267 & Grant No. SJCX23_1269 & Grant No. SJCX23_1258)”.
Data Availability Statement
Data are not available.
Acknowledgments
We would like to thank the reviewers for providing constructive comments on this manuscript.
Conflicts of Interest
The authors declare that they have no known competing financial interest or personal relationships that could have appeared to influence the work reported in this paper.
References
- Abusaada, H.; Elshater, A. Effect of people on placemaking and affective atmospheres in city streets. Ain Shams Eng. J. 2021, 12, 3389–3403. [Google Scholar] [CrossRef]
- Liu, W. Research on the Perceptual Quality of UrbanStreet Space Based on Baidu Street Views. Master’s Thesis, Wuhan University, Wuhan, China, 2019. [Google Scholar]
- Bosch, M.V.D.; Sang, A.O. Urban natural environments as nature-based solutions for improved public health—A systematic review of reviews. J. Transp. Health 2017, 158, 373–384. [Google Scholar]
- Brownson, R.C.; Hoehner, C.M.; Day, K.; Forsyth, A.; Sallis, J.F. Measuring the Built Environment for Physical Activity. Am. J. Prev. Med. 2009, 36, S99–S123.e112. [Google Scholar] [CrossRef] [PubMed]
- Carmona, M.; Gabrieli, T.; Hickman, R.; Laopoulou, T.; Livingstone, N. Street appeal: The value of street improvements. Prog. Plan. 2018, 126, 1–51. [Google Scholar] [CrossRef]
- Tang, J.; Long, Y. Measuring visual quality of street space and its temporal variation: Methodology and its application in the Hutong area in Beijing. Landsc. Urban Plan. 2019, 191, 103436. [Google Scholar] [CrossRef]
- Yin, L. Street level urban design qualities for walkability: Combining 2D and 3D GIS measures. Comput. Environ. Urban Syst. 2017, 64, 288–296. [Google Scholar] [CrossRef]
- Jacobs, J.M. The Death and Life of Great American Cities; Vintage: New York, NY, USA, 1992. [Google Scholar]
- Jacobs, A.B. Great Streets; China Architecture and Architecture Press: Beijing, China, 2009. [Google Scholar]
- Montello, D.R.; Goodchild, M.F.; Gottsegen, J.; Fohl, P. Where’s Downtown?: Behavioral Methods for Determining Referents of Vague Spatial Queries. Spat. Cogn. Comput. 2003, 3, 185–204. [Google Scholar]
- Roth, M. Online visual landscape assessment using internet survey techniques trends in online landscape architecture. Proc. Anhalt Univ. Appl. Sci. 2005, 121–130. [Google Scholar]
- Sallis, J.F.; Johnson, M.F.; Calfas, K.J.; Caparosa, S.; Nichols, J.F. Assessing perceived physical environmental variables that may influence physical activity. Res. Q. Exerc. Sport 1997, 68, 345–351. [Google Scholar] [CrossRef]
- Zhang, Y. The Study of Urban Space SensationBased on the SD Method. Master’s Thesis, Tongji University, Shanghai, China, 2008. [Google Scholar]
- Mcginn, A.P.; Evenson, K.R.; Herring, A.H.; Huston, S.L.; Rodriguez, D.A. Exploring Associations between Physical Activity and Perceived and Objective Measures of the Built Environment. J. Urban Health 2007, 84, 162. [Google Scholar] [CrossRef]
- Long, Y.; Liu, L. How green are the streets? An analysis for central areas of Chinese cities using Tencent Street View. PLoS ONE 2017, 12, e0171110. [Google Scholar] [CrossRef] [PubMed]
- Ye, Y.; Dai, X. Spatial Perception and Design Potentials inthe Context of New Analytical Techniquesand New Data. Time Archit. 2017, 8, 6–13. [Google Scholar]
- Li, S.; Yang, Z.; Liang, X.; Liang, X.; Long, Y. East 4th Historic District: A measure of street space quality based on multi-temporal street view pictures. Beijing Plan. Rev. 2016, 171, 39–48. [Google Scholar]
- Long, Y.; Tang, J. Large-scale Quantitative Measurement of the Quality of Urban Street Space: The Research Progress. City Plan. Rev. 2019, 43, 107–114. [Google Scholar]
- Zhao, Q.; Tang, H.; Wei, D.; Qian, W. Spatial visibility of green areas of urban greenway using the greenappearance percentage. J. Zhejiang A F Univ. 2016, 33, 288–294. [Google Scholar]
- Tang, J.; Long, Y.; Zhai, Y.; Ma, Y. Measuring Quality of Street Space, Its Temporal Variation and Impact Factors: An Analysis Based on Massive Street View Pictures. New Archit. 2016, 6, 110–115. [Google Scholar]
- Liu, X.; Sheng, Q.; Yang, Z. Influence of Pedestrian Accessibility on Street Space Activity and Communication. Shanghai Urban Plan. Rev. 2017, 132, 56–61. [Google Scholar]
- Li, X.; Ratti, C.; Seiferling, I. Mapping Urban Landscapes Along Streets Using Google Street View. Urban Plan. Forum 2017, 236, 125–126. [Google Scholar]
- Qiao, D.; Liu, G.; Lv, T.; Li, W.; Zhang, J. Marine Vision-Based Situational Awareness Using Discriminative Deep Learning: A Survey. J. Mar. Sci. Eng. 2021, 9, 397. [Google Scholar] [CrossRef]
- Alexander, C. The Luminous Ground: The Nature of Order (Book 4); Center for Environmental Structure: Berkeley, CA, USA, 2004. [Google Scholar]
- Ordonez, V.; Berg, T.L. Learning High-Level Judgments of Urban Perception. In Proceedings of the 13th European Conference on Computer Vision (ECCV), Zurich, Switzerland, 6–12 September 2014; pp. 494–510. [Google Scholar]
- Yao, Y.; Wang, J.; Hong, Y.; Qian, C.; Guan, Q.; Liang, X.; Dai, L.; Zhang, J. Discovering the homogeneous geographic domain of human perceptions from street view images. Landsc. Urban Plan. 2021, 212, 104125. [Google Scholar] [CrossRef]
- Zhang, F.; Zhou, B.; Liu, L.; Liu, Y.; Fung, H.H.; Lin, H.; Ratti, C. Measuring human perceptions of a large-scale urban region using machine learning. Landsc. Urban Plan. 2018, 180, 148–160. [Google Scholar] [CrossRef]
- Wang, L.; Han, X.; He, J.; Jung, T.-Y. Measuring residents’ perceptions of city streets to inform better street planning through deep learning and space syntax. ISPRS J. Photogramm. Remote Sens. 2022, 190, 215–230. [Google Scholar] [CrossRef]
- Ye, Y.; Zhong, T.; Zhong, X. Quantitative Measurement of Architectural Color at City Scale—A Humanistic Perspective Analysis Based on Street View Data and Machine Learning. Hous. Sci. 2019, 39, 6. [Google Scholar]
- Harvey, C.; Aultman-Hall, L. Measuring Urban Streetscapes for Livability: A Review of Approaches. Prof. Geogr. 2016, 68, 149–158. [Google Scholar] [CrossRef]
- Xu, W.; Jiang, W.; Chen, Z. Study on Perceived Safety in Public Spaces: Take Perception of Stree View in hanghai as an Example. Landsc. Archit. 2018, 25, 23–29. [Google Scholar] [CrossRef]
- Wang, R.; Lu, Y.; Zhang, J.; Liu, P.; Yao, Y.; Liu, Y. The relationship between visual enclosure for neighbourhood street walkability and elders’ mental health in China: Using street view images. J. Transp. Health 2019, 13, 90–102. [Google Scholar] [CrossRef]
- Helbich, M.; Yao, Y.; Liu, Y.; Zhang, J.; Liu, P.; Wang, R. Using deep learning to examine street view green and blue spaces and their associations with geriatric depression in Beijing, China. Environ. Int. 2019, 126, 107–117. [Google Scholar] [CrossRef]
- He, N.; Li, G. Urban neighbourhood environment assessment based on street view image processing: A review of research trends. Environ. Chall. 2021, 4, 100090. [Google Scholar] [CrossRef]
- Sussman, A.; Hollander, J.B. Cognitive Architecture: Designing for How We Respond to the Built Environment; Routledge: London, UK, 2014. [Google Scholar]
- Hollander, J.B.; Sussman, A.; Lowitt, P.M.; Angus, N.; Situ, M. Eye-tracking emulation software: A promising urban design tool. Archit. Sci. Rev. 2021, 64, 383–393. [Google Scholar] [CrossRef]
- Lavdas, A.A.; Salingaros, N.A.; Sussman, A. Visual Attention Software: A New Tool for Understanding the “Subliminal” Experience of the Built Environment. Appl. Sci. 2021, 11, 6197. [Google Scholar] [CrossRef]
- Hollander, J.B.; Sussman, A.; Lowitt, P.M.; Angus, N.; Situ, M.J. Analyzing Walkability through Biometrics: Insights into Sustainable Transportation through the Use of Eye-Tracking Emulation Software. J. Phys. Act. Health 2020, 17, 1153–1161. [Google Scholar] [CrossRef] [PubMed]
- Hollander, J. Private Property Owners and the Remaking of Brownfields. Public Works Manag. Policy 2010, 15, 32–56. [Google Scholar] [CrossRef]
- Hollander, J.B.; Anderson, E.C. The impact of urban façade quality on affective feelings. Int. J. Archit. Res. 2020. ahead of print. [Google Scholar]
- Sussman, A.; Hollander, J. Nature Is Our Context: Biophilia and Biophilic Design. In Cognitive Architecture; Routledge/Taylor & Francis Group: New York, NY, USA, 2014. [Google Scholar]
- Hollander, J.B.; Sussman, A.; Lowitt, P.M.; Angus, N.; Situ, M.; Magnuson, A. Insights into wayfinding: Urban design exploration through the use of algorithmic eye-tracking software. J. Urban Des. 2022, 28, 274–295. [Google Scholar] [CrossRef]
- Sussman, A.; Ward, J. Eye-tracking Boston City Hall to better understand human perception and the architectural experience. New Des. Ideas 2019, 3, 53–59. [Google Scholar]
- Sussman, A.; Ward, J. How Biometric Software is Changing How We Understand Architecture—And Ourselves. Common Edge 2021. Available online: https://commonedge.org/how-biometric-software-is-changing-how-we-understand-architecture-and-ourselves/ (accessed on 2 October 2023).
- Yu, C.-E.; Xie, S.Y.; Wen, J.J. Coloring the destination: The role of color psychology on Instagram. Tour. Manag. 2020, 80, 104110. [Google Scholar] [CrossRef]
- Bytyçi, S. Influence of Colors as a Key Element in Consumer Marketing. Expert J. Mark. 2020, 8, 41–47. [Google Scholar]
- Kuper, R. Effects of Flowering, Foliation, and Autumn Colors on Preference and Restorative Potential for Designed Digital Landscape Models. Environ. Behav. 2018, 52, 544–576. [Google Scholar] [CrossRef]
- Elsadek, M.; Sun, M.; Fujii, E. Psycho-physiological responses to plant variegation as measured through eye movement, self-reported emotion and cerebral activity. Indoor Built Environ. 2017, 26, 758–770. [Google Scholar] [CrossRef]
- Pawson, S.; Bader, M.K.-F. LED lighting increases the ecological impact of light pollution irrespective of color temperature. Ecol. Appl. 2014, 24, 1561–1568. [Google Scholar] [CrossRef]
- Naige, C.; Xu, X.; Tan, M.; Wang, X. A Spatial Analysis of Urban Color Harmony in Five Global Metropolises. J. Resour. Ecol. 2022, 13, 238–246. [Google Scholar] [CrossRef]
- Bader, M.D.M.; Mooney, S.J.; Bennett, B.C.; Rundle, A.G. The Promise, Practicalities, and Perils of Virtually Auditing Neighborhoods Using Google Street View. Ann. Am. Acad. Political Soc. Sci. 2017, 669, 18–40. [Google Scholar] [CrossRef]
- Bader, M.D.M.; Mooney, S.J.; Lee, Y.J.; Sheehan, D.M.; Neckerman, K.M.; Rundle, A.G.; Teitler, J. Development and deployment of the Computer Assisted Neighborhood Visual Assessment System (CANVAS) to measure health-related neighborhood conditions. Health Place 2015, 31, 163–172. [Google Scholar] [CrossRef] [PubMed]
- Elephant Ephemera Ltd. Colour Walks Uncover New Visions of the City. Available online: https://elephant.art/life-one-colour/# (accessed on 2 October 2023).
- Costa, M.; Frumento, S.; Nese, M.; Predieri, I. Interior Color and Psychological Functioning in a University Residence Hall. Front. Psychol. 2018, 9, 1580. [Google Scholar] [CrossRef] [PubMed]
- Bonnardel, V.; Beniwal, S.; Dubey, N.; Pande, M.; Bimler, D.L. Gender difference in color preference across cultures: An archetypal pattern modulated by a female cultural stereotype. Color Res. Appl. 2018, 43, 209–223. [Google Scholar] [CrossRef]
- Hidayetoğlu, M.L.; Yıldırım, K.; Akalın, A.J. The effects of color and light on indoor wayfinding and the evaluation of the perceived environment. J. Environ. Psychol. 2012, 32, 50–58. [Google Scholar] [CrossRef]
- Ye, Y.; Zhang, Z.; Zhang, X.; Zeng, W. Human-scale Quality on Streets: A Large-scale and Efficient Analytical Approach Based on Street View lmages and New Urban Analytical Tools. Urban Plan. Int. 2019, 34, 18–27. [Google Scholar] [CrossRef]
- Meichen, D. Quantitative contrast of urban agglomeration colors based on image clustering algorithm: Case study of the Xia-Zhang-Quan metropolitan area. Front. Archit. Res. 2021, 10, 692–700. [Google Scholar]
- Jiang, H.; Lu, S.; Xiao, Y. Method of Urban Color Evaluation for Historic and Cultural Areas in Shanghai Based on Street View Technology. Urban Plan. Forum 2022, 3, 111–118. [Google Scholar]
- Zhong, T.; Ye, C.; Wang, Z.; Ye, Y. City-Scale Mapping of Urban Faade Color Using Street-View Imagery. Remote Sens. 2021, 13, 1591. [Google Scholar] [CrossRef]
- Zhu, X.; Chen, A.; Lu, F.; Chen, Z. Research and Map Construction of Architectural Colors in Fuzhou Historical and Cultural Blocks—Taking the Nanhou Street of Three Lanes and Seven Alleys as an example. Fujian Constr. Sci. Technol. 2023, 2, 4–7. [Google Scholar]
- Danaci, H.M.; Kiran, G.S. Examining the Factor of Color on Street Facades in Context of the Perception of Urban Aesthetics: Example of Antalya. Int. J. Curric. Instr. 2020, 12, 222–232. [Google Scholar]
- Badrinarayanan, V.; Kendall, A.; Cipolla, R. SegNet: A Deep Convolutional Encoder-Decoder Architecture for Image Segmentation. IEEE Trans. Pattern Anal. Mach. Intell. 2017, 139, 2481–2495. [Google Scholar] [CrossRef] [PubMed]
- Kolhar, S.; Jagtap, J. Convolutional neural network based encoder-decoder architectures for semantic segmentation of plants. Ecol. Inform. 2021, 64, 101373. [Google Scholar] [CrossRef]
- Zhang, F.; Zu, J.; Hu, M.; Zhu, D.; Kang, Y.; Gao, S.; Zhang, Y.; Huang, Z. Uncovering inconspicuous places using social media check-ins and street view images. Comput. Environ. Urban Syst. 2020, 81, 101478. [Google Scholar] [CrossRef]
- Dubey, A.; Naik, N.; Parikh, D.; Raskar, R.; Hidalgo, C.A. Deep Learning the City: Quantifying Urban Perception at a Global Scale. In Proceedings of the 14th European Conference on Computer Vision (ECCV), Amsterdam, The Netherlands, 8–16 October 2016; pp. 196–212. [Google Scholar]
- Yao, Y.; Liang, Z.; Yuan, Z.; Liu, P.; Bie, Y.; Zhang, J.; Wang, R.; Wang, J.; Guan, Q. A human-machine adversarial scoring framework for urban perception assessment using street-view images. Int. J. Geogr. Inf. Sci. 2019, 33, 2363–2384. [Google Scholar] [CrossRef]
- Bradski, G.; Kaehler, A. Learning OpenCV—Computer Vision with the OpenCV Library; O’Reilly Media, Inc.: Sebastopol, CA, USA, 2008. [Google Scholar]
- Lyu, Y.; Forsyth, A. Attitudes, perceptions, and walking behavior in a Chinese city. J. Transp. Health 2021, 21, 101047. [Google Scholar] [CrossRef]
- Cheng, L.; Chu, S.; Zong, W.; Li, S.; Wu, J.; Li, M. Use of Tencent Street View Imagery for Visual Perception of Streets. ISPRS Int. J. Geo-Inf. 2017, 6, 265. [Google Scholar] [CrossRef]
- Rzotkiewicz, A.; Pearson, A.L.; Dougherty, B.V.; Shortridge, A.; Wilson, N. Systematic review of the use of Google Street View in health research: Major themes, strengths, weaknesses and possibilities for future research. Health Place 2018, 52, 240–246. [Google Scholar] [CrossRef]


Disclaimer/Publisher’s Note: The statements, opinions and data contained in all publications are solely those of the individual author(s) and contributor(s) and not of MDPI and/or the editor(s). MDPI and/or the editor(s) disclaim responsibility for any injury to people or property resulting from any ideas, methods, instructions or products referred to in the content. |
© 2023 by the authors. Licensee MDPI, Basel, Switzerland. This article is an open access article distributed under the terms and conditions of the Creative Commons Attribution (CC BY) license (https://creativecommons.org/licenses/by/4.0/).