Abstract
The use of renewable building materials in construction is crucial to minimising the environmental impact of new buildings. Bio-based building materials have a wide range of positive properties, many of which are due to their hygroscopic behaviour. The purpose of this study is to investigate the hygrothermal performance of chopped straw, sheep’s wool, and cellulose insulated timber frame external wall assemblies in the presence of air leakage and high indoor relative humidity. For this purpose, tests with different moisture contents, overpressures, and defects in the airtight layer were carried out in an outdoor test stand over a period of 18 months. The results were compared with a conventional mineral wool insulated construction. Both sheep’s wool and cellulose are particularly fault-tolerant insulation materials in combination with timber frame constructions. All three bio-based insulations, despite defects in the airtight layer, showed no mould-prone moisture content. An installation level insulated with sheep’s wool can increase the fault tolerance of constructions with insulation made of hygric and more sensitive building materials. For chopped straw and cellulose, the measured U-value was lower than expected. Further in situ measurements of bio-based structures are important to gain confidence in their hygrothermal behaviour and to increase their use in multi-storey construction.
1. Introduction
Bio-based building materials can not only store CO2, making a significant contribution to the decarbonisation of the building sector but are also recyclable, biodegradable, moisture and temperature-regulating, and often have low thermal conductivity and high heat storage capacity [1]. However, bio-based building materials are still relatively underused in multi-storey buildings due to uncertainties regarding moisture behaviour, durability, and a general lack of knowledge [2].
The hygrothermal performance of building materials includes the absorption, storage, release, and interaction of heat and moisture. This ability to adsorb and desorb water vapour is measured by an index called the moisture buffering value [3]. Building materials with the ability of moisture buffering improve hygrothermal comfort and indoor air quality [3,4], although their specific contribution to the indoor climate has not yet been fully understood [3,5]. Olalekan et al. found that the use of hygroscopic materials can reduce heating and cooling energy consumption by up to 5% and 30%, respectively [6]. Mendes et al. showed that peak heating loads are overestimated by up to 210% and underestimated by up to 59% due to passive moisture absorption and release [7]. The study of hygroscopic building materials under real-life conditions is therefore of great importance in order to correctly calculate the energy demand of buildings and to properly size heating, ventilation, and air conditioning systems.
Compared to conventional insulation materials (e.g., mineral wool and polystyrene), bio-based insulation materials are often assigned higher nominal and design values for thermal conductivity, which results from a normative moisture surcharge for natural fibre insulation materials [8]. The thermal conductivity of building materials at 23 °C temperature and 80% relative humidity is used to calculate the thermal transmittance of a building construction (U-value). This value at 23 °C and 80% is usually determined by adding a normative factor to the dry thermal conductivity [8]. Depending on the product, this normative factor can be up to 20% of the measured value in the dry state. Therefore, it is generally assumed that the average climate in the insulation material is 23 °C and 80% humidity. The thermal conductivity has a direct influence on the calculated U-value and thus on the design of the building’s energy balance. It is not yet scientifically clear whether this general addition to the thermal conductivity of natural fibre materials is justified.
1.1. Literature Review of the Examined Materials
For multi-storey buildings, the combination of external timber frame walls and internal massive timber walls is a particularly ecological construction method [9]. Timber framing, particularly for external walls, offers the opportunity to achieve high insulation thicknesses and thus reduce the operational environmental impact through reduced heating requirements during the cold seasons. However, the most commonly used mineral or plastic-based building materials for thermal insulation are currently responsible for approximately 26.1% of the total embodied CO2 in construction [10]. Recent research shows that timber constructions with insulation that has a hygrothermal behaviour similar to that of wood are generally more robust and, therefore, more durable [11]. There is a broad consensus that hygroscopic materials disperse moisture that enters the material and thus protect the timber structure. However, there are many different ecological insulation materials, all of which behave hygrothermally differently. Natural fibre insulation materials are based on a wide range of bio-based raw materials, such as wood, cellulose, hemp, jute, and straw [11]. Among the many different types of insulation, wood fibre-based building materials have been extensively investigated hygrothermally [12,13,14]. While straw bale insulation has been known for a relatively long time as an eco-insulation, blowing in chopped straw insulation is a new technology that has recently been increasingly investigated [15]. Previous studies have focused on the risk of mould [16], specific material mixtures such as chopped straw and cellulose [17], or thermal conductivity [15,18]. The hygrothermal properties of sheep’s wool [19] and cellulose [20] have also been extensively studied under laboratory conditions. Investigations under real conditions should also include design flaws that may lead to air leakage. Air leakage is generally a major problem in highly insulated timber frame buildings, often leading to moisture problems such as mould [21,22]. Various studies have focused on the relation of air leakage and moisture content of different insulation materials such as cellulose [23,24] and wood fibre [13], and the moisture and temperature behaviour of wood fibre, cellulose, and mineral wool [25]. The behaviour of chopped straw insulation and sheep’s wool under air leakage has not been sufficiently investigated so far.
In general, the carbon cycle of bio-based building materials is considered neutral because the carbon stored is released back into the atmosphere at the end of life [26]. Although the timing of storage and release of CO2 from bio-based building materials obviously matters, fast-growing plants such as straw can have a distinct advantage as a fast-acting carbon sink [27]. One-third of the straw can be taken out of the agricultural system, and there is still enough straw available as substrate or bedding [28]. Additionally, it has the highest cumulative carbon storage potential until 2050 [28].
Sheep’s wool insulation can be made from the leftovers of the textile industry. A large proportion of raw sheep’s wool, 95%, is not suitable for the market and is not adequately recycled. Although there are no studies for Austria, a study for Italy shows that the sheep’s wool waste produced there could meet the demand for insulation materials in Italy [29].
Cellulose fibre insulation materials consist mainly of ground paper fibres treated with inorganic additives such as fire retardants and mould inhibitors. The raw material for the cellulose fibres is usually recycled newsprint, either from unsold paper or from waste paper [30].
In conclusion, all three insulations are by-products or recycled products that are regionally produced and sufficiently available in Austria for new multi-storey buildings.
1.2. Aim of the Study and Research Question
This study is part of the natuREbuilt project [31], which investigates the use and limitations of natural building materials in multi-storey timber construction. The natuREbuilt project is based on the assumption that natural fibre materials do not all have the same hygrothermal behaviour but that a distinction must be made between them. Particular attention has been paid to the effect of defects on the robustness of external wall constructions with different natural fibre insulation materials, either during construction or due to the behaviour of subsequent users. For this purpose, constructions with cellulose, straw, and sheep’s wool insulation materials were investigated under real conditions and in the presence of air leakage and high indoor relative humidity using moisture and temperature sensors in a two-storey outdoor test facility over a period of 18 months. The hygrothermal properties of the insulation materials were compared with those of mineral wool. In addition, the U-value of the constructions was measured and compared with the calculated value. The following research questions were investigated:
- How do the insulation materials sheep’s wool, straw, and cellulose differ in their fault tolerance?
- Does very high indoor humidity have a different effect on the three insulations studied?
- What is the effect of a layer of sheep’s wool when there are defects in the airtight layer?
- Is there a difference between the measured U-value and the calculated U-value?
2. Materials and Methods
In total, eight different constructions were tested in an outdoor test rig for 18 months under different loads of high humidity, air leakage, and overpressure. Table 1 shows the type of load divided into four different time periods.

Table 1.
Examination periods and type of moisture load.
2.1. Outdoor Test Rig
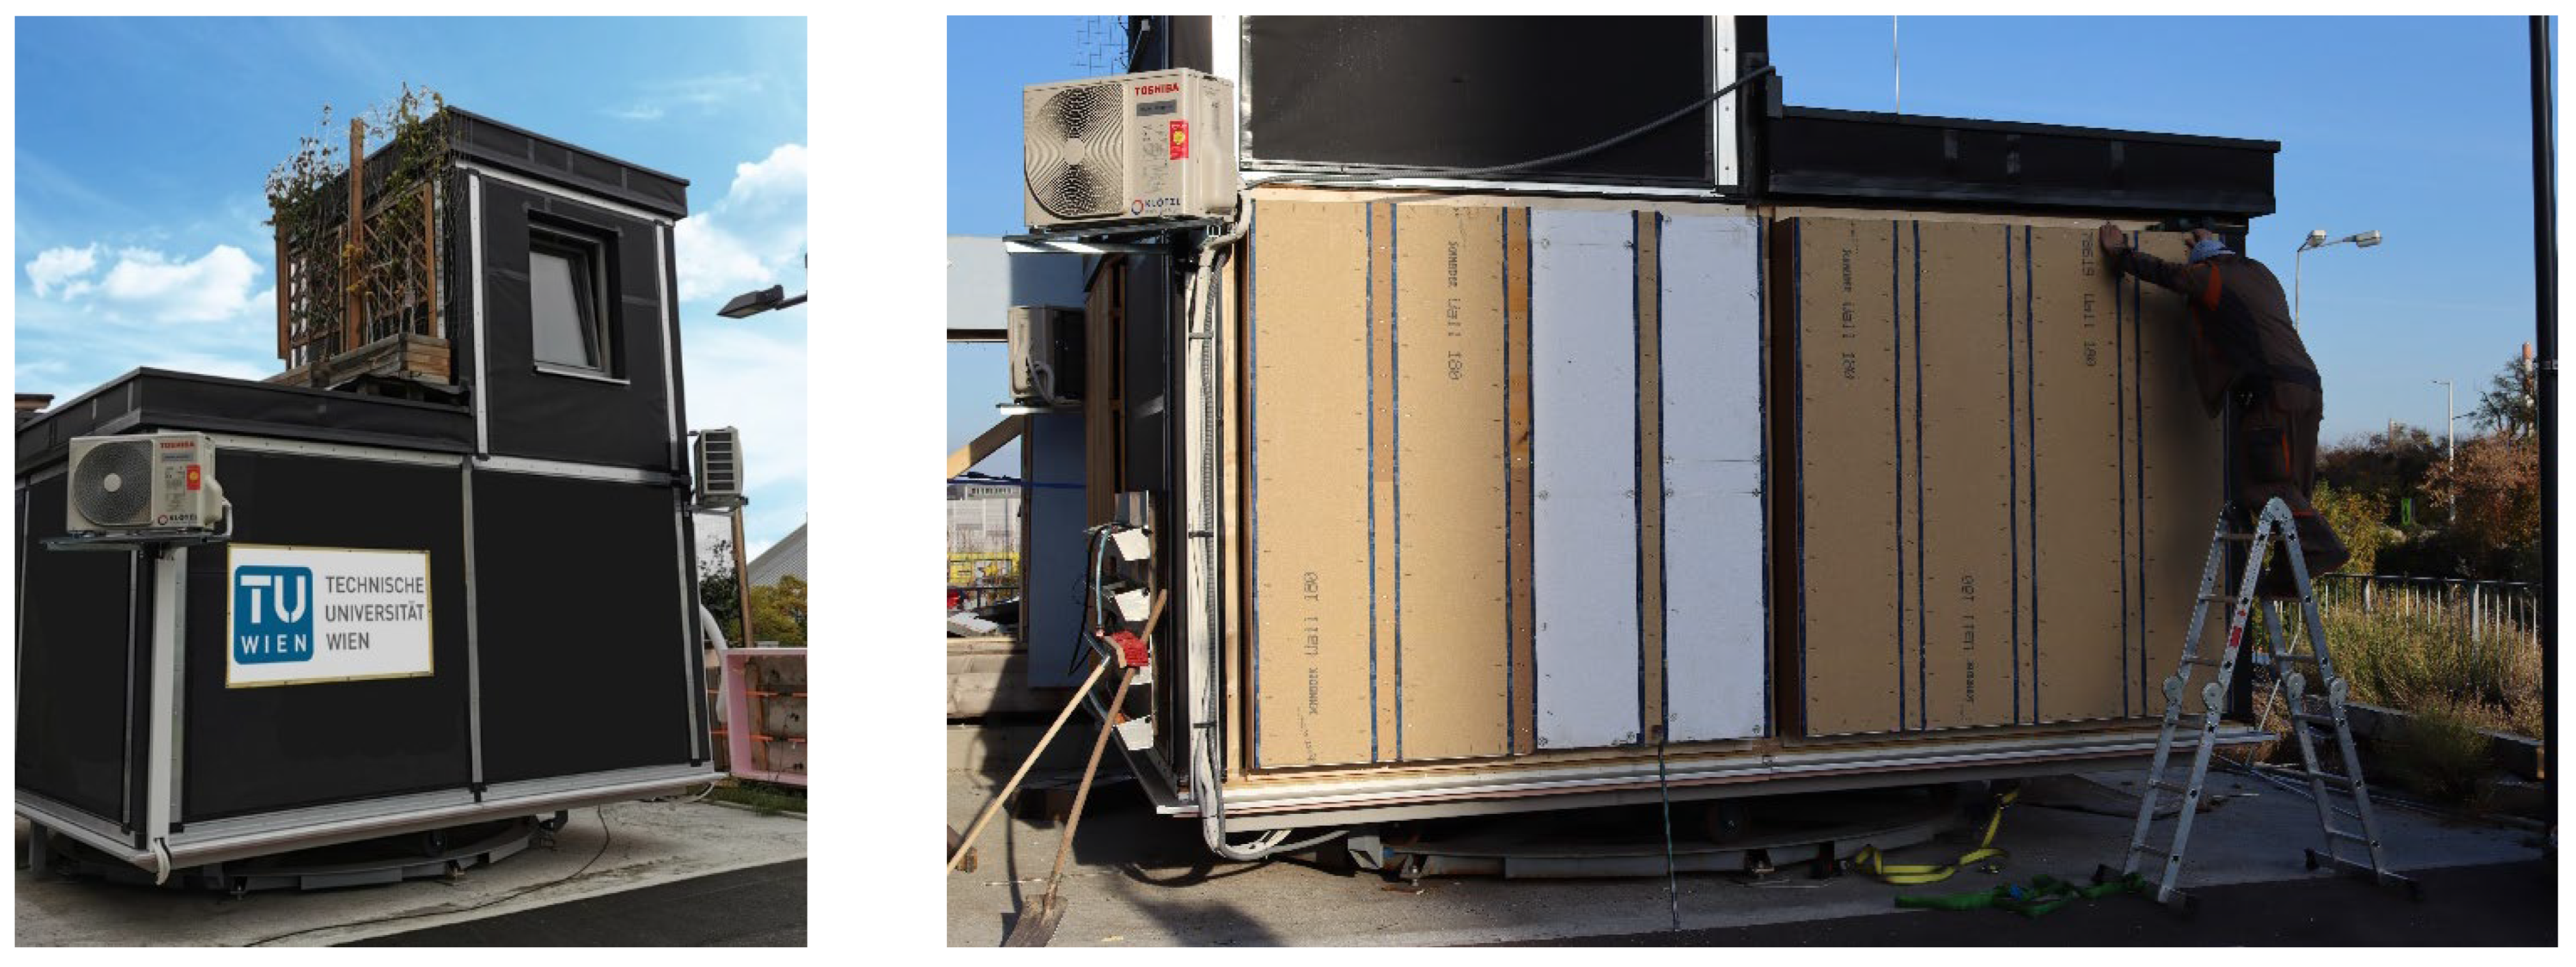
The outdoor test facility, as shown in Figure 1, was located at the Science Centre of the Vienna University of Technology. The in situ test facility was designed to perform measurements in real environments. The test facility consisted of a two-storey wooden frame construction in which different modules were installed. It is located in a mostly unprotected area where it is exposed to the climatic conditions of south-east Vienna. For the experiments, two adjacent modules of the exterior walls were constructed with timber frames and installed in the test stand. The exterior walls, both 2.09 × 2.18 m in size, consisted of a solid spruce frame with 0.20 × 0.06 m beams and faced north.
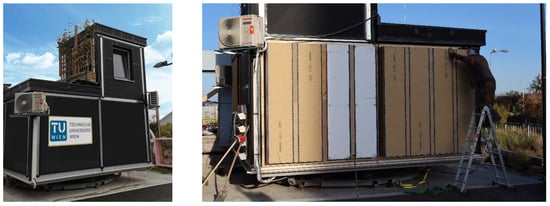
Figure 1.
Outdoor test rig for the examination of exterior walls in Vienna, Austria.
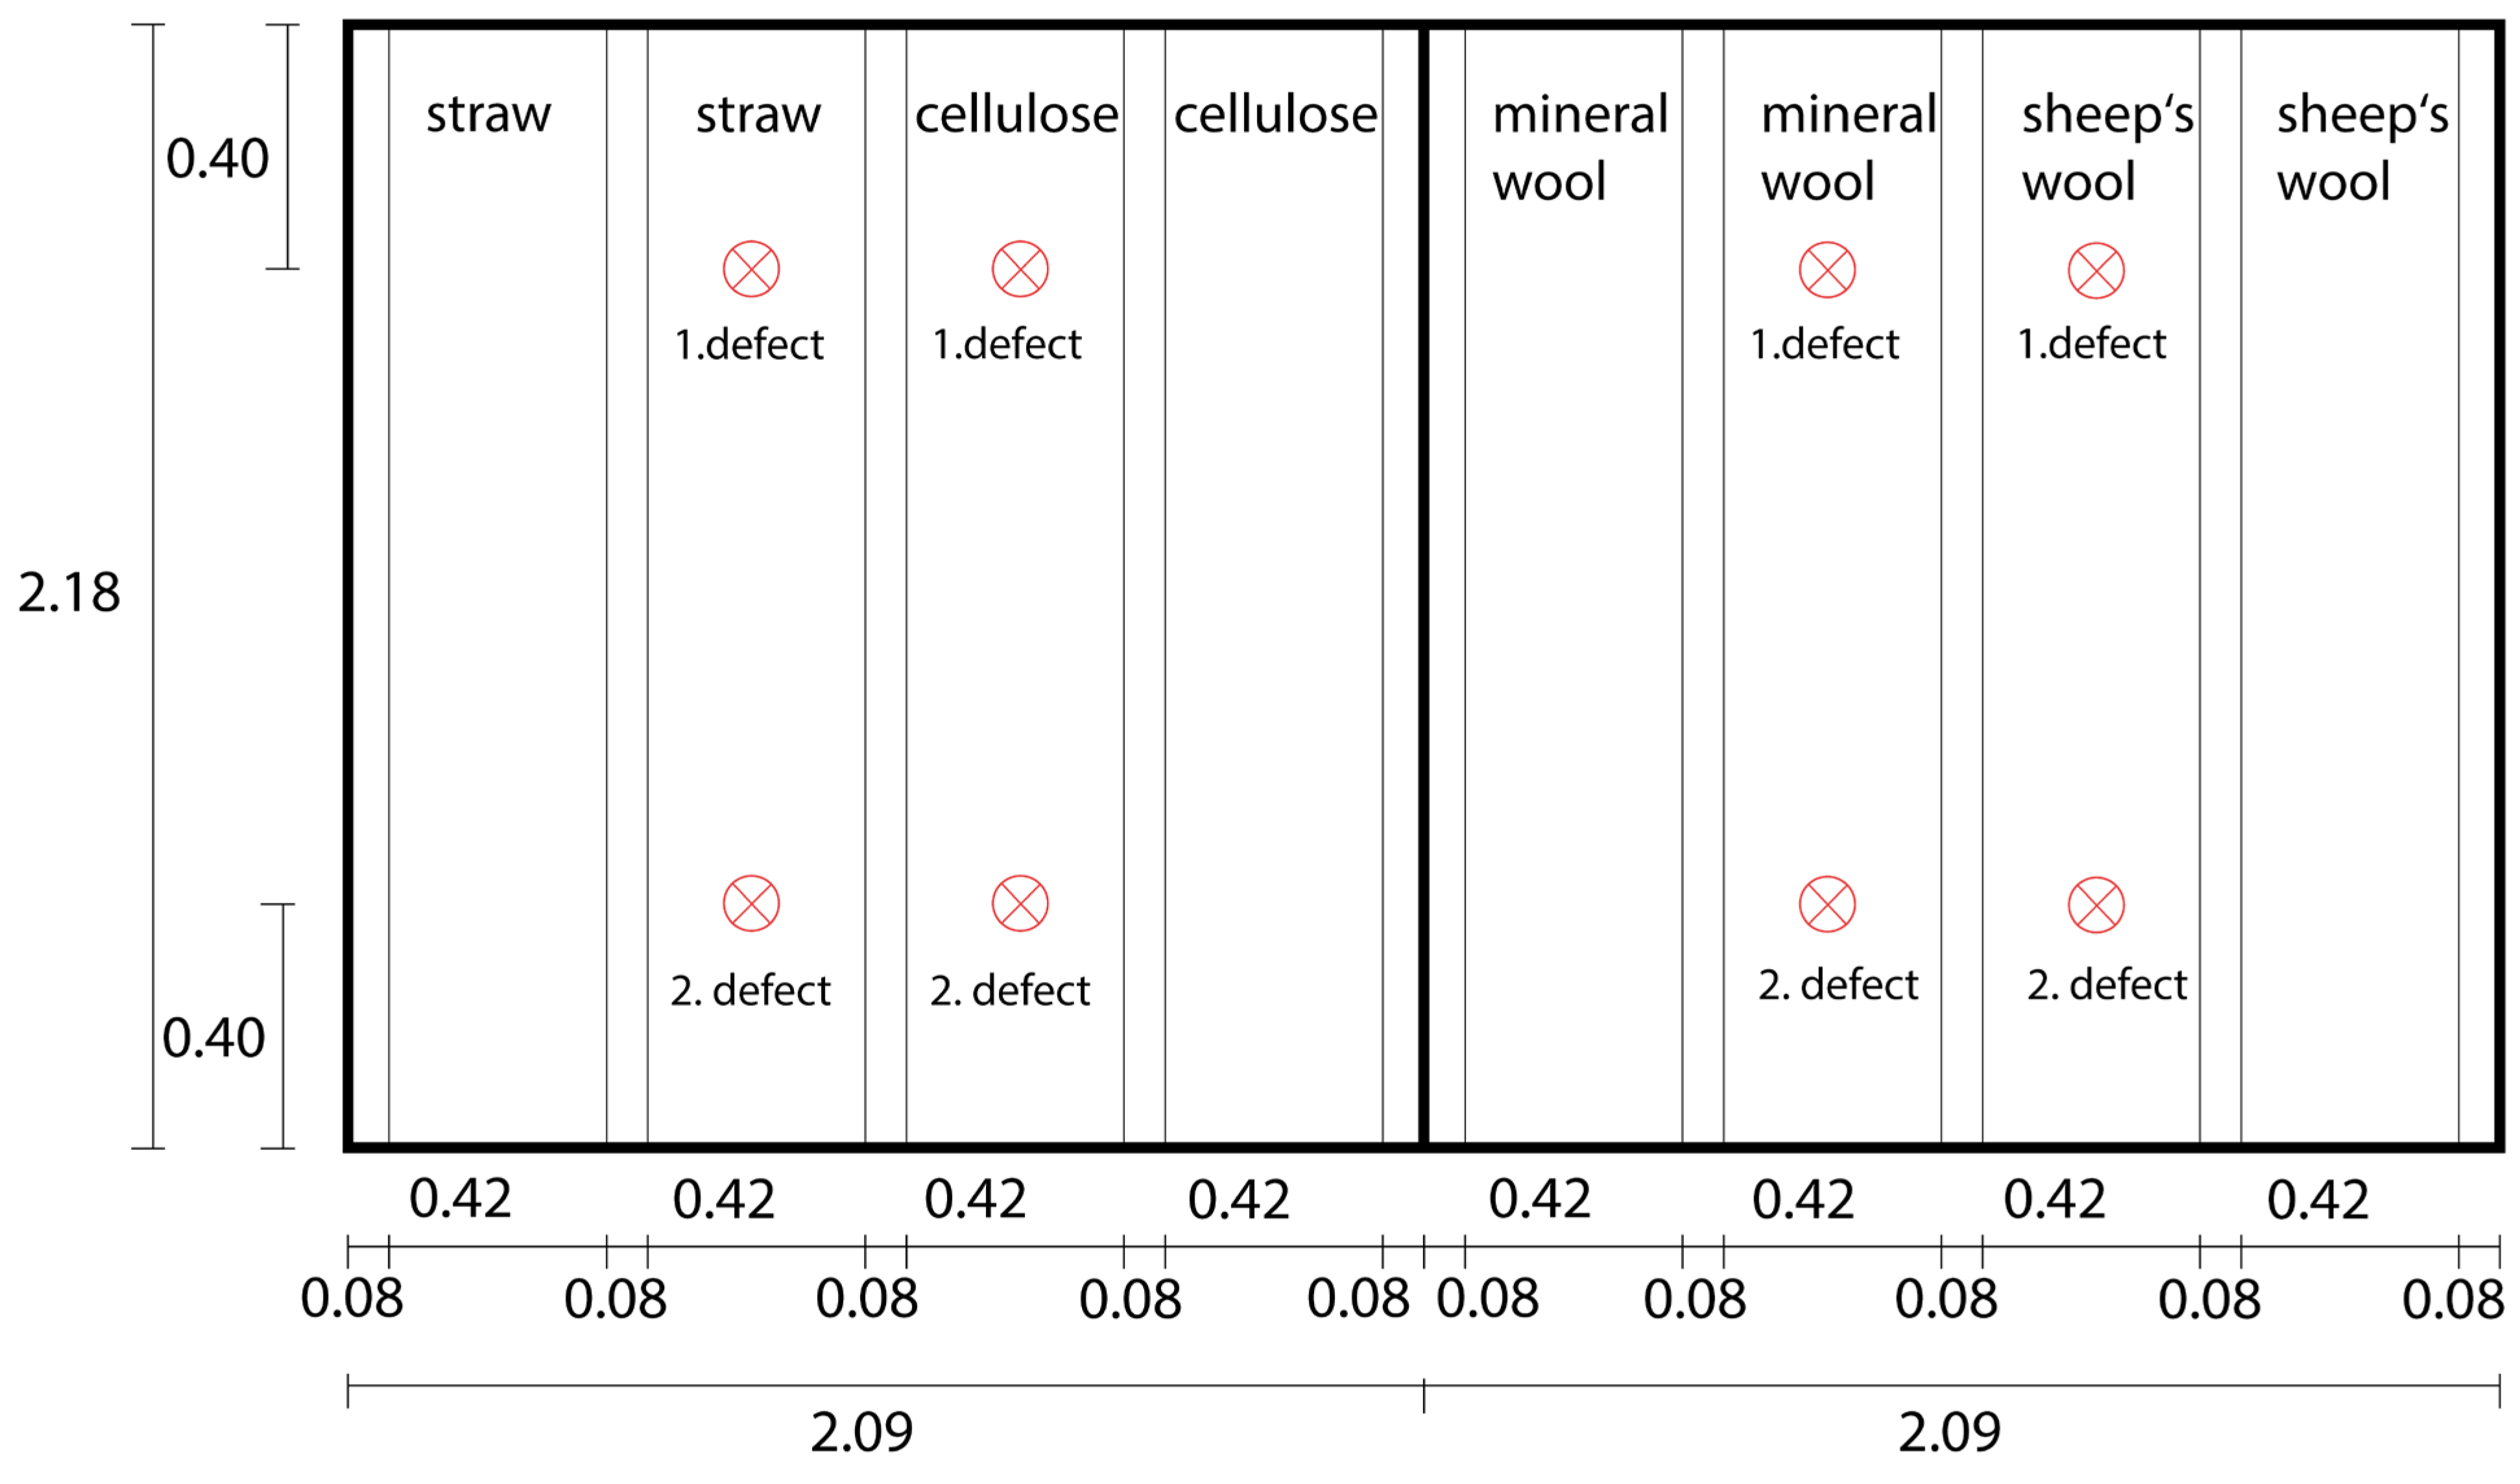
The three different insulation materials, chopped straw, cellulose, and sheep’s wool, were tested and compared with the reference insulation material, mineral wool. In order to determine the fault tolerance, two fields were arranged for each insulation material, one of which was provided with a defect. This defect consisted of first one and then two holes in the airtight layer, which was made of an oriented strand board (OSB). A hole was drilled from the inside through the clay board, the installation level, and the OSB board using a drill with a 10mm diameter. The position of the two defects and the experimental setup are shown in Figure 2.
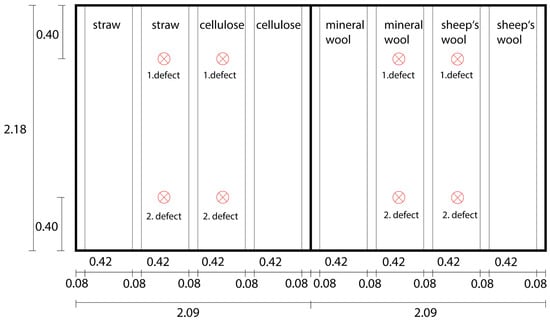
Figure 2.
Experimental setup, internal view, and dimensions in metres.
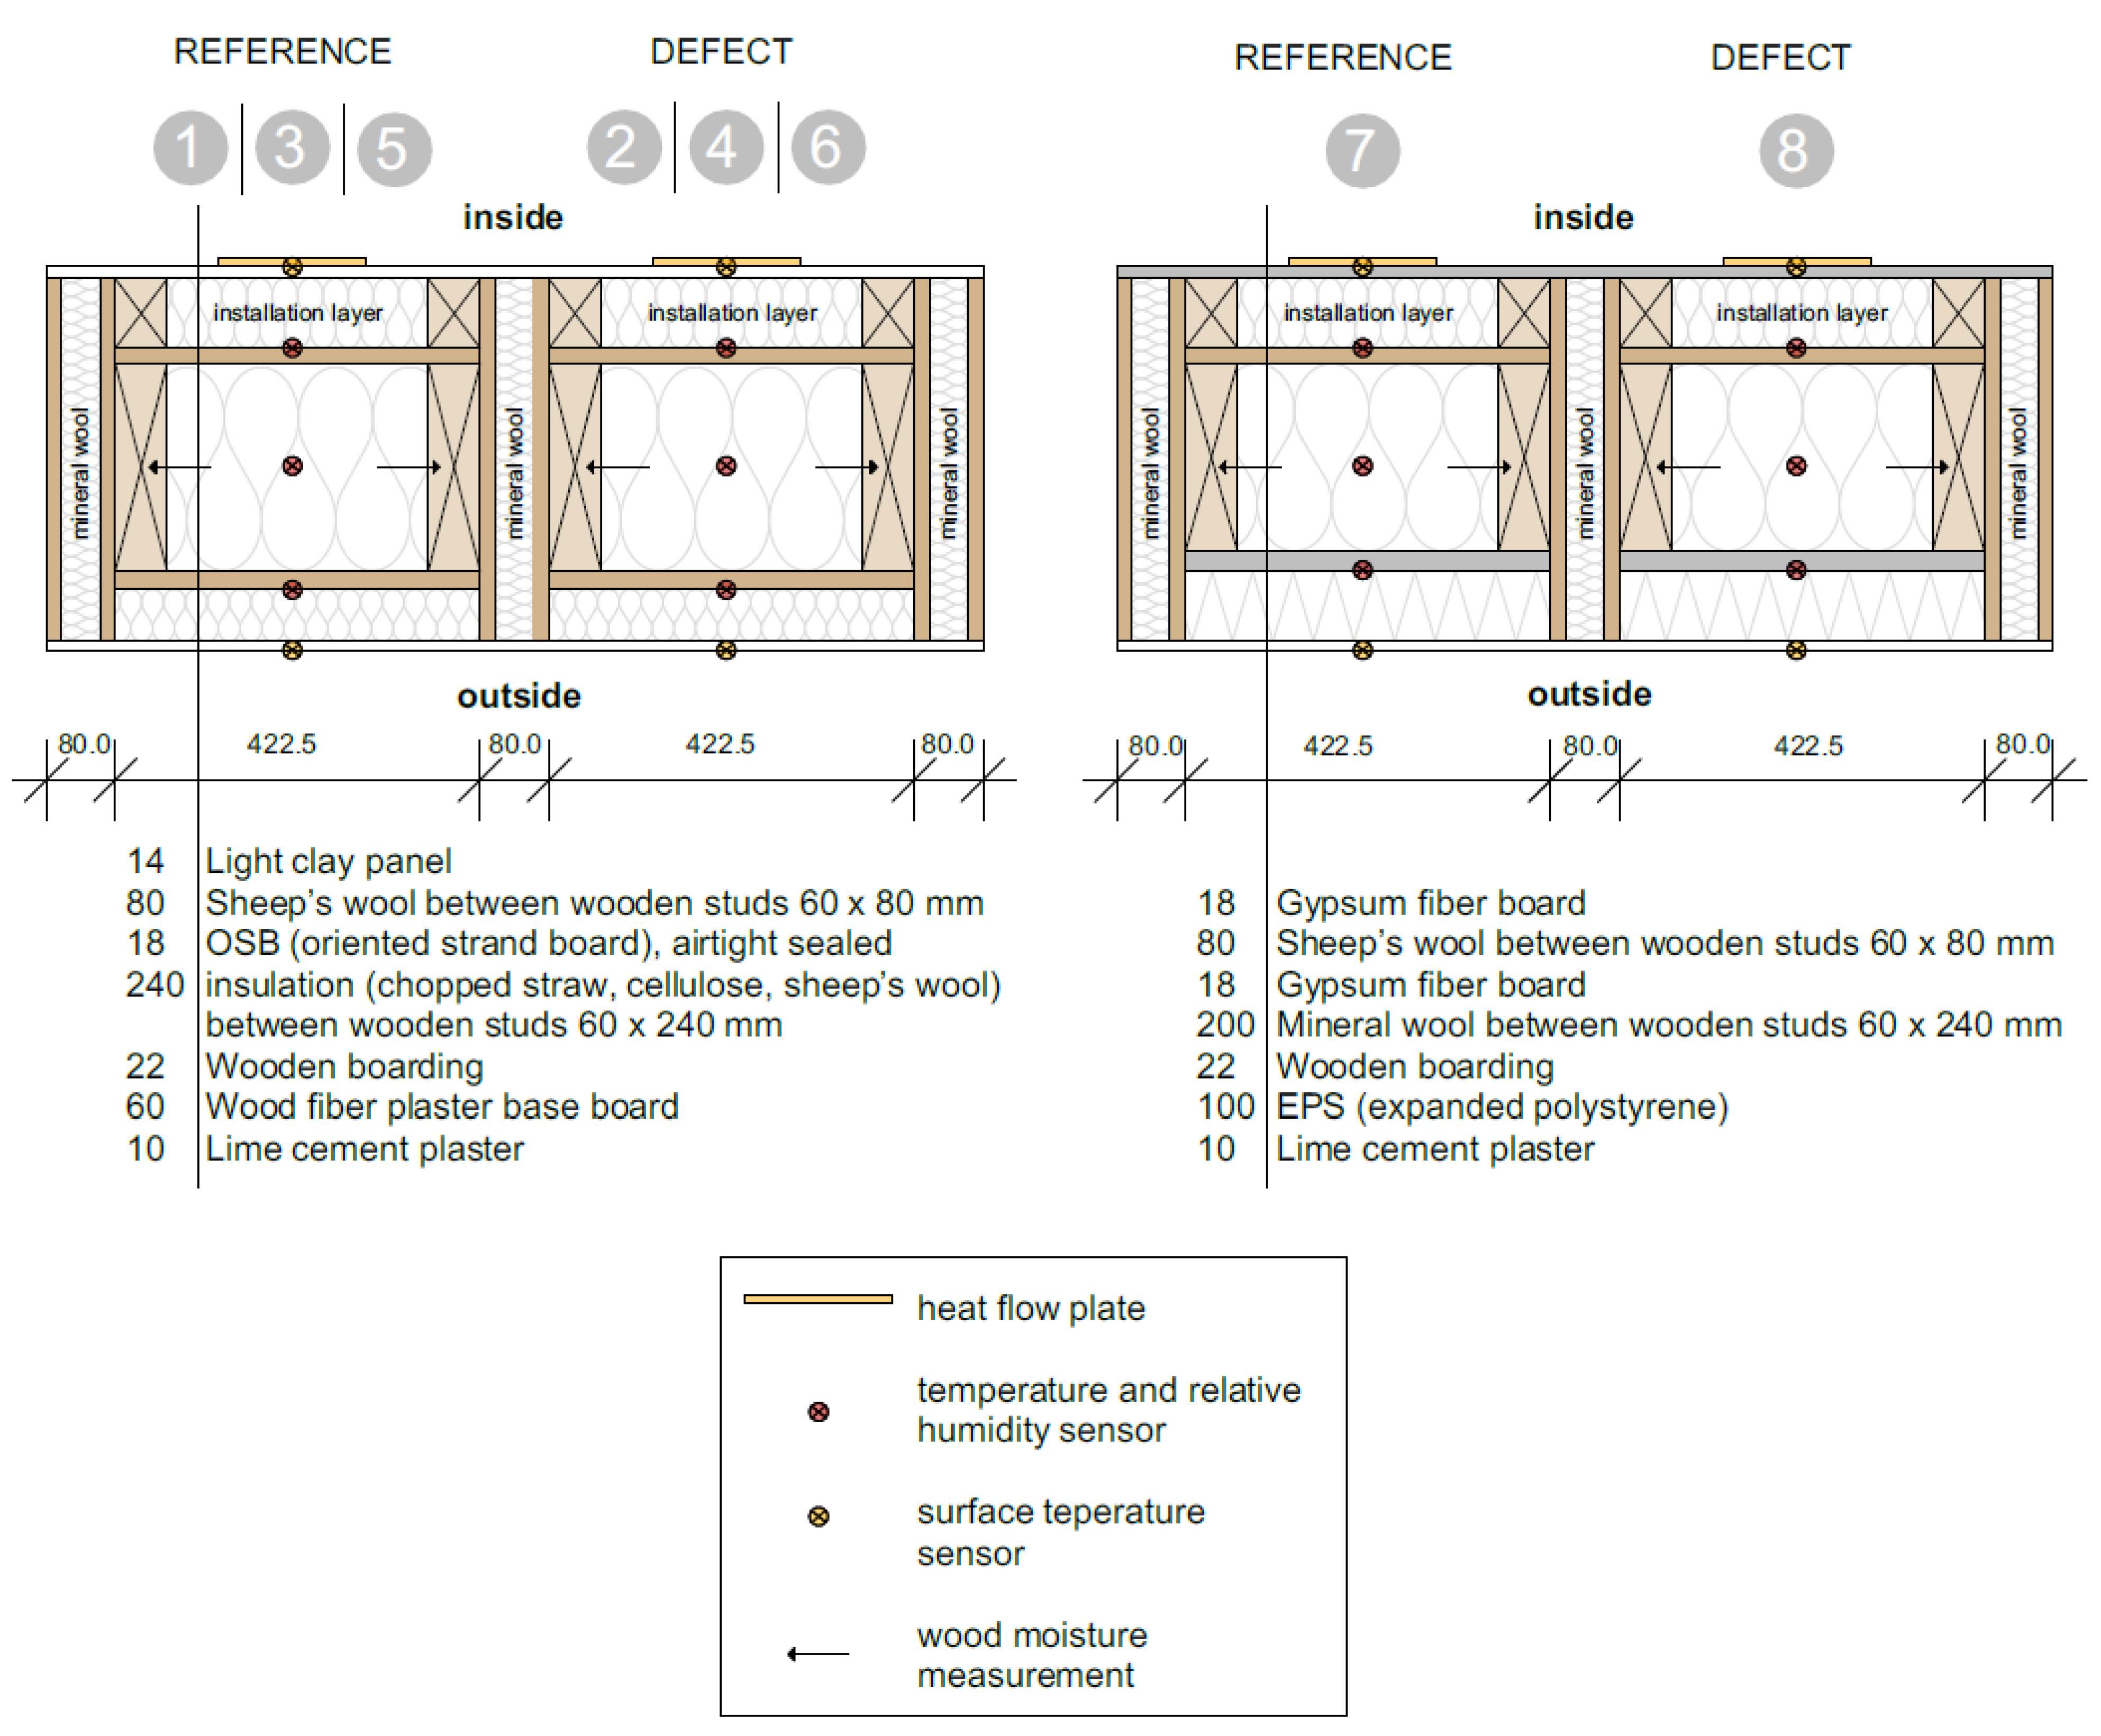
Figure 3 shows horizontal sections through the structures. For each of the 8 modules, temperature and relative humidity were measured at 3 locations, surface temperature (inside and outside) at 2 locations, and the heat flow was measured using a heat flow measurement foil. The arrows indicate the positions of the wood moisture measurements, which are not evaluated in this study. Constructions 1 to 6 were built in the same way, differing only in the insulation material. Constructions 7 and 8 show the reference construction, which is a conventional construction and was therefore constructed with mineral fibre in the insulation layer and polystyrene as the plaster baseboard. The installation level was made with sheep’s wool in all 8 modules.
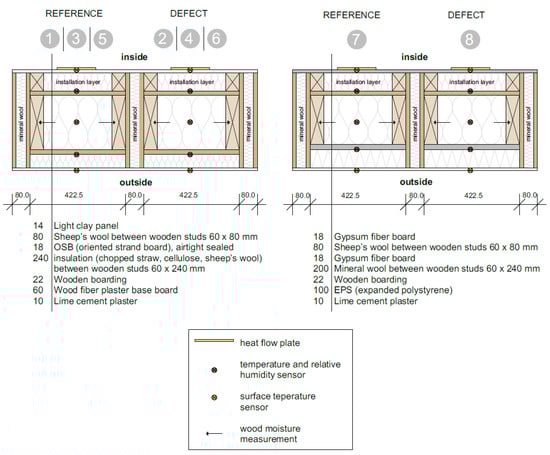
Figure 3.
Horizontal section trough the examined constructions and sensor positions: nr. 1 to 6 represent the reference and defect modules with the insulation materials straw, cellulose, and sheep’s wool; nr. 7 and 8 represent the reference and defect module with the mineral wool insulation.
2.2. Sensors
Two Toshiba RAV-GM301ATP-E air conditioning units were used to condition the interior of the outdoor test stand. RS Components PT1000 sensors were used to measure the internal and external surface temperature. Retronik HC2A-S3 temperature and humidity sensors were installed inside the module. The Keysight 34980A (HP34980A) switch system/data logger was used to record and store the data. Measurements were taken and stored every 10 min. The heat flow for the U-value assessment was recorded using Phymeas type 8 heat flow plates in a 5 min cycle.
The measurement uncertainty is provided in Table 2.
Table 2.
Measurement uncertainty of the sensors used.
In order to introduce the high humidity inside the test stand through the flaws in the construction, overpressure was temporarily generated in the test stand. Overpressure tests were carried out with a pressure probe from Testo. The differential pressure was measured.
2.3. Air Tightness of the Test Rig
To ensure the airtightness of the test stand, a blower door measurement was carried out on 14 June 2022 in accordance with EN 13829 using the overpressure method. The measurement results are shown in Table 3.
Table 3.
Measurements of the blower door.
OIB Guideline 6 [32] prescribes an air exchange rate of n50 for new buildings of not more than 3.0 1/h, measured at a pressure difference of 50 Pa between indoor and outdoor air. The air exchange rate n50 of 2.02 1/h obtained from the test rig is, therefore, in line with the requirements for a new building without a mechanical ventilation system.
2.4. U-Value Evaluation
The heat flow measurement was recorded on the reference modules. The heat flow measurement plates were attached to the inside of the light clay panels.
The average method in ISO 9869-1 [33] provides the following criteria for in situ measurements of U-values by heat flow measurement:
- The heat content of the element is the same at the end and the beginning of the measurement (same temperature and same moisture distribution).
- The heat flow measurement is not exposed to direct solar radiation.
- The thermal conductance of the element is constant during the test.
In order to exclude the influence of solar radiation, only values between 07:00 pm and 06:00 am were used. In the period between 16 January 2022 and 15 February 2022, the superstructures at the beginning and end of the measurements showed relatively similar temperature and humidity conditions, and there were only small fluctuations, so this period was chosen. Plausible methods for in situ measured U-values are still the subject of many investigations, particularly for highly insulated external walls [34,35]. In order to obtain reliable results for highly insulated exterior walls, a time period was used where the temperature difference between the indoor and outdoor air was as high as possible (greater than 20 K). This approach was also used by [36].
The moving average per night was created from the data and calculated according to Equation 1. The equation is taken from the ISO 9869-1 average method [33],
where U is the thermal transmittance in W/m²K, q is the density of heat flow rate in W/m², Ti is the interior environmental (ambient) temperature in °C, and Te is the exterior environmental (ambient) temperature (°C).
3. Results and Discussion
The results below are broken down into the four time periods shown in Table 1.
3.1. One Defect, Normal Air Humidity
The measurement period from January to April 2022 shows the measured relative humidities within the structures at three different positions, each on a module with and without a defect. The sensor on the outer layer is marked with the number 1, the sensor in the middle of the insulation with the number 2 and the one in the inner position with the number 3.
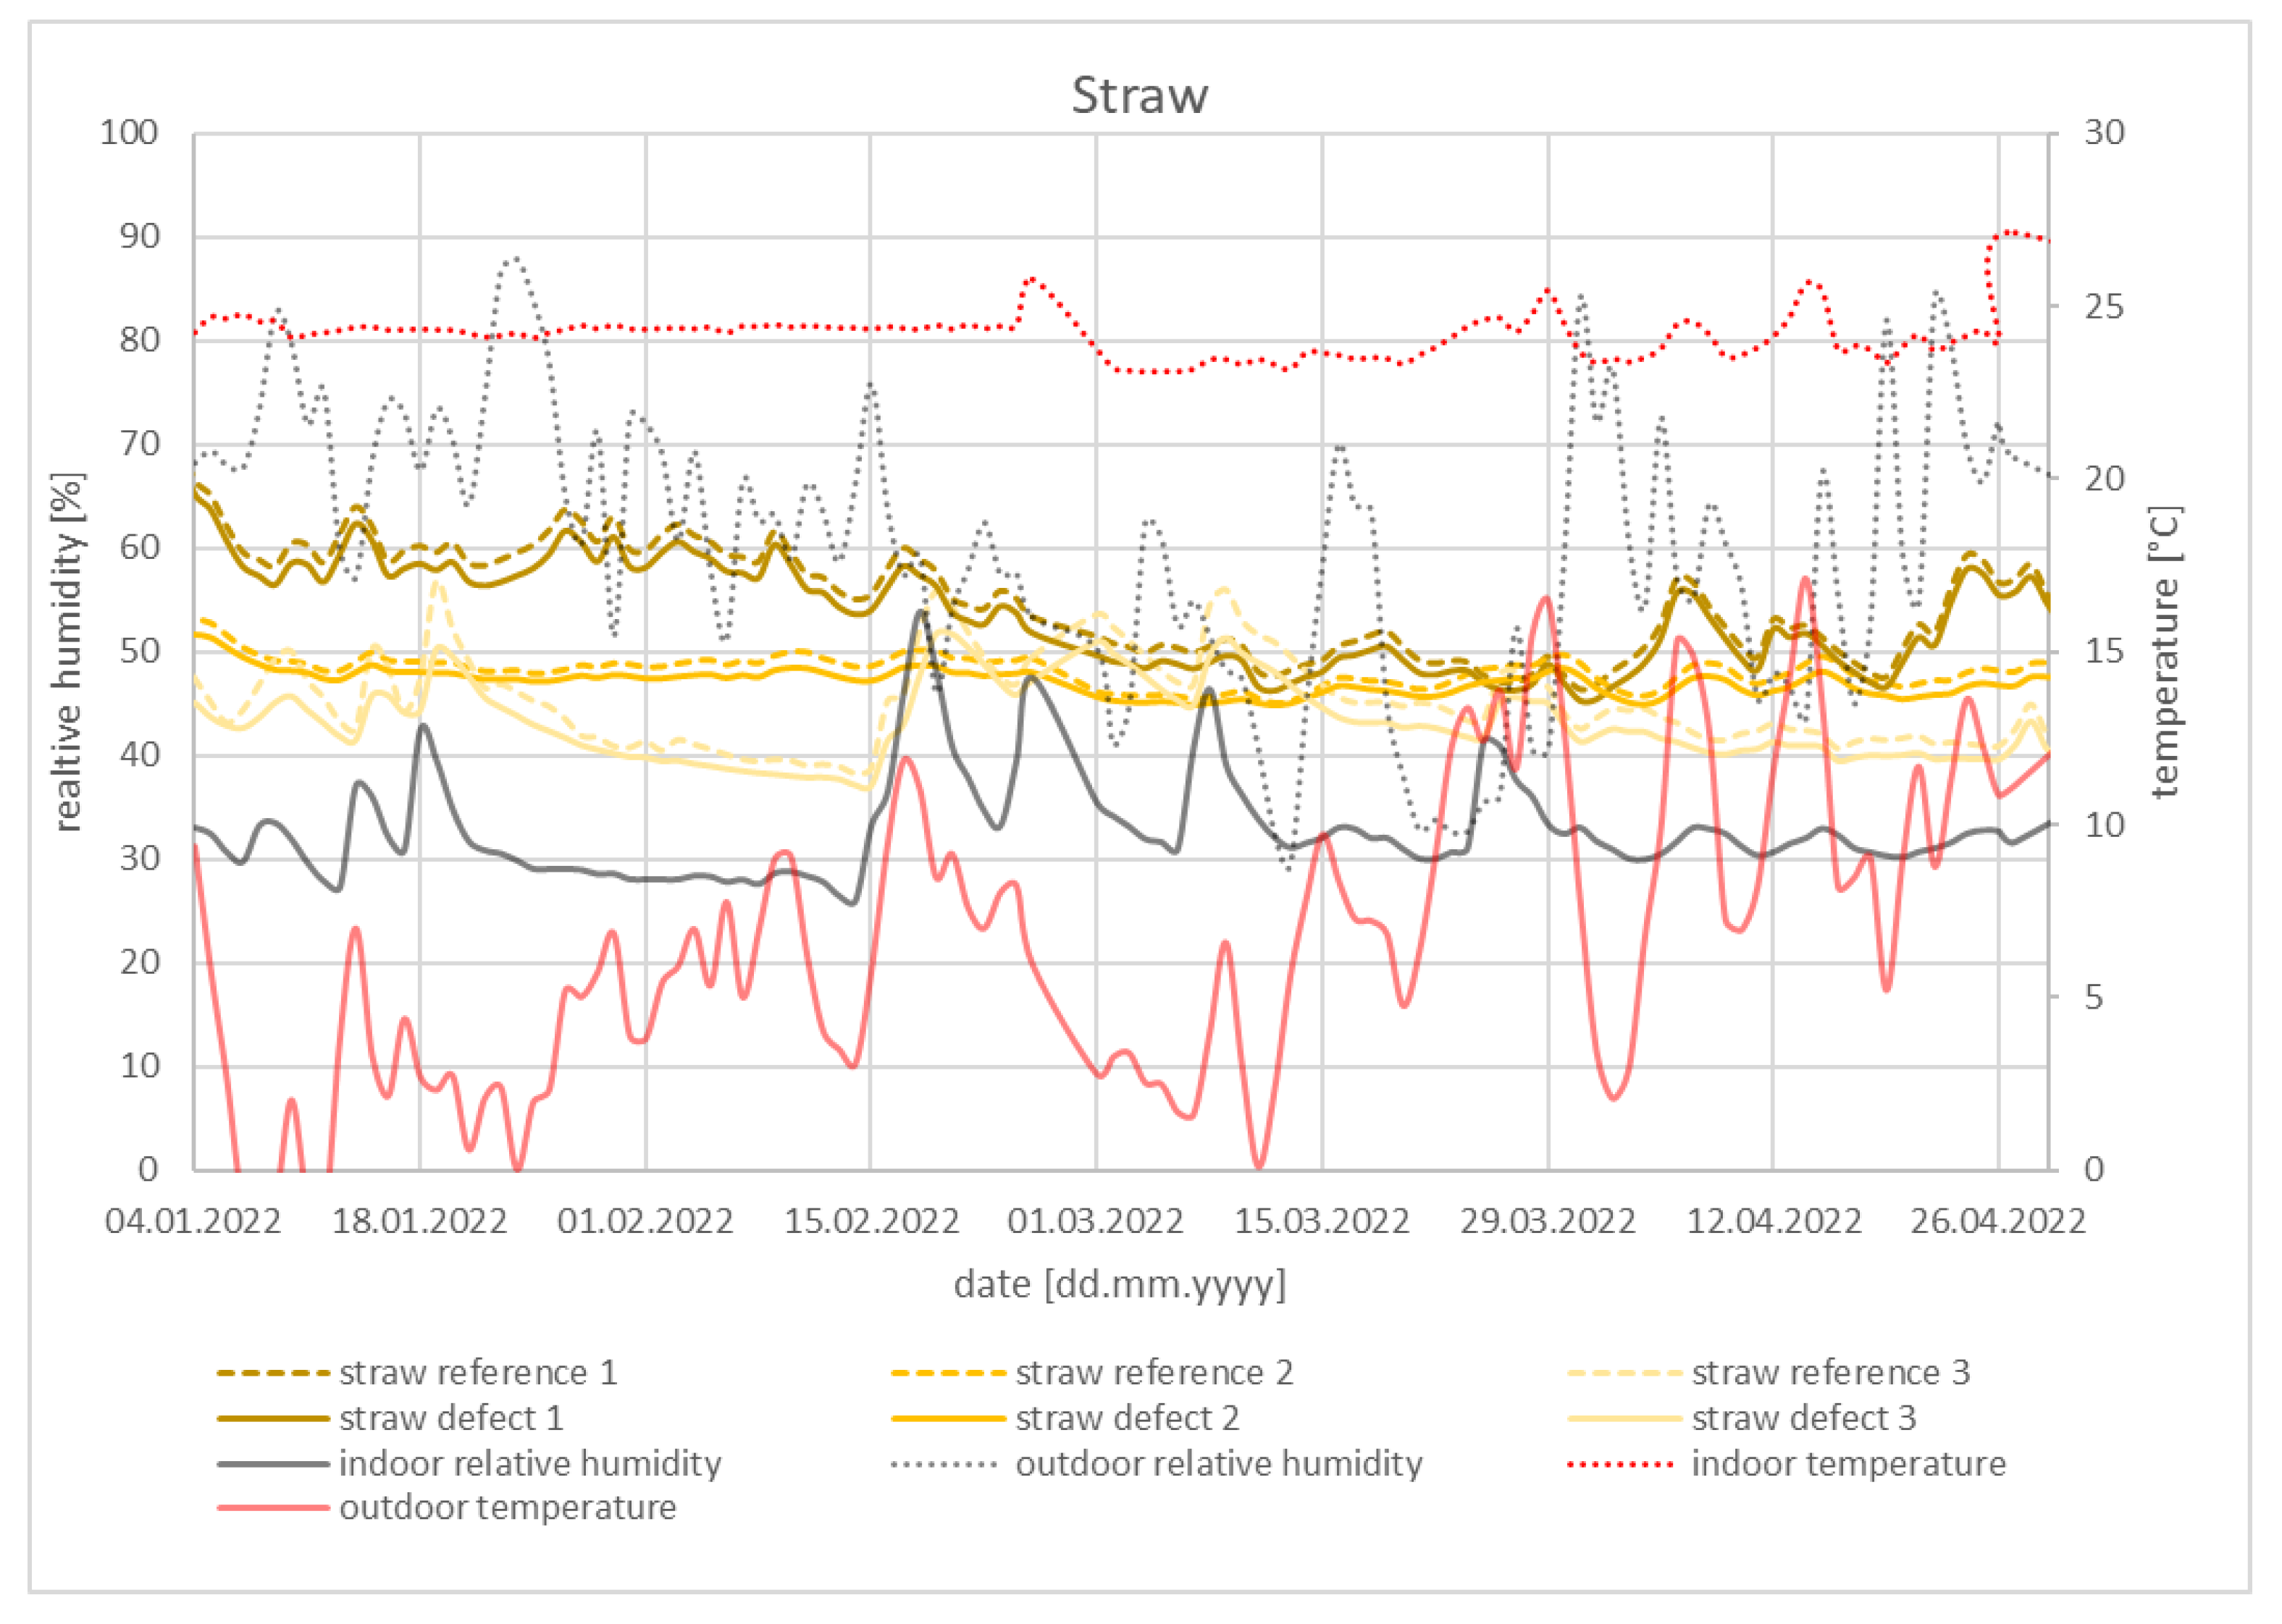
3.1.1. Chopped Straw
Figure 4 shows the relative humidity of the three sensor positions of the straw-insulated module. The values of the defective module and the reference module are almost identical at all three points.
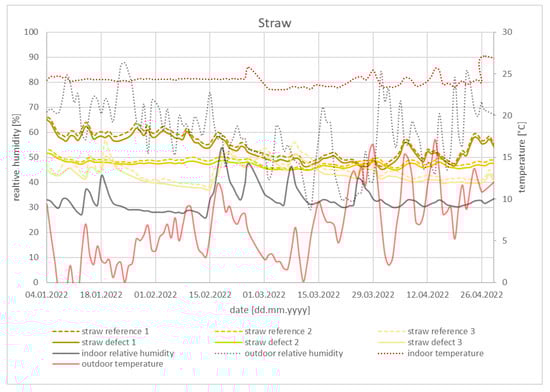
Figure 4.
Straw insulation, one defect, and normal air humidity.
The outer sensor shows a similar trend to the relative air temperature of the outside air, and the inner sensor shows the same trend as the relative humidity of the inside air. The sensor in the middle of the straw insulation is relatively constant at 50% relative humidity.
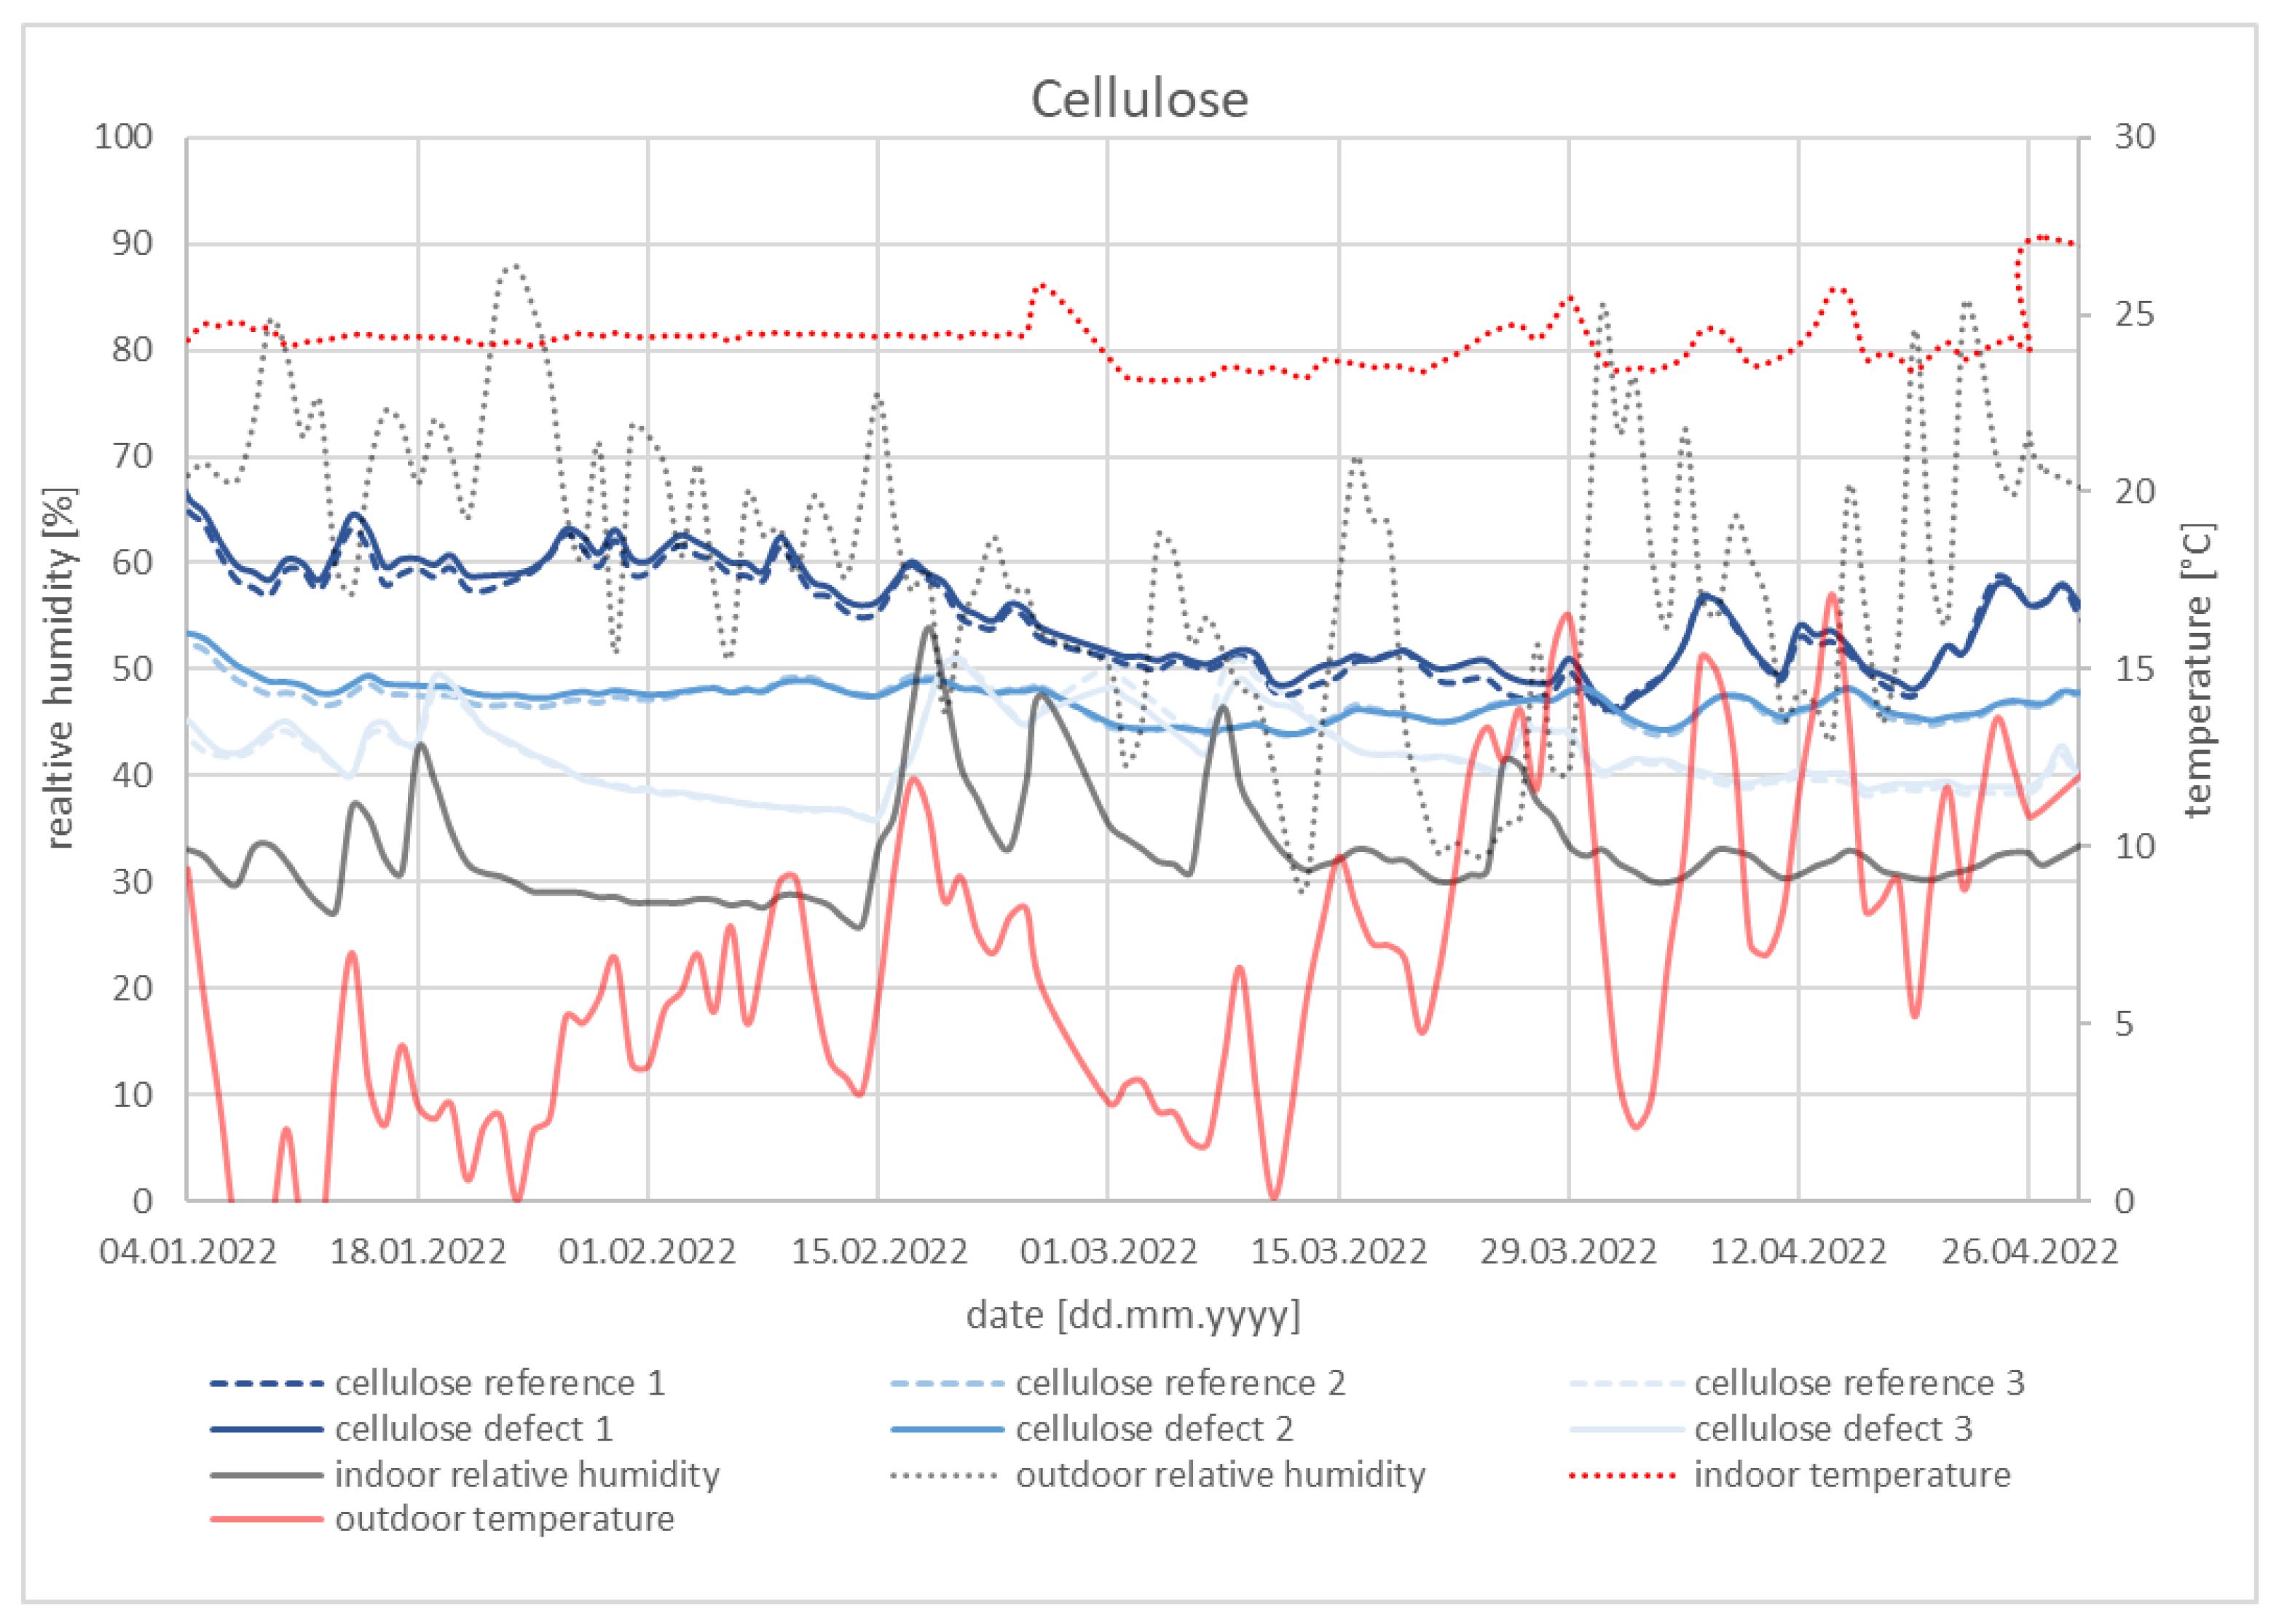
3.1.2. Cellulose
Figure 5 shows the relative humidity of the module with cellulose. Again, the values for the module with and without the defect are almost identical. The relative humidity inside the cellulose insulation is just below 50%. Again, we can see that the outer sensors follow the trend of the relative humidity of the outside air and the inner sensors are close to the relative humidity of the inside air.
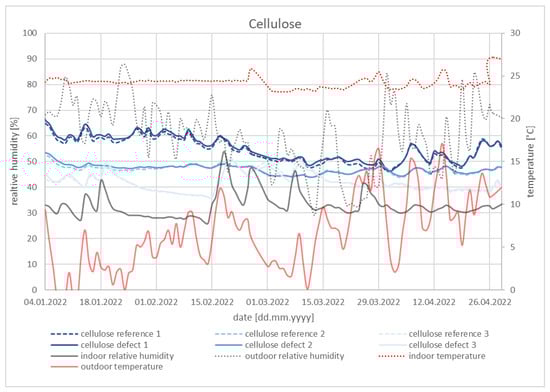
Figure 5.
Cellulose insulation, one defect, and normal air humidity.
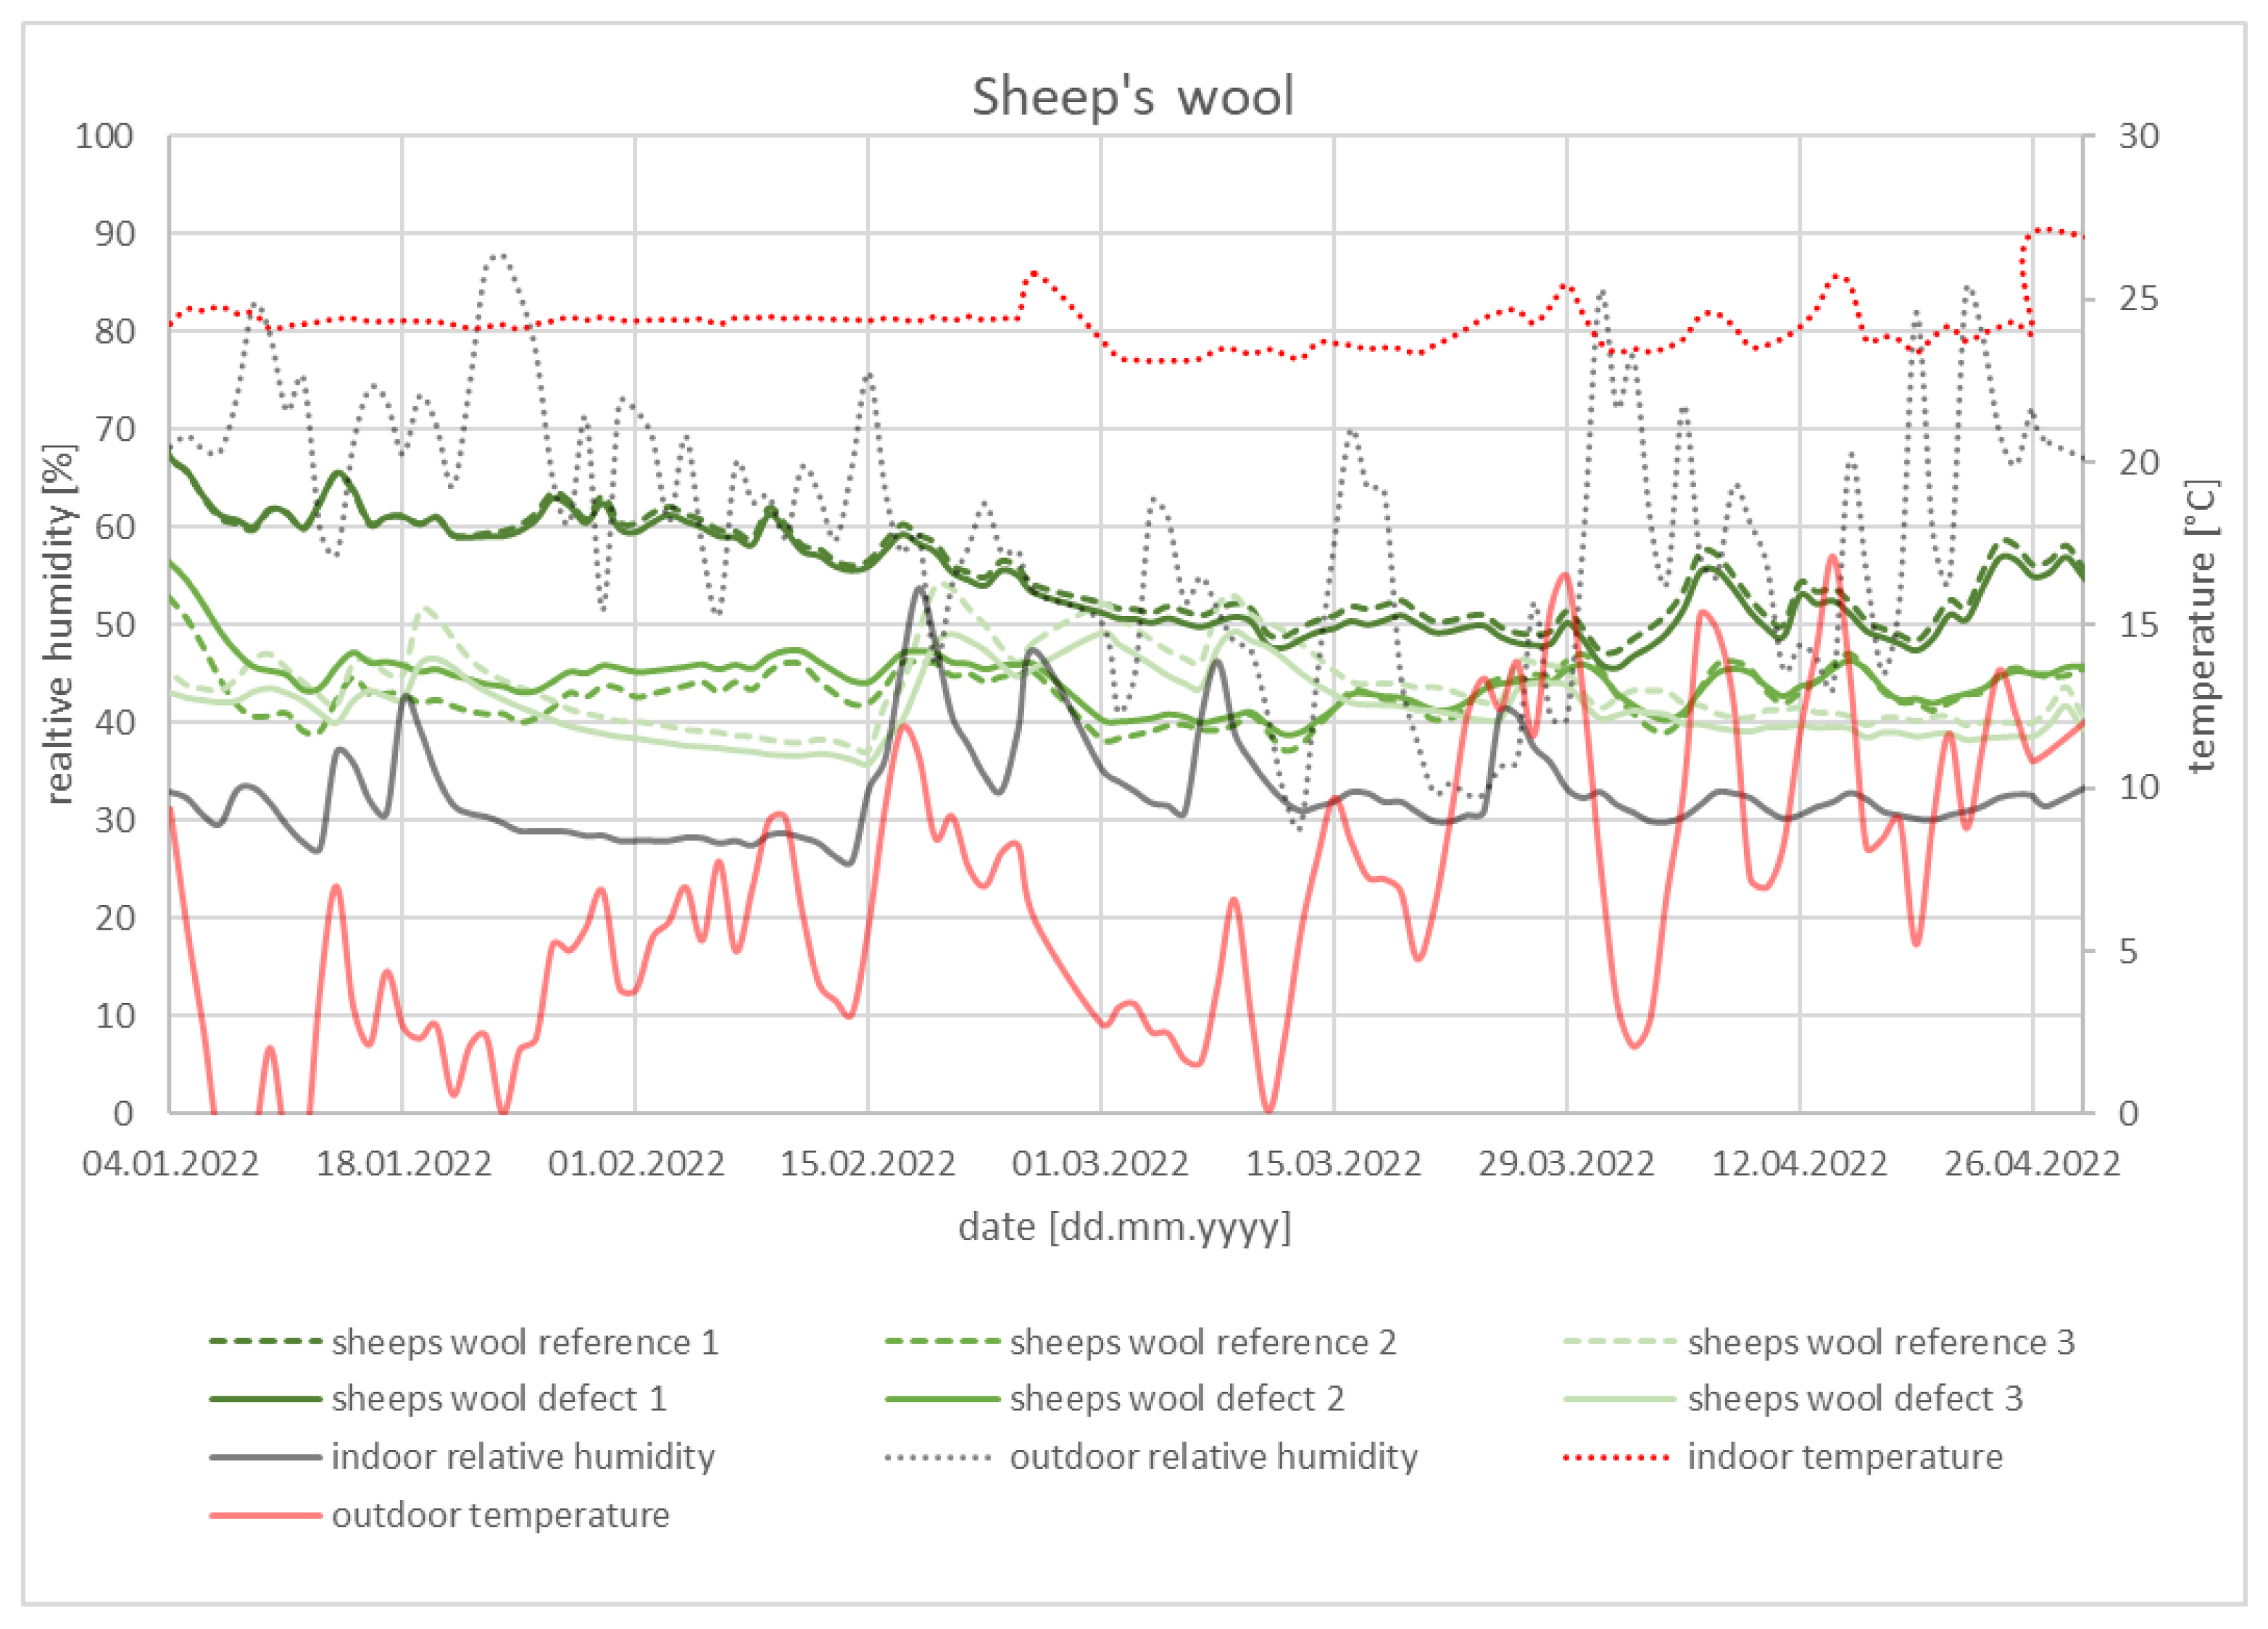
3.1.3. Sheep’s Wool
Sheep’s wool also shows the same tendencies as straw and cellulose insulation, as presented in Figure 6. The relative humidity in the insulation level settles between 40% and 50%; the reference module and the defective module show no noticeable differences.
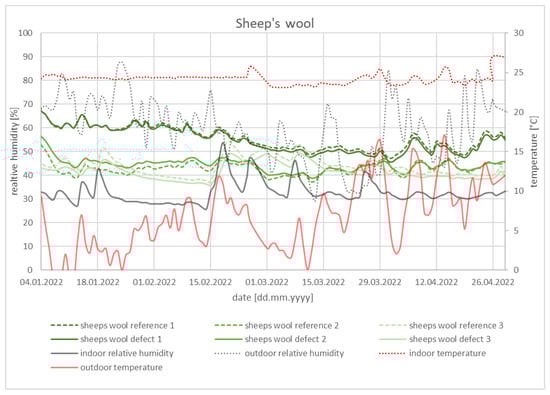
Figure 6.
Sheep’s wool insulation, one defect, and normal air humidity.
3.1.4. Mineral Wool
Figure 7 shows the relative humidities of the module with mineral wool. Here, the differences between the modules with and without a defect are greater than in the previous three insulation materials. However, the relative humidity also settles here at just under 50%.
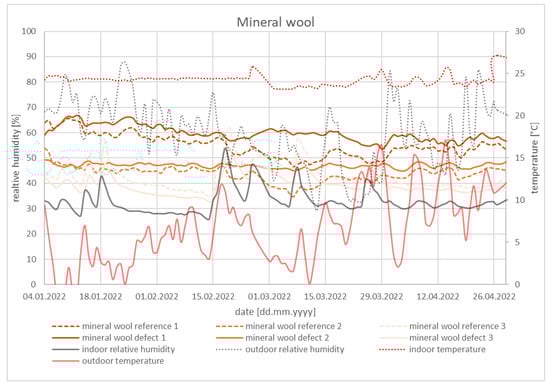
Figure 7.
Mineral wool insulation, one defect, and normal air humidity.
3.1.5. Discussion
In all the constructions studied, the outermost sensor shows the trend of the relative humidity of the outside air and the innermost sensor shows the trend of the humidity of the inside air. The humidity inside the insulation settles at around 40–50% for all four insulations. The maximal differences in the relative humidity between the construction with and without defects are shown in Table 4. The innermost sensor of all constructions shows the highest differences, as it reacts most to the humidity in the interior. The module insulated with the mineral wool showed the greatest difference at all three sensor positions. Air leakage thus has the greatest effect on the construction of mineral wool.
Table 4.
Maximal differences in the relative humidities between the defect and reference modules.
It is assumed that even an optimal substrate is only at risk of mould growth from a relative humidity of 70% [37]. With the exception of mineral wool, all green insulation materials can be considered optimal substrates. However, recent evidence suggests that there is likely to be wide variation in the moisture tolerance of different renewable insulation materials and that some renewable insulation materials are only at risk of mould growth at relative humidities above 85% [38]. The constructions examined here do not have a relative humidity above 70% at any measurement point or at any time during this period. This means that there is no risk of mould growth. In [24], the two different moisture loads, air leakage and rain leakage, were investigated. The results show that rain leakage has a bigger impact on the moisture content of the building materials. In addition, different types of insulation, like exterior or deep cavity insulations, were found to have varying mould risks. Further research could, therefore, be helpful to determine whether the results apply to other insulation types and moisture loads.
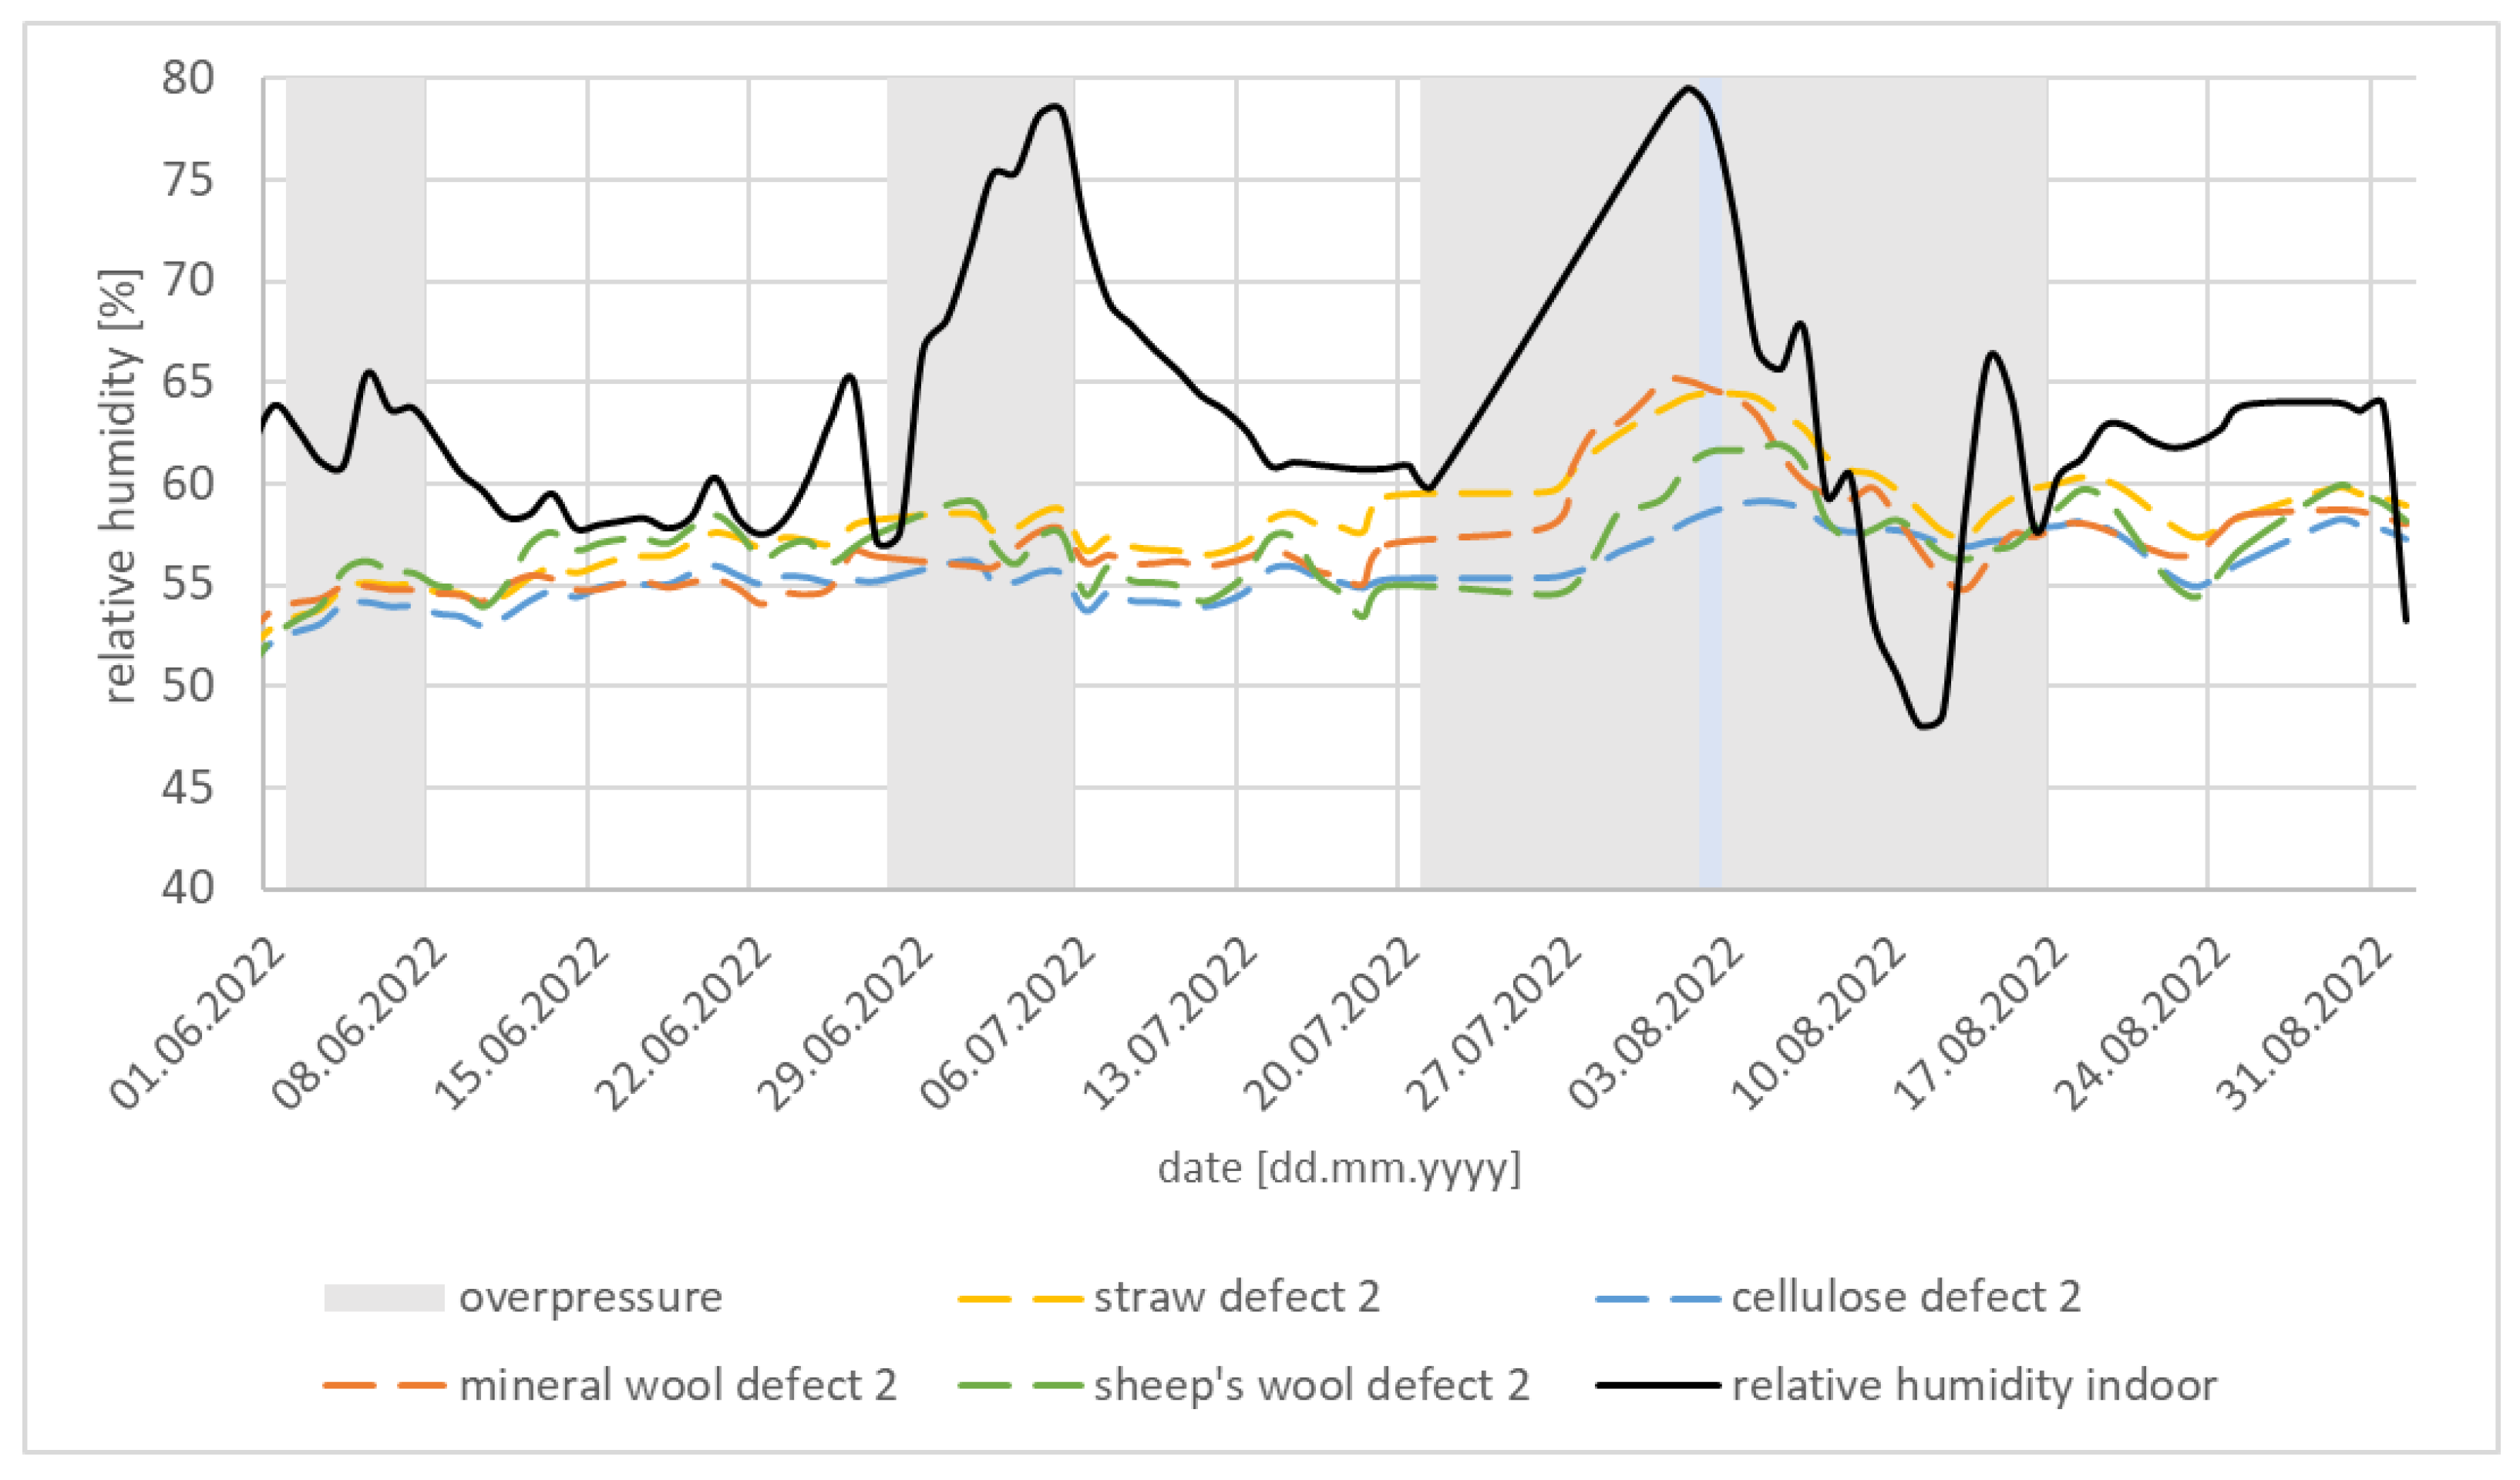
3.2. Two Defects, Increased Air Humidity, and Overpressure
Three overpressure tests were carried out with different durations and intensities, as shown in Table 5.
Table 5.
Date, duration, and intensity of the three examinations with overpressure.
As the first test showed that the outer and the inner sensors follow the humidity in the outdoor and indoor spaces, only the relative humidity inside the insulation level is shown in the following graphs.
All three overpressure tests are shaded in grey in Figure 8. On 2 August 2022, a second hole was drilled through the airtight layer with a diameter of 10 mm. To attract more moisture into the insulation, the relative humidity was increased during the pressure tests. Despite the increased humidity and pressure inside the test rig, no significant increase in humidity was detected in the bio-based insulations. The highest value was achieved by mineral wool at 65.13%. After lowering the humidity, a decrease in the relative humidity inside the insulations was seen. During the longest period of overpressure and high humidity, the straw behind the mineral wool reached the highest humidity. It was assumed by the authors that the moisture content of the insulation and the moisture buffering value (MBV) correlated. The MBV of cellulose was found to be around 3.06 g/m² × %RH [30]. Other studies stated for hemp–straw composite, an MBV higher than 2.20 g/m² × RH [39], and for straw without further specifications, an MBV of around 2 g/m² × %RH [40]. Glass wool had a moisture buffering capacity of 0, although in this study the measurement method and also the unit varied from the other studies [41]. No MBV could be found for sheep’s wool. According to [42], all MBVs above 2 were classified as excellent and, therefore, were in the highest level of MBV classes. It can, therefore, be concluded that the behaviour of mineral wool is due to the fact that the material itself cannot absorb moisture. It remains in the air pockets between the fibres. However, the MBV can vary greatly between the individual products, which is why the values observed can, at best, be regarded as approximate values.
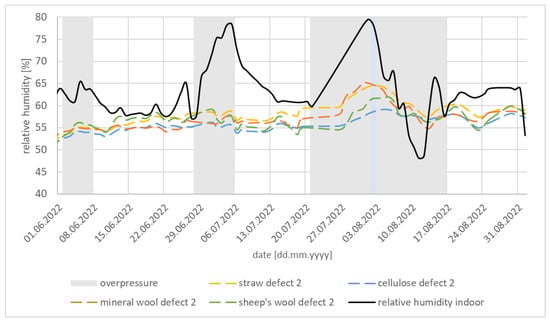
Figure 8.
Relative humidity inside the insulation during different overpressure tests.
3.3. Removal of the Installation Level and Increased Air Humidity
In November 2022, the installation layer of sheep’s wool was removed from all constructions to investigate the difference in buffering by the insulation within this layer. The hypothesis was that sheep’s wool absorbs moisture and thus protects it from possible penetration into the insulation layer. To simulate a moisture load, the relative humidity was increased to over 90% after the removal of the sheep’s wool.
In order to be able to compare the values before and after the removal of the installation level, two periods with approximately the same conditions were compared. Table 6 shows the differences between the modules with and without defects on 11–13 November 2022, and Table 7 shows the differences between the modules with and without defects on 15–17 December 2022. The average indoor temperature at the first time period was 19.38 °C with 60.21% relative humidity (absolute humidity 10.03 g/m³), and at the second time period, 19.82 °C at 53.46% relative humidity (absolute humidity 9.14 g/m³).
Table 6.
Differences of the relative humidity between the module with and without defect before the removal of the installation layer (11–13 November 2022).
Table 7.
Differences in the relative humidity between the module with and without defects after the removal of the installation layer (15–17 December 2022).
All reference modules have lower relative humidity within the insulation level after removal of the installation level. This indicates that moisture can be released from the insulation. A scattering between the relative humidities in the constructions of the reference and the defective modules can be observed on the values after the removal of the installation level. The differences between the humidity of the defect and the reference become greater, except for the cellulose insulation. The insulation with the highest difference in the relative humidity between the module with and without defect after the removal of the installation layer is mineral wool. After mineral wool, straw and sheep’s wool follow. The fault tolerance of the insulation can, therefore, definitely be increased by adding an installation layer with sheep’s wool.
3.4. Two Defects, Very High Humidity (Up to 100%), and No Installation Level
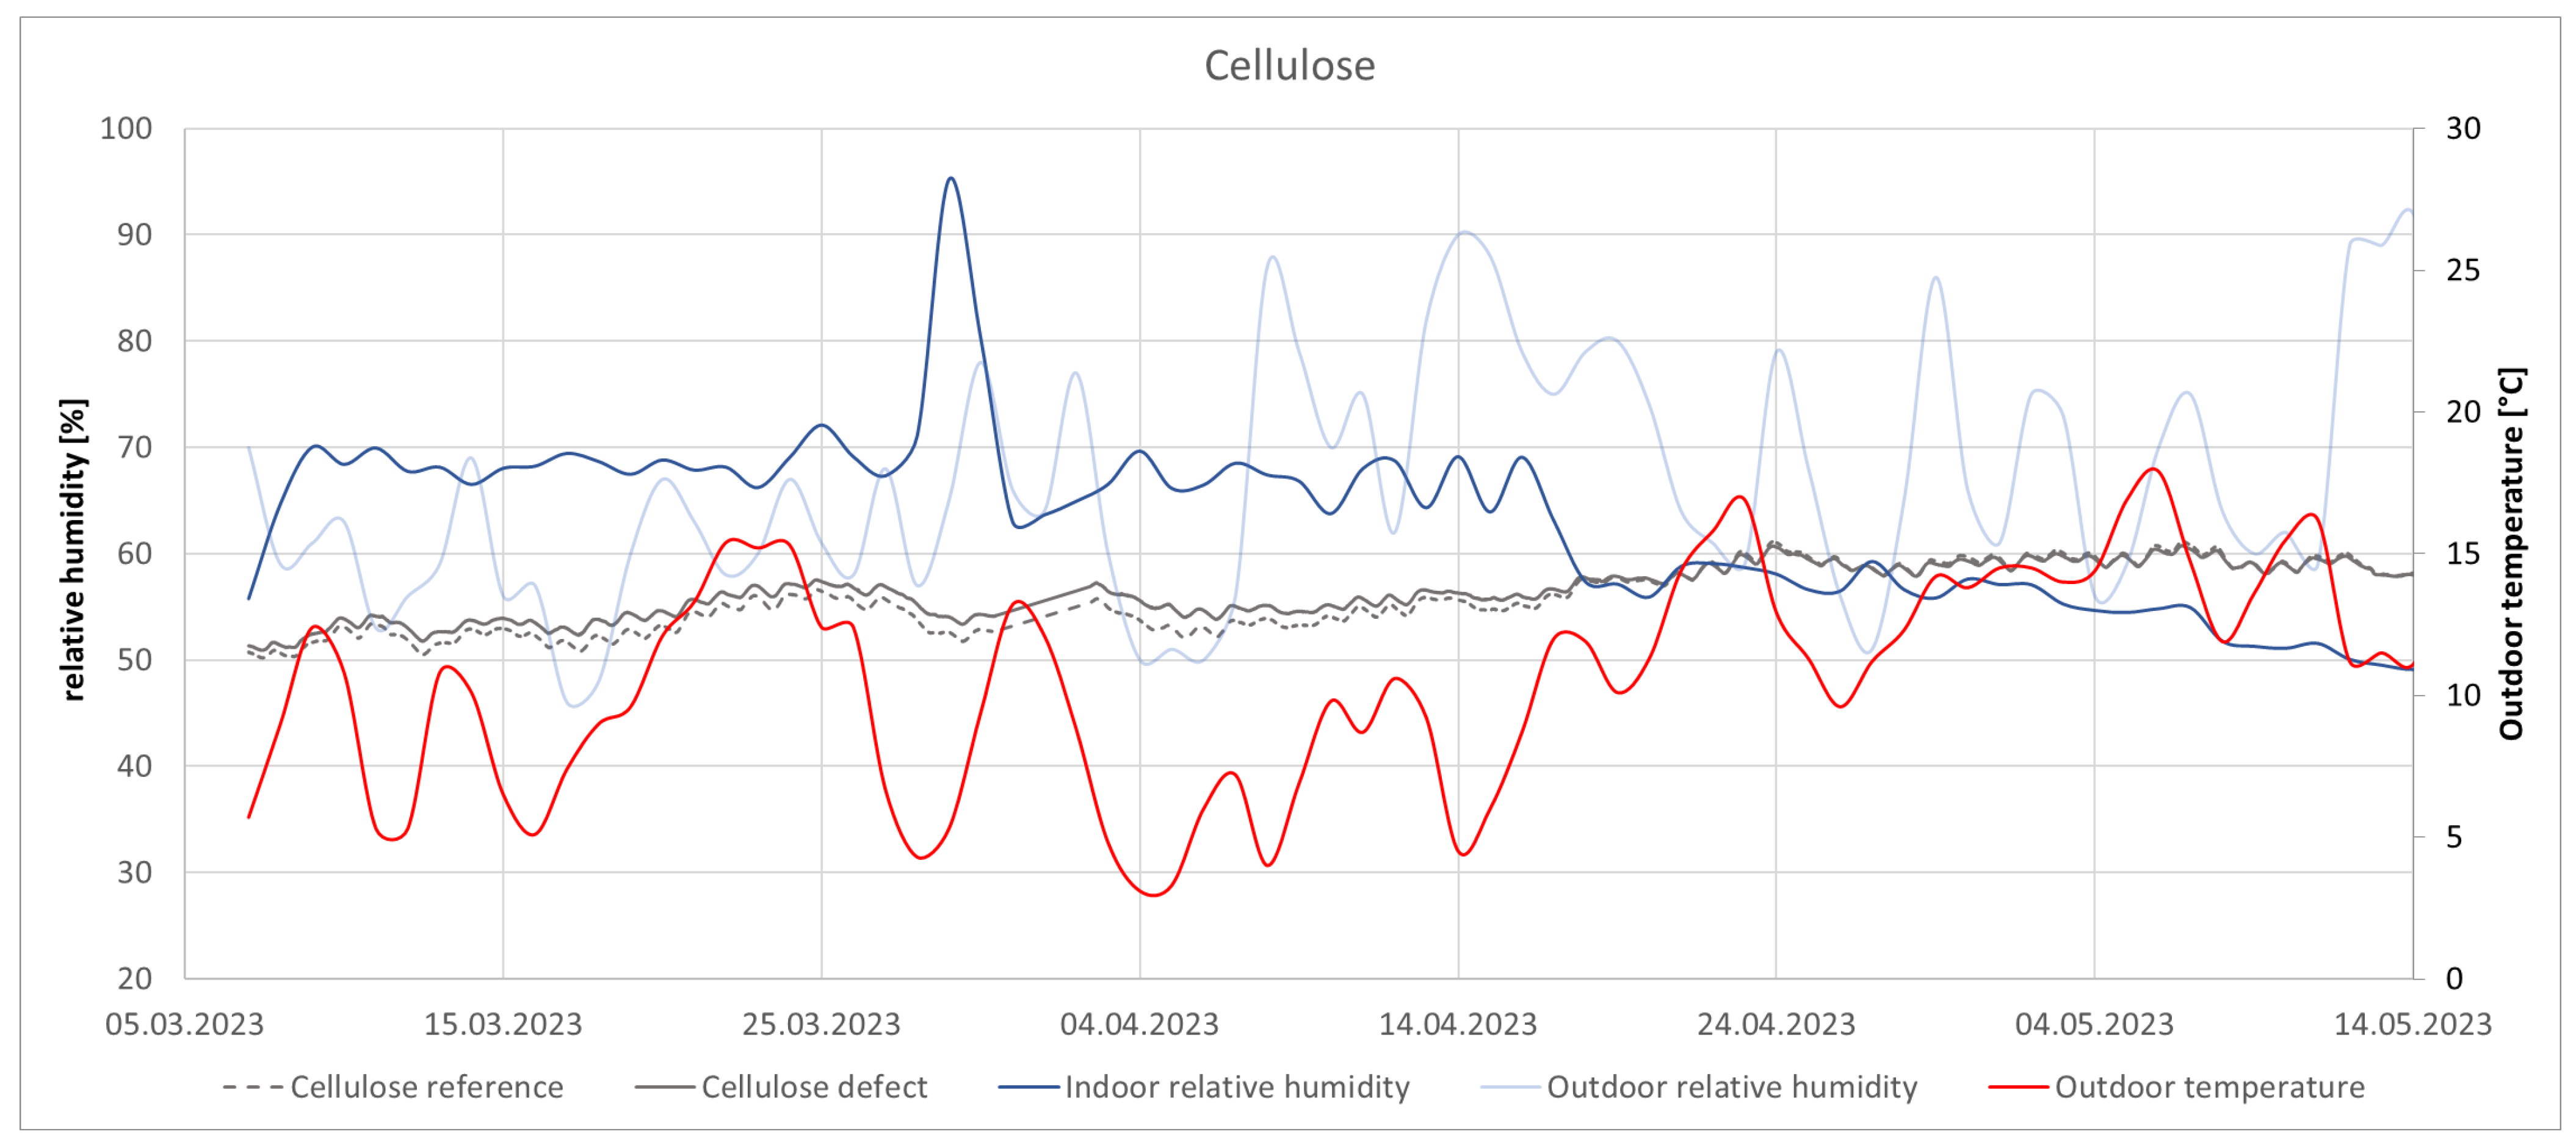
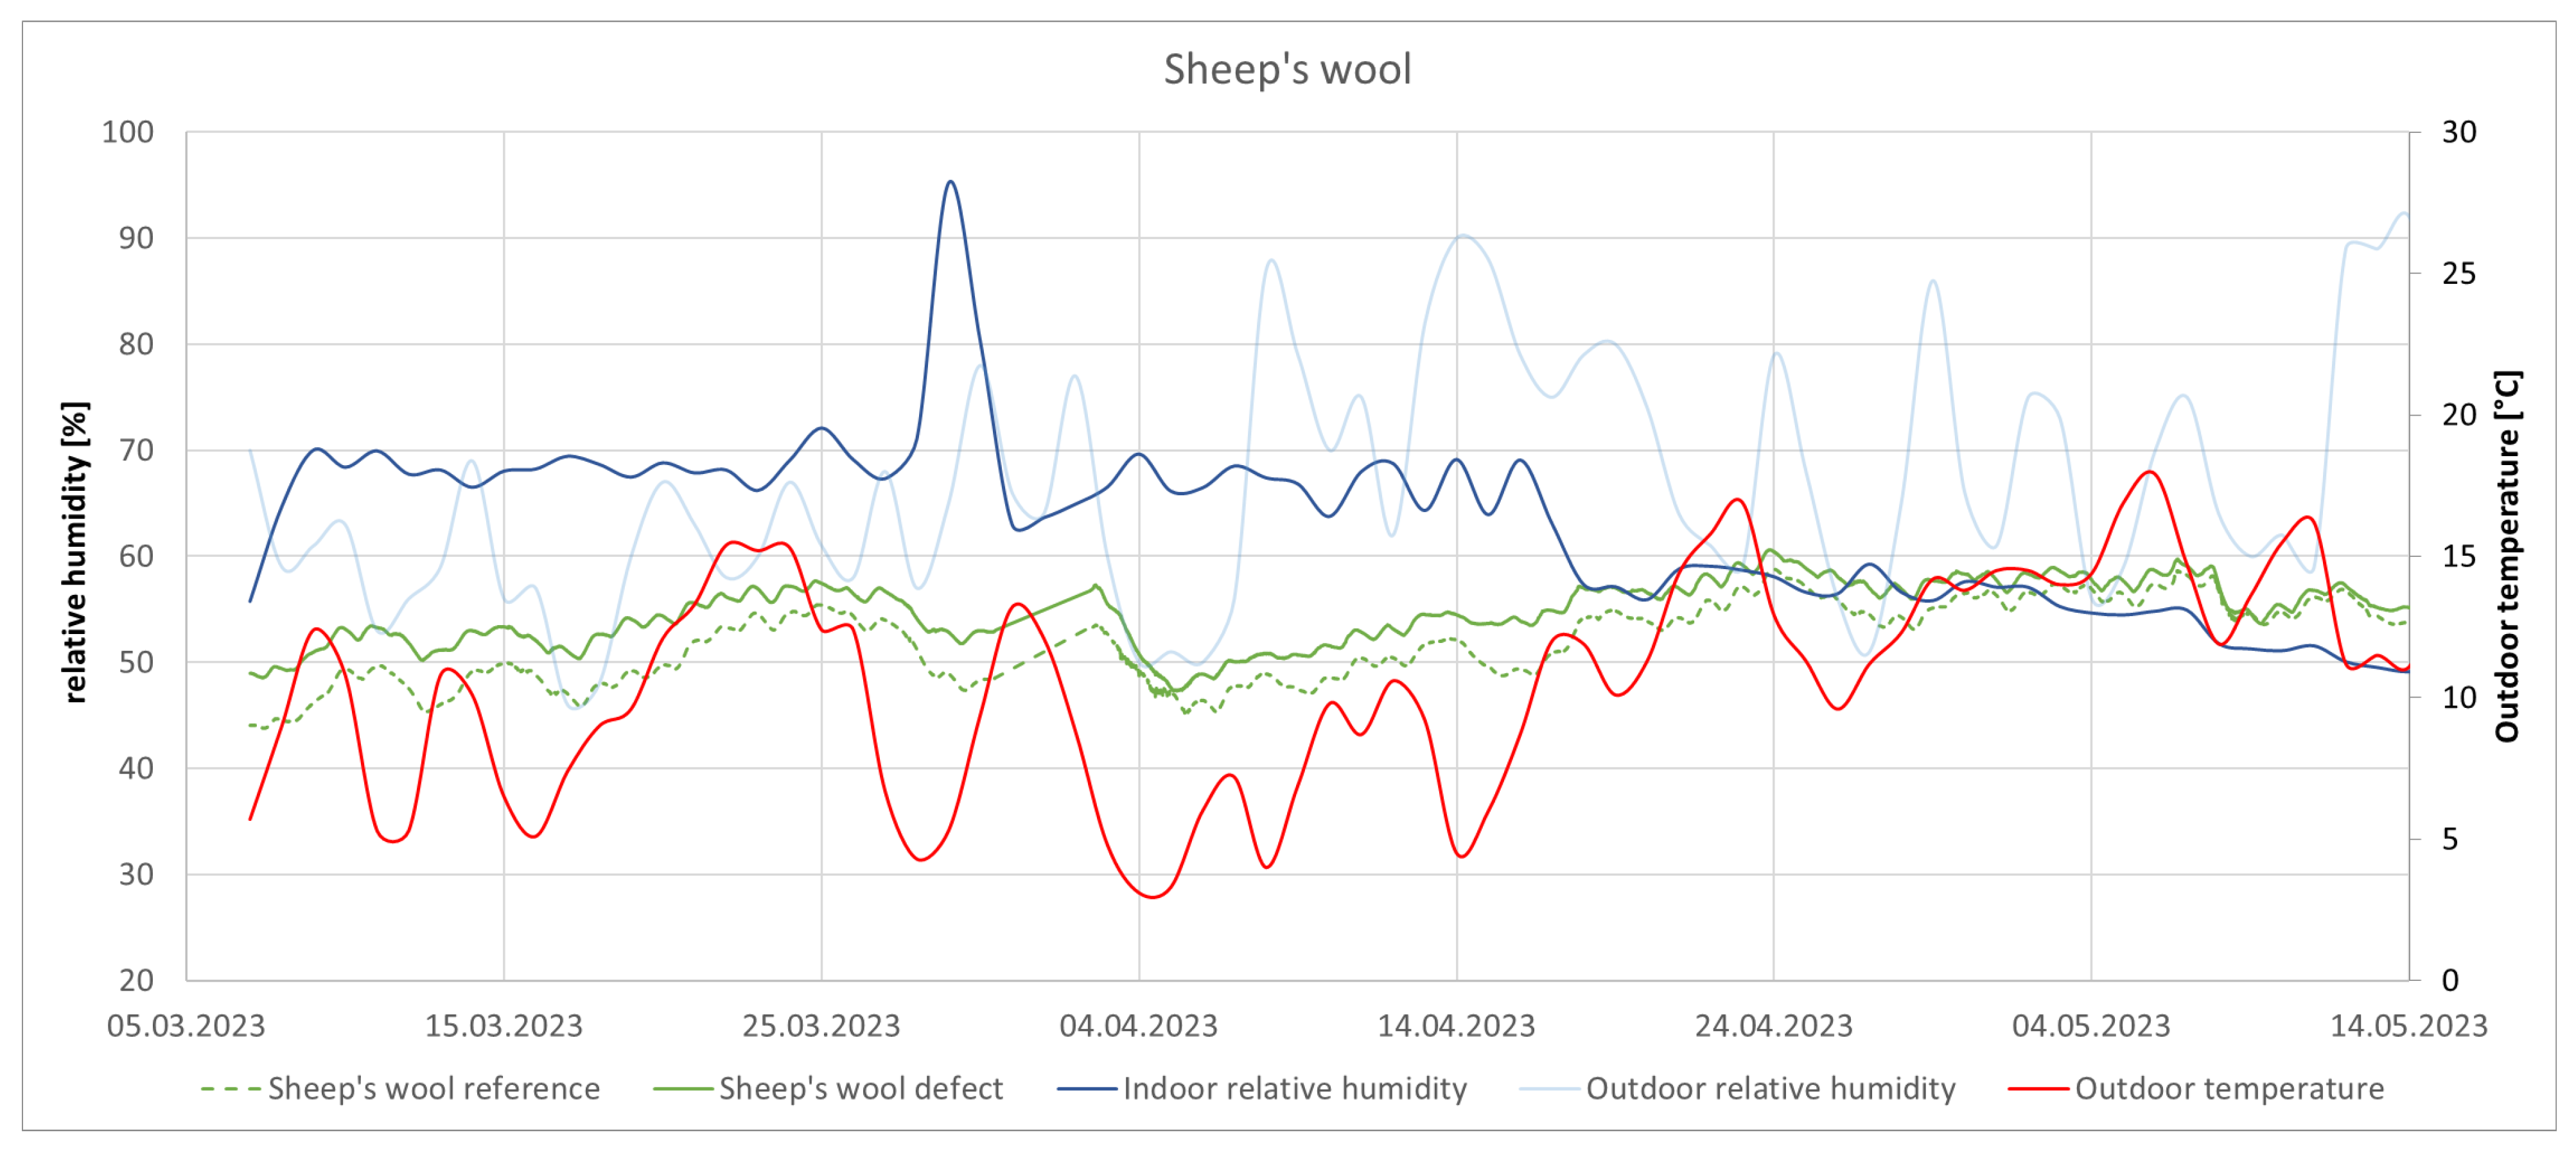
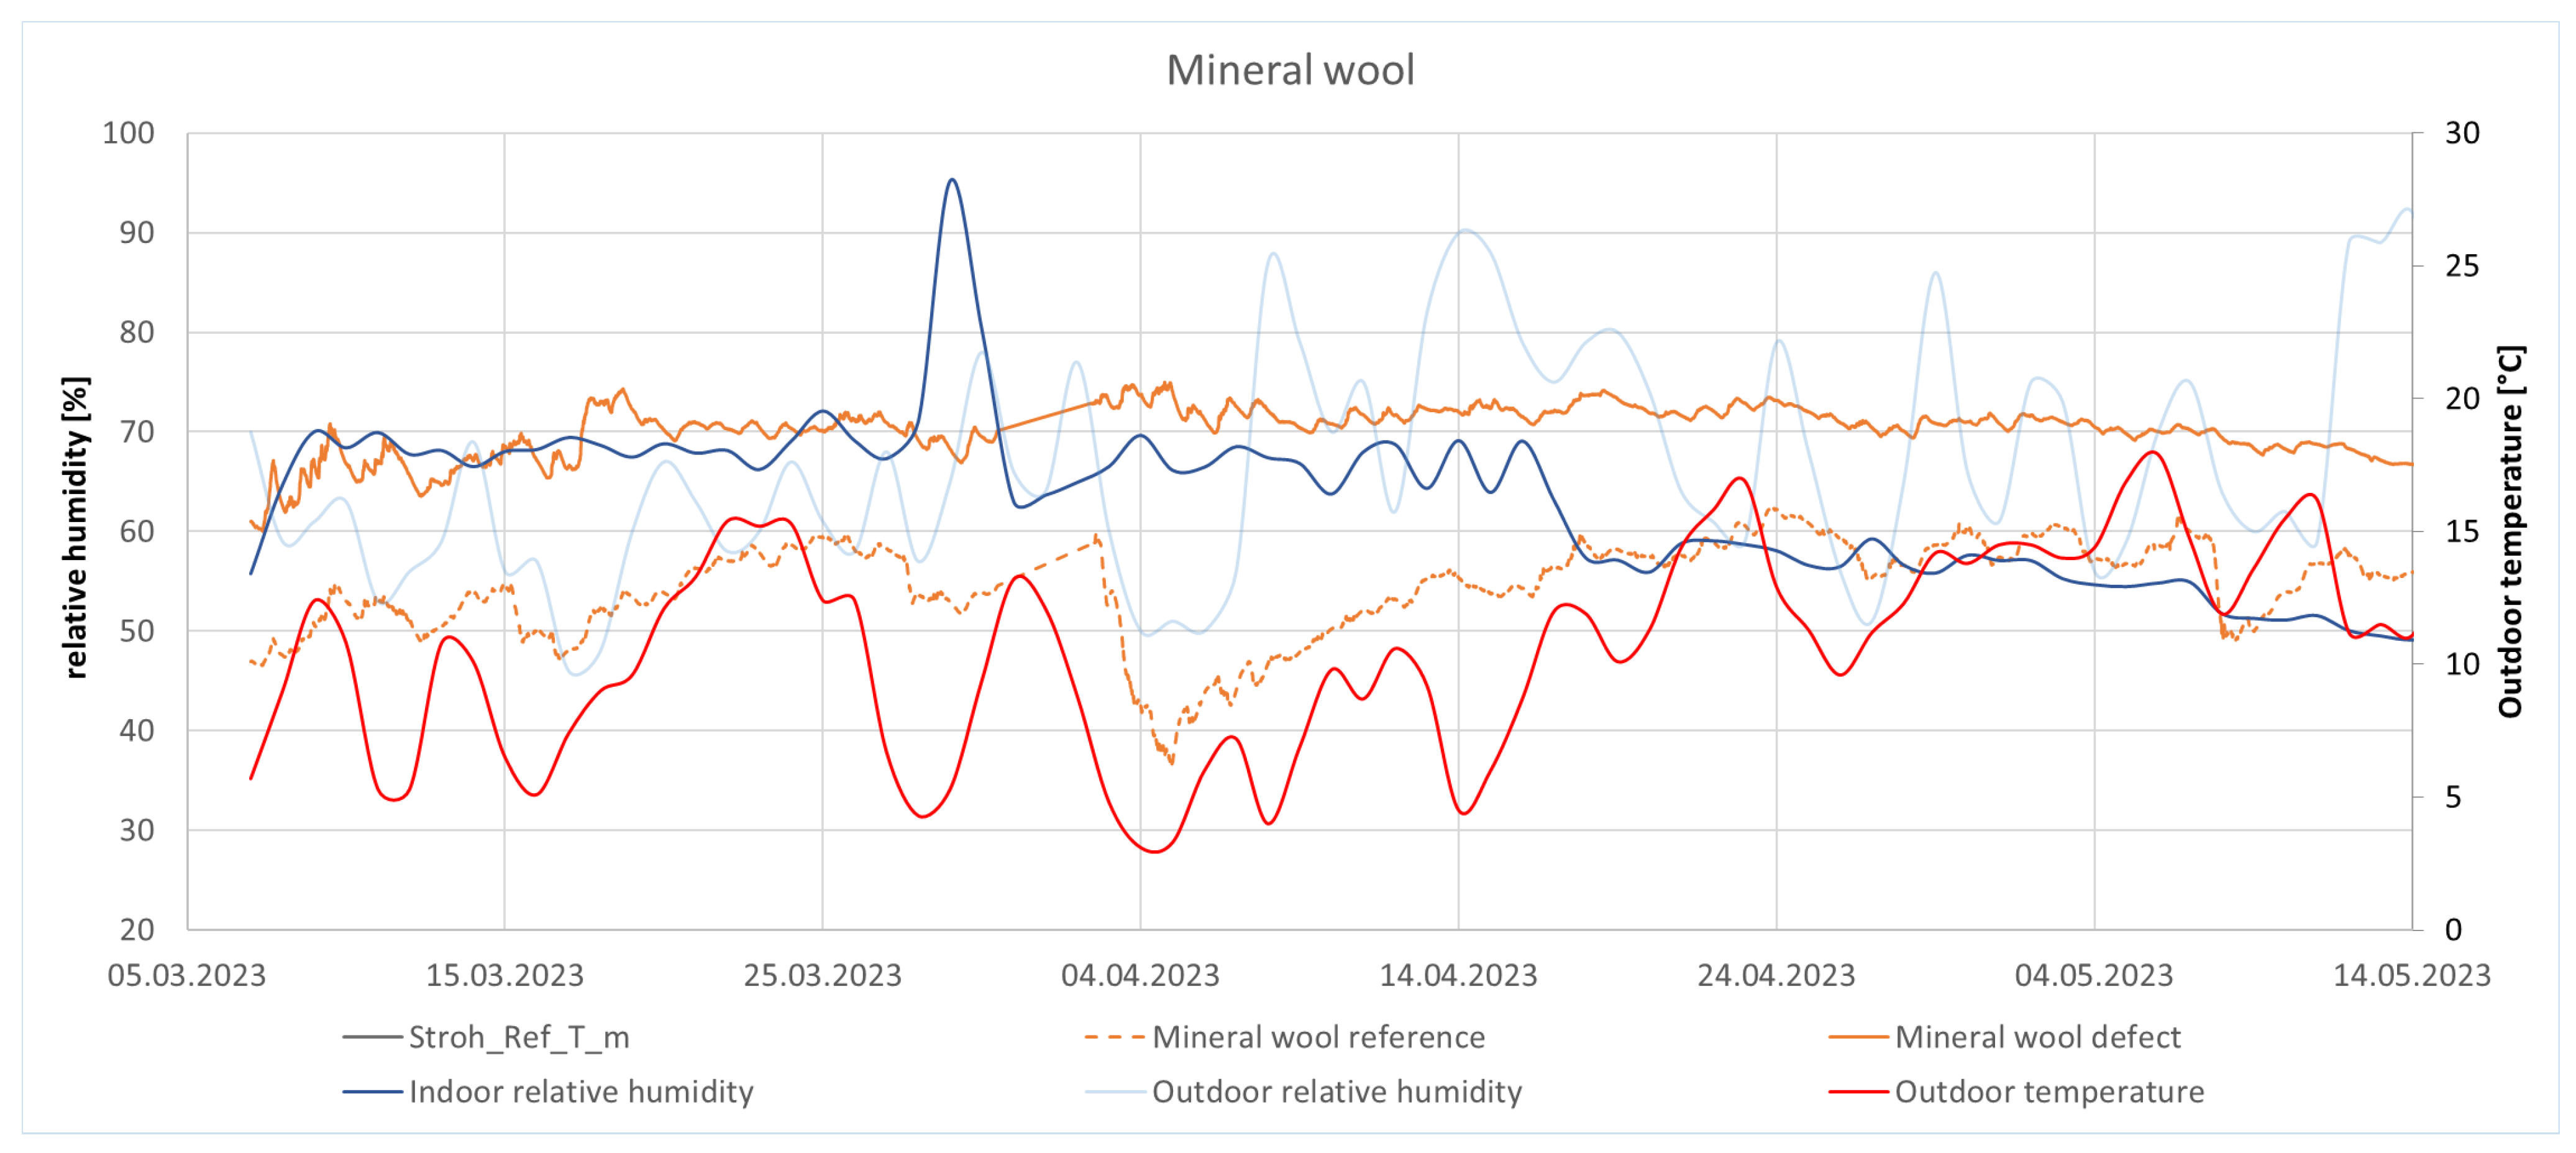
The following diagrams show the relative humidity inside the insulation between 5 March 2023 and 14 May 2023, where a short period of very high indoor humidity occurs.
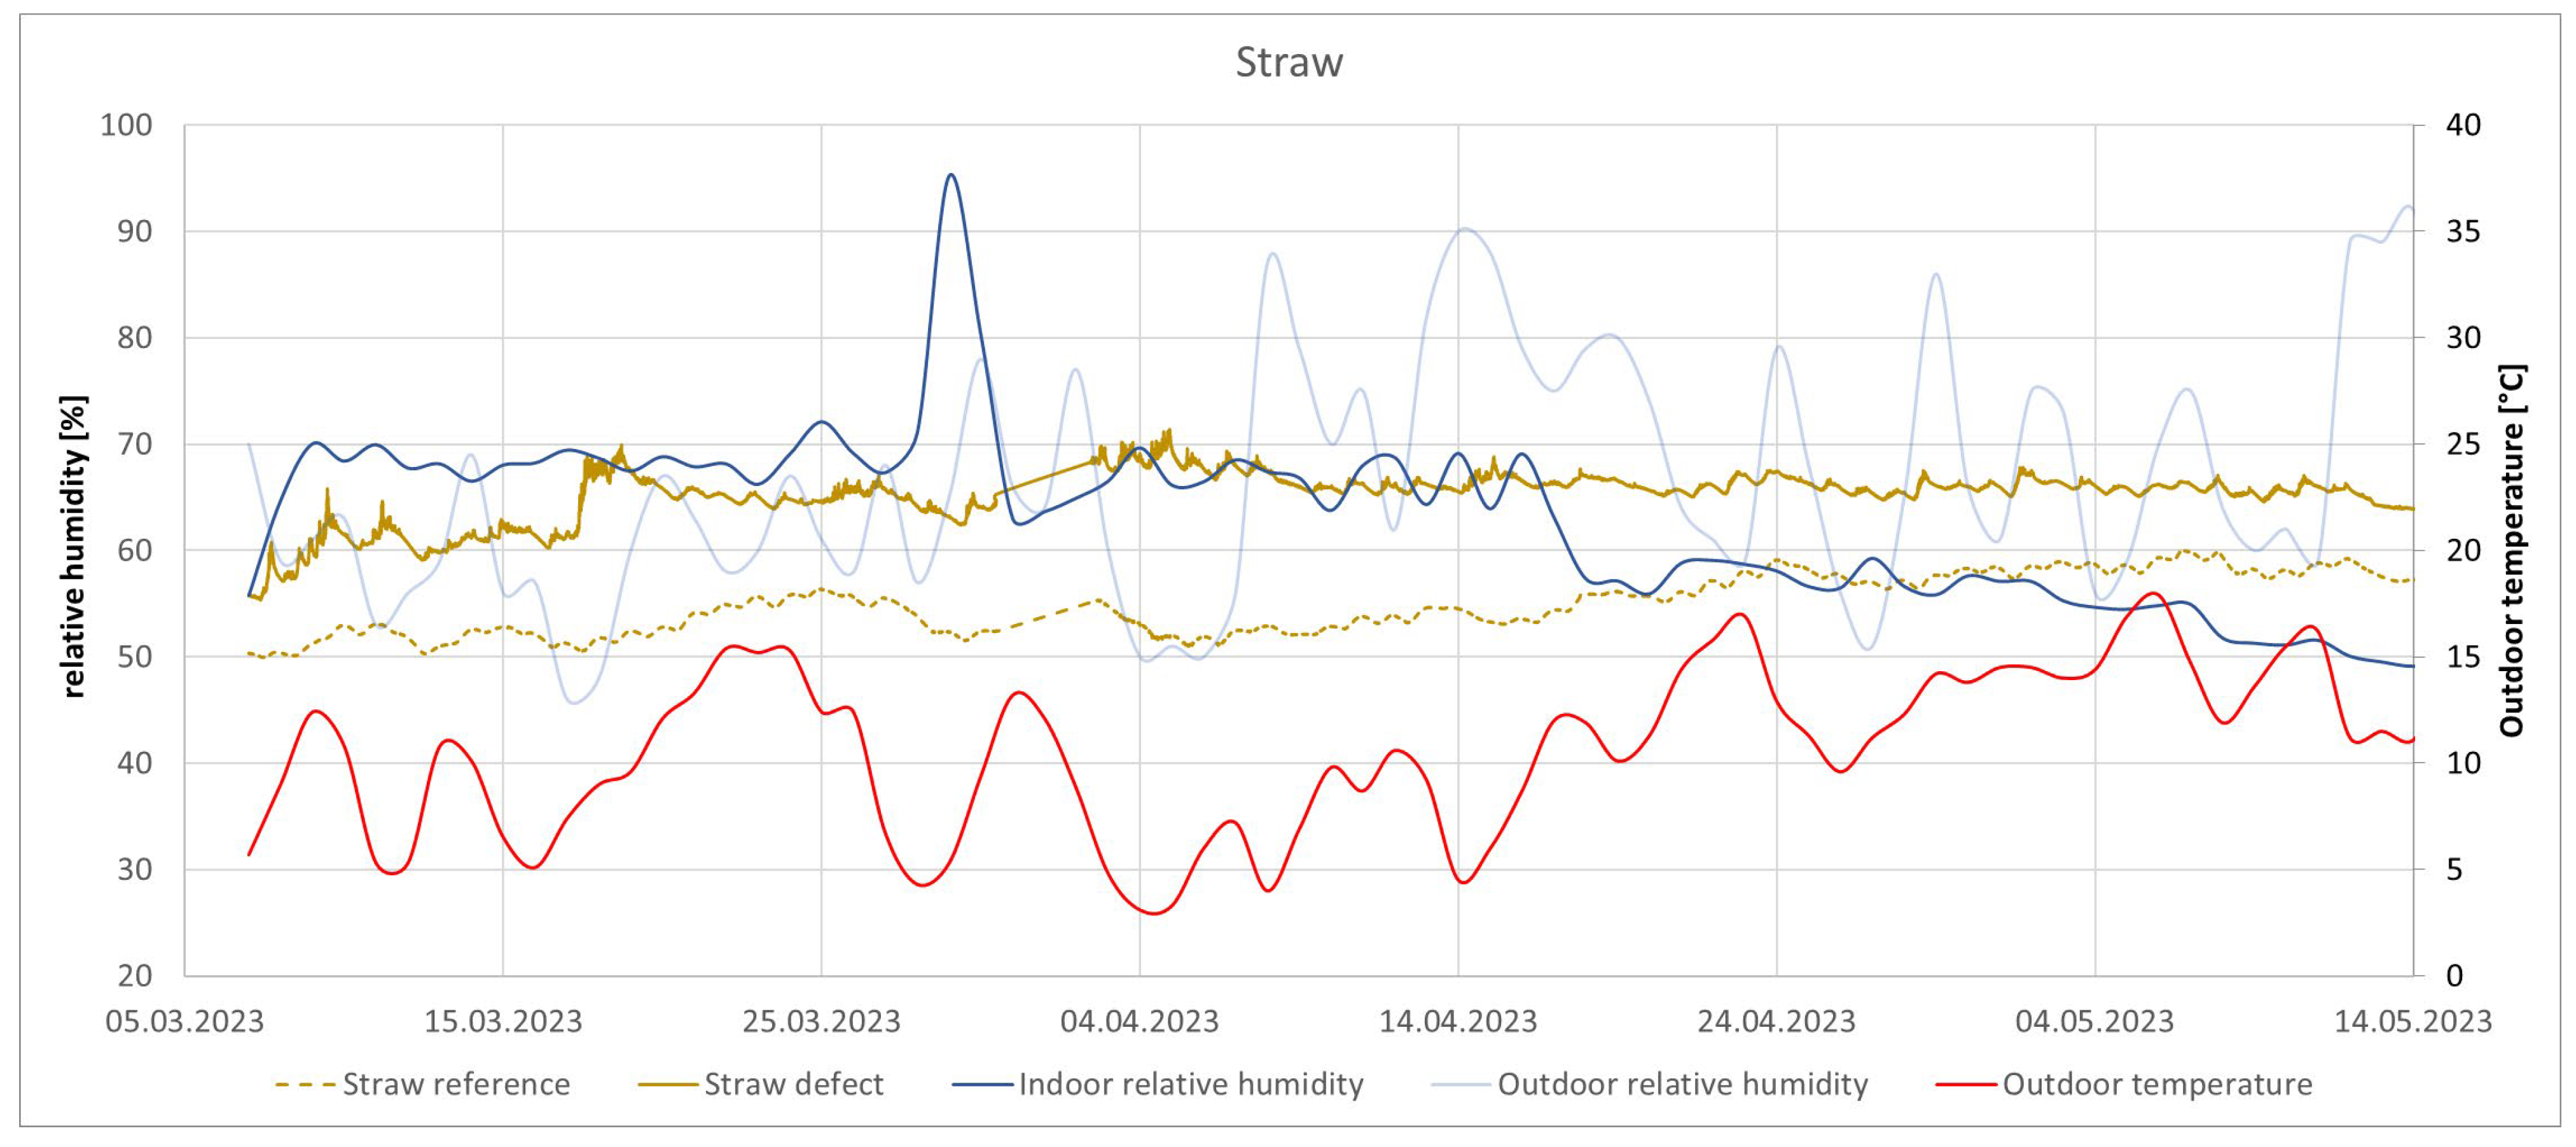
3.4.1. Straw Insulation
As seen in Figure 9, the relative humidity inside the straw insulation reaches 70% only once for a short time, a few days after the test rig has been conditioned with just under 100% relative humidity. The rest of the time, the relative humidity inside the insulations in both modules is permanently below 70%. The reference module, shown in the dotted line, differs from the module with a defect by an average of 9% relative humidity.
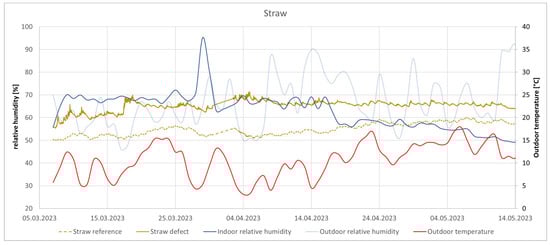
Figure 9.
Relative humidity of the straw insulation during very high humidity without an installation level.
3.4.2. Cellulose Insulation
The relative humidity inside the cellulose insulation is shown in Figure 10 and remains permanently below 65%. The defective module differs by an average of 0.33% relative humidity. Thus, there is no noticeable difference between the two modules.
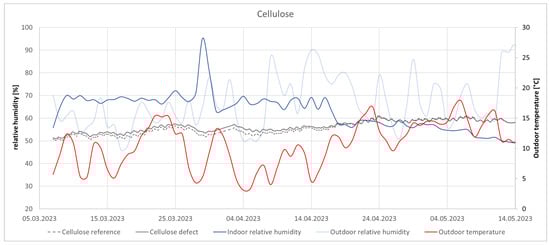
Figure 10.
Relative humidity of the cellulose insulation during very high humidity without an installation level.
3.4.3. Sheep’s Wool Insulation
As shown in Figure 11, the sensor in the sheep’s wool insulation also permanently indicates less than 60% relative humidity despite high humidity in the interior. The difference between the two modules is 2.2% relative humidity on average.
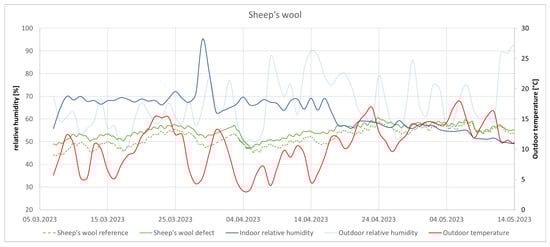
Figure 11.
Relative humidity of the sheep’s wool insulation during very high humidity without an installation level.
3.4.4. Mineral Wool Insulation
With the mineral wool insulation, as presented in Figure 12, the relative humidity is highest and is above 70% for a longer period of time. The difference between the module with a defect and the reference module is also the highest, with an average of 32%.
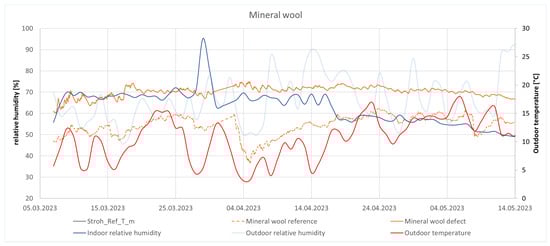
Figure 12.
Relative humidity of the mineral wool insulation during very high humidity without an installation level.
3.4.5. Discussion
Table 8 shows that the mean value of the reference module is approximately the same for all insulation materials. In the modules with defects, it can be seen that mineral wool reaches the highest relative humidity. The mean value of the difference between the respective reference and defect modules is 32.2% for mineral wool, which is many times higher than for the three bio-based insulation materials. Cellulose and sheep’s wool have the smallest difference between the modules.
Table 8.
Maxima, minima, and average of the relative humidities inside the insulations during very high air humidity and without an installation level.
In summary, bio-based insulations are many times more fault-tolerant, as they can absorb moisture and thus do not pass it on to the timber structures, or only to a limited extent. The defect has the greatest effect on the construction insulated with mineral wool. Straw and cellulose follow; with sheep’s wool, the imperfection has the least effect on the measured relative humidity within the insulation material.
3.5. Evaluation of the U-Values
Table 9 shows the measured and evaluated U-values of the four constructions and their deviation from the calculated value. The calculated value was created using Archiphysik software, version number 18.0.
Table 9.
Measured and calculated U-values of the four constructions.
A negative sign represents a better value than expected, and a positive sign represents a worse result than expected. Straw and cellulose each performed better than expected by 7.4% and 10.7%, respectively. The error tolerance is 5%, so the values for mineral wool are definitely still within the measurement accuracy, and those for sheep’s wool are only very slightly above it.
It is possible that the differences between measured and calculated U-values are due to the moisture allowance for natural fibre insulation materials, so further research into this is particularly important.
4. Conclusions
4.1. Difference in Fault Tolerance between Sheep’s Wool, Straw, and Cellulose
It can be clearly deduced from the results that ecological insulation materials have an advantage in fault tolerance compared to mineral wool in connection with timber frame constructions. This fact has been known for some time [11]. However, a difference can be seen between the insulating materials investigated. The relative humidity within the sheep’s wool and cellulose was lower in all investigations than in the constructions with chopped straw or mineral wool. Sheep’s wool and cellulose both seem to be particularly fault-tolerant building materials, as the influence of the defect shows little influence. In addition, both materials have a low risk of mould.
4.2. Influence of High Indoor Humidity on Bio-Based Insulation Materials
Despite defects in the airtight layer and high moisture loads in the indoor air, none of the tests with bio-based insulation materials measured humidity levels that posed a risk of mould growth. This shows that bio-based insulation materials and their moisture behaviour are often underestimated.
Provided that the building is designed correctly from a building physics point of view, the risk of minor construction errors with bio-based insulation materials can be assumed to be lower than with mineral wool insulation materials. Although the air leaks led to increased humidity in the construction, the holes, which are comparable to minor construction errors, did not have a detrimental effect on the bio-based insulation.
4.3. Influence of the Installation Level Made of Sheep’s Wool
The research has shown that a thin layer of sheep’s wool in front of the airtight layer can also increase the fault tolerance of the construction. This opens up the possibility of using insulation that is more sensitive from a hygric point of view while at the same time achieving a construction with higher fault tolerance through the use of an installation level with a moisture-buffering material like sheep’s wool.
4.4. Deviation of the Measured U-Value from the Expected U-Value
For the U-values of sheep’s wool and mineral wool, the measured result was within the measurement uncertainty of the measuring instruments. For straw and cellulose, the measured U-value is better than the calculated one, which may be due to the higher addition of moisture to the thermal conductivity. This conclusion was also reached by the results of the study [36], which coincidentally took place at the same time as the natuREbuilt research project. Therefore, it is imperative that research is carried out to determine for which natural fibre insulation materials this moisture surcharge is justified and for which it is not.
Author Contributions
Conceptualisation, H.F.; methodology, H.F.; investigation, H.F.; data curation, H.F.; writing, H.F.; visualisation, H.F.; supervision, A.K. All authors have read and agreed to the published version of the manuscript.
Funding
This research was part of the natuREbuilt project and was funded by the Federal Ministry of Labour and Economic Affairs (BMAW) of Austria in the FFG programme COIN Networks. The authors acknowledge TU Wien Bibliothek for financial support through its Open Access Funding Programme.
Data Availability Statement
The data presented in this study is available on request from the corresponding author.
Acknowledgments
We would like to thank the entire natuREbuilt network for their contribution to this research project. Authors want to acknowledge Open Access Funding by TU Wien.
Conflicts of Interest
The authors declare no conflict of interest.
References
- Jones, D. Introduction to the Performance of Bio-Based Building Materials; Elsevier Ltd.: Amsterdam, The Netherlands, 2017; ISBN 9780081009925. [Google Scholar]
- Markström, E.; Bystedt, A.; Fredriksson, M.; Sandberg, D. Perceptions of Swedish Architects and Contractors for the Use of Bio-Based Building Materials. In Proceedings of the COST Action FP1407 2nd Conference—Innovative Production Technologies and Increased Wood Products Recycling and Reuse, Brno, Czech Republic, 29–30 September 2016; pp. 29–30. [Google Scholar]
- Cascione, V.; Maskell, D.; Shea, A.; Walker, P. A review of moisture buffering capacity: From laboratory testing to full-scale measurement. Constr. Build. Mater. 2019, 200, 333–343. [Google Scholar] [CrossRef]
- Salonvaara, M.; Künzel, H.; Ojanen, T.; Karagiozis, A.; Holm, A. Moisture Buffering Effects on Indoor Air Quality—Experimental and Simulation Results Mikael. In Proceedings (CD) of the Performance of Exterior Envelopes of Whole Buildings IX International Conference; Clearwater Beach: Clearwater, FL, USA, 2004; Volume 11. [Google Scholar]
- Motamedi, S.; Rousse, D.R.; Promis, G. The Evolution of Crop-Based Materials in the Built Environment: A Review of the Applications, Performance, and Challenges. Energies 2023, 16, 5252. [Google Scholar] [CrossRef]
- Osanyintola, O.F.; Simonson, C.J. Moisture buffering capacity of hygroscopic building materials: Experimental facilities and energy impact. Energy Build. 2006, 38, 1270–1282. [Google Scholar] [CrossRef]
- Mendes, N.; Winkelmann, F.C.; Lamberts, R.; Philippi, P.C. Moisture effects on conduction loads. Energy Build. 2003, 35, 631–644. [Google Scholar] [CrossRef]
- ÖNORM B 6015-2; Bestimmung der Wärmeleitfähigkeit mit dem Plattengerät—Teil 2: Ermittlung des Nennwertes und des Bemessungswertes der Wärmeleitfähigkeit für homogene Baustoffe. Austrian Standards: Vienna, Austria, 2009.
- Fischer, H.; Aichholzer, M.; Korjenic, A. Ecological Potential of Building Components in Multi-Storey Residential Construction: A Comparative Case Study between an Existing Concrete and a Timber Building in Austria. Sustainability 2023, 15, 6349. [Google Scholar] [CrossRef]
- Magwood, C.; Bowden, E.; Trottier, M. Emissions of Materials Benchmark Assessment for Residential Construction; Efficiency Canada: Ottawa, ON, Canada, 2022. [Google Scholar]
- Rüther, N. Materialtechnische. In Grundlagen Naturfaserdämmstoffe; Holzbau: Gold Coast, QLD, Australia, 2022. [Google Scholar]
- Latif, E.; Ciupala, M.A.; Tucker, S.; Wijeyesekera, D.C.; Newport, D.J. Hygrothermal performance of wood-hemp insulation in timber frame wall panels with and without a vapour barrier. Build. Environ. 2015, 92, 122–134. [Google Scholar] [CrossRef]
- Bunkholt, N.S.; Rüther, P.; Gullbrekken, L.; Geving, S. Effect of forced convection on the hygrothermal performance of a wood frame wall with wood fibre insulation. Build. Environ. 2021, 195, 107748. [Google Scholar] [CrossRef]
- Latif, E.; Lawrence, R.M.H.; Shea, A.D.; Walker, P. An experimental investigation into the comparative hygrothermal performance of wall panels incorporating wood fibre, mineral wool and hemp-lime. Energy Build. 2018, 165, 76–91. [Google Scholar] [CrossRef]
- Salonen, T.; Fischer, H.; Korjenic, A. Chopped Straw as an Insulation Material: The Influence of Different Blow-In Technologies and Flame Retardants on hygrothermal properties. Buildings 2023, 13, 2555. [Google Scholar] [CrossRef]
- Koh, C.H.; Gauvin, F.; Schollbach, K.; Brouwers, H.J.H. Upcycling wheat and barley straws into sustainable thermal insulation: Assessment and treatment for durability. Resour. Conserv. Recycl. 2023, 198, 107161. [Google Scholar] [CrossRef]
- Soto, M.; Rojas, C.; Cárdenas-Ramírez, J.P. Characterization of a Thermal Insulating Material Based on a Wheat Straw and Recycled Paper Cellulose to Be Applied in Buildings by Blowing Method. Sustainability 2023, 15, 58. [Google Scholar] [CrossRef]
- Carlos Javier, R.H.; Karin, R.N.; Juan Pablo, C.R. Valorization of Wheat Crop Waste in Araucanía, Chile: Development of Prototype of Thermal Insulation Material for Blowing Technique and Geographical Analysis. Buildings 2023, 13, 1152. [Google Scholar] [CrossRef]
- Zach, J.; Korjenic, A.; Petránek, V.; Hroudová, J.; Bednar, T. Performance evaluation and research of alternative thermal insulations based on sheep wool. Energy Build. 2012, 49, 246–253. [Google Scholar] [CrossRef]
- Vrána, T.; Gudmundsson, K. Comparison of fibrous insulations—Cellulose and stone wool in terms of moisture properties resulting from condensation and ice formation. Constr. Build. Mater. 2010, 24, 1151–1157. [Google Scholar] [CrossRef]
- Wang, L.; Ge, H. Effect of air leakage on the hygrothermal performance of highly insulated wood frame walls: 511 Comparison of air leakage modelling methods. Build. Environ. 2017, 123, 363–377. [Google Scholar] [CrossRef]
- Ge, H.; Straube, J.; Wang, L.; Fox, M.J. Field study of hygrothermal performance of highly insulated wood-frame walls under simulated air leakage. Build. Environ. 2019, 160, 106202. [Google Scholar] [CrossRef]
- Derome, D. Moisture accumulation in cellulose insulation caused by air leakage in flat wood frame roofs. J. Therm. Envel. Build. Sci. 2005, 28, 269–287. [Google Scholar] [CrossRef]
- Wang, L.; Ge, H. Stochastic modelling of hygrothermal performance of highly insulated wood framed walls. Build. Environ. 2018, 146, 12–28. [Google Scholar] [CrossRef]
- Mlakar, J.; Štrancar, J. Temperature and humidity profiles in passive-house building blocks. Build. Environ. 2013, 60, 185–193. [Google Scholar] [CrossRef]
- ISO 14067; Greenhouse Gases: Carbon Footprint of Products: Requirements and Guidelines for Quantification and Communication. International Organization for Standardization: Geneva, Switzerland, 2012.
- Pittau, F.; Lumia, G.; Heeren, N.; Iannaccone, G.; Habert, G. Retrofit as a carbon sink: The carbon storage potentials of the EU housing stock. J. Clean. Prod. 2019, 214, 365–376. [Google Scholar] [CrossRef]
- Göswein, V.; Reichmann, J.; Habert, G.; Pittau, F. Land availability in Europe for a radical shift toward bio-based construction. Sustain. Cities Soc. 2021, 70, 102929. [Google Scholar] [CrossRef]
- Parlato, M.C.M.; Porto, S.M.C.; Valenti, F. Assessment of sheep wool waste as new resource for green building elements. Build. Environ. 2022, 225, 109596. [Google Scholar] [CrossRef]
- Lopez Hurtado, P.; Rouilly, A.; Vandenbossche, V.; Raynaud, C. A review on the properties of cellulose fibre insulation. Build. Environ. 2016, 96, 170–177. [Google Scholar] [CrossRef]
- natuREbuilt—Innovationsnetzwerk für Regenerative, Rezyklierbare, Regionale und Resiliente Komponenten im Hochbau. 2023. Available online: https://www.naturebuilt.at/ (accessed on 25 September 2023).
- OIB Richtlinie 6—Energieeinsparung und Wärmeschutz; Österreichisches Institut für Bautechnik: Wien, Austria, 2023.
- ISO 9869-1:2014; Thermal Insulation—Building Elements—In-Situ Measurement of Thermal Resistance and Thermal Transmittance—Part 1: Heat Flow Meter Method. International Organization for Standardization: Genève, Switzerland, 2014.
- O’Hegarty, R.; Kinnane, O.; Lennon, D.; Colclough, S. In-situ U-value monitoring of highly insulated building envelopes: Review and experimental investigation. Energy Build. 2021, 252, 111447. [Google Scholar] [CrossRef]
- Park, S.; Shim, J.; Song, D. A comparative assessment of in-situ measurement methods for thermal resistance of building walls under mild climate conditions. J. Build. Eng. 2023, 77, 107417. [Google Scholar] [CrossRef]
- Zirkelbach, D.; Tieben, J.; Tanaka, E.; Pfabigan, N.; Andresen, N.; Bachinger, J.; Nusser, B. ThermNat—Building Components with Insulation from Sustainable Raw Materials: Focus (hygro-)thermal Conditions; Holzforschung Austria, Fraunhofer-Institut für Bauphysik: Wien, Austria; Holzkirchen/Dresden, Germany, 2023. [Google Scholar]
- Sedlbauer, K. Prediction of Mould Fungus Formation on the Surface of/and Inside Building Components; Fraunhofer Institute for Building Physics: Stuttgart, Germany, 2001; p. 247. [Google Scholar]
- Tieben, J.; Pfabigan, N.; Bachinger, J. Dämmstoffe aus biogenen Rohstoffen auf dem Prüfstand. Neue Erkenntnisse zu Wärmeleitfähigkeit und Dauerhaftigkeit. Holzforsch. Austria Mag. 2023, 1, 3–5. [Google Scholar]
- Collet, F.; Prétot, S.; Lanos, C. Hemp-Straw Composites: Thermal and Hygric Performances. Energy Procedia 2017, 139, 294–300. [Google Scholar] [CrossRef]
- Romano, A.; Bras, A.; Grammatikos, S.; Shaw, A.; Riley, M. Dynamic behaviour of bio-based and recycled materials for indoor environmental comfort. Constr. Build. Mater. 2019, 211, 730–743. [Google Scholar] [CrossRef]
- Holcroft, N.; Shea, A. Moisture Buffering and Latent Heat Effects in Natural Fibre Insulation Materials; ResearchGate: Berlin, Germany, 2012; pp. 221–228. [Google Scholar]
- Rode, C.; Peuhkari, R.H.; Mortensen, L.H.; Hansen, K.K.; Time, B.; Gustavsen, A.; Ojanen, T.; Ahonen, J.; Svennberg, K.; Arfvidsson, J.; et al. Moisture Buffering of Building Materials Department of Civil Engineering; ResearchGate: Berlin, Germany, 2005; ISBN 8778771951. [Google Scholar]

Disclaimer/Publisher’s Note: The statements, opinions and data contained in all publications are solely those of the individual author(s) and contributor(s) and not of MDPI and/or the editor(s). MDPI and/or the editor(s) disclaim responsibility for any injury to people or property resulting from any ideas, methods, instructions or products referred to in the content. |
© 2023 by the authors. Licensee MDPI, Basel, Switzerland. This article is an open access article distributed under the terms and conditions of the Creative Commons Attribution (CC BY) license (https://creativecommons.org/licenses/by/4.0/).