Article

Thermal Performance Investigation at Different Temperature and Airflow Settings in a Conference Hall of Expo Building

1
Graduate Institute of Precision Manufacturing, National Chin-Yi University of Technology, Taichung 411, Taiwan
2
Department of Refrigeration, Air Conditioning and Energy Engineering, National Chin-Yi University of Technology, Taichung 411, Taiwan
3
Green Energy and Environment Research Laboratories, Industrial Technology Research Institute, Hsinchu 310, Taiwan
*
Author to whom correspondence should be addressed.
Buildings 2022, 12(9), 1418; https://doi.org/10.3390/buildings12091418
Submission received: 6 August 2022 / Revised: 3 September 2022 / Accepted: 7 September 2022 / Published: 9 September 2022

Abstract

:
The airflow distribution for a large space, such as a conference hall, is quite challenging to achieve a good and uniform thermal distribution. In the recent study, insufficient quantitative knowledge has been provided, notably for the appropriate supply air temperature and air velocity for the conference hall environment. In this study, a full-scale conference hall was simulated extensively for an expo building in Taiwan. A total of nine experiment numbers were carried out with various supply air temperature and air velocity settings. Through the use of a CFD approach, this study seeks to identify the ideal parameters for a comfortable and acceptable airflow distribution and temperature, with an eye toward potential compromises with an energy-efficient approach. The results demonstrate that the temperature distribution ranges from 18 to 26 °C, indicating an acceptable indoor thermal environment, depending on the parameter settings. The best settings for providing a pleasant indoor thermal environment are with a supply air temperature and air velocity of 15 °C and 1 m/s, which can keep the PMV index between −0.5 and 0.5. Utilizing a greater temperature setting may save energy, but sufficient air velocity must be addressed in order to meet the indoor thermal conditions. Furthermore, a greater air velocity may generate more noise and disrupt the situation in the conference hall, so it must be selected specifically.

1. Introduction

Thermal comfort studies in hot–humid climates are quite challenging. According to the International Standard of ISO 7730 [1], environmental measurements are combined with six parameters: air temperature, air velocity, relative humidity, mean radiant temperature, metabolic rate, and clothing index to evaluate the predicted mean vote (PMV). Good thermal comfort should present a neutral PMV for the average occupant’s thermal sensation. Thermal comfort can be obtained by a cooling situation in which the human body can readily release heat and receive a cooling sensation. The first approach to obtaining a good thermal environment is adjusting the temperature set point [2]. Furthermore, the cooling sensation can be achieved by adjusting the air velocity, which produces the “wind chill” effect [3]. It has been widely employed in building environment conditioning as an excellent cooling and air mixing approach [4]. In addition, Yu et al. [5] conducted a thermal comfort study in Southern Taiwan. The indoor air quality can affect occupants’ health, comfort, productivity, and well-being. Maintaining a good indoor air quality (IAQ) has proven to influence the occupants’ physical and mental health significantly. To contribute to a better indoor comfort zone, maintaining a good IAQ has been recommended by experts at the University of Bristol [6].
The conference hall has a larger floor area compared to the other halls and factories. Airflow and temperature distribution vary greatly in big spaces, particularly in the vertical direction. Therefore, in order to obtain a good thermal environment in a large space, the most critical thermal environment concerns are airflow and radiation distribution [7]. Several studies have been carried out regarding airflow and thermal distribution in large spaces. Ren et al. [8] found that the effects of the air supply angle, air supply rate, temperature difference, and air supply spacing influence the thermal environment. The CFD approach has been utilized in several studies to analyze the thermal performance and ventilation strategies to achieve a good indoor thermal environment. CFD modeling can be used not only to explore but also to improve thermal comfort, as demonstrated by Kamar et al. [9]. Oh and Kato [10] demonstrated that every area of the human body exhibits varied convective heat transfer reactions to varying air velocities, and as the air velocity increases, so does the value of the convective heat transfer, which increases the human predisposition toward feeling chilly. In addition, the study was conducted by Zhu et al. [11] to determine the optimal ventilation mode based on a ventilation assessment to achieve automatic control of IAQ to ensure the well-being of the occupants. Poor ventilation could cause airborne contaminants to become trapped in the space and result in a build-up of carbon dioxide and low oxygen levels [12]. Another ventilation mode was investigated by Fan et al. [13] of underfloor air distribution (UFAD) systems that distribute conditioned air to the supply air diffusers used for their advantage in improving IAQ, energy savings, and the thermal environment. However, the pressure distribution and flow field in the plenum space directly affect the air supply uniformity. They also found that impinging jet ventilation (IJV) can distribute the supply air into occupied areas easier than the MV system [14]. On the other hand, measuring the relationship between the estimated PMV and the thermal sensation is possible. The coefficient of determination (r2) and the error terms between predicted and observed values are used as accuracy measures. This method’s model performance gets better when the regression slope gets closer to 1 and its intercept gets closer to 0 [15]. Thermal comfort is particularly difficult to measure and significantly impacts how hot an environment feels to occupants. The linear relationship between PMV has been found to differ greatly depending on location, building type, ventilation system, and season. To create healthy and comfortable buildings, it is vital to integrate their qualities [16].
In recent studies, the issue of thermal comfort developed quickly, as reviewed by Zhang et al. [17]. A number of experimental studies led to the development of models for various settings regarding thermal comfort studies, as well as energy concerns, while achieving an indoor thermal environment. Amoabeng et al. [18] investigated the set point temperature of the AC in a hot–humid climate with the condition of high outdoor temperatures at around 35 °C. According to studies, placing the AC thermostat in the center of a conference room closer to the people who would be using it would result in more comfortable temperature conditions (PMV of 1.1 as opposed to 1.8 for the summer scenario) [19]. The thermal comfort was maintained at a high level throughout the year, except for minor limitations in the winter due to the lack of humidity control. In the winter, the outside air humidity ratios above the desired indoor comfort zone contributed to increased thermal discomfort [20]. Furthermore, the building design and its material properties could also influence the thermal environment and energy consumption. In the building sector (including office buildings, conference rooms, etc.) worldwide, HVAC systems spend almost 50% of the entire building’s energy use [21]. The Department of Climate Change, Energy, the Environment, and Water of the Australian Government released a Factsheet on energy breakdown that a typical system accounts for approximately 40% of the total building consumption [22]. As a result, HVAC systems are critical in achieving energy efficiency and thermal comfort. In addition, Kükrer [23] investigated the multipurpose school building, including a large-scale lecture hall, seminar rooms, and offices. As a result, discomfort hours were reduced by 17.6%. Increasing the ratio of the building’s height to their distance from each other (H/W) ratio has a greater impact on thermal comfort [24]. Other than that, the lighting level could also influence the thermal environment of the atrium in the summer [25]. The present study shows that the cooling energy demand is high in several buildings with hot–humid climates [26,27,28]. Mixed-mode cooling can successfully minimize the energy consumption of building cooling while ensuring that occupant thermal comfort and indoor air quality criteria are met. The findings of Duan et al. [29] indicated that, compared to an air-conditioned building, the mixed-mode building uses about 45% lower cooling energy annually. In addition, mixed-mode cooling proposed by Gokarakonda et al. [30] has a possibility that, during the air-conditioned time, the cooling effect will be lessened due to an increase in the operating temperature, driven by the usage of ceiling fans. Therefore, maintaining the highest AC set point and lowest fan speed setting that is feasible is the best option to take. The precise location of the openings improves the thermal comfort by enhancing the volume flow. Mechanical ventilation offers a better performance than natural ventilation in providing better thermal comfort. However, it requires higher energy consumption, a global concern, so energy conservation has affected how buildings are fitted with mechanical ventilation systems [31,32].
This paper aims to determine the best parameters for a comfortable and acceptable temperature and airflow distribution through the CFD approach, which could compromise the energy-efficient approach. A total of nine experiments were carried out in this study to investigate thermal performances at different supply air temperatures and airflow velocity settings.

2. Methodology

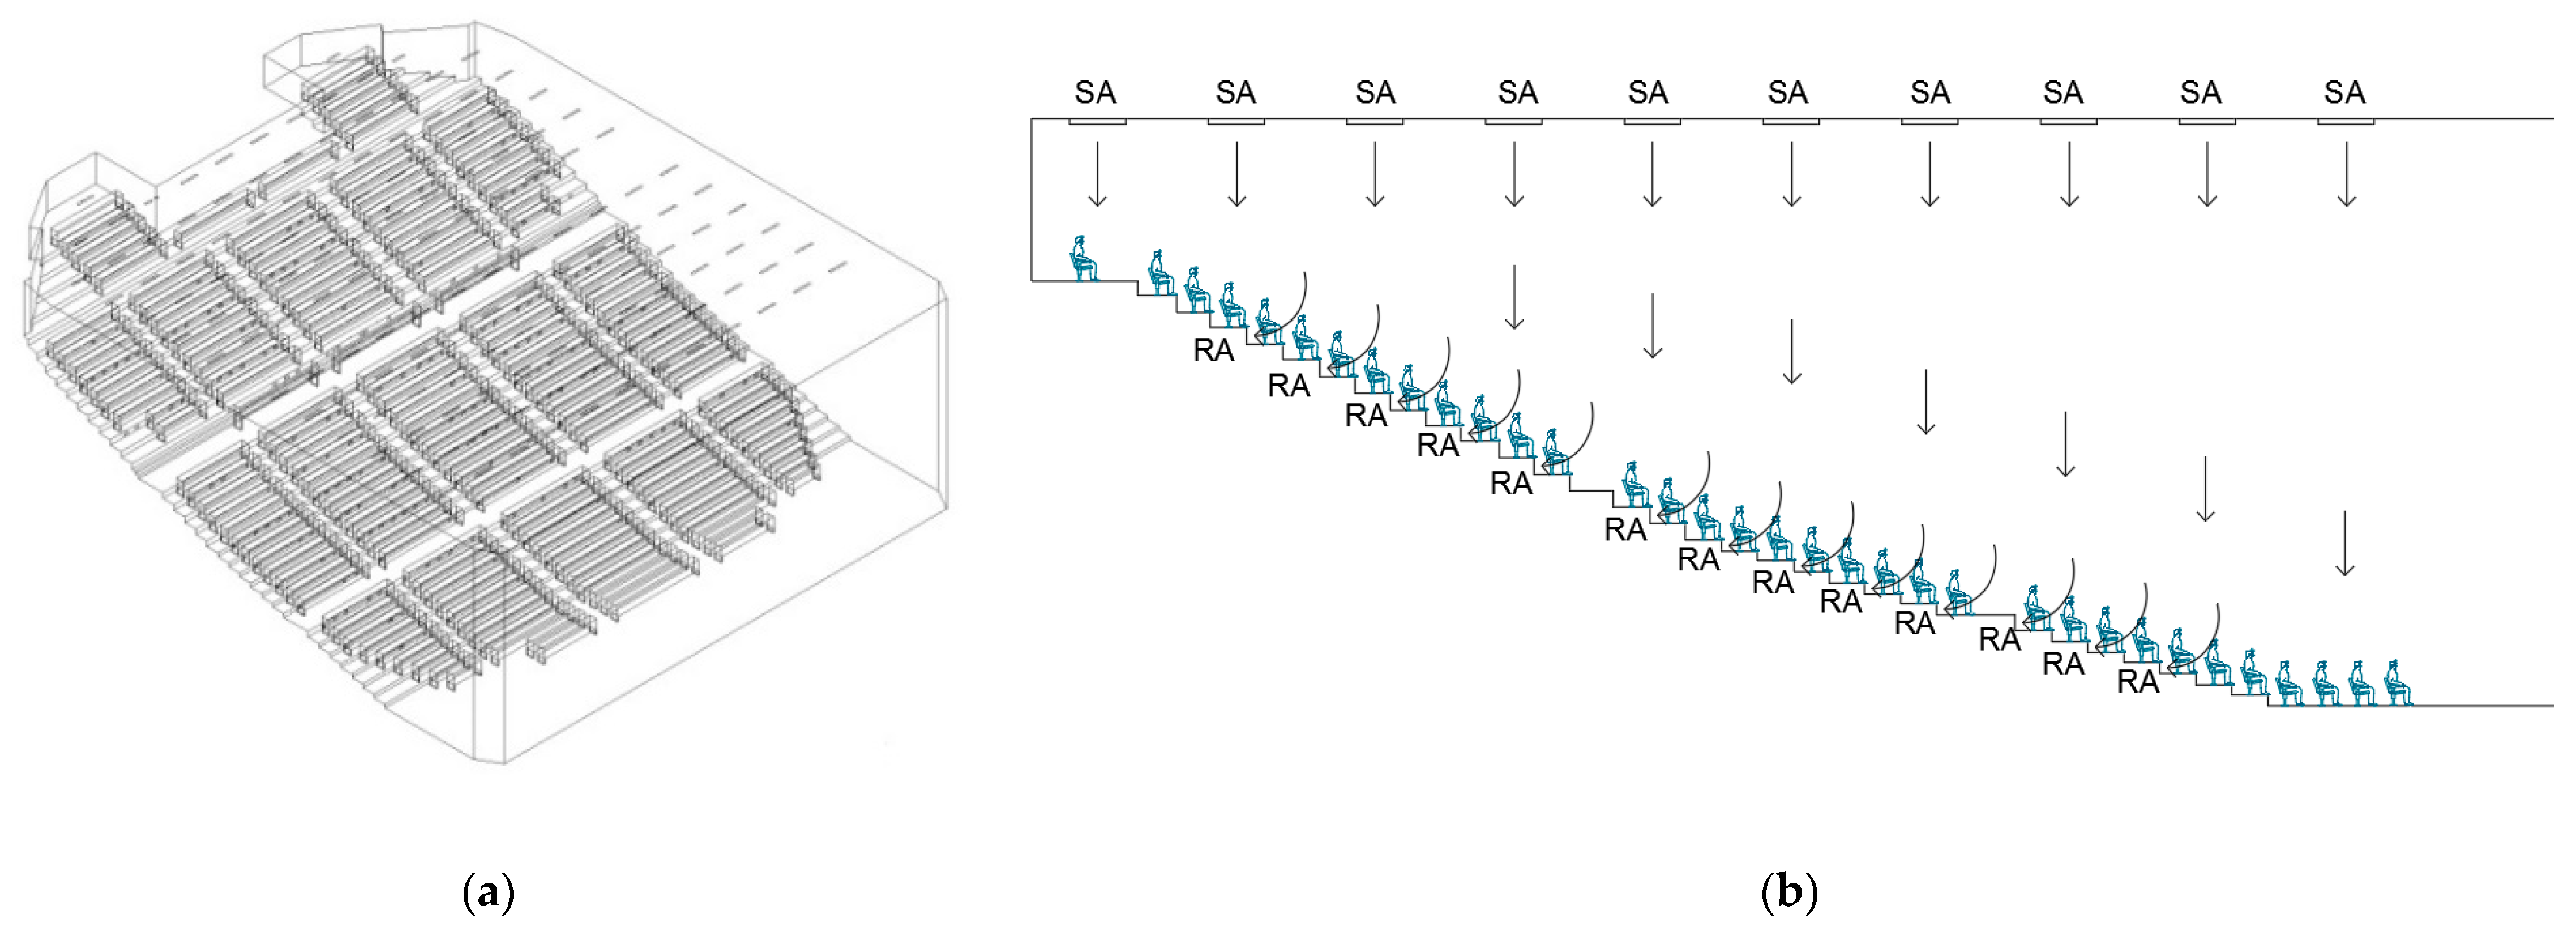
2.1. System Description

This study investigates a conference hall, part of an expo building. The geometry and schematic diagram of the conference hall is shown in Figure 1. It has dimensions with a length of 50.3 m, a width of 42.35 m, and a ceiling height of 16.6 m, respectively. The conference hall area is 2130 m2. It is designed to accommodate around 1000 occupants. The expo building’s cooling system uses 3 screw-type chillers located in the basement level, with a total cooling capacity of 560 tons of refrigeration (TR): two units with 100 TR each and one unit with 360 TR. The air handling unit (AHU) distributes conditioned air to each room in the expo building, one of which is distributed to the conference hall through supply air (SA) grilles, with the temperature preset at 13 °C and the air velocity set at 2 m/s. The total supply air grilles are 146 units with a linear diffuser type, and the supply air volume is 1600 m3/h. The dimension of the supply air diffuser is 1.5 m × 0.15 m. The total return air (RA) grilles are 466 units located near the audience seat.

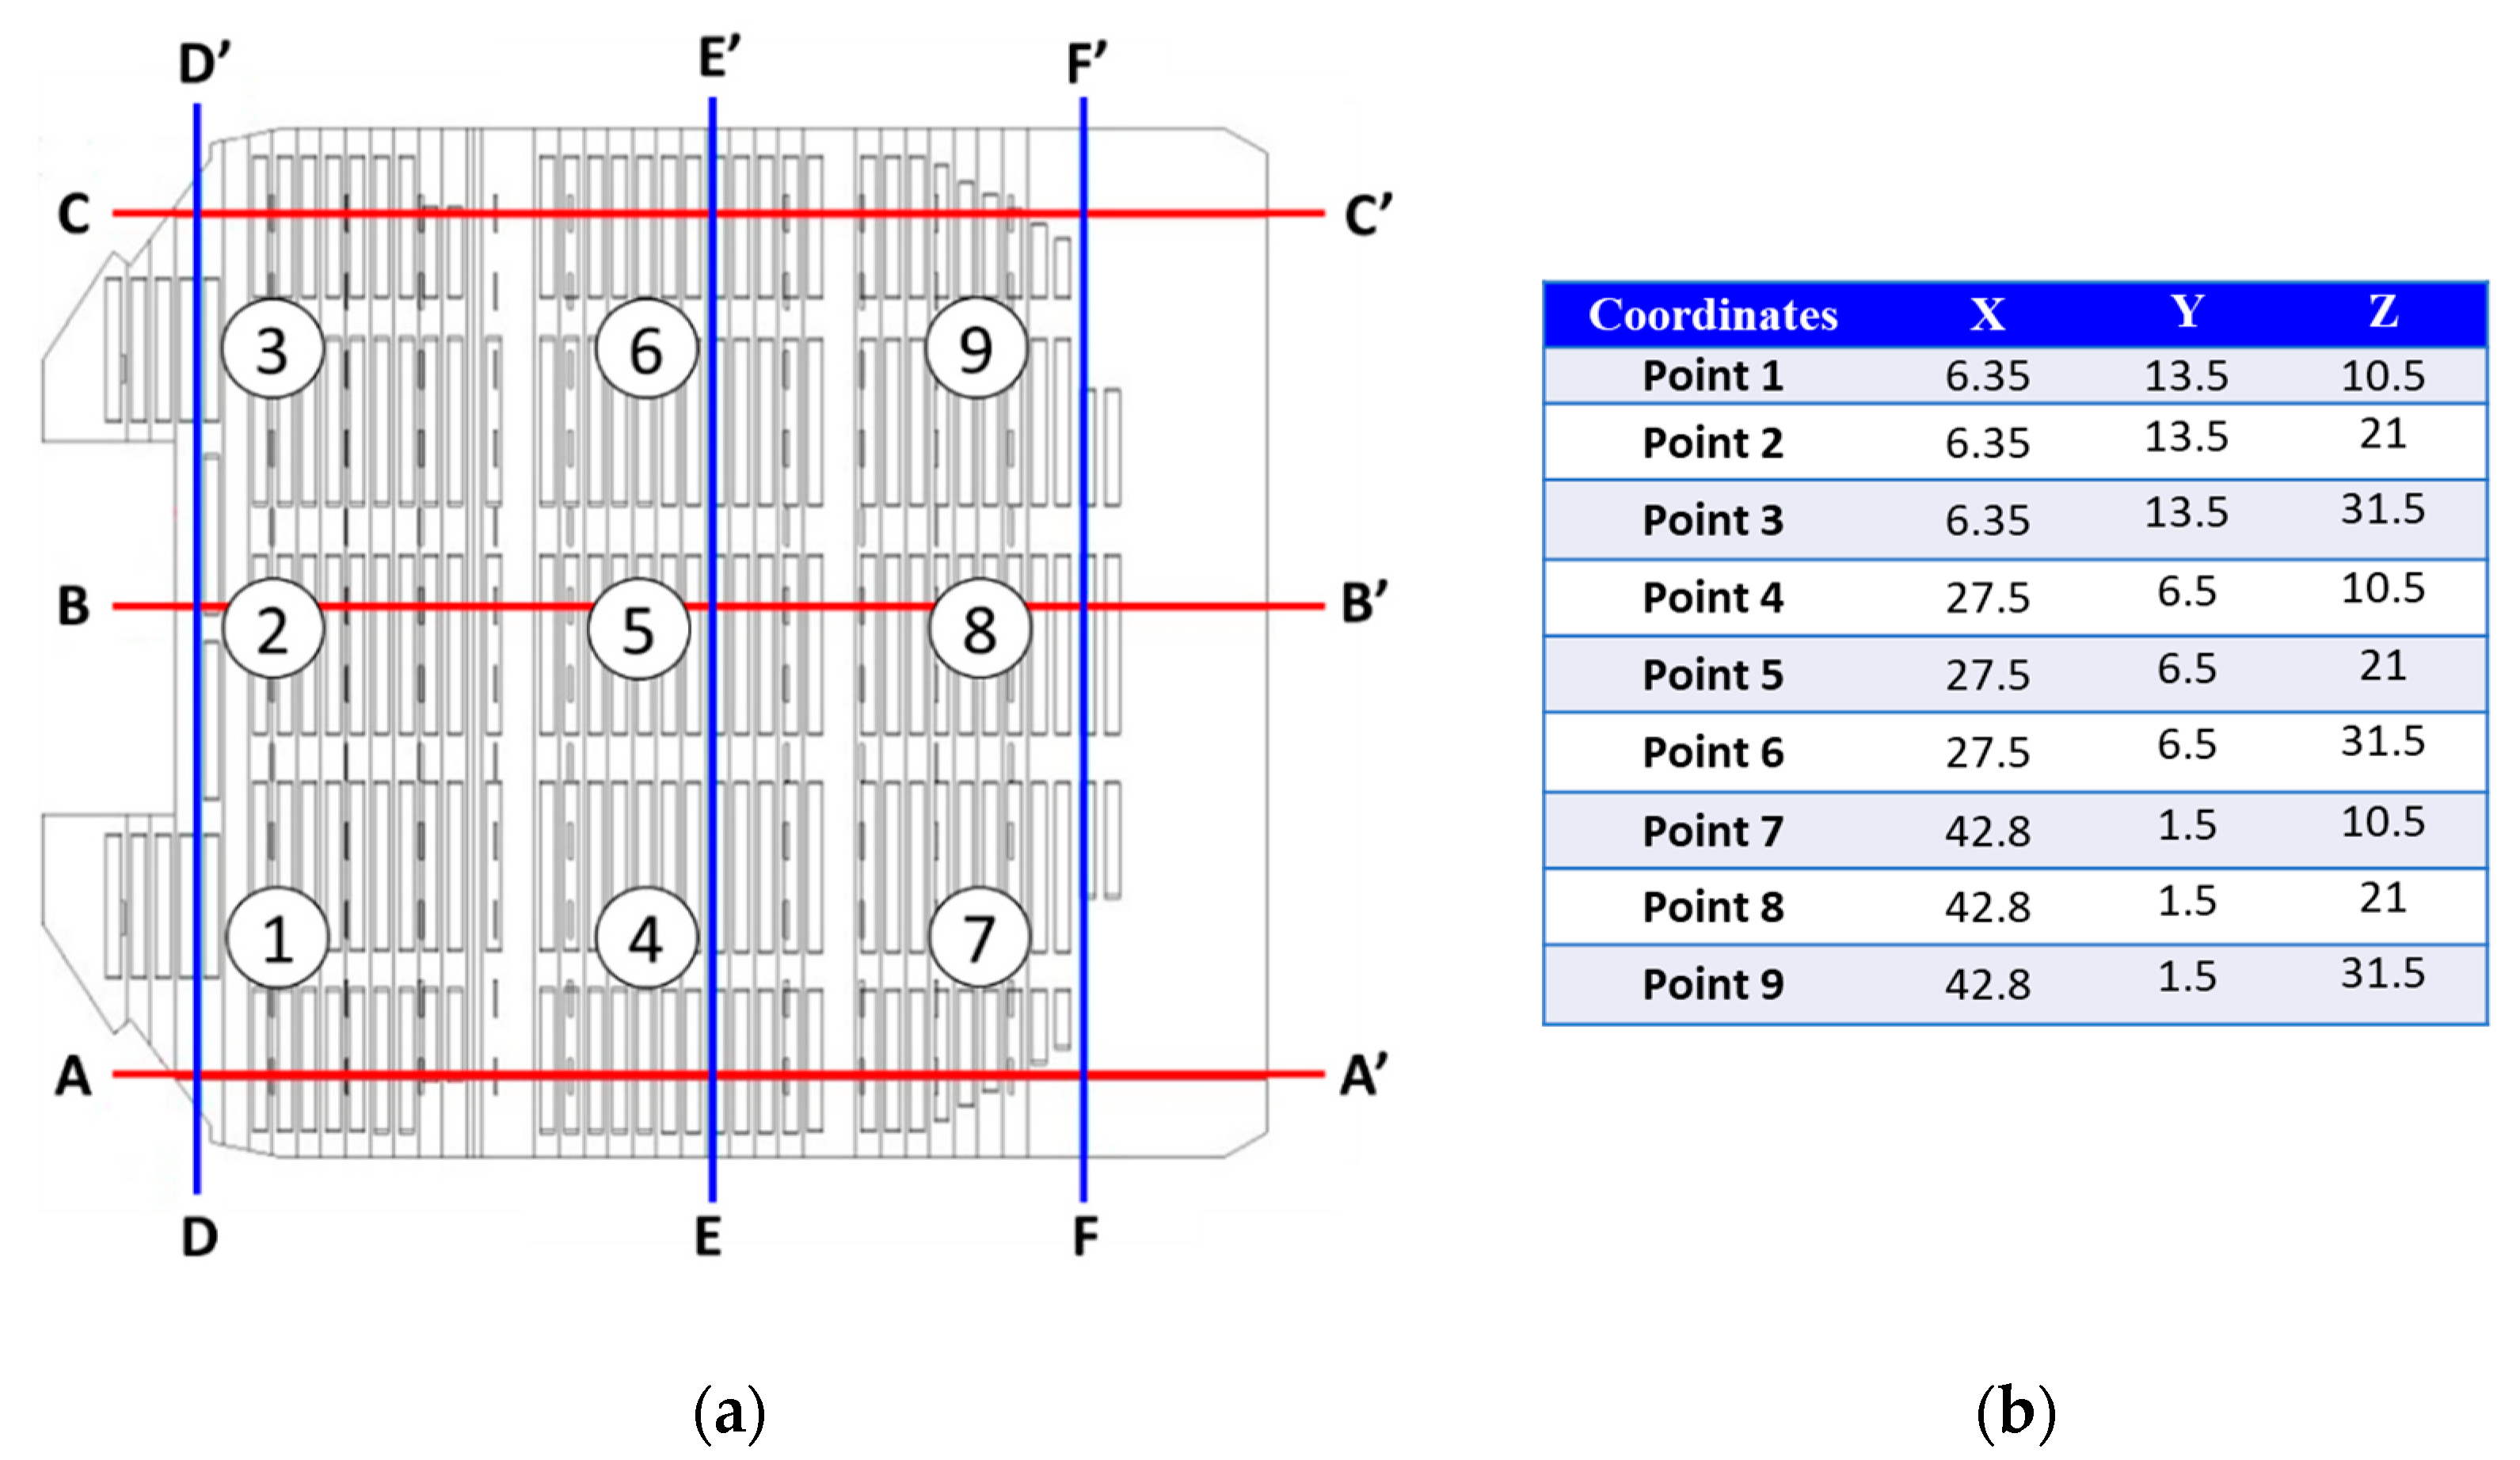
2.2. Experiment Setup

The thermal environment in the conference hall may not be uniform, and the ceiling height may vary from front to rear seat. Due to the considerable distance between the supply air diffuser and the occupants, the front seat area may produce a higher thermal performance and perceive lesser airflow, while the rear seat might perceive a stronger airflow. The entire parameter set is investigated using the minimum needed experiments. The mean result of the performance measured at each parameter level is used to conduct the primary effect analyses, which could be implemented in the constructed design in a real environment. As a result, this study analyzes the various supply air temperature and air velocity settings in order to accomplish the thermal environment condition for the occupants.
Table 1 shows the number of experiments in this study using different temperature and air velocity settings. It aims to find the optimal design for the indoor thermal environment of the conference hall. This approach may contribute to a better understanding of how to maintain thermal comfort while achieving energy conservation for a conference hall by determining the ideal AC set point temperature and air velocity.

2.3. Airflow Modeling

The CFD is a powerful, useful tool with a flexibility, accuracy, and breadth of application for state-of-the-art research. It is efficient in parametric studies, such as for air and temperature distribution. In this study, the temperature and air distribution of the conference hall was conducted by using a CFD code, ANSYS Fluent Version 2020 R2 [33]. It examined and analyzed the conference hall and also found the optimal design for enhancing the thermal environment and energy-saving potential.
ANSYS Fluent offers a number of equations to resolve issues, including those involving laminar and turbulent fluid flow, incompressible and compressible fluid, and other issues. It is three-dimensional steady-state turbulence, which is simulated by the most commonly used standard k-epsilon (k-ε) turbulence model in the engineering flow field calculation, and the continuity equation is solved by the Finite Volume Method (FVM), continuity equation, momentum equation, energy equation, turbulence kinetic energy, and dissipation rate transfer equation for simulating fluid and heat transfer phenomena, as follows in Equation (1):
t ( ρ ϕ ) + · ( ρ V ϕ Γ ϕ , e f f ϕ ) = S ϕ
where ρ is the fluid density, ∅ is the variable of the different transfer equation, is the velocity vector, is the diffusion coefficient, and is the source term. The above parameters ∅, Γ ϕ , e f f , and S ϕ describe a continuous equation, momentum equation, energy equation, and turbulence equation as follows:
  • Continuity equation:
  • Let = μ t , Γ ϕ , e f f = 0, and S ϕ = 0 be substituted into Equation (1), which can derive
    ρ t + x t ( ρ μ t ) = 0
  • Momentum equation:
  • Let = 1, Γ ϕ , e f f = μ e , and S ϕ = ρ x i + F 1 be substituted into Equation (1), which can derive
    t ( ρ μ i ) + x j ( ρ μ j μ i ) = p x i + x j ( u e μ t x j ) + F i
    where the μ e = μ + μ i of Equation (3) represents the sum of the laminar flow and the turbulent viscous coefficient, i.e., the effective viscosity coefficient, and F represents the external body forces in the I direction or the other user-defined source items such as porous media.
  • Energy equation:
  • Let = T, Γ ϕ , e f f = k e , and S ϕ = S e be substituted into Equation (1), which can derive
    t ( ρ c p T ) + x j ( ρ c p T μ t ) = p u i x i + x j ( k e T x j ) + μ ϕ + S e
  • Turbulent flow energy transfer equation:
  • Let = k, Γ ϕ , e f f = u i σ l , and S ϕ = G k ρ ε be substituted into Equation (1), which can derive
    t ( ρ k ) + x j ( ρ k μ t ) = x i [ ( μ + μ t σ j ) k x j ] + G k ρ ε
  • Turbulent flow energy diffusion equation:
  • Let = ε, Γ ϕ , e f f = u i σ l , and S ϕ = ε ( C 1 G k C 2 ε ) k be substituted into Equation (1), which can derive
    t ( ρ ε ) + x j ( ρ ε μ t ) = u i x i [ ( μ + μ t σ j ) ε x j ] + ε ( C 1 G k C 2 ε ) k
    where G k represents the turbulent flow energy produced by the average velocity gradient, and the equation is defined as follows:
    G k = ρ μ t μ j ¯ u j 1 x t 1
    and C 1 ε , C 2 e , C μ , σ k , and σ e are empirical constants C 1 ε = 1.44, C 2 e = 1.92, C μ = 0.09, σ k = 1.0, and σ e = 1.3, respectively.

2.4. Boundary Condition

The geometry model of the conference hall was created the same as the actual size design conditions. For the boundary conditions, the supply air temperature is initially at 13 °C, then increases to 15 °C and 17 °C. The air velocity of the supply air is initially at 2 m/s, then reduced to 1.5 m/s and 1 m/s to examine the variations of the thermal performance of the conference hall. The heat source in the conference hall is generated by the occupants. A total of 500 occupants were simulated for this study. During seated conditions, each person generates a heat of around 4.5 W/m2/K for their whole body [34]. Additionally, the inside walls, seats, and ceiling were considered to be adiabatic with no heat transfer, because the conference hall is a part of the expo building, which means there is no external wall directly in contact with the outdoor environment.

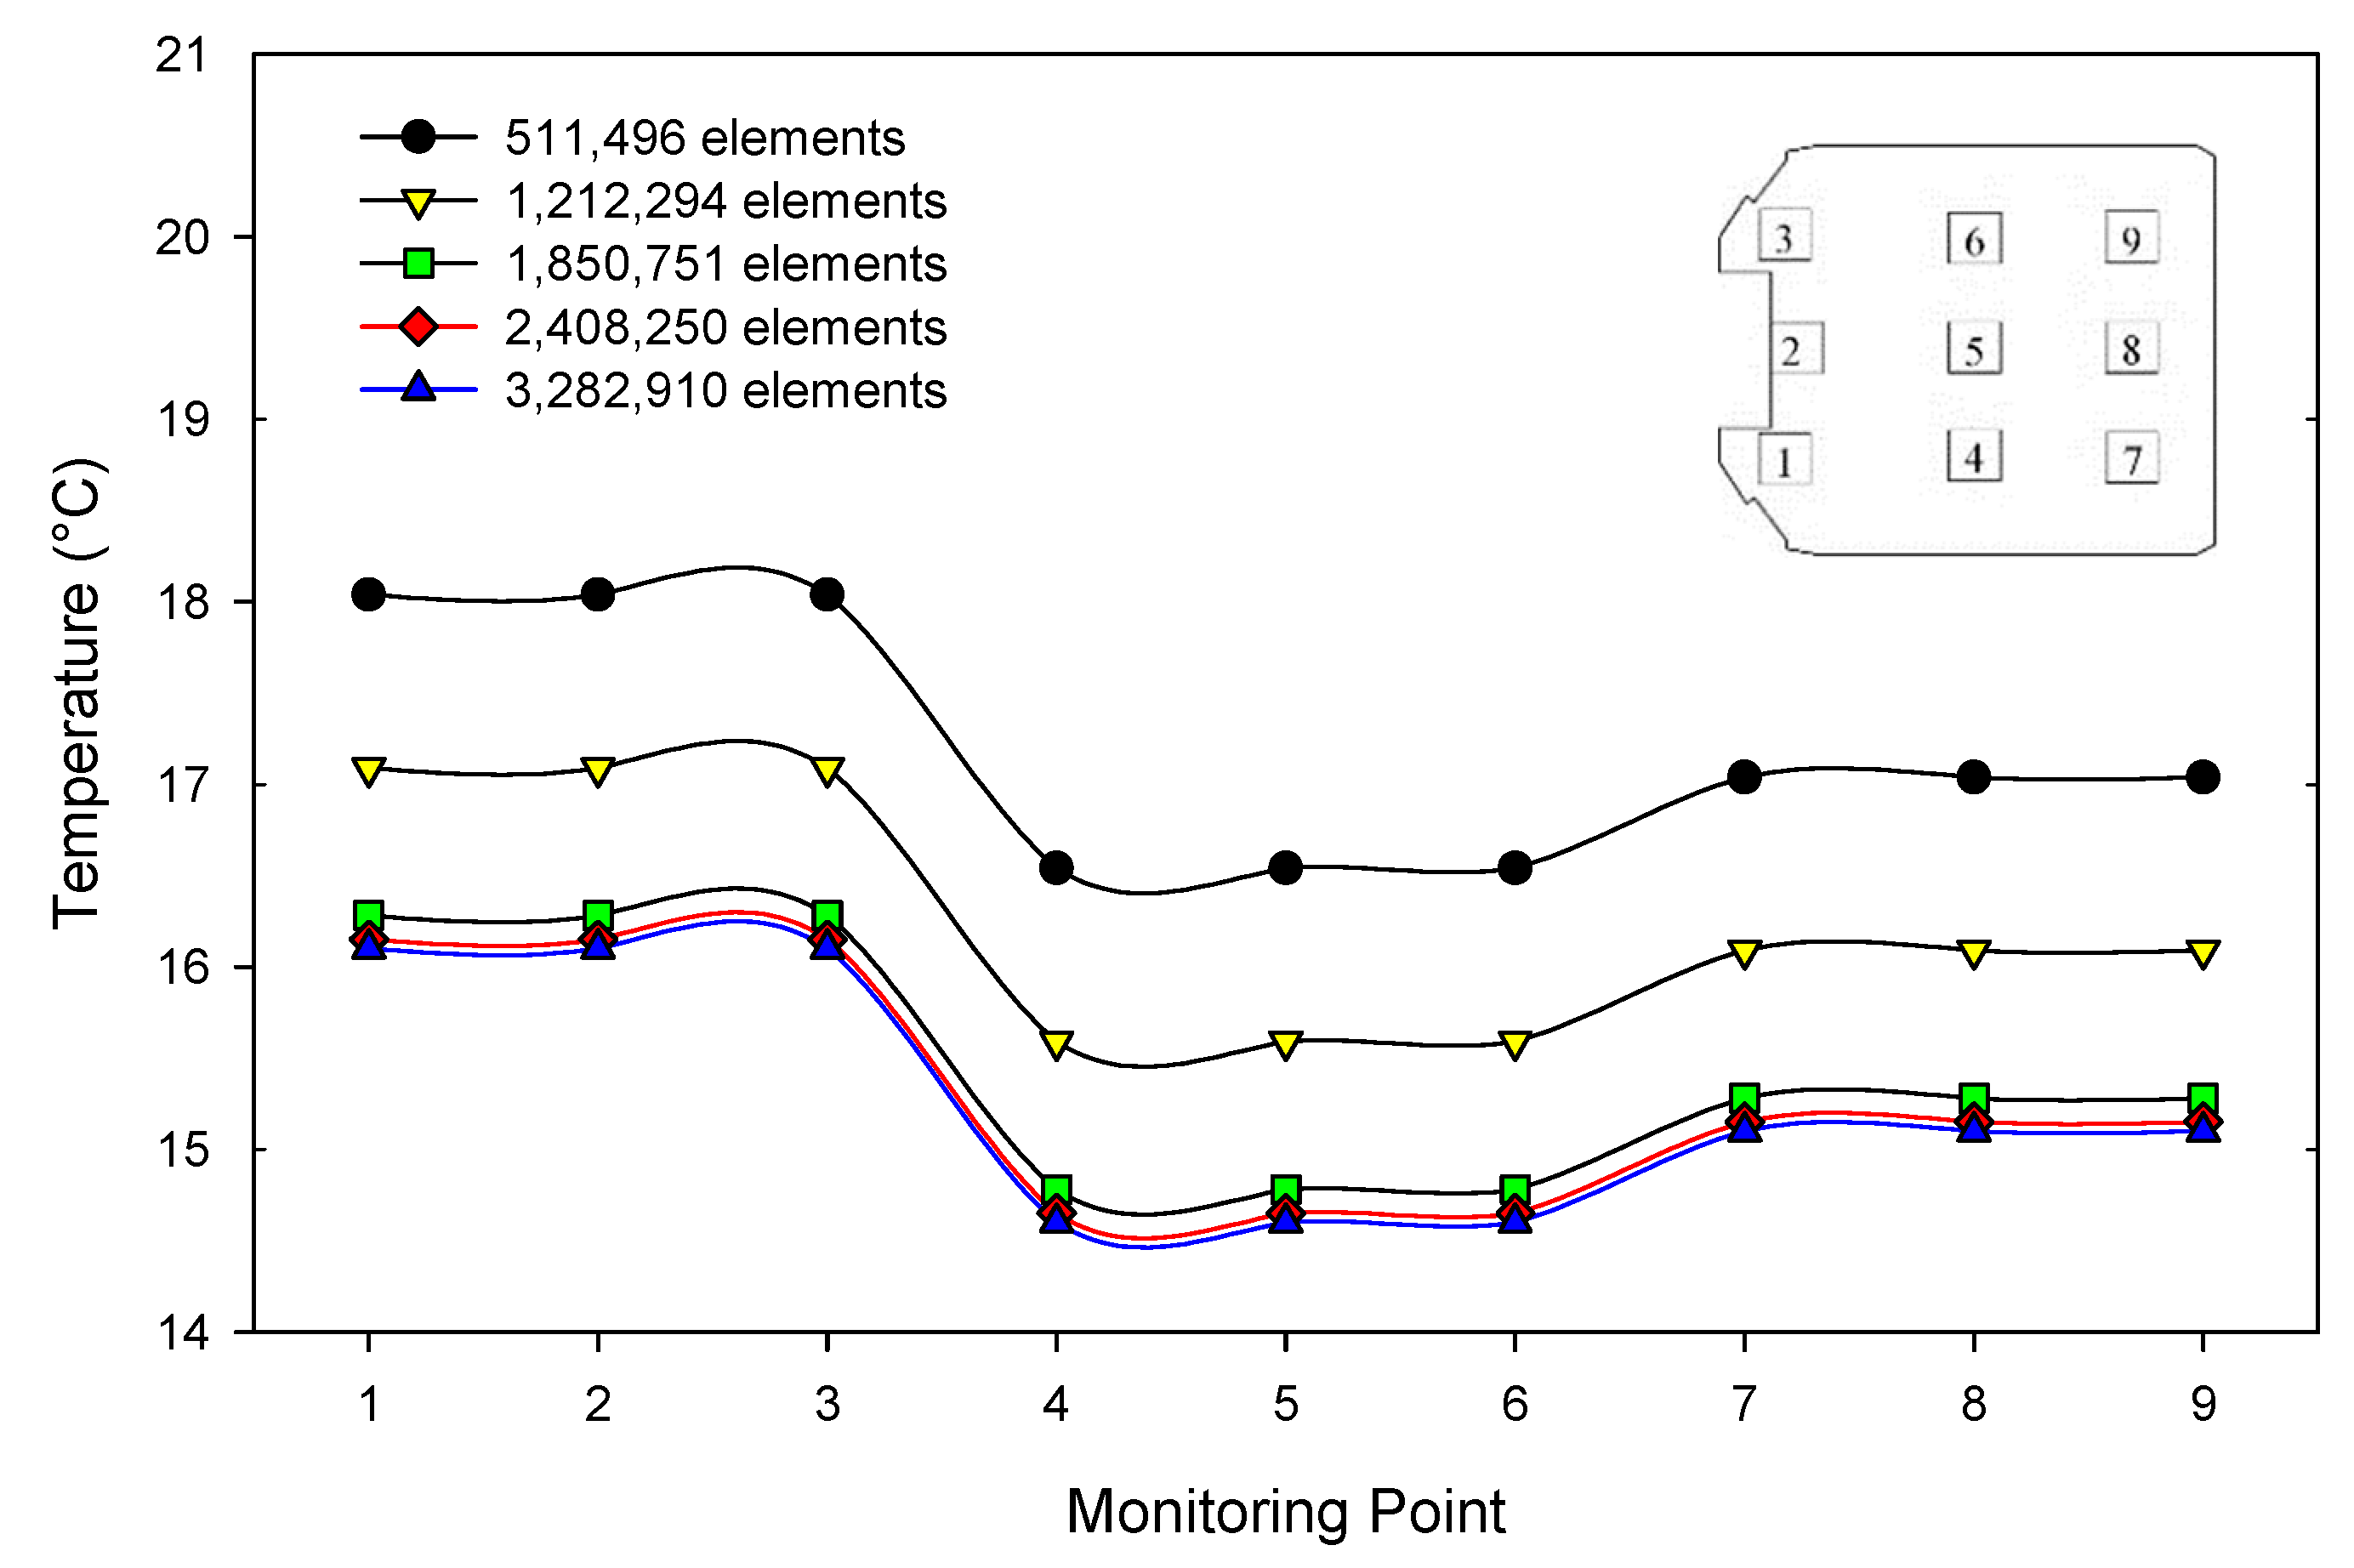
2.5. Meshing and Grid Test

This study provided two types of mesh sizing: body sizing and face sizing. The body sizing for the conference hall building was selected, including the wall, floor, and ceiling. The face sizing was selected for the small parts, including supply air grilles, return air grilles, and the occupants of the conference hall were simplified and sketched. Mesh refinement is a very important factor for determining an accurate result. This study implemented a polyhedral mesh to generate the computational model. The number of grids is very important, and it will relatively affect the simulation results [35]. In this study, five grid numbers are selected for the simulation to verify the relative error of the temperature under different element numbers. The boundary conditions of the grid test for the inlet temperature are 13 °C, the air velocity is 2 m/s, and the outlet is set as the pressure outlet. The grid numbers start from 511,496 elements, and the temperature at point 5 is 16.54 °C. When the grid number is increased to 1,212,294 elements, the temperature at point 5 decreases to 15.59 °C. Along with increasing the number of mesh elements, the temperature decreases and will present more accurate results. There has been little influence when the grid numbers were increased from 1,850,751 to 2,408,250 and then to 3,282,910. The temperature variations are slightly different in point 5, from 14.78 °C to 14.65 °C to 14.60 °C, and in other monitoring points, as illustrated in Figure 2. After considering the simulation time and accuracy, this study employs element number 2,408,250 for the simulation and a skewness metric of 0.84921.

2.6. Thermal Performance Evaluation

According to ASHRAE standard 55-2017 [36], thermal environmental conditions for human occupancy temperatures range approximately from 19.4 °C (67 °F) to 27.8 °C (82 °F). This standard recommends a specific percentage of occupants that constitutes acceptability and values of the thermal environment associated. A comfort zone may be determined by air temperature, radiant temperature, humidity, air velocity, metabolic rate, and clothing insulation values. The comfort zone is defined as the operating temperature that provides acceptable thermal environment conditions with the air temperature and mean radiant temperature (tr). The PMV index can be determined when the activity (metabolic rate) and the clothing (thermal resistance) are estimated. The following environmental parameters measured are the air temperature, mean radiant temperature, relative humidity, and air velocity. It is recommended to use the PMV index only for values between −1 and +1.
The PMV shows the level of comfort or discomfort of the human body to the thermal environment and is expressed on a 7-values scale (3, 2, 1, 0, −1, −2, and −3). The PMV value can be determined using Equation (8) as follows ISO 7730 [1]:
PMV = [ 0.303 · exp ( 0.036 · M ) + 0.028 ] ( M W ) 3.05 · 10 3 · [ 5733 6.99 ( M W ) P a ] 0.42 · [ ( M W ) 58.15 ] 1.7 · 10 5 · M · ( 5867 P a ) 0.0014 · M · ( 34 t a ) 3.96 · 10 8 · f cl · [ ( t cl + 273 ) 4 ( t r + 273 ) 4 ] f cl · h c · ( t cl t a )
t cl = 35.7 0.028 · ( M W ) I cl · { 3.96 · 10 8 · f cl · [ ( t cl + 273 ) 4 ( t r + 273 ) 4 + f cl · h c · ( t cl t a ) ]
h c = { 2.38 · ( t cl t a ) 0.25 ,         for   2.38 · ( t cl t a ) 0.25 > 12.1 · v ar 12.1 · v ar ,             for     2.38 · ( t cl t a ) 0.25 < 12.1 · v ar
f cl = { 1.00 + 1.29 · I cl ,         for     I cl 0.078   m 2 k / W 1.05 + 0.645 · I cl ,         for     I cl > 0.078   m 2 k / W
where M is the metabolic rate (W/m2), W is the effective mechanical power (W/m2), Icl is the clothing insulation (m2. K/W), fcl is the clothing surface area factor, ta is air temperature (°C), tr is the mean radiant temperature (°C), Pa water vapor partial pressure (Pa), hc is the convective heat transfer coefficient (W/m2. K), tcl is the clothing surface temperature (°C), and var is the relative air velocity (m/s). The value of tcl, hc, and fcl can be obtained by iteration using Equations (9)–(11).
The PMV is calculated using four measured variables (air velocity, temperature, mean radiant temperature, and relative humidity), as well as two estimated parameters (clothing and metabolism rates). The conference hall temperature set point was set and maintained at 25 °C. Initially, the indoor supply air temperature was set at 13 °C, and the supply air velocity was set at 2 m/s, then changed to another parameter setting, as shown in Table 2, to find the effect. The relative humidity was assumed to be 50% with the air conditioning on. The mean radiant temperature was assumed to be set at 24 °C. The occupants’ clothing insulation with skirts/dresses was set at 1.1 clo, and the human metabolic rate while seated was set at 1.0 met based on ASHRAE Standard 55 [36].
Regarding analyzing and evaluating the results, the measurement points and cross-section plane for the conference hall are shown in Figure 3a. The plane is divided into six cross-sections sequenced under different supply air temperatures and supply air velocities. Three cross-sections of A–A′, B–B′, and C–C′ represent the plane in the front view, while another three cross-sections: D–D′, E–E′, and F–F′ show the plane in the side view. The simulation will be set up with 9 sampling points. The coordinates of the simulating points are also shown in Figure 3b.

3. Results and Discussion

The temperature and air velocity are two variables that can influence thermal comfort aside from clothing insulation, metabolic rate, humidity, and radiant temperature. Two variables in this study were carried out numerically at different temperature and air velocity settings. Three different temperature settings were distributed from supply air grilles through the conference hall, starting from 13 °C, 15 °C, and 17 °C, and were analyzed and evaluated through CFD simulation. In addition, three different supply air velocities were also analyzed and evaluated, starting from 1 m/s, 1.5 m/s, and 2 m/s. A total of nine scenarios were investigated in this study to find the ideal AC (cooling) set point temperature and air velocity in order to maintain thermal comfort while conserving energy.

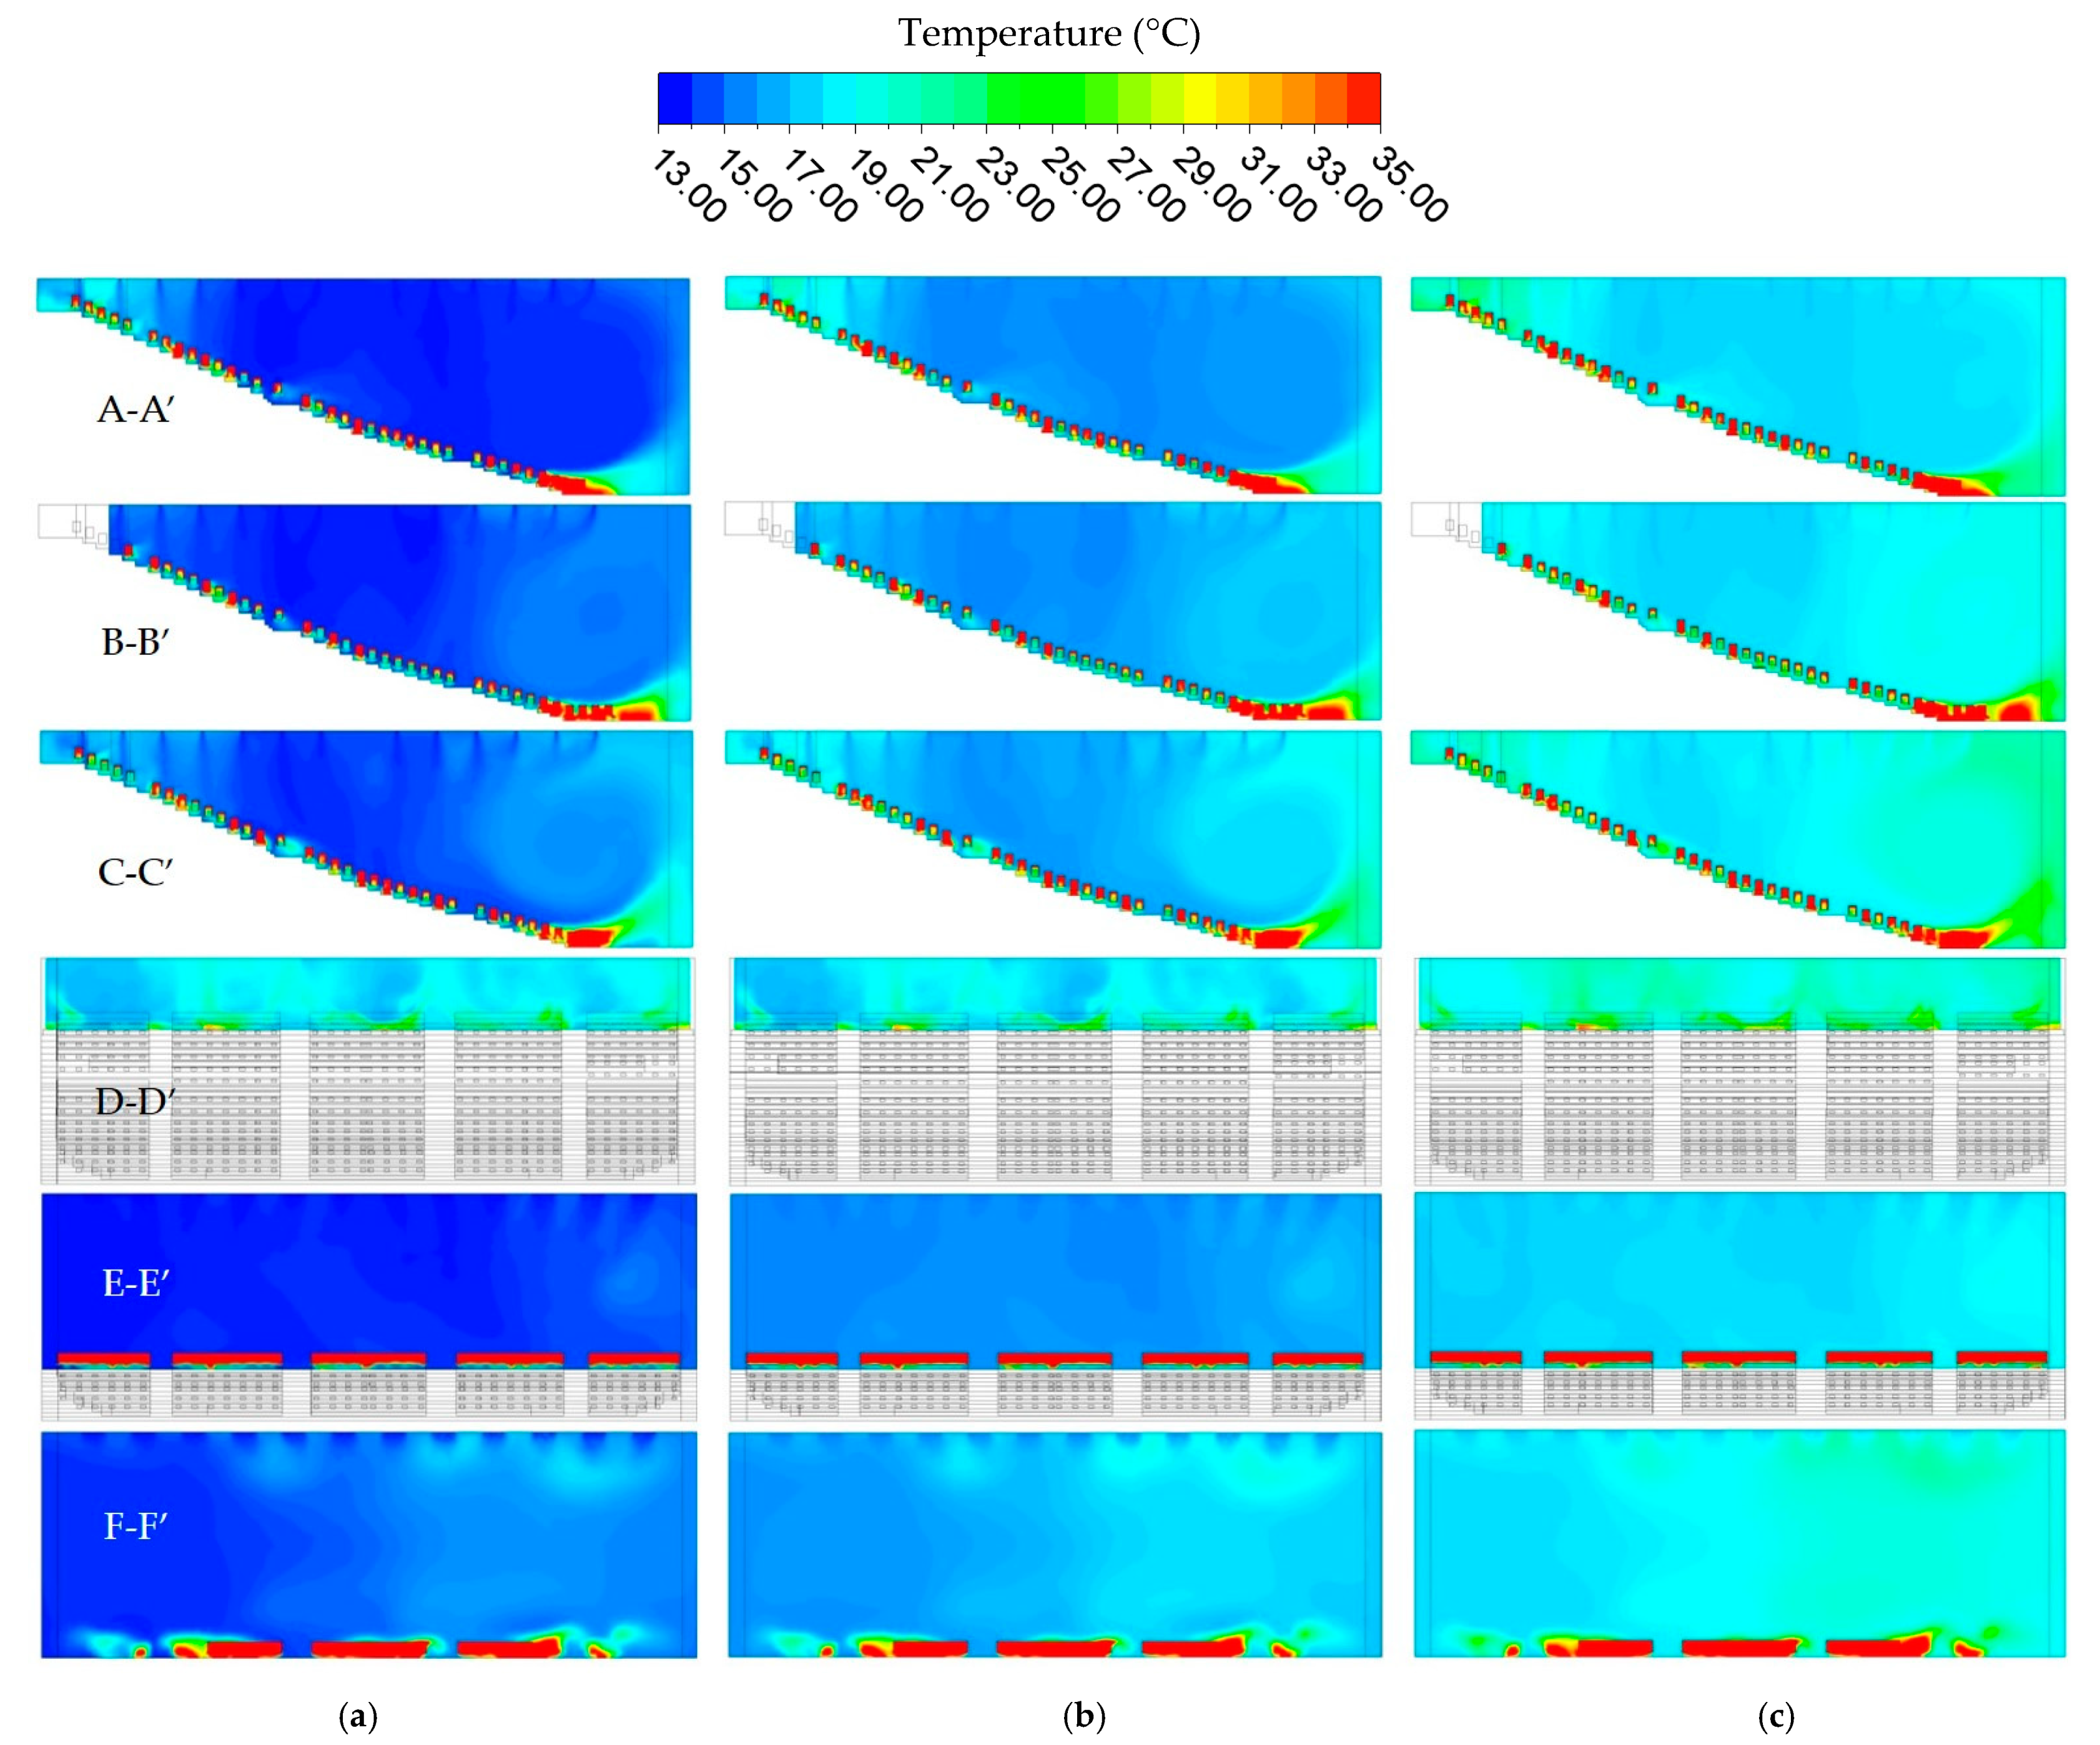
3.1. Temperature Distribution in Different Set Point

The total of six section measurement planes were carried out to investigate the temperature distribution and thermal performance in the conference hall. Figure 4a shows the simulation results with the supply air temperature setting at 13 °C and air velocity at 2 m/s. In plane A–A′, the temperature is mostly uniform in the range of 13–15 °C. Some of the temperatures are higher in the far back conference seat than in other locations. The occupants generate heat, and in that location, it did not have return air grilles, which could influence the temperature near that location. Another location is in the front seat of the conference hall. Due to the high location of supply air grilles, the air velocity decreases along with the distance from the supply air to the conference seat. However, the temperature is still around 20 °C, under the limit of comfort, which is around 25 °C. The planes B–B′ and C–C′ present almost the same trend as the cross-section in plane A–A′. The left side of section B–B′ is near the wall. There is less airflow behind, presenting a temperature slightly lower than in planes A–A′ and C–C′. In plane D–D′, the cross-section is located between the supply air grilles so that the temperature distribution will be higher than in the other cross-section plane. The temperature distribution is around 17 to 18 °C. In plane E–E′ located in the center of the conference seat, the temperature is mostly uniform around 14 °C. In addition, plane F–F′ located in the front seat of the conference hall presents a temperature distribution at around 15 °C. The temperature will be slightly higher in that location, because there is a buffer area in which the distance from the supply air grilles to the conference seat is longer. In accordance with Dong et al. [37], the air supply height, air supply velocity, and air temperature difference can all have an impact on thermal comfort and air distribution.
Figure 4b shows the simulation results with the supply air temperature setting at 15 °C and air velocity at 2 m/s. The temperature distribution in plane A–A′ is around 15–19 °C, plane B–B′ is 16–19 °C, and plane C–C′ is about 16–20 °C. Additionally, in the front view, the temperatures for planes D–D′, E–E′, and F–F′ are about 19 to 20 °C, 17 to 18 °C, and 18 to 19 °C, respectively.
Figure 4c shows the simulation results with the supply air temperature setting at 17 °C and air velocity at 2 m/s. It shows the results in the side view of plane A–A′, the indoor temperature is 19–23 °C, the plane B–B′ temperature is around 19 to 20 °C, and the plane C–C′ temperature is around 19–23 °C. The temperatures for planes D–D′, E–E′, and F–F′ are around 20–23 °C, 18 to 19 °C, and 18–21 °C, respectively.

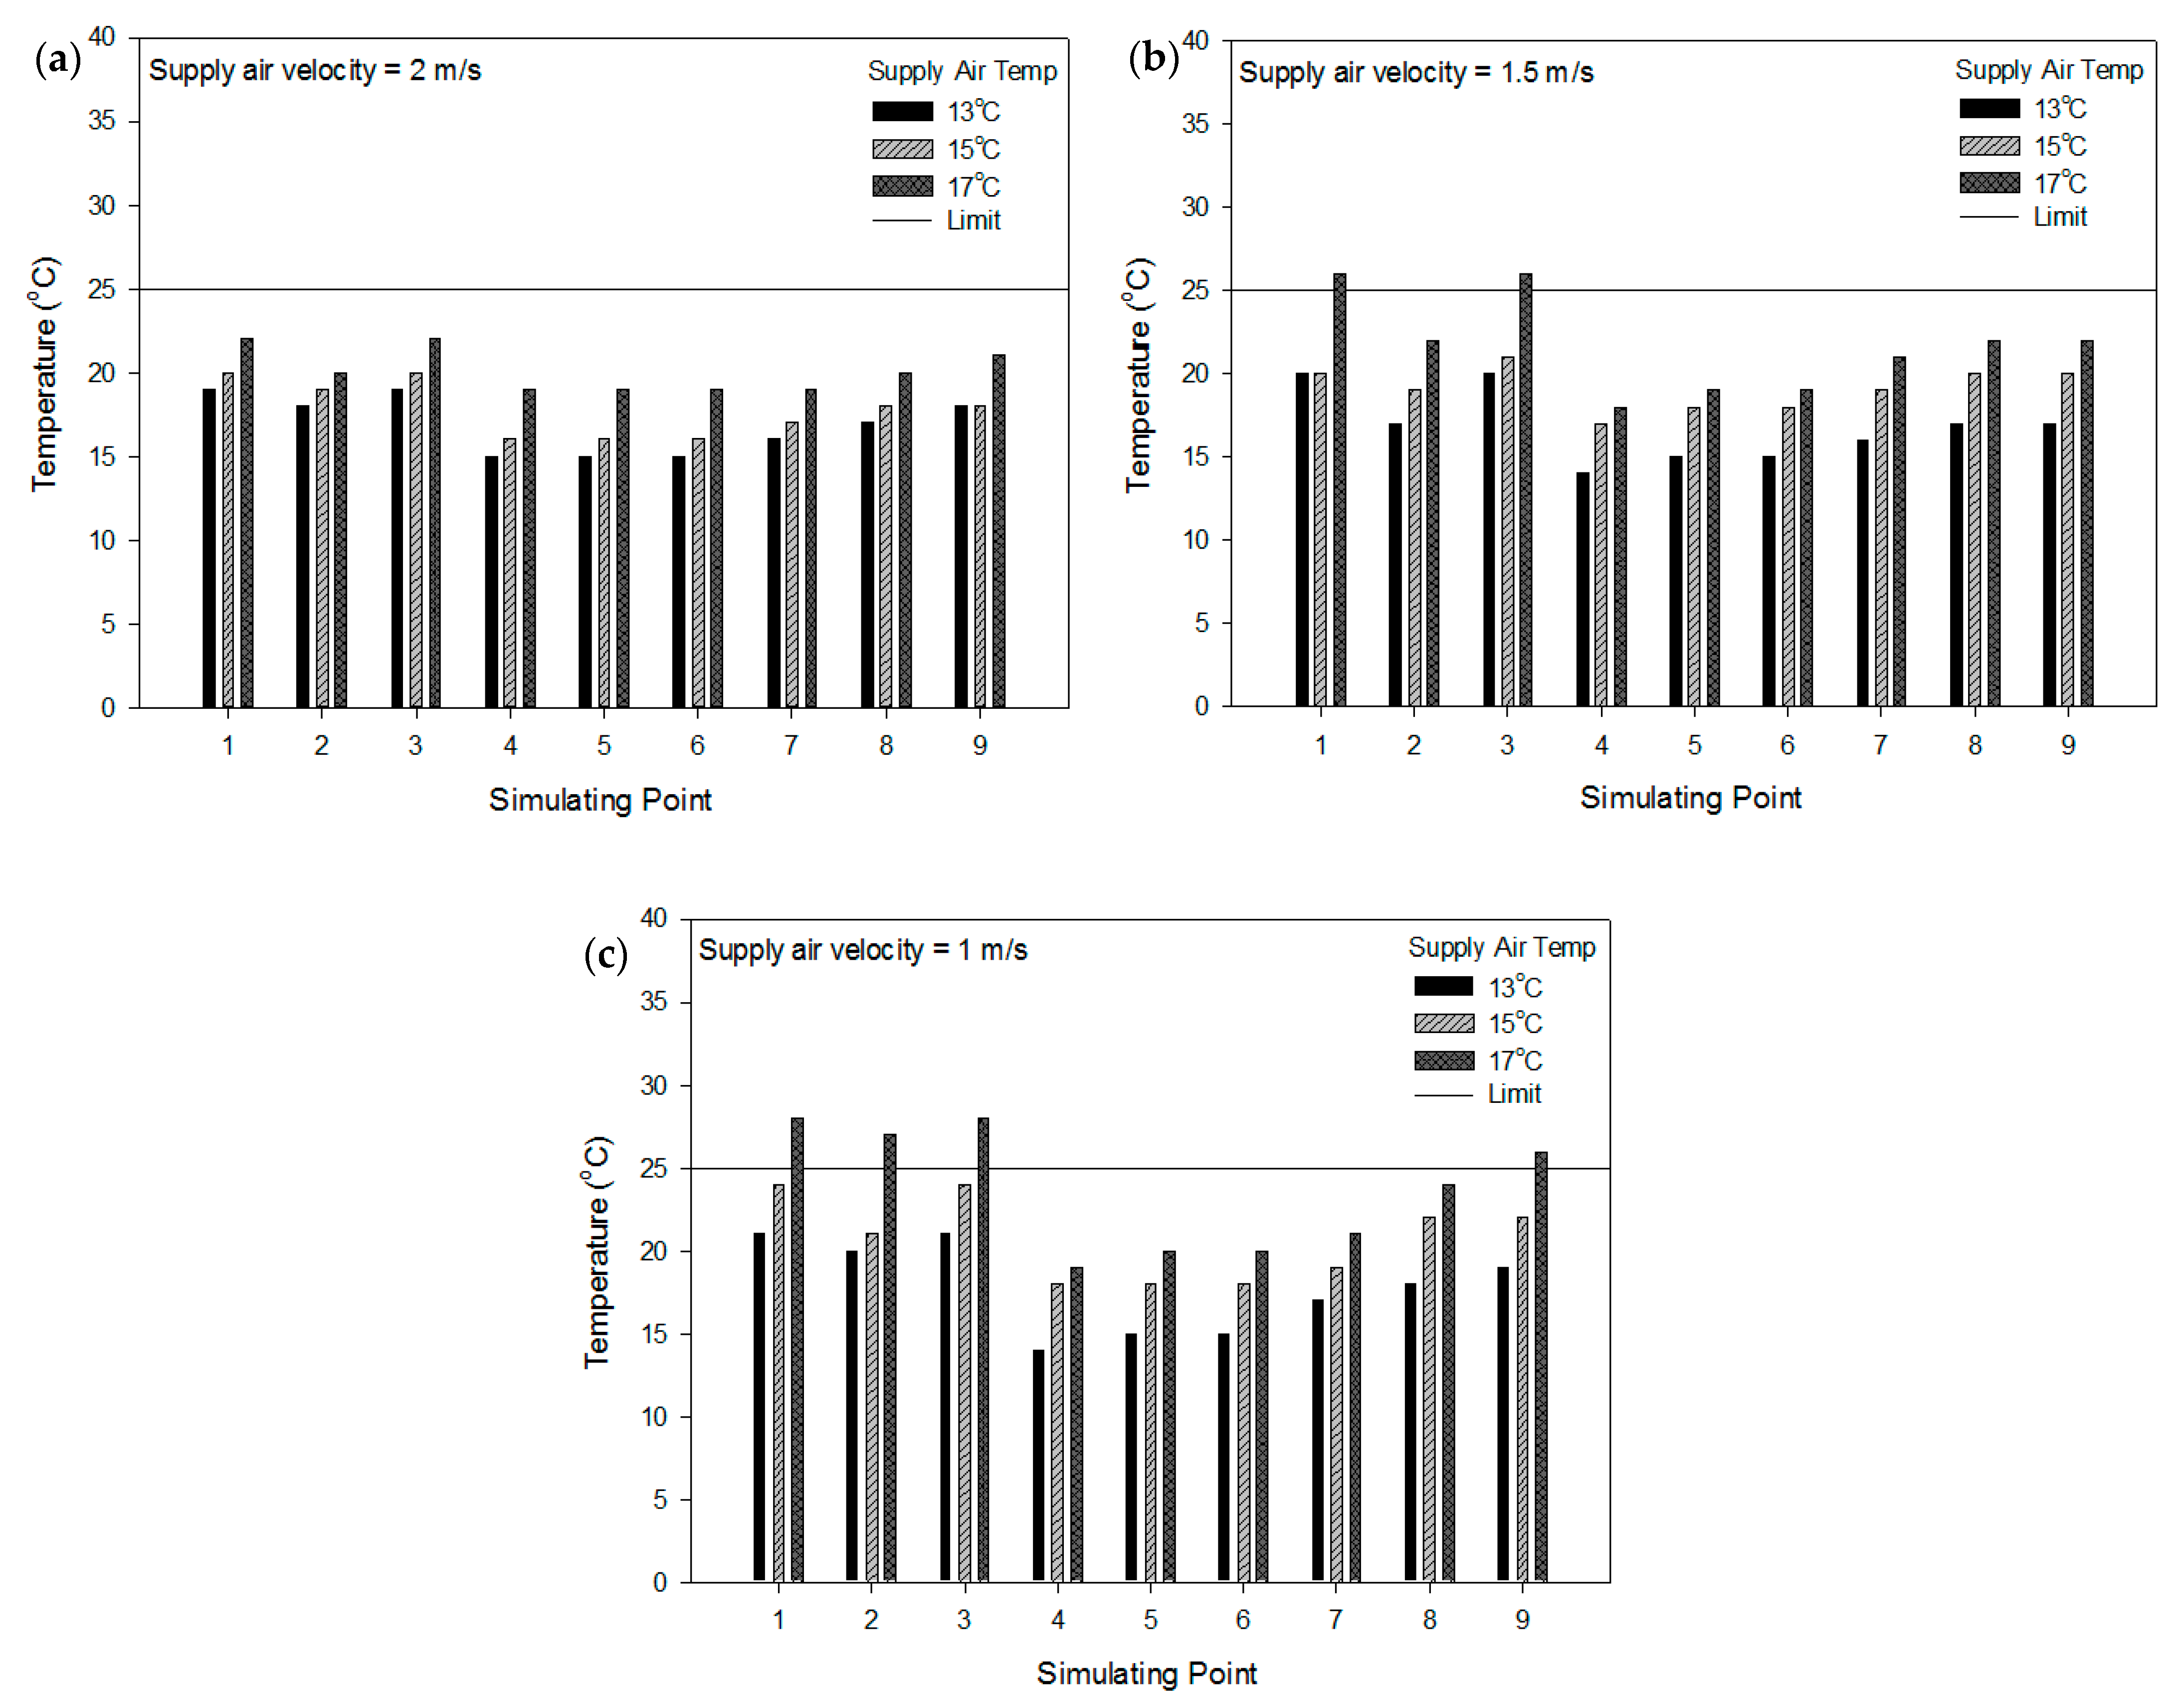
3.2. Temperature Variation Results in Different Temperature and Air Velocity Settings

The HVAC systems with different supply air temperatures and air velocities have been assessed by CFD simulation to investigate thermal comfort, as well as potential energy-saving strategies for the conference hall. Figure 5a shows temperature variation results of the conference hall with a total of nine sampling points selected to evaluate. The results revealed that all of the sampling points demonstrated a temperature variation below 25 °C. The design conditions under different supply air temperature settings at 13 °C, 15 °C, and 17 °C present the feasibility of energy-saving strategies by increasing the temperature settings accordingly. Figure 5b shows the temperature variation results with the supply air velocity settings at 1.5 m/s. The results reveal the trend is almost similar to the air velocity settings at 2 m/s. The temperature variation is below 25 °C, except at points 1 and 3, with the supply air temperature setting at 17 °C. The temperature is higher at that point because of no return grille in that area. Figure 5c shows the temperature variation results with the supply air velocity settings at 1 m/s. Some of the temperature distribution is below 25 °C. The higher temperature above 25 °C happens when the temperature settings are at 17 °C and air velocity is at 1 m/s. Sampling points 1, 2, 3, and 9 show higher temperatures than the comfort level (25 °C), which presents an unacceptable thermal condition with temperature variations around 27 to 28 °C. The design condition can achieve the thermal condition of the conference hall for most cases under different supply air temperatures and air velocities. The feasibility of reducing the air velocity from 2 m/s to 1.5 m/s and 1 m/s is possible. It also reveals the feasibility of increasing the supply air temperature from 13 °C to 15 °C and supply air velocity from 2 m/s to 1 m/s to reduce the energy consumption for the HVAC system to achieve energy efficiency.
It is necessary to take energy consumption into consideration while enhancing the occupants’ indoor thermal comfort. The indoor thermal environment design should consider the actual demands and needs for thermal comfort. Gong et al. [38] observed the thermal comfort range at operating temperatures of 20.9–27.5 °C. The results demonstrated that 24.2 °C was the neutrality temperature determined by the regression approach. In this study, the findings show that the temperature distribution, depending on the parameter selections, ranges from 18 to 26 °C, indicating a suitable indoor thermal environment. Furthermore, the best parameters should be selected to achieve a comfortable and acceptable indoor thermal environment. A configuration that delivers the supply air at a temperature of 15 °C and a velocity of 1 m/s may allow creating a comfortable indoor environment and present a neutral temperature when evaluating the PMV.

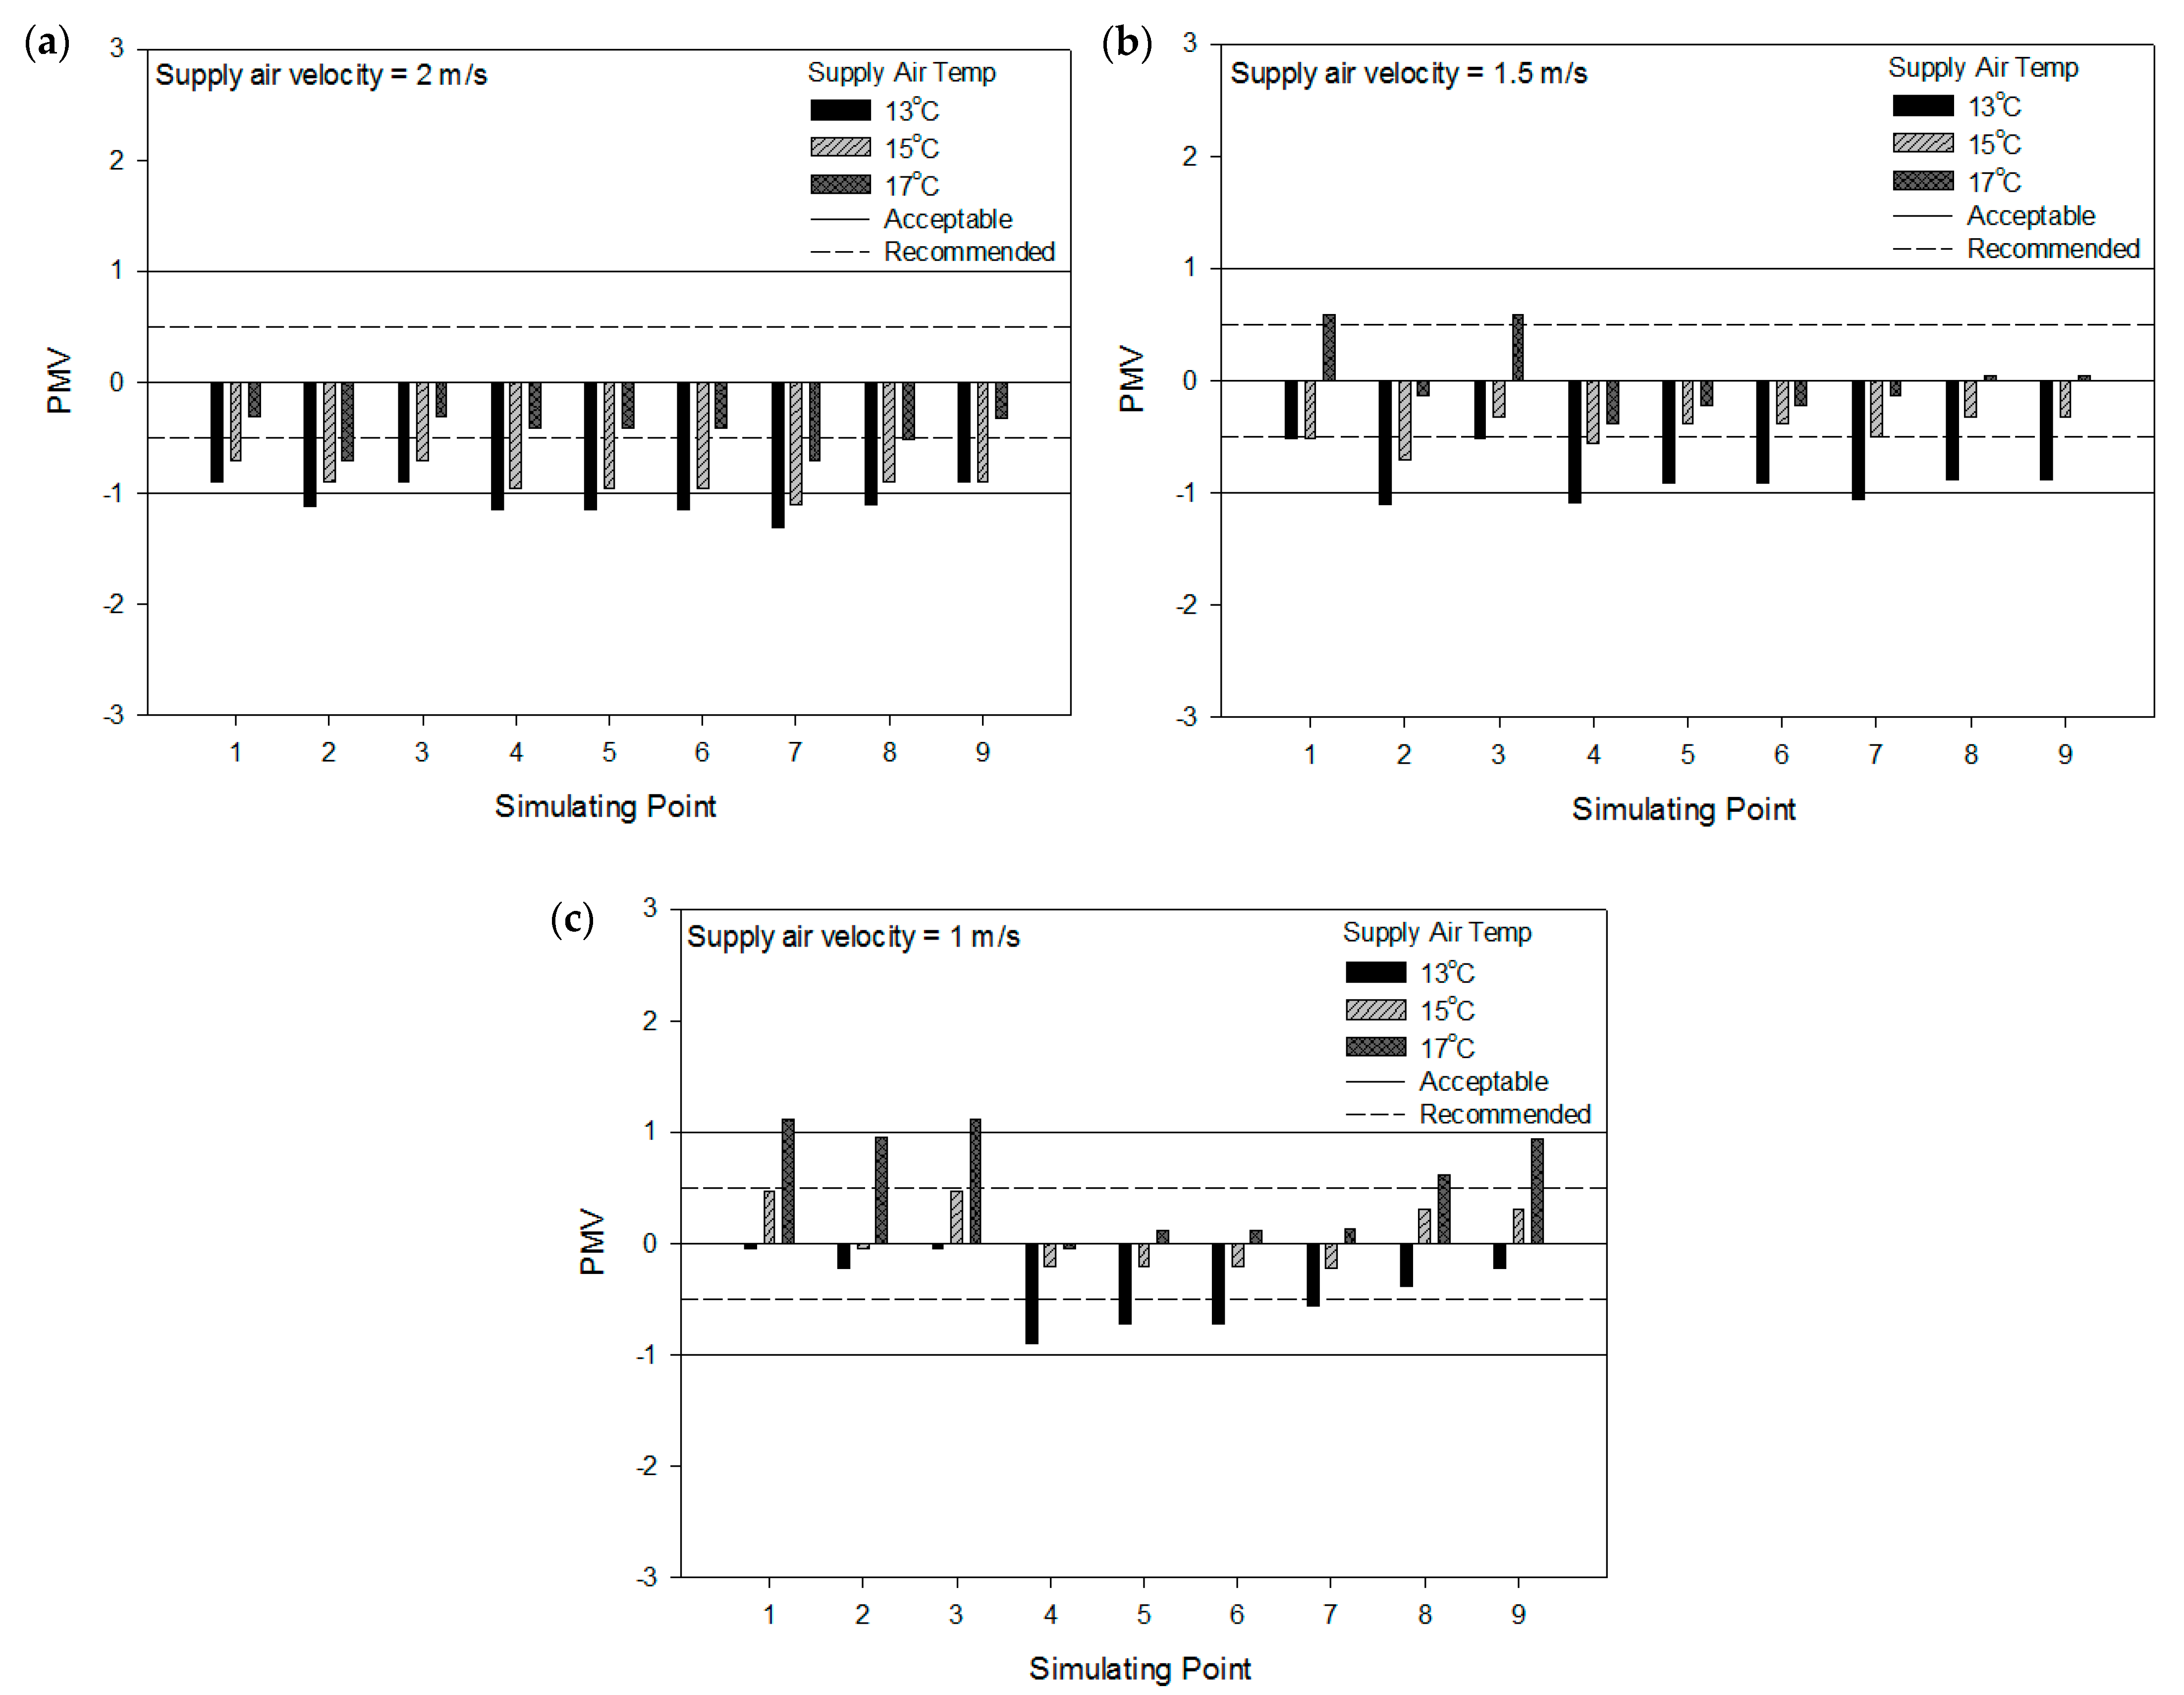
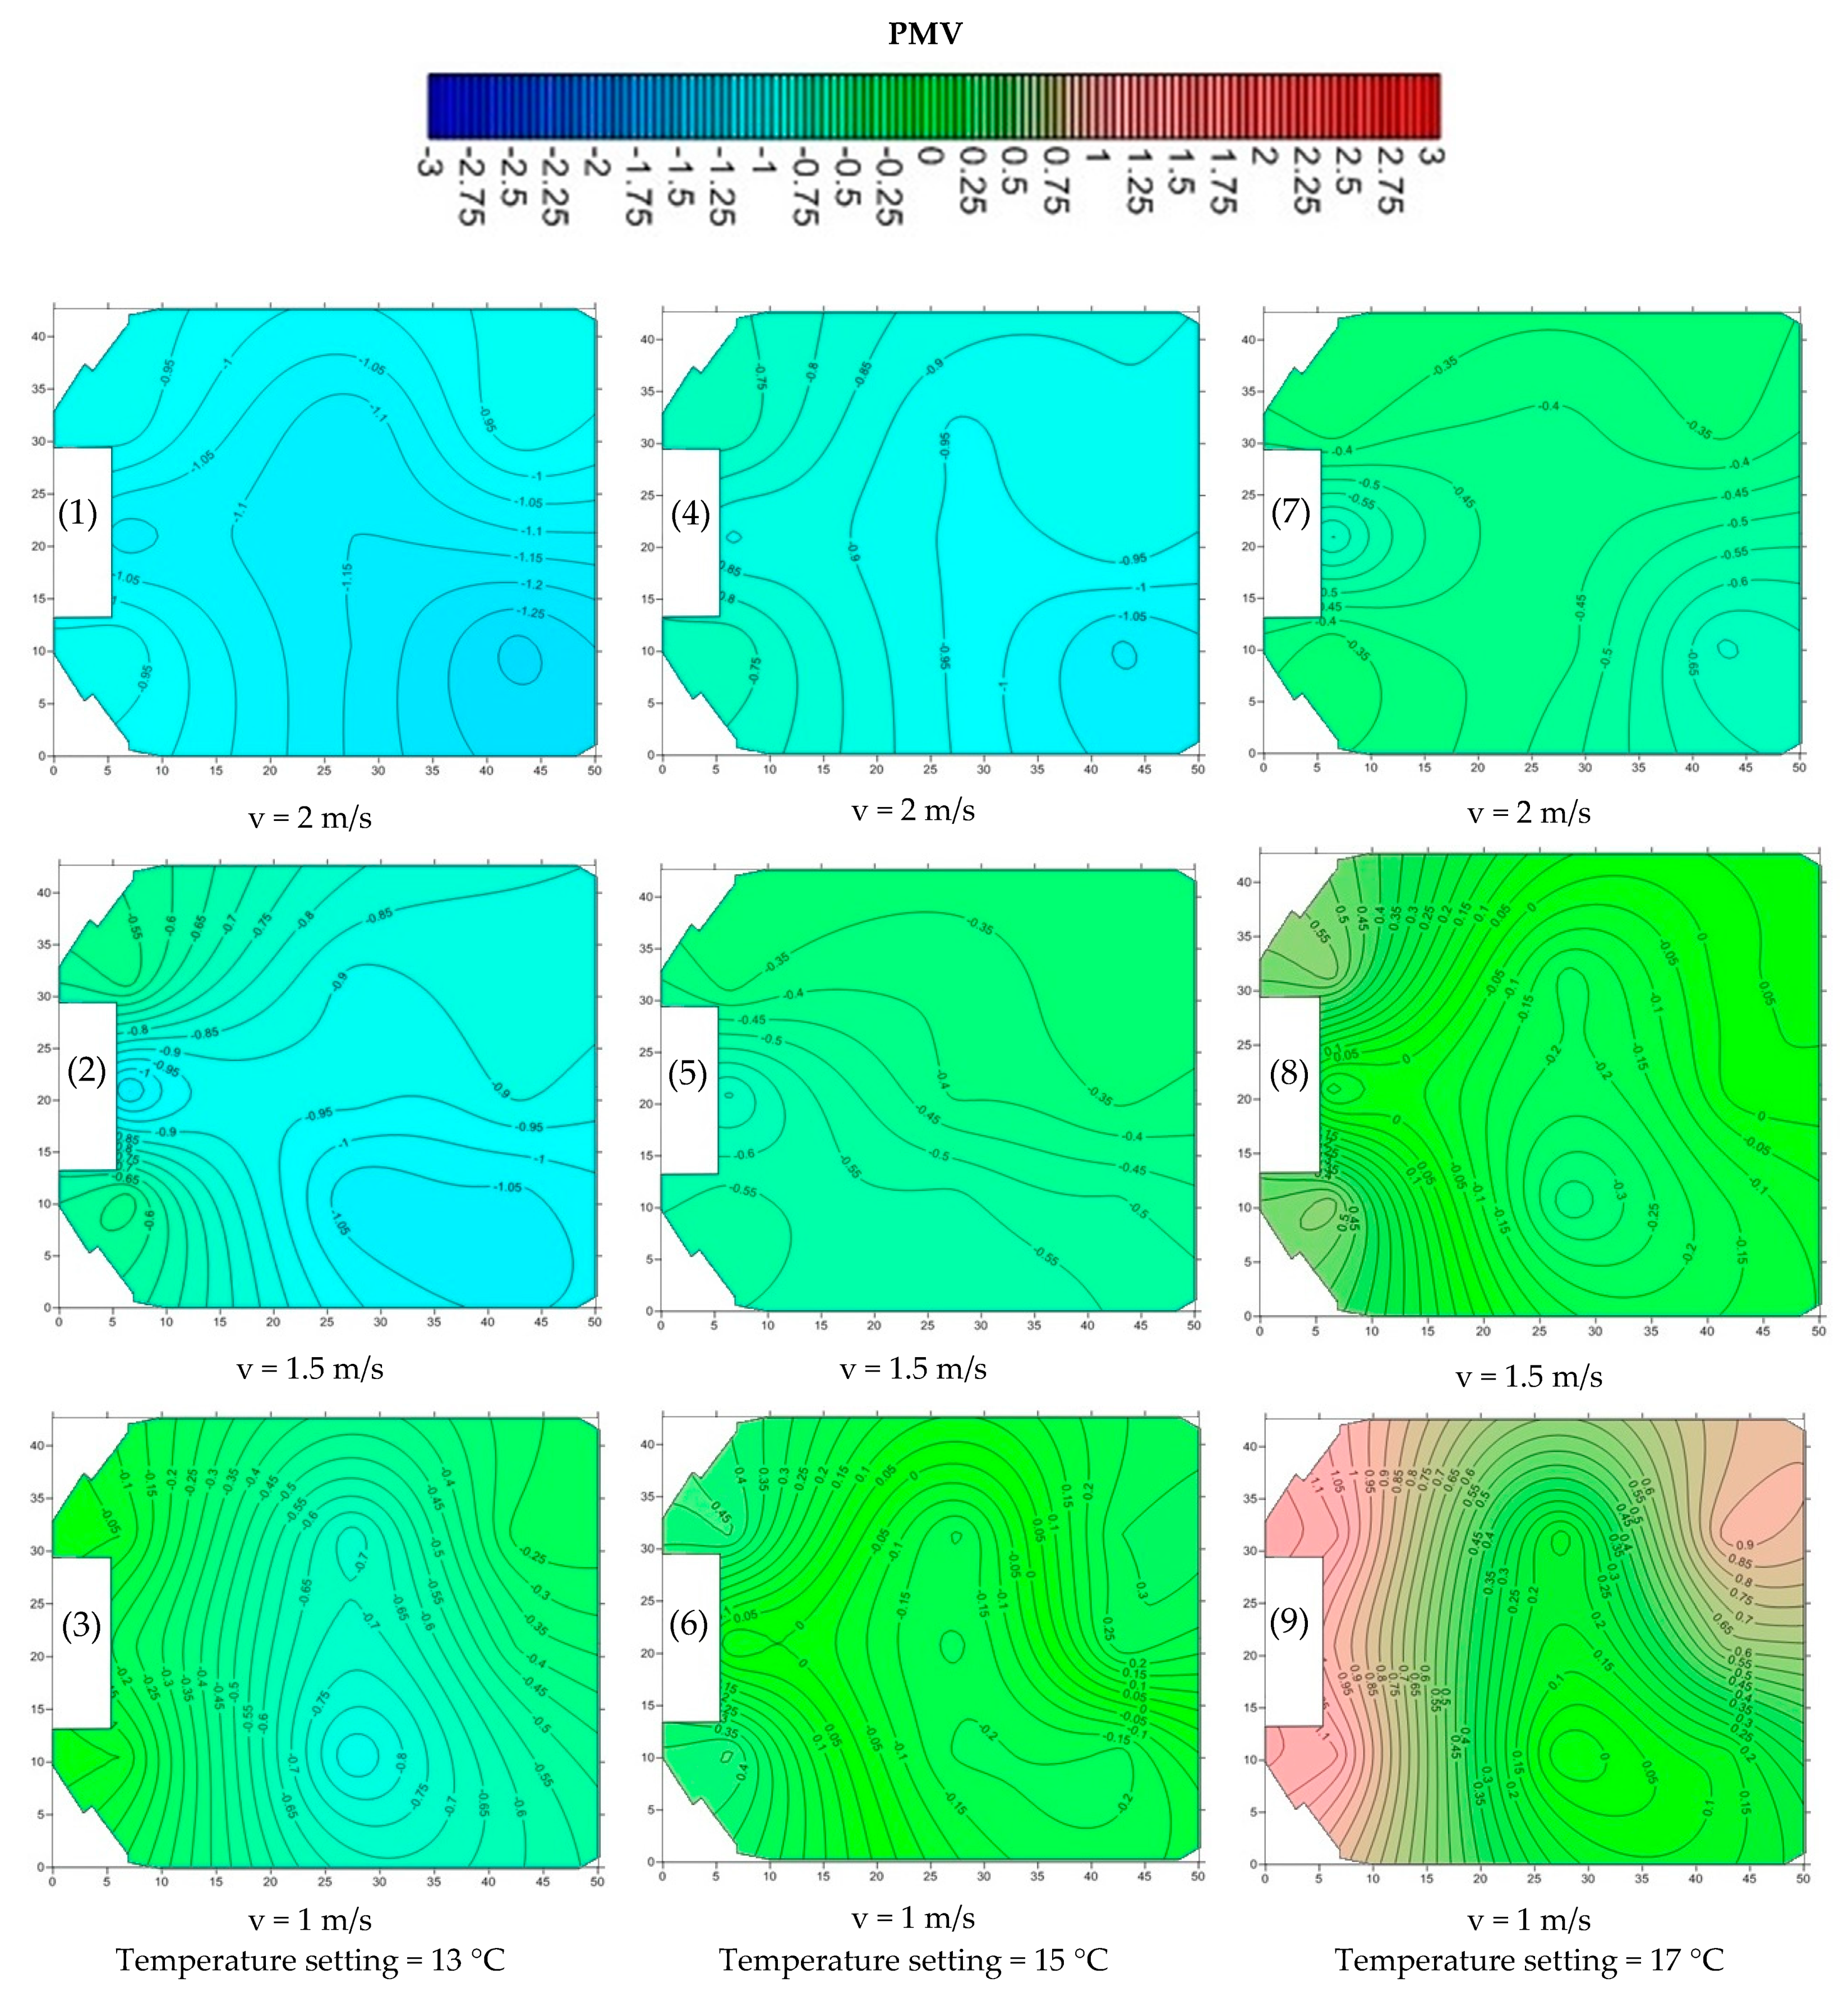
3.3. Thermal Performance

The overall thermal performance evaluation in the conference hall complies with the ASHRAE standard 55 extensively. Six parameters should be taken to calculate the thermal comfort of the PMV: supply air temperature, mean radiant temperature, air velocity, humidity, clothing level, and metabolic rate. The PMV scale is −3, −2, −1, 0, 1, 2, and 3, respectively. The nine sampling points evaluated the thermal comfort of the PMV variations under different supply air temperatures and airflow velocity settings. The PMV range between −1 and +1 could lead to acceptable thermal satisfaction; however, the predicted percentage dissatisfied (PPD) is higher than 20%. The recommended PMV index should be in the range of −0.5 to +0.5 with a PPD of 10%, which may present a neutral temperature. Similar to the study conducted by Mudher and Najeeb [39], the PMV level in the conference hall was +0.17 with a PPD value of 6.79%.
Figure 6(1) shows the PMV results with the supply air temperature settings at 13 °C and air velocity at 2 m/s. The PMV scale of sampling points 1, 3, and 9 is −0.90, which means slightly cool. The PMV of sampling points 2, 4, 5, 6, 7, 8, and 9 is more than −1, which means slightly cool. The PMV scale between −1 and 1 is still acceptable, but beyond −1 and 1 will fail to meet the requirements. When the supply air velocity is decreased to 1.5 m/s and the temperature is 13 °C (Figure 6(2)), the results show that sampling points 1 and 3 are around −0.55 and −0.6, which fall into the neutral PMV scale. Additionally, the thermal comfort of sampling points 5, 6, 8, and 9 ranges from about −0.85 to −0.95, which is slightly cool but still acceptable. The thermal comfort of sampling points 2 and 4 is about −1 and −1.05, slightly more than the −1 PMV scale. Furthermore, decreasing the supply air velocity is conducted to 1 m/s (Figure 6(3)) to present the PMV variation results. All the sampling points are between −1 and 1, which is acceptable for thermal comfort.
Figure 6(4) shows the PMV results with the supply air temperature settings at 15 °C and different supply air velocities. When the supply air velocity is at 2 m/s, the PMV variation is around −1 to 1 at sampling points 1–6, 8, and 9. The thermal comfort of sampling point 7 is −1.05, which means an unacceptable PMV. In addition, when the supply air velocity decreases to 1.5 m/s (Figure 6(5)), all sampling points are about −1 to 1, which means an acceptable thermal comfort. Meanwhile, decreasing the supply air velocity to 1 m/s (Figure 6(6)) shows the PMV variation is around −0.5 to 0.5, which means acceptable and recommended compliance with ASHRAE standard 55.
Figure 6(7) shows the PMV results with the supply air temperature settings at 17 °C and different supply air velocities. When the supply air velocity is at 2 m/s, the PMV scale of sampling points 1–9 ranges from −0.35 to −0.6, which means an acceptable PMV scale. In addition, decreasing the supply air velocity to 1.5 m/s at a constant temperature of 17 °C (Figure 6(8)) revealed the PMV variation is about −0.3 to 0.55 with the supply air temperature at 17 °C and air velocity at 1.5 m/s. Meanwhile, the PMV variation is around 0–1.1 under a temperature of 17 °C with the air velocity at 1 m/s (Figure 6(9)), which means slightly warm and unacceptable. Overall, increasing the supply air temperature and reducing the supply air velocity could be feasible in achieving the energy-saving concerns within the concern of thermal comfort.
The PMV level for the conference hall comfort was evaluated in different temperature and air velocity settings. Figure 7a shows the PMV of the sampling points is less than −1 (slight cool) under different supply air temperatures at 15 °C and 17 °C, except for the temperature setting at 13 °C, which has six sampling points larger than −1 (slight cool) and is not acceptable on the PMV scale. In addition, Figure 7b presents the thermal comfort of the PMV of the supply air velocity at 1.5 m/s under different supply air temperatures. The results reveal that a PMV less than −1 is concurs with different supply air temperatures at 15 °C and 17 °C, except with supply air temperatures at 13 °C in sampling points 2, 4, and 7, and not acceptable on PMV higher than −1. Figure 7c revealed that setting the temperature from 13 °C to 15 °C with the supply air velocity at 1 m/s is in the acceptable PMV scale range and achieves the comfort zone recommended by ASHRAE Standard 55 between −0.5 and +0.5 on the PMV scale. It presents increasing the temperature distribution as feasible to achieve the energy-saving concerns. The worst PMV is when the temperature distribution is at 13 °C and 15 °C and the air velocity is at 2 m/s (Figure 7a), the temperature distribution at 13 °C with the air velocity at 1.5 m/s (Figure 7b), and the temperature distribution at 17 °C and air velocity at 1 m/s (Figure 7c), which fail to meet the requirements of the PMV.
To find acceptable indoor environment conditions, some parameters of the temperature and air velocity settings were examined. Table 3 shows the results of the PMV index for thermal comfort. It shows the findings from the most comfortable to the most uncomfortable thermal conditions. This study discovered that a temperature setting of 15 °C and air velocity of 1 m/s distributed from supply air grilles to the conference hall could generate a suitable indoor environment for thermal conditions. The PMV value could be kept between −0.5 and 0.5. According to Espejel-Blanco et al. [40], utilizing a control zone of 0–0.5 PMV index values and calculating comfort zones using the PMV approach results in energy savings of 33–44%.

4. Conclusions

This study investigates the indoor thermal environment under different supply air temperatures and air velocity settings in the conference hall. The results complied with the international standard of ISO 7730 and ASHRAE 55 Standard for the thermal environmental conditions for human occupancy. In addition to that, a lower temperature and a higher air velocity setting could affect the thermal performance and energy issues, so they must be selected optimally. The conclusions may be drawn as follows:
  • The different supply air temperature and air velocity settings influence the indoor thermal distribution inside the conference hall, resulting in a variation of the temperature distribution from around 18 °C to 27 °C in all the different settings.
  • The temperature setting of 15 °C and air velocity of 1 m/s in experiment 6 had the optimal settings to achieve the thermal conditions.
  • Using a higher temperature setting could attain energy savings; however, the right air velocity should be considered in order could meet the indoor thermal conditions. In addition, a higher air velocity could also generate more noise, and it could interrupt the situation in the conference hall, so it must be selected optimally.

Author Contributions

Conceptualization, F.W., H.L. and I.P.; Data curation, J.S. and I.P.; Formal analysis, I.P., H.L. and J.S.; Investigation, I.P. and J.S.; Methodology, I.P.; Validation, J.S. and I.P.; Visualization, J.S. and I.P.; Writing—original draft, I.P. and H.L.; and Writing—review and editing, F.W. and I.P. All authors have read and agreed to the published version of the manuscript.

Funding

This study was supported by the Ministry of Science and Technology under grant No. MOST 109-2221-E-167-005-MY3.

Institutional Review Board Statement

Not applicable.

Informed Consent Statement

Not applicable.

Data Availability Statement

The data presented in this study are available on request from the corresponding author.

Conflicts of Interest

The authors declare no conflict of interest.

References

  1. ISO 7730; Ergonomics of the Thermal Environment—Analytical Determination and Interpretation of Thermal Comfort Using Calculation of the PMV and PPD indices and Local Thermal Comfort Criteria. International Standards Organization: Geneva, Switzerland, 2005.
  2. Han, J.; Bae, J.; Jang, J.; Baek, J.; Leigh, S.-B. The Derivation of Cooling Set-Point Temperature in an HVAC System, Considering Mean Radiant Temperature. Sustainability 2019, 11, 5417. [Google Scholar] [CrossRef]
  3. De Faria, L.C.; de Andrade Romero, M.; Porras-Amores, C.; de Souza Pirró, L.F.; Saez, P.V. Prediction of the Impact of Air Speed Produced by a Mechanical Fan and Operative Temperature on the Thermal Sensation. Buildings 2022, 12, 101. [Google Scholar] [CrossRef]
  4. Wang, H.; Luo, M.; Wang, G.; Li, X. Airflow pattern induced by ceiling fan under different rotation speeds and blowing directions. Indoor Built Environ. 2020, 29, 1425–1440. [Google Scholar] [CrossRef]
  5. Yu, S.-Y.; Matzarakis, A.; Lin, T.-P. A Study of the Thermal Environment and Air Quality in Hot–Humid Regions during Running Events in Southern Taiwan. Atmosphere 2020, 11, 1101. [Google Scholar] [CrossRef]
  6. Kakoulli, C.; Kyriacou, A.; Michaelides, M.P. A Review of Field Measurement Studies on Thermal Comfort, Indoor Air Quality and Virus Risk. Atmosphere 2022, 13, 191. [Google Scholar] [CrossRef]
  7. Wang, X.; Yang, Y.; Xu, Y.; Wang, F.; Zhang, Q.; Huang, C.; Shi, C. Prediction of vertical thermal stratification of large space buildings based on Block-Gebhart model: Case studies of three typical hybrid ventilation scenarios. J. Build. Eng. 2021, 41, 102452. [Google Scholar] [CrossRef]
  8. Ren, Y.; Li, D. Simulation of air distribution in large space. In Proceedings of the 2011 International Conference on Remote Sensing, Environment and Transportation Engineering, Nanjing, China, 24–26 June 2011. [Google Scholar]
  9. Kamar, H.M.; Kamsah, N.B.; Ghaleb, F.A.; Alhamid, M.I. Enhancement of thermal comfort in a large space building. Alex. Eng. J. 2019, 58, 49–65. [Google Scholar] [CrossRef]
  10. Oh, W.; Kato, S. The effect of airspeed and wind direction on human’s thermal conditions and air distribution around the body. Build. Environ. 2018, 141, 103–116. [Google Scholar] [CrossRef]
  11. Zhu, H.C.; Yu, C.W.; Cao, S.J. Ventilation online monitoring and control system from the perspectives of technology application. Indoor Built Environ. 2020, 29, 587–602. [Google Scholar] [CrossRef]
  12. Lipinski, T.; Ahmad, D.; Serey, N.; Jouhara, H. Review of ventilation strategies to reduce the risk of disease transmission in high occupancy buildings. Int. J. Thermofluid. 2020, 7, 100045. [Google Scholar] [CrossRef]
  13. Fan, X.; Yu, T.; Liu, P.; Li, X. Uniformity of Supply Air in the Plenum for Under-Floor Air Distribution Ventilation in a Circular Conference Room: A CFD Study. Energies 2022, 15, 6370. [Google Scholar] [CrossRef]
  14. Ye, X.; Zhu, H.; Kang, Y.; Zhong, K. Heating energy consumption of impinging jet ventilation and mixing ventilation in large-height spaces: A comparison study. Energy Build. 2016, 130, 697–708. [Google Scholar] [CrossRef]
  15. Cheung, T.; Schiavon, S.; Parkinson, T.; Li, P.; Brager, G. Analysis of the accuracy on PMV-PPD model using the ASHRAE Global Thermal Comfort Database II. Build. Environ. 2019, 153, 205–217. [Google Scholar] [CrossRef]
  16. Lamberti, G. Critical overview of heat balance, adaptive, local discomfort models to predict thermal comfort in buildings. In Proceedings of the 2021 IEEE International Conference on Environment and Electrical Engineering and 2021 IEEE Industrial and Commercial Power Systems Europe (EEEIC/I & CPS Europe), Bari, Italy, 7–10 September 2021. [Google Scholar]
  17. Zhao, Q.; Lian, Z.; Lai, D. Thermal comfort models and their developments: A review. Energy Built Environ. 2021, 2, 21–33. [Google Scholar] [CrossRef]
  18. Amoabeng, K.O.; Opoku, R.; Boahen, S.; Obeng, G.Y. Analysis of indoor set-point temperature of split-type ACs on thermal comfort and energy savings for office buildings in hot-humid climates. Energy Built Environ. 2022, in press. [Google Scholar] [CrossRef]
  19. Ghanta, N.; Kongoletos, J.; Glicksman, L. Comfort control and improved thermostat location in conference rooms and academic working spaces. Build. Environ. 2021, 205, 108192. [Google Scholar] [CrossRef]
  20. Niemann, P.; Schmitz, G. Impacts of occupancy on energy demand and thermal comfort for a large-sized administration building. Build. Environ. 2020, 182, 107027. [Google Scholar] [CrossRef]
  21. Chai, J.; Fan, J. Advanced thermal regulating materials and systems for energy saving and thermal comfort in buildings. Mater. Today Energy 2022, 24, 100925. [Google Scholar] [CrossRef]
  22. Department of Climate Change, Energy, the Environment and Water of The Australian Government. HVAC Factsheet. HVAC Energy Breakdown. 2013. Available online: https://www.energy.gov.au/publications/hvac-factsheet-basics-hvac-energy-efficiency (accessed on 7 July 2022).
  23. Kükrer, E.; Eskin, N. Effect of design and operational strategies on thermal comfort and productivity in a multipurpose school building. J. Build. Eng. 2021, 44, 102697. [Google Scholar] [CrossRef]
  24. Karimimoshaver, M.; Shahrak, M.S. The effect of height and orientation of buildings on thermal comfort. Sustain. Cities Soc. 2022, 79, 103720. [Google Scholar] [CrossRef]
  25. Wu, P.; Zhou, J.; Li, N. Influences of atrium geometry on the lighting and thermal environments in summer: CFD simulation based on-site measurements for validation. Build. Environ. 2021, 197, 107853. [Google Scholar] [CrossRef]
  26. Aryal, A.; Chaiwiwatworakul, P.; Chirarattananon, S.; Wongsuwan, W. Subjective assessment of thermal comfort by radiant cooling in a tropical hot humid climate. Energy Build. 2022, 254, 111601. [Google Scholar] [CrossRef]
  27. Al-Absi, Z.A.; Hafizal, M.I.M.; Ismail, M.; Mardiana, A.; Ghazali, A. Peak indoor air temperature reduction for buildings in hot-humid climate using phase change materials. Case Stud. Therm. Eng. 2020, 22, 100762. [Google Scholar] [CrossRef]
  28. Kitagawa, H.; Asawa, T.; Kubota, T.; Trihamdani, A.R.; Sakurada, K.; Mori, H. Optimization of window design for ventilative cooling with radiant floor cooling systems in the hot and humid climate of Indonesia. Build. Environ. 2021, 188, 107483. [Google Scholar] [CrossRef]
  29. Duan, Z.; Sun, Y.; Wang, M.; Hu, R.; Dong, X. Evaluation of Mixed-Mode Ventilation Thermal Performance and Energy Saving Potential from Retrofitting a Beijing Office Building. Buildings 2022, 12, 793. [Google Scholar] [CrossRef]
  30. Gokarakonda, S.; van Treeck, C.; Rawal, R. Investigating Optimum Cooling Set Point Temperature and Air Velocity for Thermal Comfort and Energy Conservation in Mixed-Mode Buildings in India. Energies 2022, 15, 2259. [Google Scholar] [CrossRef]
  31. Nasrollahi, N.; Ghobadi, P. Field measurement and numerical investigation of natural cross-ventilation in high-rise buildings; Thermal comfort analysis. App. Therm. Eng. 2022, 211, 118500. [Google Scholar] [CrossRef]
  32. Jia, L.-R.; Han, J.; Chen, X.; Li, Q.-Y.; Lee, C.-C.; Fung, Y.-H. Interaction between Thermal Comfort, Indoor Air Quality and Ventilation Energy Consumption of Educational Buildings: A Comprehensive Review. Buildings 2021, 11, 591. [Google Scholar] [CrossRef]
  33. ANSYS. Ansys Fluent, Workbench 2020 R2. Available online: https://www.scribd.com/document/478910198/ANSYS-Fluent-Tutorial-Guide-2020-R2-pdf (accessed on 6 March 2021).
  34. De Dear, R.J.; Arens, E.; Hui, Z.; Oguro, M. Convective and radiative heat transfer coefficients for individual human body segments. Int. J. Biometeorol. 1997, 40, 141–156. [Google Scholar] [CrossRef]
  35. Wang, F.; Permana, I.; Lee, K.; Rakshit, D.; Rosulindo, P.P. Improvement of Airflow Distribution and Contamination Control for a Biotech Cleanroom. Atmosphere 2022, 13, 335. [Google Scholar] [CrossRef]
  36. ASHRAE Standard Committee. ANSI/ASHRAE Standard-55, Thermal Environmental Conditions for Human Occupancy; American Society of Heating, Refrigerating, and Air-Conditioning Engineers, Inc.: Atlanta, GA, USA, 2017. [Google Scholar]
  37. Dong, Z.; Zhang, L.; Yang, Y.; Li, Q.; Huang, H. Numerical Study on Coupled Operation of Stratified Air Distribution System and Natural Ventilation under Multi-Variable Factors in Large Space Buildings. Energies 2021, 14, 8130. [Google Scholar] [CrossRef]
  38. Gong, X.; Meng, Q.; Yu, Y. A Field Study on Thermal Comfort in Multi-Storey Residential Buildings in the Karst Area of Guilin. Sustainability 2021, 13, 12764. [Google Scholar] [CrossRef]
  39. Mudher, M.A.; Najeeb, A.A. Numerical study of thermal comfort levels in a conference hall. Anbar J. Eng. Sci. 2020, 8, 268–281. [Google Scholar]
  40. Espejel-Blanco, D.F.; Hoyo-Montaño, J.A.; Arau, J.; Valencia-Palomo, G.; García-Barrientos, A.; Hernández-De-León, H.R.; Camas-Anzueto, J.L. HVAC Control System Using Predicted Mean Vote Index for Energy Savings in Buildings. Buildings 2022, 12, 38. [Google Scholar] [CrossRef]
Figure 1. The investigated conference hall: (a) geometry and (b) schematic diagram.
Buildings 12 01418 g001
Figure 2. Grid independence test at supply air temperature 13 °C and air velocity 2 m/s.
Buildings 12 01418 g002
Figure 3. Testing location: (a) measurement points and cross-section plane and (b) coordinates points.
Buildings 12 01418 g003
Figure 4. Temperature distribution results in different temperature and air velocity at 2 m/s. (a) temperature setting: 13 °C, (b) temperature setting: 15 °C, and (c) temperature setting: 17 °C.
Buildings 12 01418 g004
Figure 5. Temperature variation results in different temperature and air velocity settings. (a) supply air velocity at 2 m/s, (b) supply air velocity at 1.5 m/s, and (c) supply air velocity at 1 m/s.
Buildings 12 01418 g005
Figure 6. Thermal comfort distribution results in different temperature and air velocity settings.
Buildings 12 01418 g006
Figure 7. PMV variation results in different temperature and air velocity settings. (a) supply air velocity at 2 m/s, (b) supply air velocity at 1.5 m/s, and (c) supply air velocity at 1 m/s.
Buildings 12 01418 g007
Table 1. Experimental plan settings.
Number of ExperimentTemperature (°C)Air Velocity (m/s)
1132
2131.5
3131
4152
5151.5
6151
7172
8171.5
9171
Table 2. The boundary condition for the numerical simulations.
ParameterTypeTemperatureAir VelocityHeat Transfer Coeff.
Supply AirVelocity Inlet13 °C (base line case)
15 °C and 17 °C
2 m/s (baseline case)
1.5 m/s and 1 m/s
-
Return AirPressure Outlet20 °C--
OccupantHeat Transfer Coefficient--4.5 W/m2/K
Table 3. Experiment results of the indoor environment for the thermal conditions.
Number of
Experiment
Temperature
(°C)
Velocity
(m/s)
PMV in Each PointNote
P1P2P3P4P5P6P7P8P9
1132−0.91−1.13−0.91−1.15−1.15−1.15−1.32−1.11−0.908
2131.5−0.52−1.11−0.52−1.10−0.92−0.92−1.07−0.88−0.887
3131−0.05−0.23−0.05−0.90−0.73−0.73−0.57−0.39−0.225
4152−0.71−0.91−0.71−0.96−0.96−0.96−1.11−0.90−0.906
5151.5−0.52−0.71−0.33−0.57−0.39−0.39−0.51−0.33−0.332
61510.46−0.050.46−0.21−0.21−0.21−0.220.300.301
7172−0.31−0.71−0.31−0.42−0.42−0.42−0.71−0.52−0.334
8171.50.58−0.130.58−0.39−0.22−0.22−0.140.040.043
91711.120.951.12−0.050.120.120.130.620.939
Publisher’s Note: MDPI stays neutral with regard to jurisdictional claims in published maps and institutional affiliations.

