
The Influence of Transient Changes in Indoor and Outdoor Thermal Comfort on the Use of Outdoor Space by Older Adults in the Nursing Home


Abstract
1. Introduction
2. Material and Methods
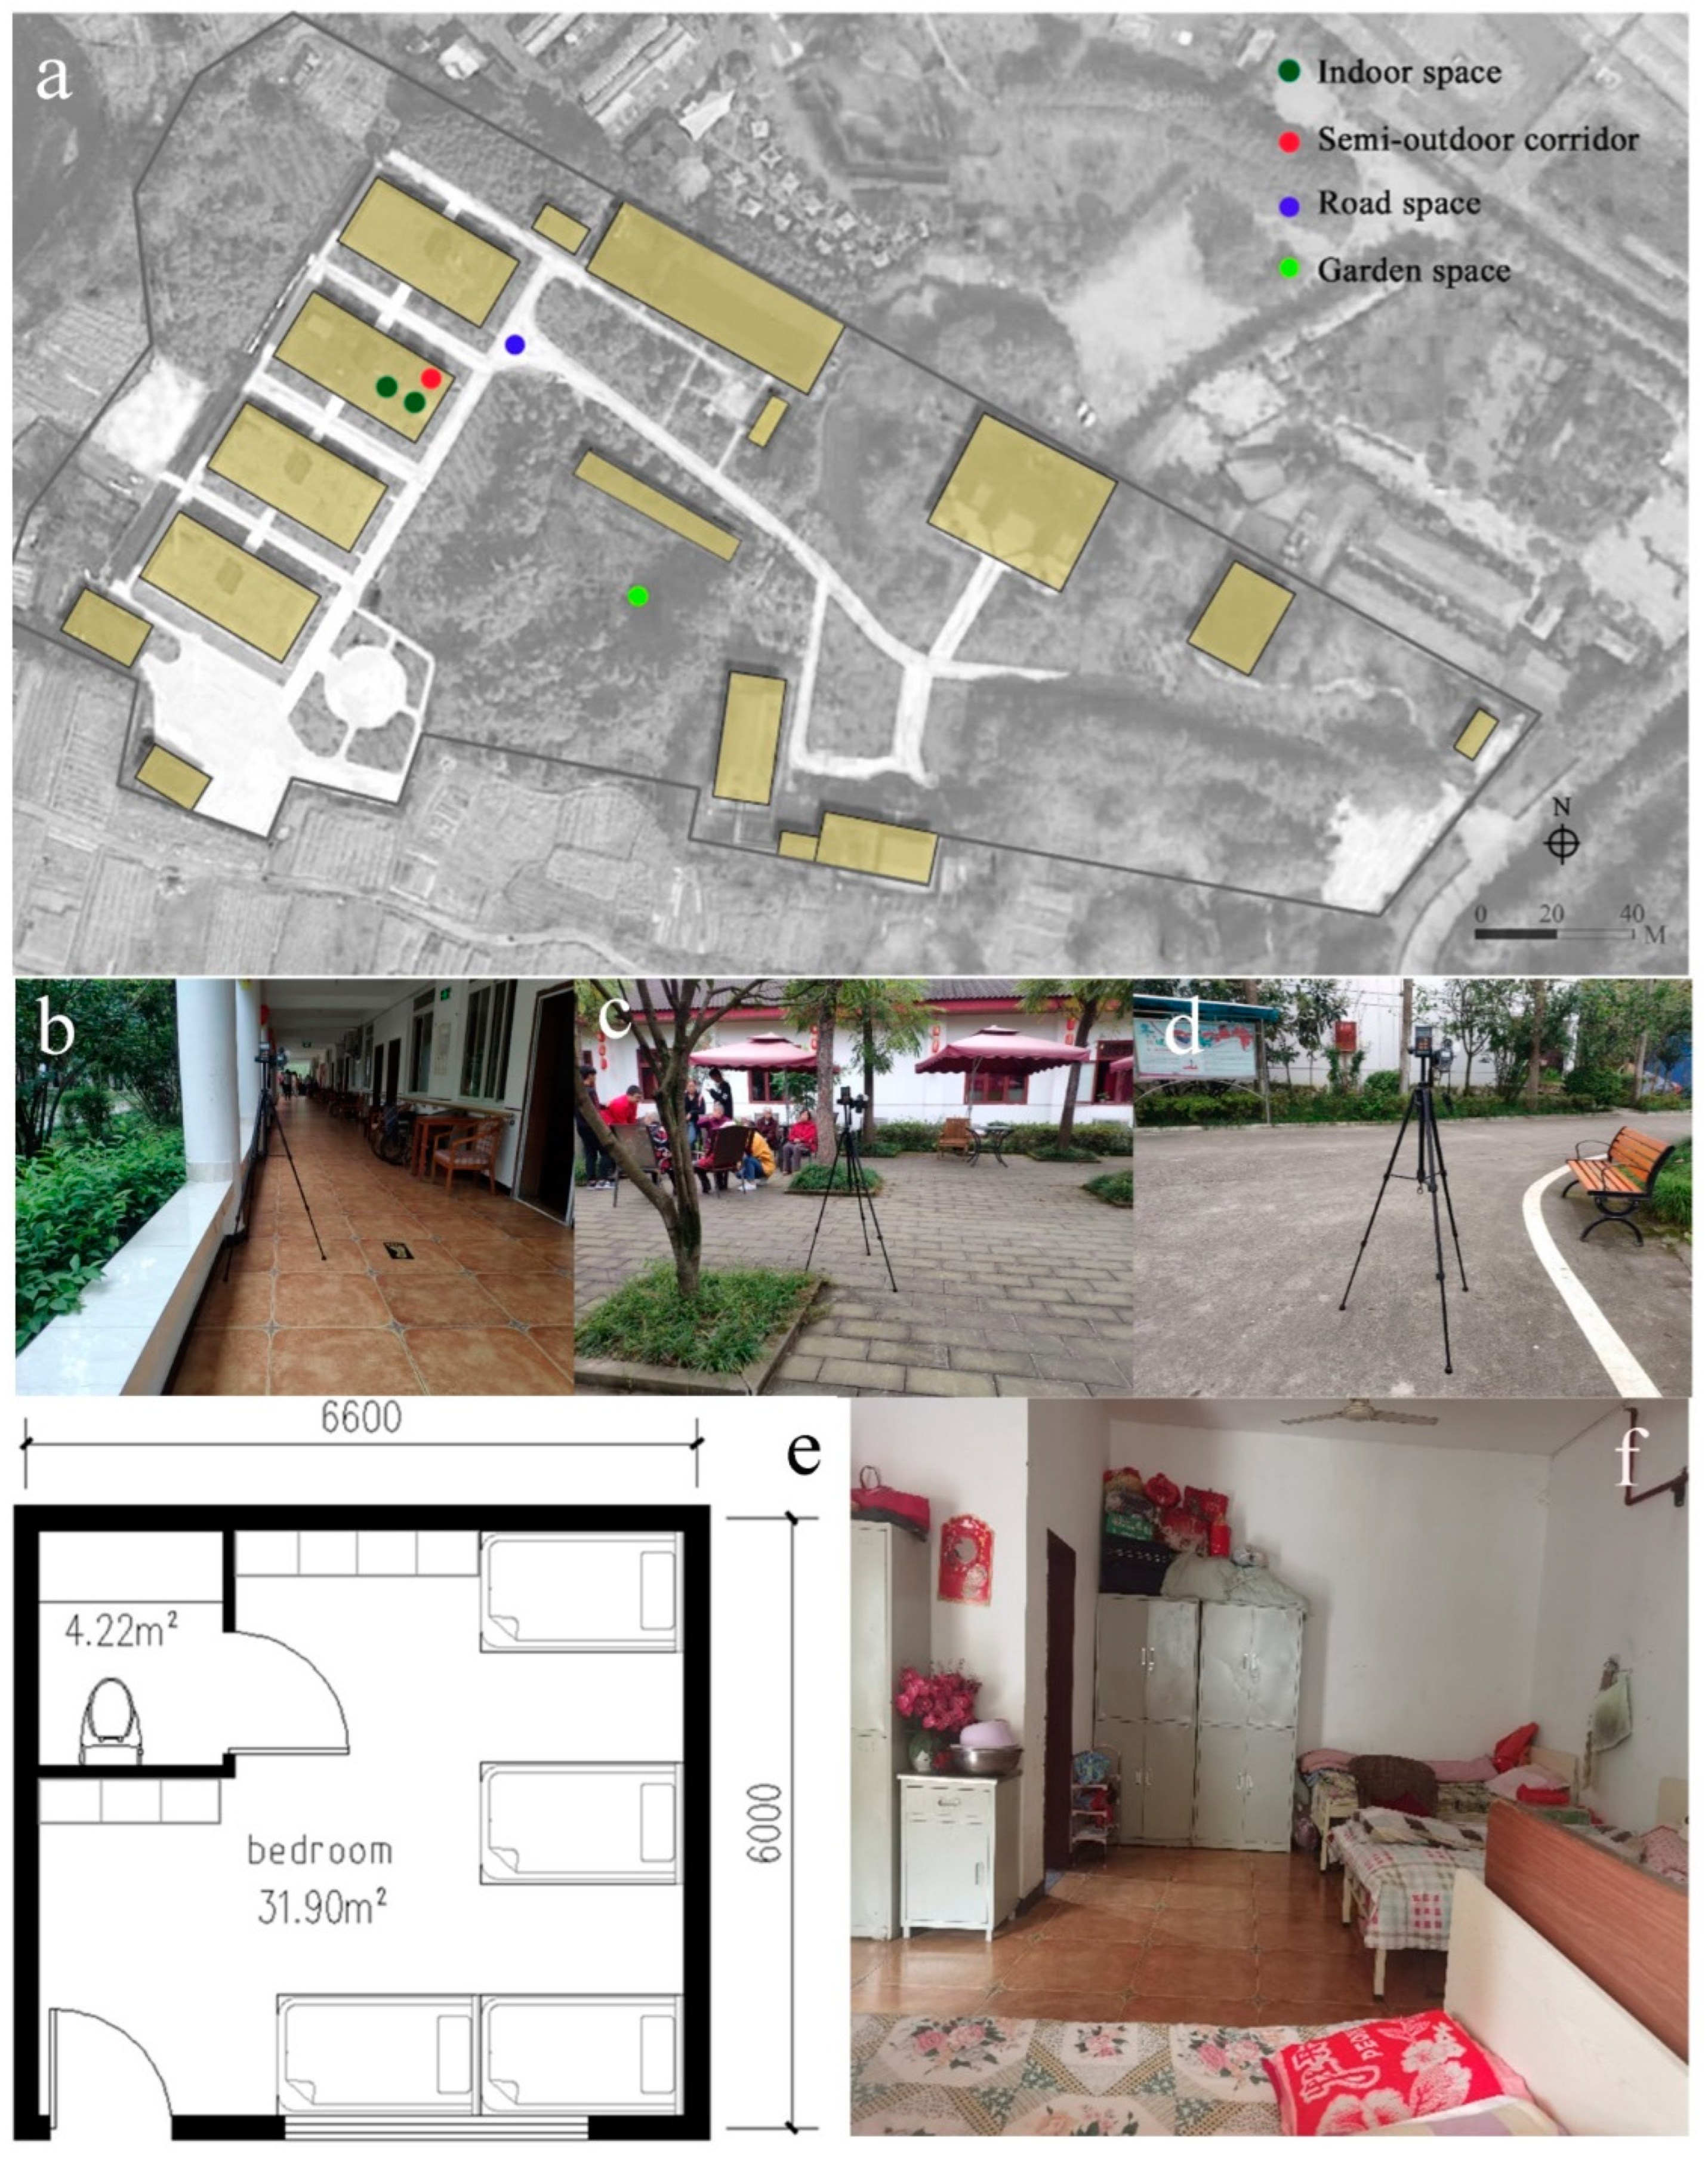
2.1. Sample Selection
2.2. Instruments and Measurement Methods
2.3. Elders Observations
- IClo is the total clothing insulation value;
- IClu,i is the insulation value for each piece of clothing in the unit of Clo.
2.4. Data Analysis Methods
- Tmrt (°C) is the mean radiant temperature, which was calculated with Equation (3);
- WS(x = 10) is the wind speed at a height of 10 m above the ground, and was calculated using Equation (4);
- ε is the emissivity of the globe which is normally assumed as 0.95 [45];
- D is the diameter of the globe (m), and the diameter of the globe (0.075 m) used in this study.
3. Results
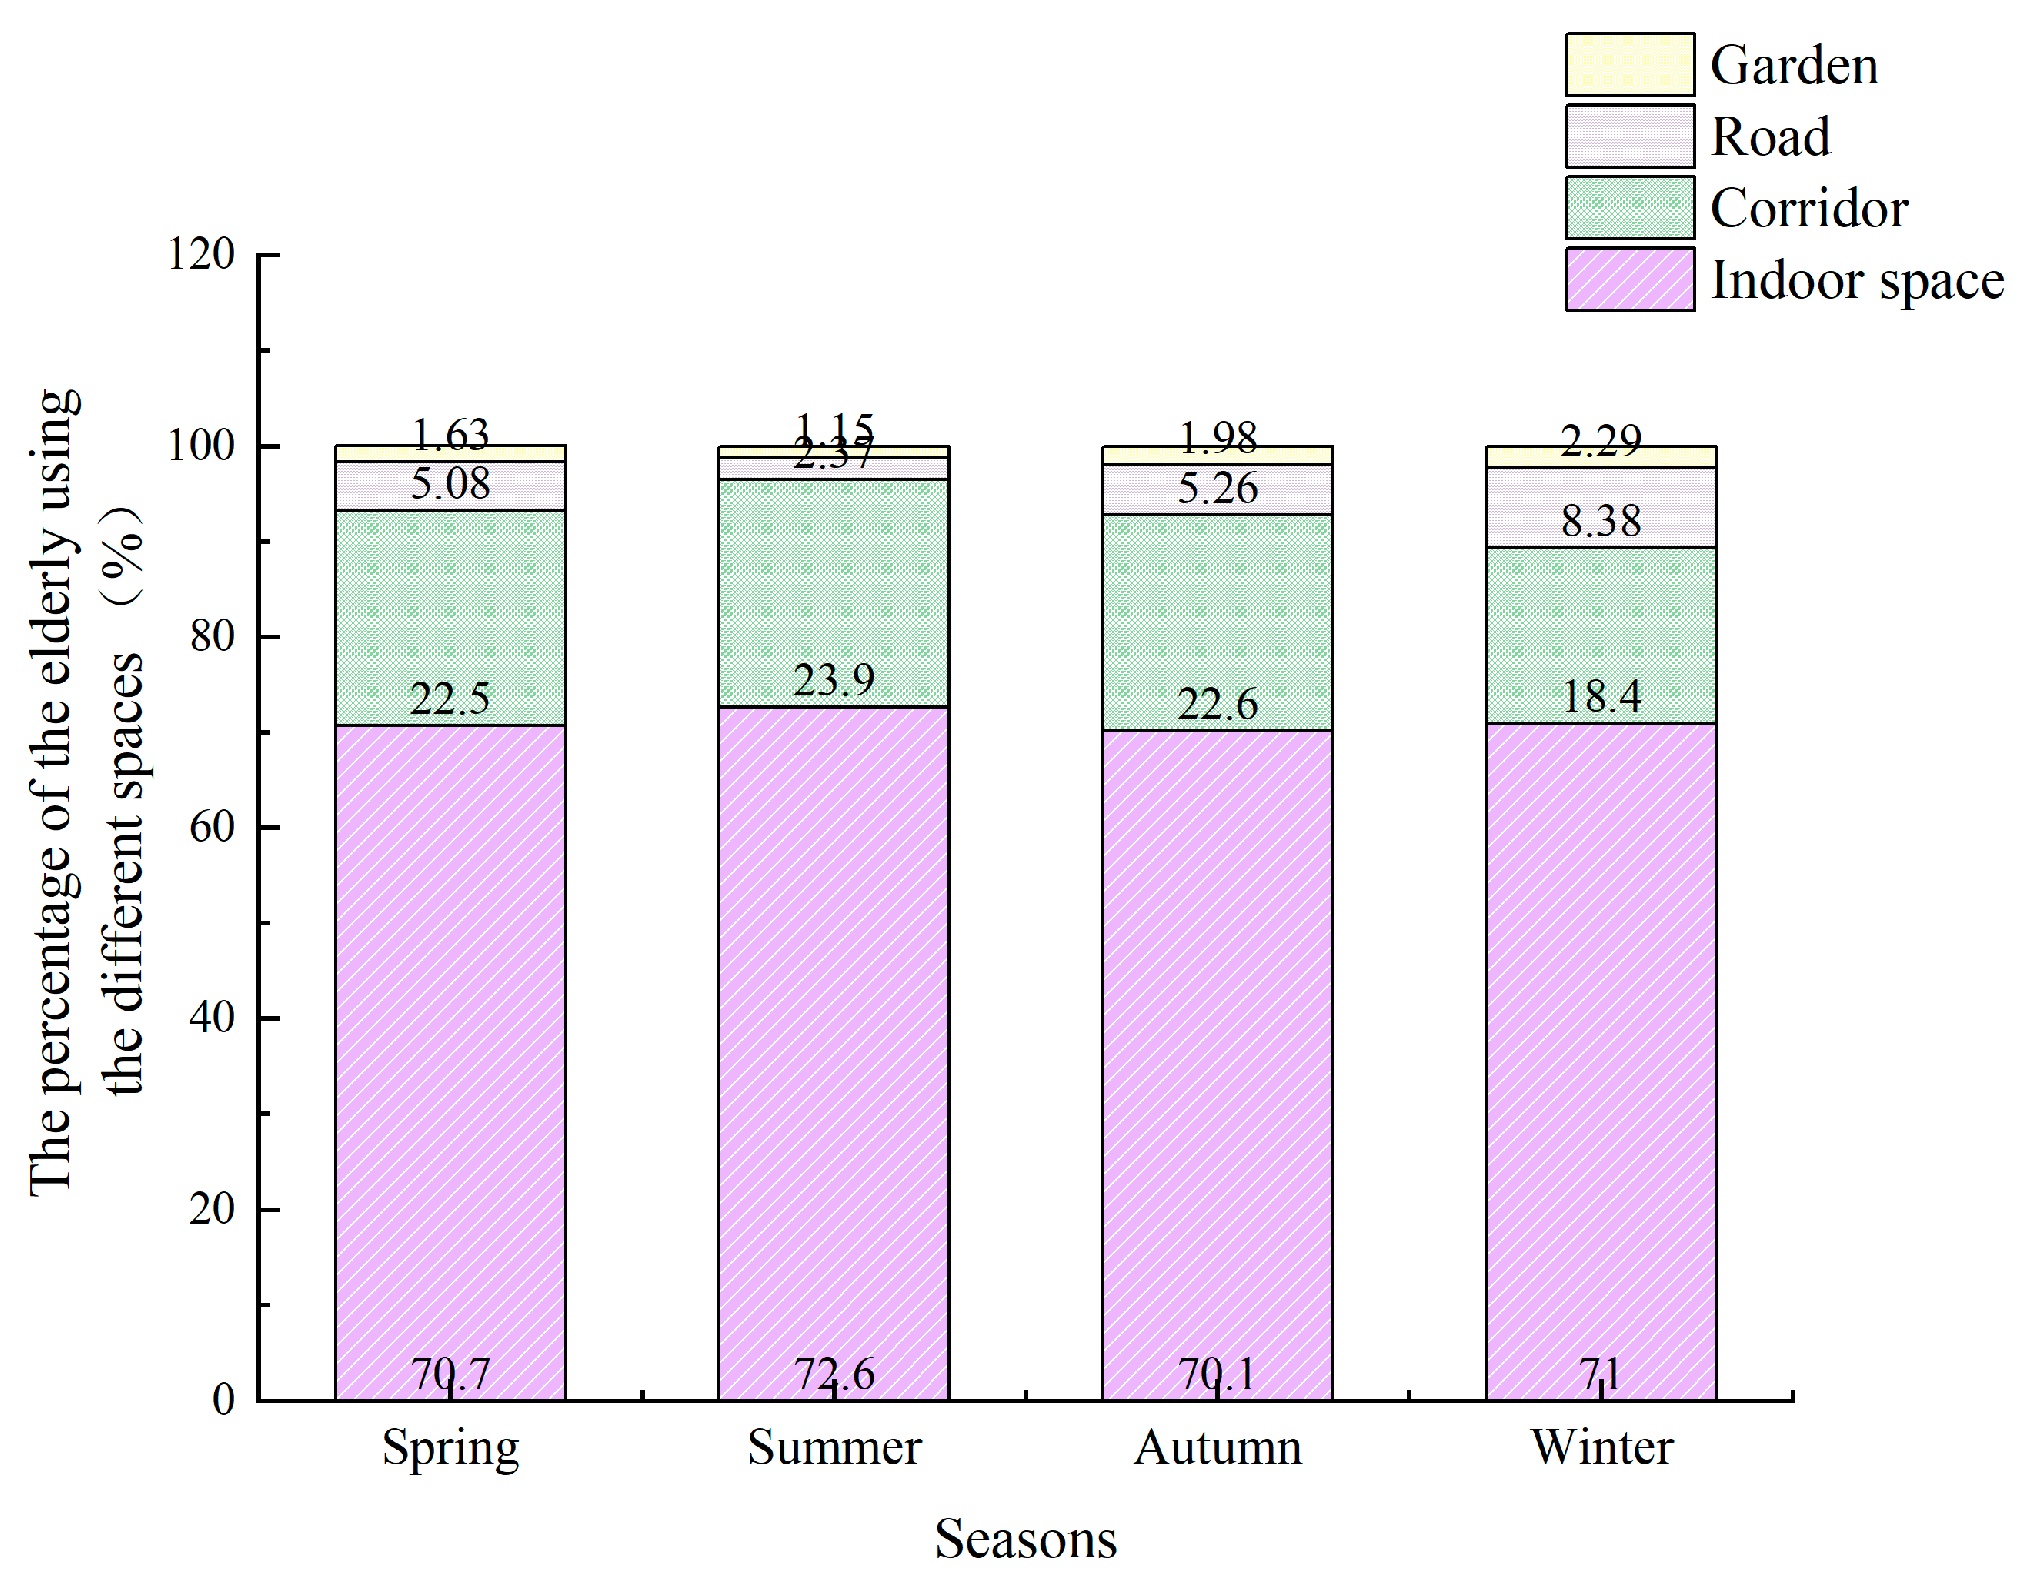
3.1. Seasonal Usage of Different Outdoor Spaces by the Elderly
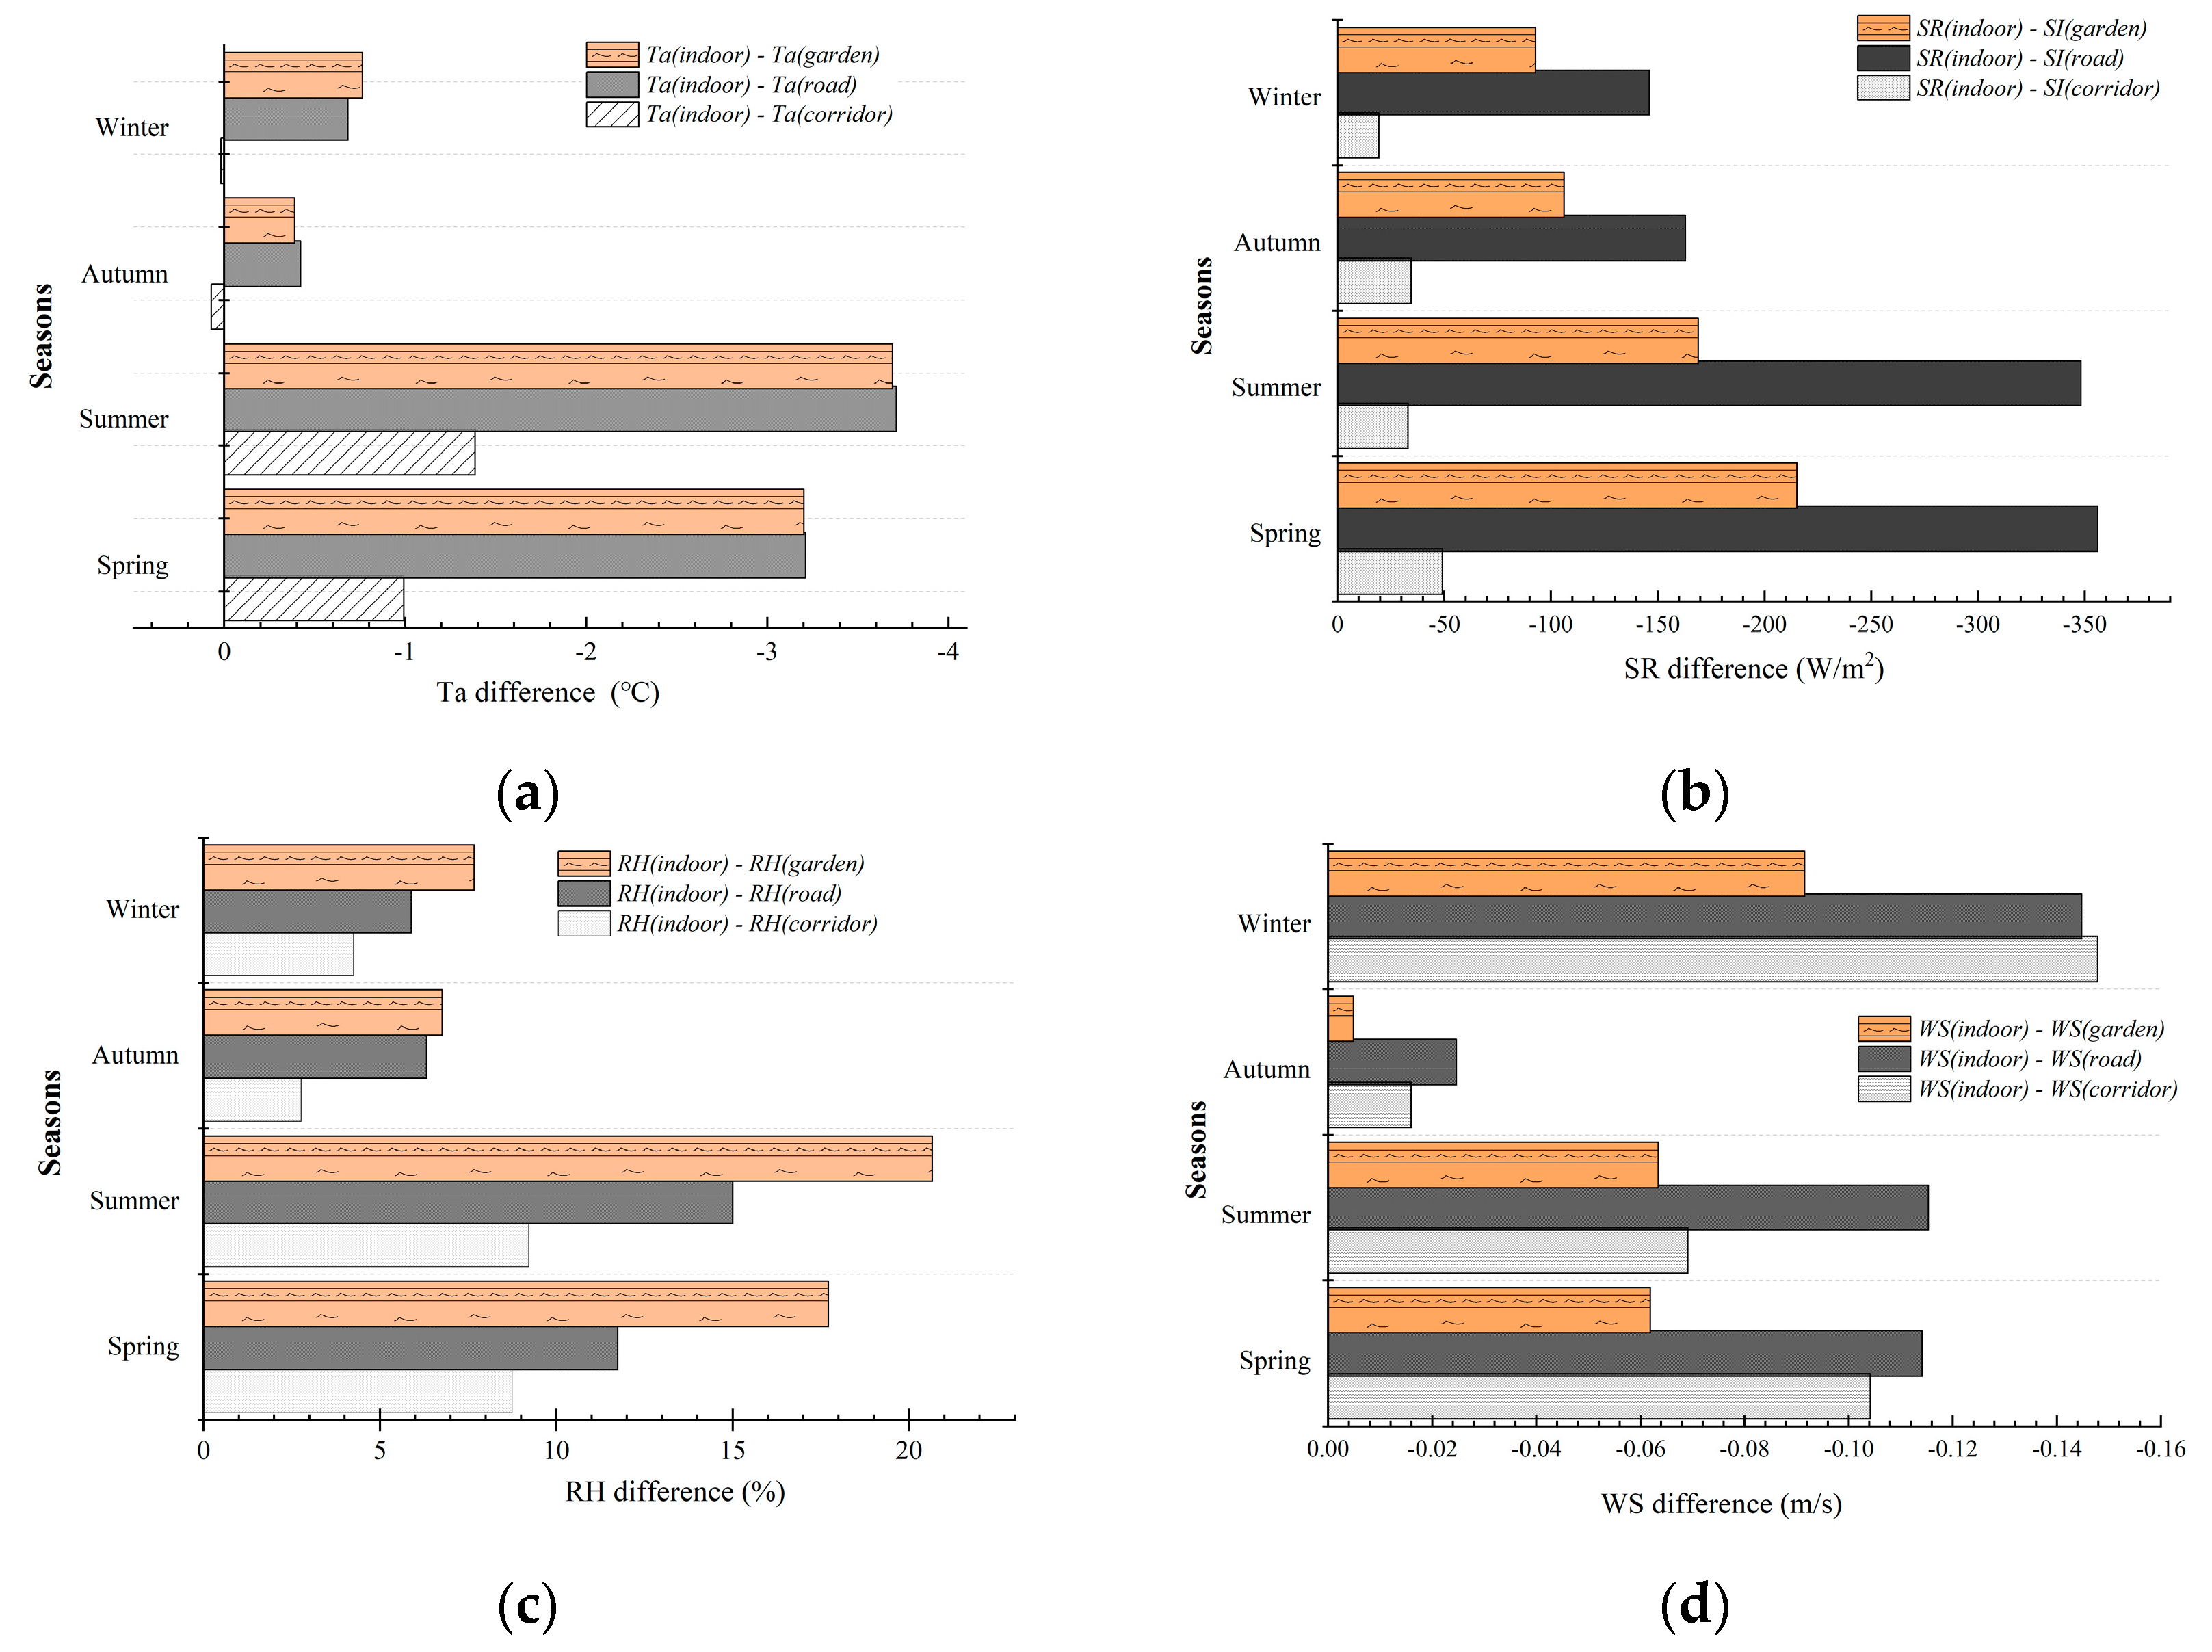
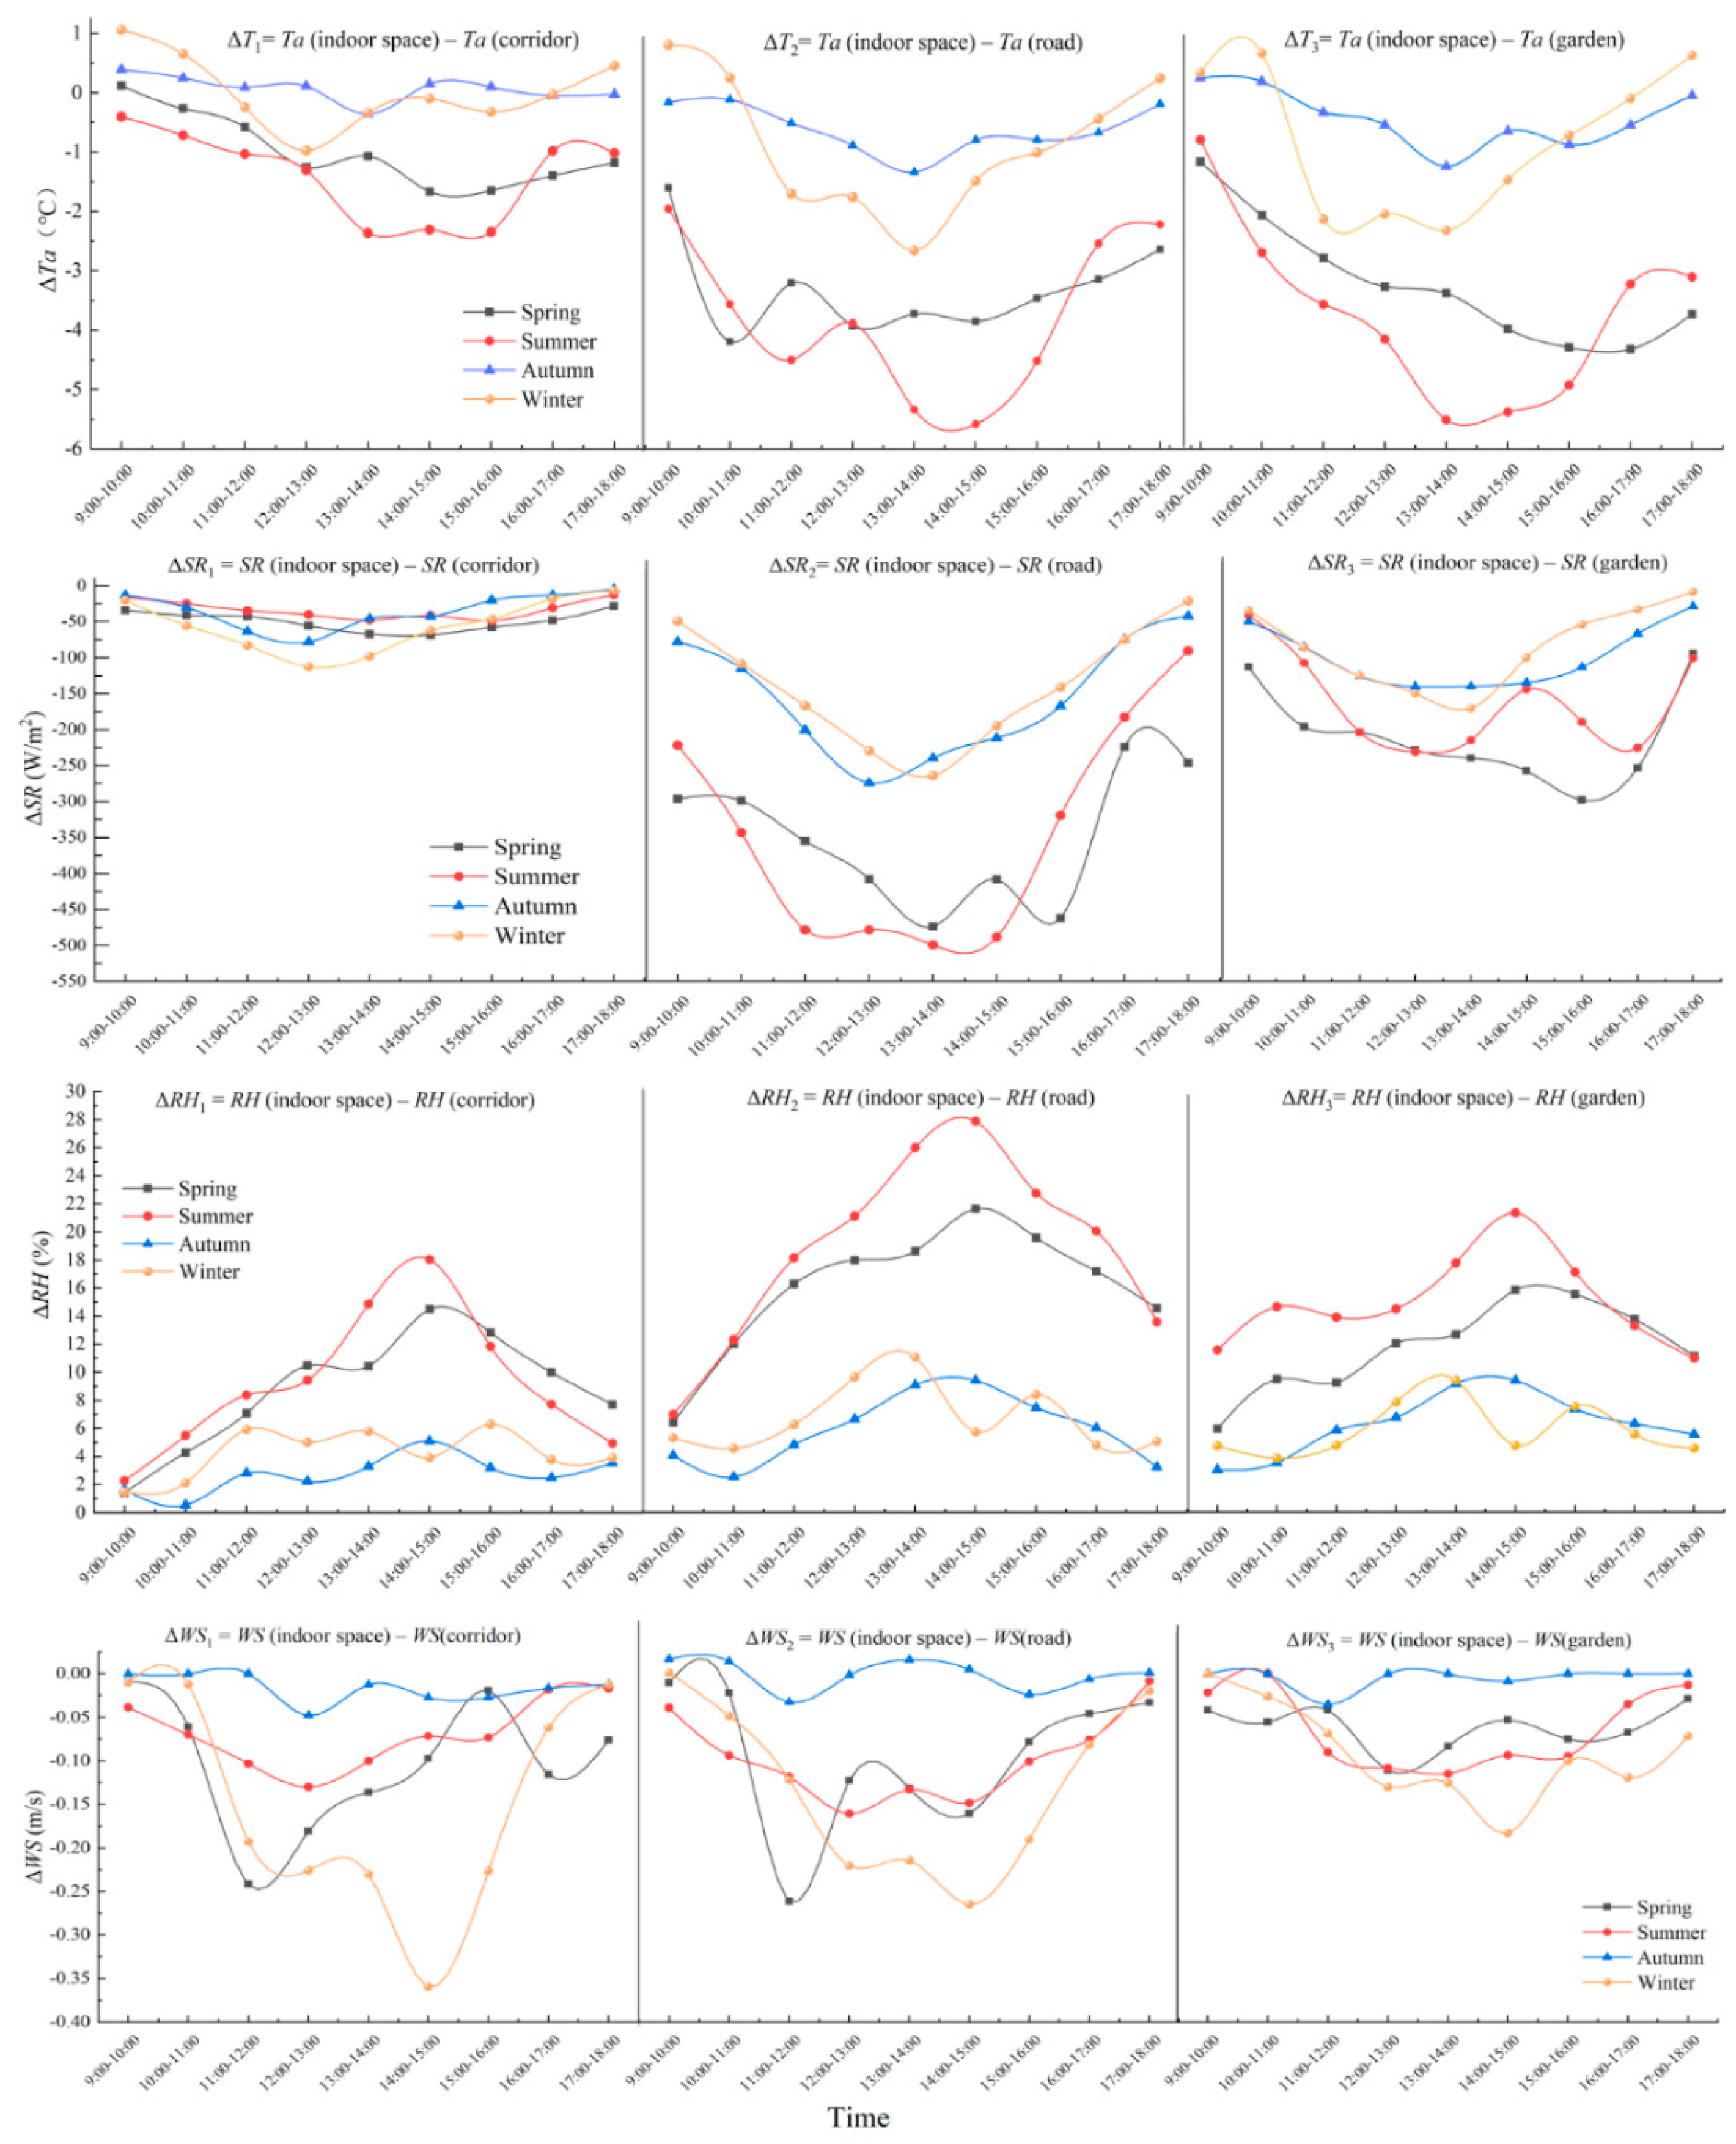
3.2. The Seasonal Differences of the Microclimatic Condition between Indoor and Other Spaces
3.2.1. Seasonal Ta and Ta Difference (ΔTa)
3.2.2. Seasonal SR and SR Difference (ΔSR)
3.2.3. Seasonal RH and RH Difference (ΔRH)
3.2.4. Seasonal WS and WS Difference (ΔWS)
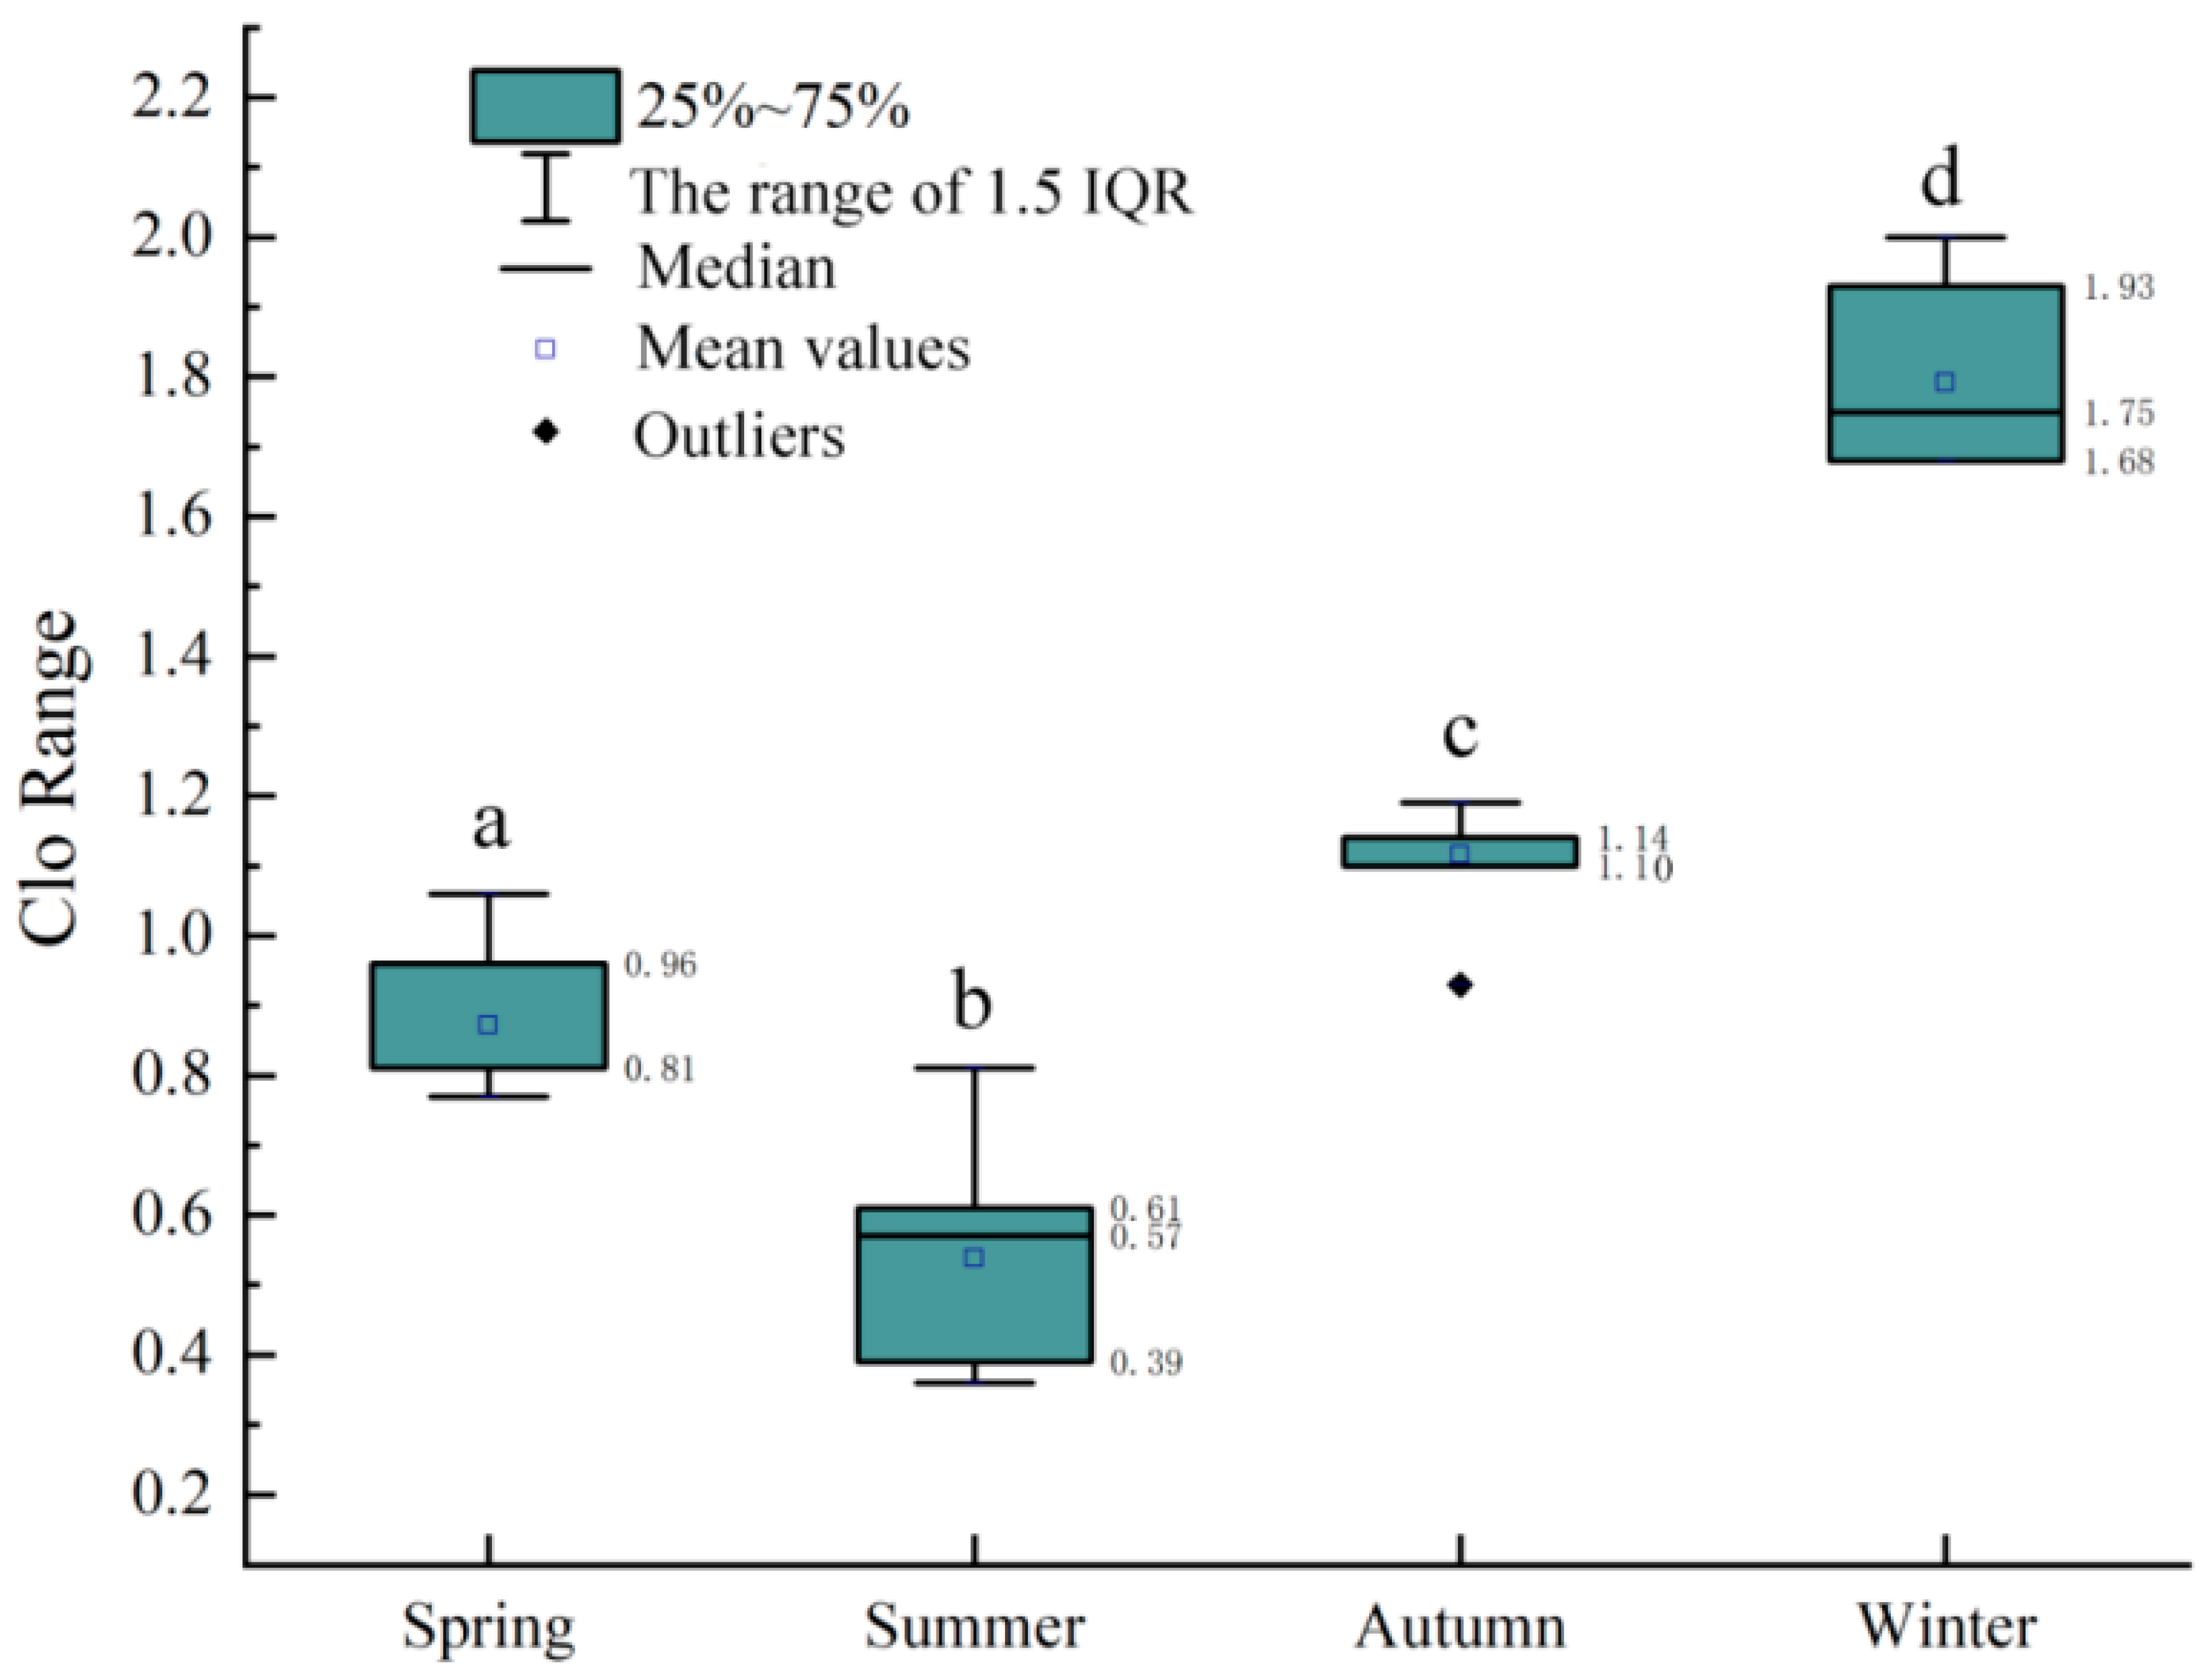
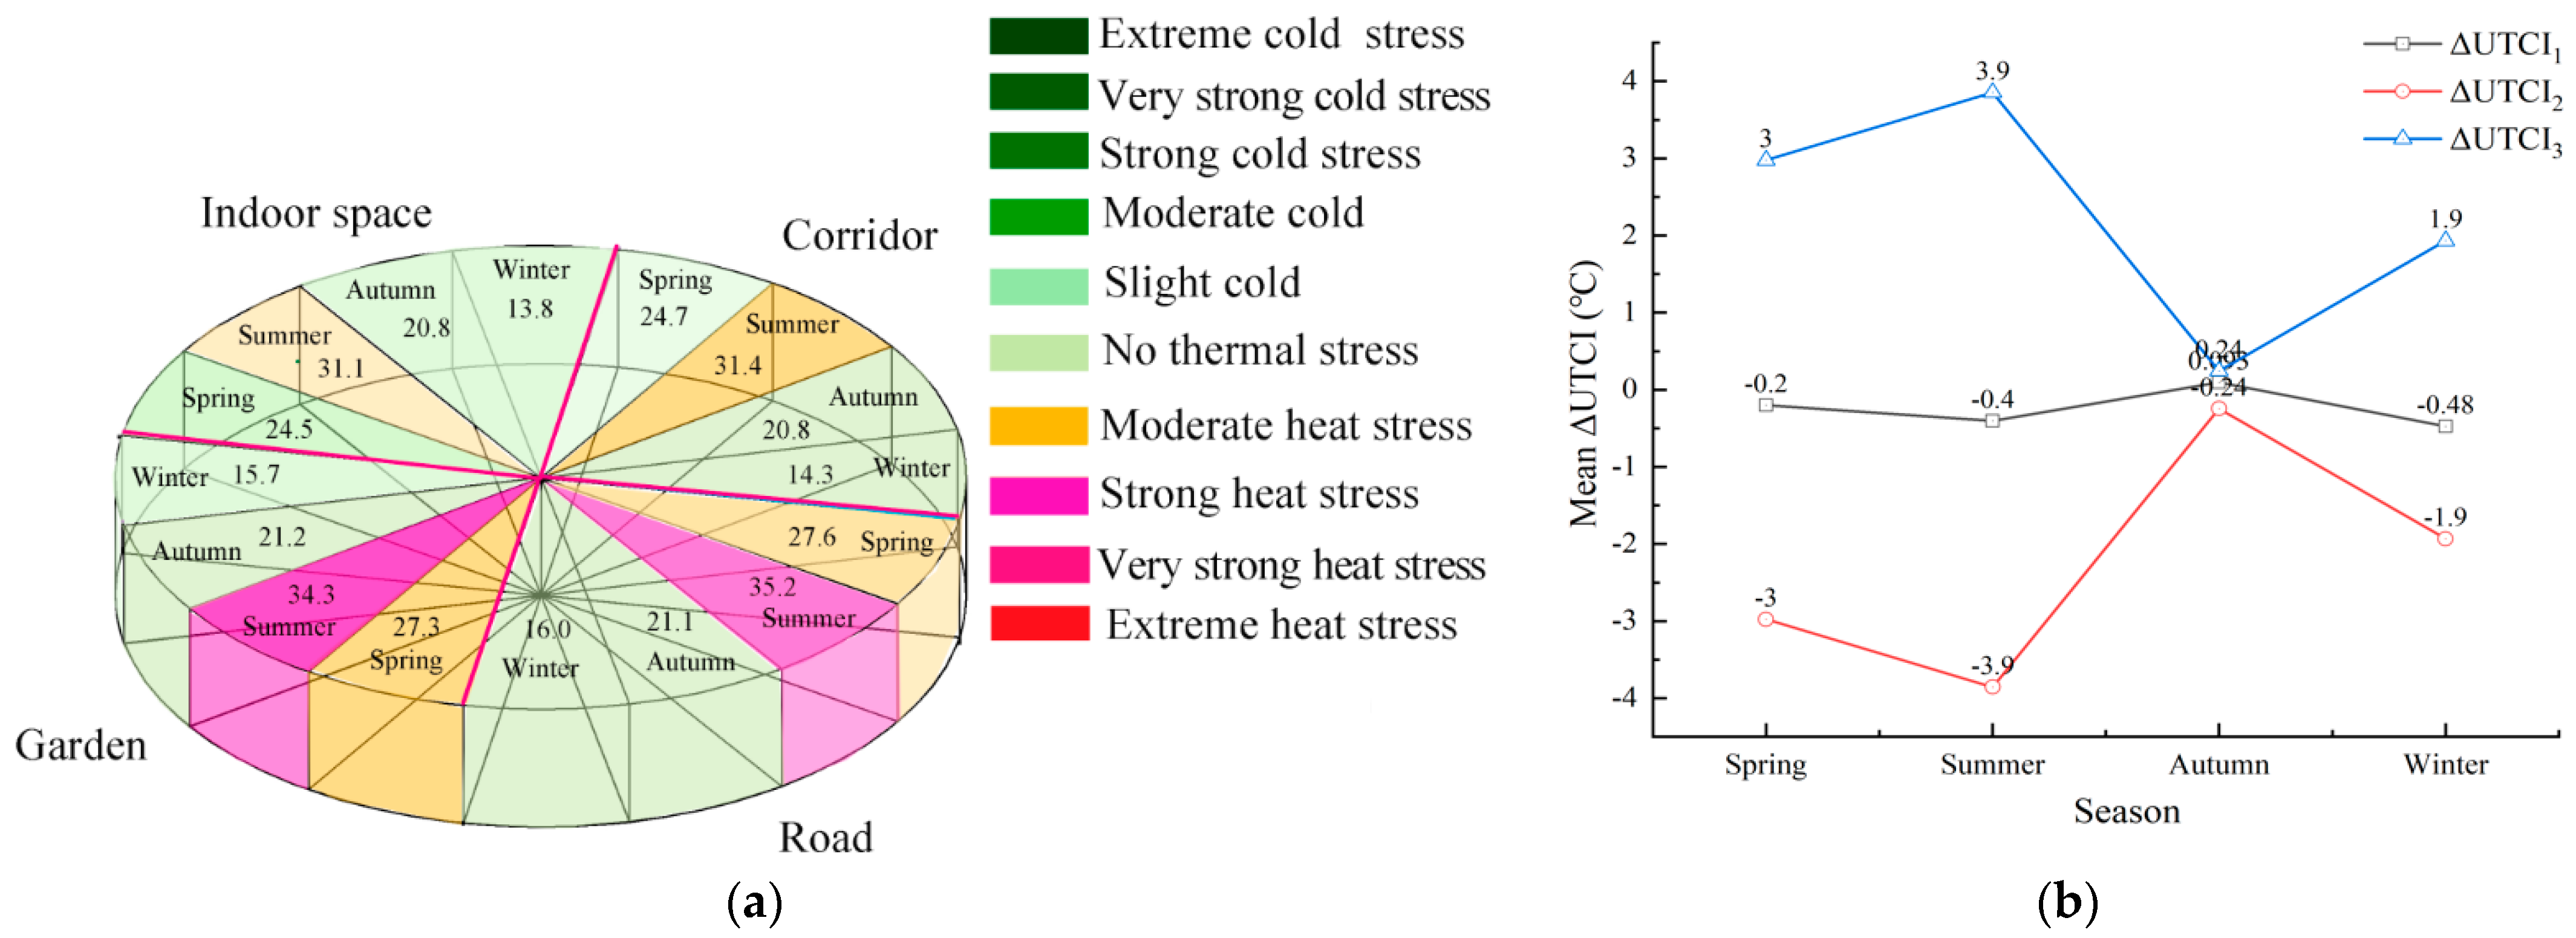
3.3. The Thermal Comfort Differences between Indoor and Outdoor Spaces
3.4. Correlation Analysis
4. Discussions
4.1. The Impact of Microclimatic Transients on the Willingness to Use the Outdoor Environment of the Elderly
4.1.1. Influence of Ta and ΔTa on the Use of Outdoor Space by the Elderly
4.1.2. Influence of SR and ΔSR on the Use of Outdoor Space by the Elderly
4.1.3. Influence of RH and ΔRH on the Use of Outdoor Spaces by the Elderly
4.1.4. Influence of WS and ΔWS on the Use of Outdoor Spaces by the Elderly
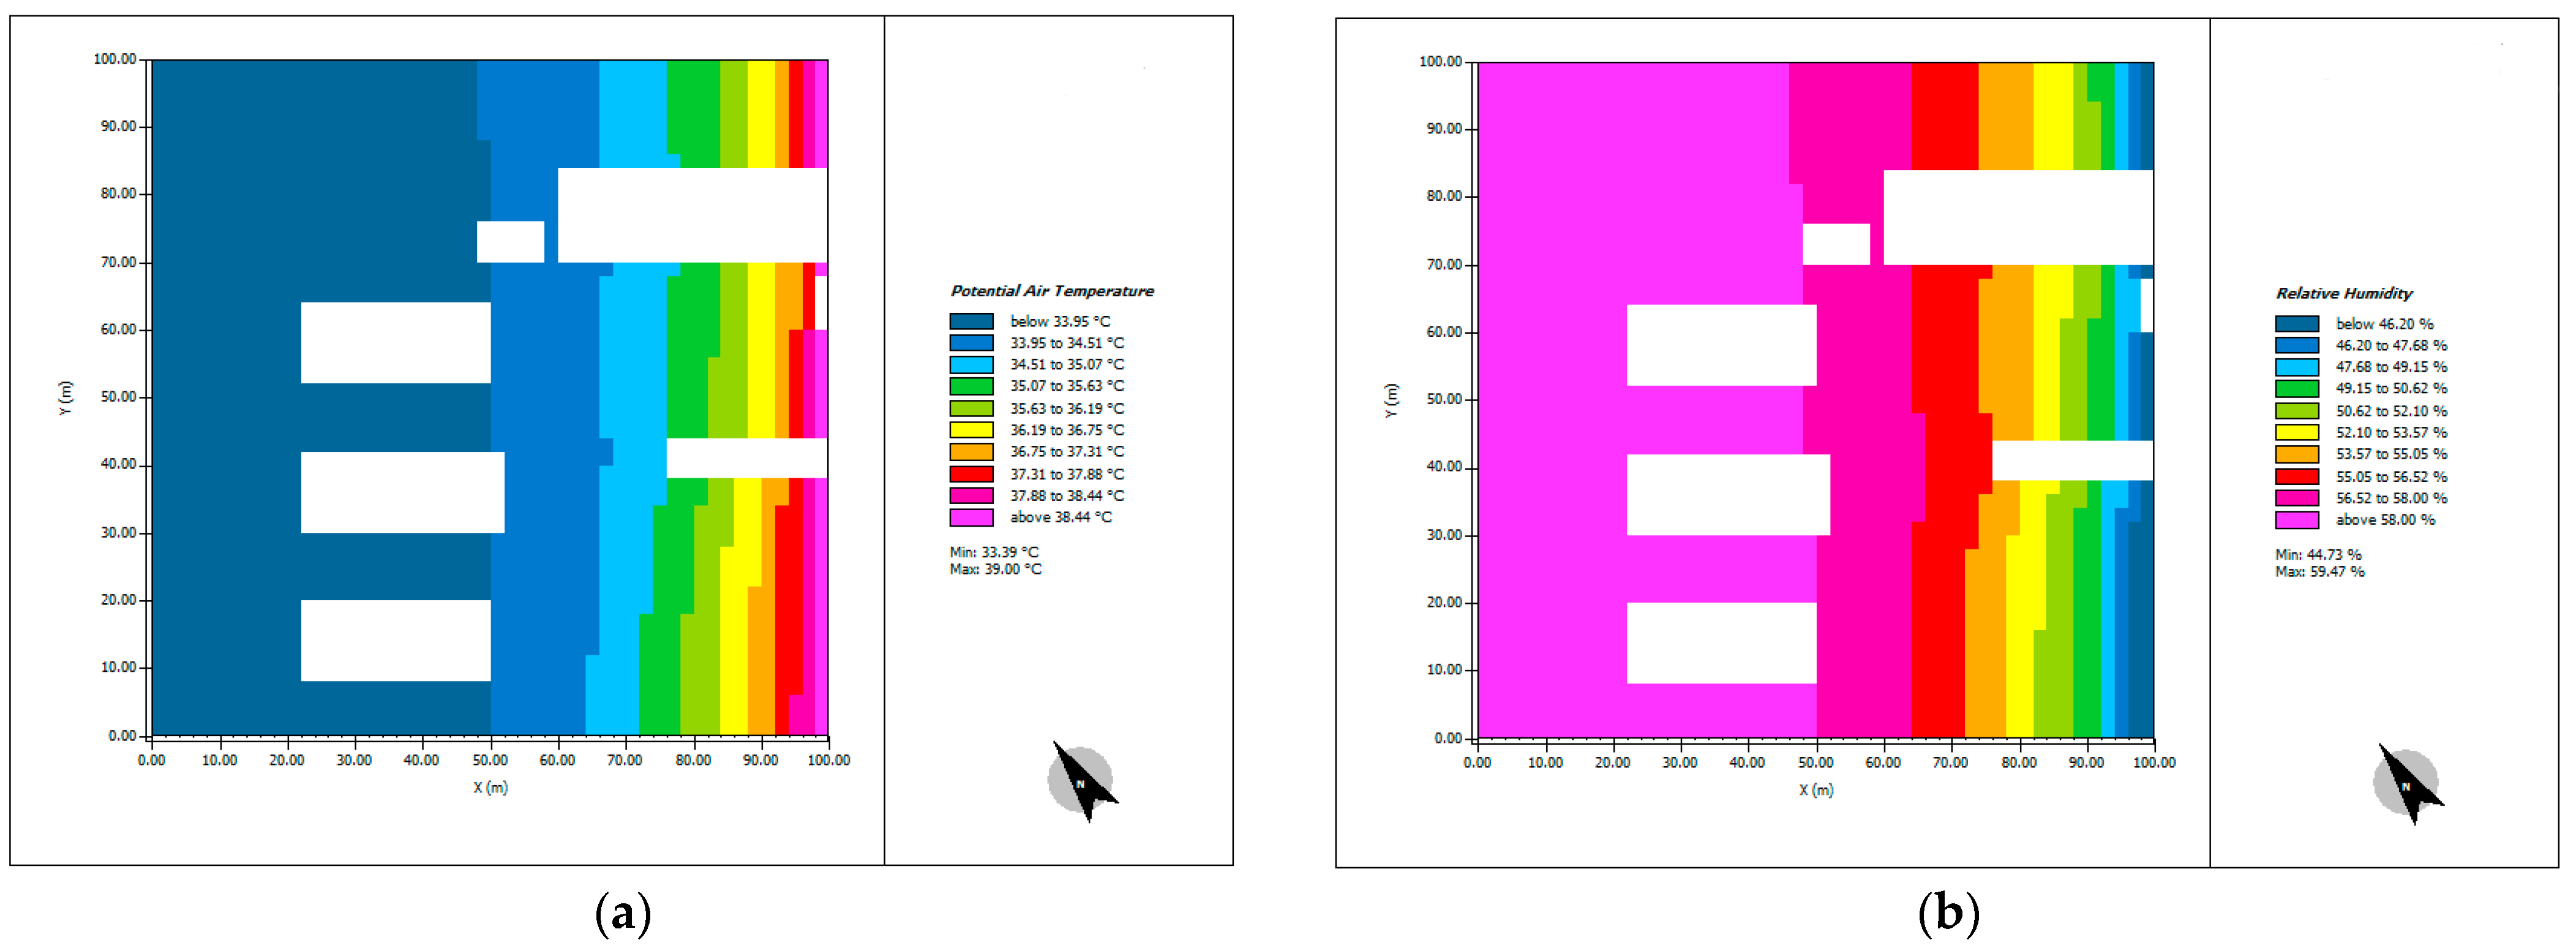
4.2. How Can Indoor and Outdoor Microclimatic Differences of the Nursing Home Be Controlled?
4.3. The Limitations
5. Conclusions
- (1)
- The UTCI values of the different spaces in the nursing homes showed the significant differences in spring and summer. The stress categories of indoor and corridor spaces were at a level with no thermal stress in spring, autumn, and winter. In summer, the mean UTCI values of indoor and corridor spaces corresponded to the level of moderate heat stress, while those of road and garden corresponded to the level of strong heat stress (≥33 °C). Road and garden spaces even showed moderate heat stress (≥25 °C, <33 °C) in spring.
- (2)
- The microclimatic differences between indoor and outdoor spaces ranged from 0.47 °C to 2.93 °C (|ΔTa|), from 86.09 W/m2 to 206.76 W/m2 (|ΔSR|), from 5.29% to 14.76% (ΔRH), from 0.01 m/s to 0.07 m/s (|ΔWS|), and from 0.25 °C to 2.25 °C (ΔUTCI). The minimal microclimatic differences occurred between corridors and indoors.
- (3)
- Ta and RH differences between indoor and outdoor spaces were the primary meteorological factors influencing the elderly’s usage of outdoor spaces. The elderly preferred a constant Ta and RH environment. Only when the ΔTa and ΔRH are small enough to resemble a steady-state (ΔUTCI ≤ 0.5 °C) will the difference in WS and SI between indoor and outdoor spaces affect the elderly’s choice of using outdoor space.
- (4)
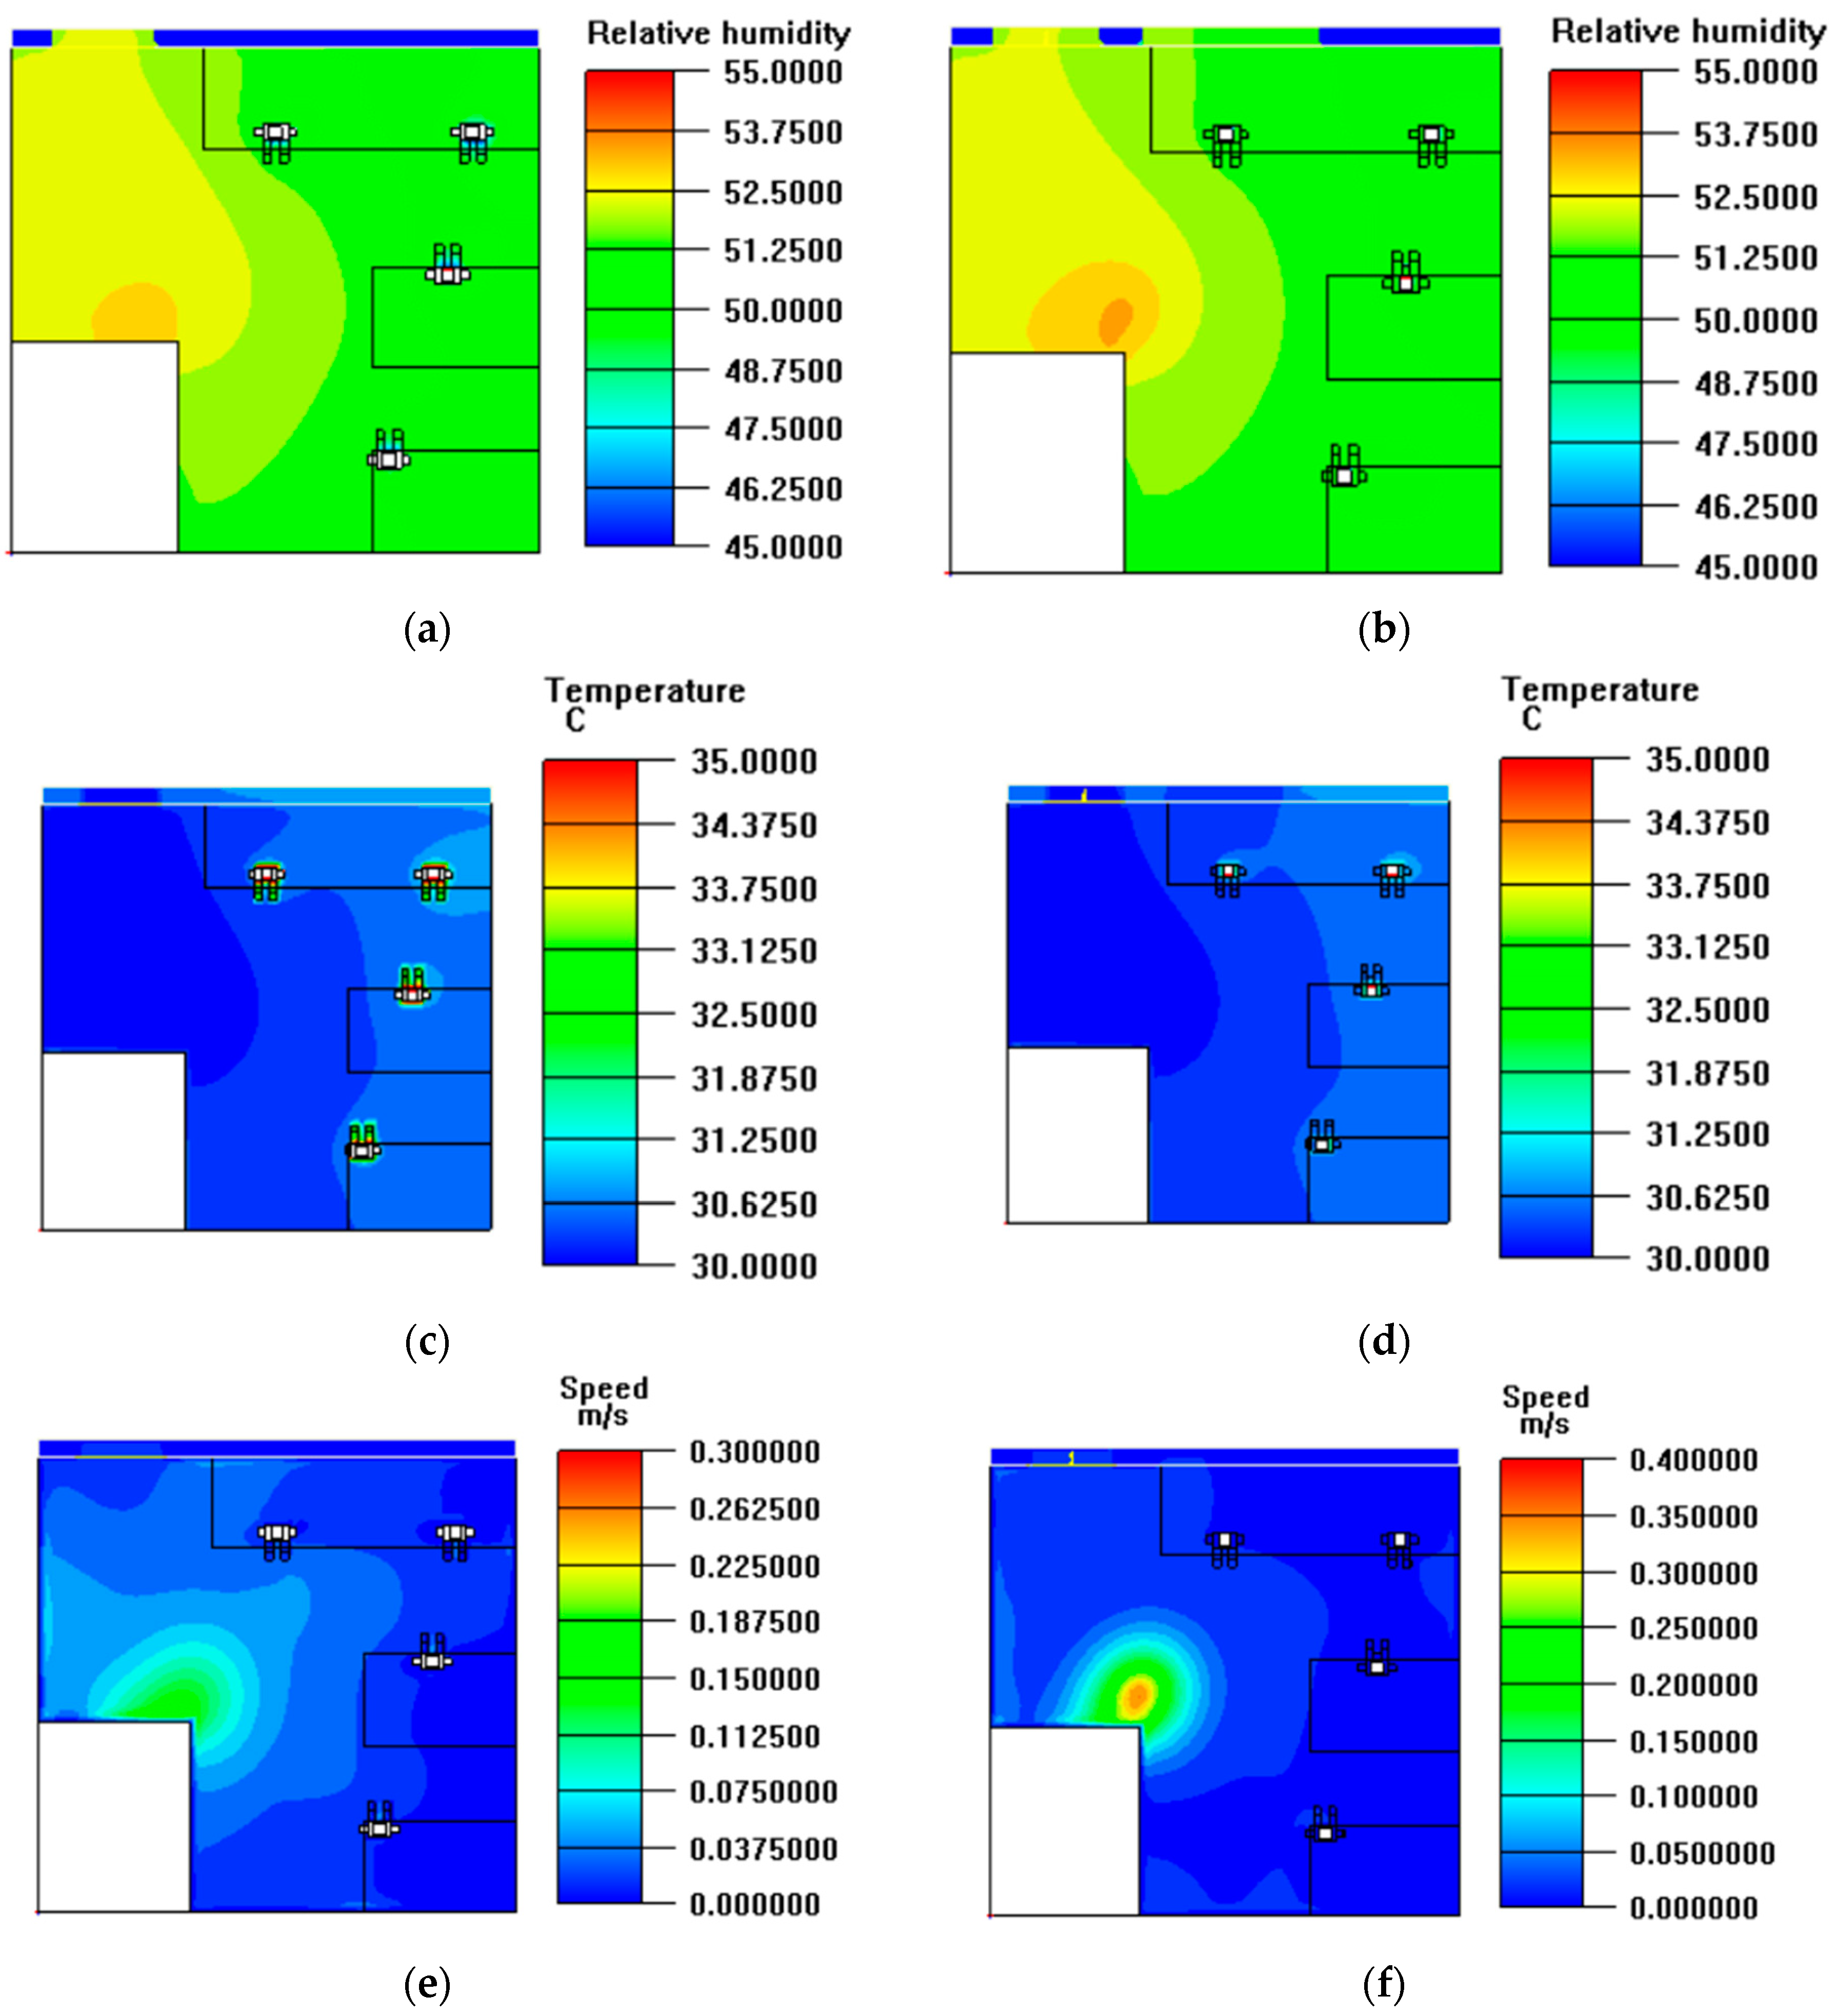
- Two optimal design strategies were put forward for creating comfortable transient environments from physical perspectives, including improving outdoor canopy coverage and indoor mechanical ventilation.
Author Contributions
Funding
Conflicts of Interest
References
- Yang, L.; Liu, J.; Lu, Y.; Ao, Y.; Guo, Y.Y.; Huang, W.C.; Zhao, R.; Wang, R.Y. Global and local associations between urban greenery and travel propensity of older adults in Hong Kong. Sustain. Cities Soc. 2020, 63, 102442. [Google Scholar] [CrossRef]
- Yang, L.; Ao, Y.; Ke, J.; Lu, Y.; Liang, Y. To walk or not to walk? Examining non-linear effects of streetscape greenery on walking propensity of older adults. J. Transp. Geogr. 2021, 94, 103099. [Google Scholar] [CrossRef]
- Yang, L.; Tang, X.; Yang, H. Using a system of equations to assess the determinants of the walking behavior of older adults. Trans. GIS 2022, 26, 1339–1354. [Google Scholar] [CrossRef]
- Zhang, H. Sending parents to nursing homes is unfilial? An exploratory study on institutional elder care in China. Int. Soc. Work 2019, 62, 351–362. [Google Scholar] [CrossRef]
- Xu, J.; Zhu, B.S. A research on Beds Occupation rate of Pension Agency and Its Influencing Factors: Taking Beijing as an Example. Popul. Econ. 2019, 3, 115–126. [Google Scholar] [CrossRef]
- Xing, Y.; Pei, R.; Qu, J.; Wang, J.; Zhou, H.; Wang, Z.Q.; Yan, W.X.; Sun, X.R.; Sun, T.; Li, L. Urban-rural differences in factors associated with willingness to receive eldercare among the elderly: A cross-sectional survey in China. BMJ 2018, 8, e020225. [Google Scholar] [CrossRef]
- Mendes, A.; Luísa Papoila, A.; Carreiro-Martins, P.; Aguiar, L.; Bonassi, S.; Caires, I.; Palmeiro, T.; Silva Ribeiro, A.; Neves, P.; Pereira, C.; et al. The Influence of Thermal Comfort on the Quality of Life of Nursing Home Residents. J. Toxicol. Environ. Health Part A 2017, 80, 729–739. [Google Scholar] [CrossRef]
- Panraluk, C.; Sreshthaputra, A. Thermal Comfort of the Elderly in Public Health Service Buildings of Thailand. Appl. Mech. Mater. 2018, 878, 173–178. [Google Scholar] [CrossRef]
- Sinoo, M.M.; Hoof, J.V.; Kort, H.S.M. Light conditions for older adults in the nursing home: Assessment of environmental illuminances and colour temperature. Build. Environ. 2011, 46, 1917–1927. [Google Scholar] [CrossRef]
- Hayashi, Y.; Ikaga, T.; Ando, S.; Hoshi, T. The Impact of indoor thermal environment in winter on deterioration of care level in nursing home residents: A field survey on indoor thermal environment of nursing home and resident’s care condition. J. Environ. Eng. 2018, 83, 225–233. [Google Scholar] [CrossRef][Green Version]
- Hase, H.; Ando, Y.; Sakurai, N.; Ohno, H. The influence of room temperature and relative humidity on odor in a unit-type nursing home. In Proceedings of the 6th International Conference on Indoor Air Quality, Ventilation & Energy Conservation in Buildings IAQVEC, Sendai, Japan, 28–31 October 2007; pp. 201–206. [Google Scholar]
- Walikewitz, N.; Jnicke, B.; Langner, M.; Endlicher, W. Assessment of indoor heat stress variability in summer and during heat warnings: A case study using the UTCI in berlin, Germany. Int. J. Biometeorol. 2015, 62, 29–42. [Google Scholar] [CrossRef] [PubMed]
- Höppe, P. Different aspects of assessing indoor and outdoor thermal comfort. Build. Environ. 2002, 34, 661–665. [Google Scholar] [CrossRef]
- Fenner, D.; Meier, F.; Scherer, D.; Polze, A. Spatial and temporal air temperature variability in Berlin, Germany, during the years 2001–2010. Urban Clim. 2014, 10, 308–331. [Google Scholar] [CrossRef]
- Jiao, Y.; Yu, H.; Wang, T.; An, Y.S.; Yu, Y.F. Thermal comfort and adaptation of the elderly in free-running environments in Shanghai, China. Build. Environ. 2017, 118, 259–272. [Google Scholar] [CrossRef]
- Adevi, A.A.; MaRtensson, F. Stress rehabilitation through garden therapy: The garden as a place in the recovery from stress. Urban For. Urban Green. 2013, 12, 230–237. [Google Scholar] [CrossRef]
- Arnberger, A.; Allex, B.; Eder, R.; Ebenberger, M.; Wank, A.; Kolland, F.; Wallner, P.; Hutterc, H.P. Elderly resident’s uses of and preferences for urban green spaces during heat periods. Urban For. Urban Green. 2017, 21, 102–115. [Google Scholar] [CrossRef]
- Wang, D.; Glicksman, A. Being Grounded: Benefits of Gardening for Older Adults in Low-Income home. J. Home Elder. 2013, 27, 89–104. [Google Scholar] [CrossRef]
- Goto, S.; Park, B.J.; Tsunetsugu, Y.; Herrup, K.; Miyazaki, Y. The effect of garden designs on mood and heart output in older adults residing in an assisted living facility. Herd 2013, 6, 27–42. [Google Scholar] [CrossRef]
- Zong, H.; Liu, Y.; Wang, Q.; Liu, M.L.; Chen, H. Usage patterns and comfort of gardens: A seasonal survey of internal garden microclimate in the aged care homes of Chengdu City. Int. J. Biometeorol. 2019, 63, 1181–1192. [Google Scholar] [CrossRef]
- Chen, L.; Ng, E. Outdoor thermal comfort and outdoor activities: A review of research in the past decade. Cities. 2012, 29, 118–125. [Google Scholar] [CrossRef]
- Wei, D.; Yang, L.; Bao, Z.; Lu, Y.; Yang, H.T. Variations in outdoor thermal comfort in an urban park in the hot-summer and cold-winter region of China. Sustain. Cities Soc. 2022, 77, 103535. [Google Scholar] [CrossRef]
- Baquero Larriva, M.T.; Higueras, E. Health risk for older adults in Madrid, by outdoor thermal and acoustic comfort. Urban Clim. 2020, 34, 100724. [Google Scholar] [CrossRef]
- Rivera-Gómez, C.; Diz-Mellado, E.; Galán-Marín, C.; López-Cabeza, V. Tempering potential-based evaluation of the courtyard microclimate as a combined function of aspect ratio and outdoor temperature. Sustain. Cities Soc. 2019, 51, 101740. [Google Scholar] [CrossRef]
- Apolonio Callejas, I.J.; Cleonice Durante, L.; Diz-Mellado, E.; Galán-Marín, C. Thermal Sensation in Courtyards: Potentialities as a Passive Strategy in Tropical Climates. Sustainability. 2020, 12, 6135. [Google Scholar] [CrossRef]
- Teno, J.M.; Gozalo, P.; Khandelwal, N.; Curtis, J.R.; Meltzer, D.; Engelberg, R.; Mor, V. Association of Increasing Use of Mechanical Ventilation Among Nursing Home Residents with Advanced Dementia and Intensive Care Unit Beds. JAMA Intern. Med. 2016, 176, 1809–1816. [Google Scholar] [CrossRef]
- Steiner, V.; Ames, A.; Milz, S.A.; Dubin, S. Nursing home staff’s perceptions of noise compared to measured noise levels: A descriptive study. J. Gerontol. Nurs. 2020, 46, 37–45. [Google Scholar] [CrossRef]
- Du, X.Y.; Li, B.Z.; Liu, H.Y.; Yang, D.; Yu, W.; Liao, J.K.; Huang, Z.C.; Xia, K.C.; McKemy, D.D. The Response of Human Thermal Sensation and Its Prediction to Temperature Step-Change (Cool-Neutral-Cool). PLoS ONE. 2014, 9, e104320. [Google Scholar] [CrossRef]
- Van Loenhout, J.A.F.; Le Grand, A.; Duijm, F.; Greven, F.; Vink, N.M.; Hoek, G.; Zuurbier, M. The effect of high indoor temperatures on self-perceived health of elderly persons. Environ. Res. 2016, 146, 27–34. [Google Scholar] [CrossRef]
- Bunker, A.; Wildenhain, J.; Vandenbergh, A.; Henschke, N.; Rocklöv, J.; Hajat, S.; Sauerborn, R. Effects of air temperature on climate-sensitive mortality and morbidity outcomes in the elderly; a systematic review and meta-analysis of epidemiological evidence. Ebiomedicine. 2016, 6, 258–268. [Google Scholar] [CrossRef]
- Kario, K.; Ikemoto, T.; Kuwabara, M.; Ishiyama, H.; Saito, K.; Hoshide, S. Catheter-based renal denervation reduces hypoxia-triggered nocturnal blood pressure peak in obstructive sleep apnea syndrome. J. Clin. Hypertens. 2016, 18, 707–709. [Google Scholar] [CrossRef]
- Yang, L.; Liang, Y.; He, B.; Lu, Y.; Gou, Z. COVID-19 effects on property markets: The pandemic decreases the implicit price of metro accessibility. Tunn. Undergr. Space Technol 2022, 125, 104528. [Google Scholar] [CrossRef]
- Yu, J.; Yang, C.; Tian, L.; Liao, D. A study on optimum insulation thicknesses of external walls in hot summer and cold winter zone of China. Appl. Energy. 2009, 86, 2520–2529. [Google Scholar] [CrossRef]
- National Bureau of Statistics. Statistical Bulletin on National Economic and Social Development. 2018. Available online: http://www.stats.gov.cn/tjsj/zxfb/201902/t20190228_1651265.html (accessed on 1 October 2021).
- Jia, J.; Ni, C.J.; Hu, Z.Y.; Xie, J.; Xie, Y. Variation of haze and its relationship with climate change in Chengdu from 1980 to 2010. Plateau Meteorol. 2017, 36, 517–527. [Google Scholar] [CrossRef]
- Zhou, X.; Zheng, C.; Qiang, Y.; Ingvar, H.; Gao, C.S.; Kalev, K. The thermal insulation difference of clothing ensembles on the dry and perspiration manikins. Meas. Sci. Technol. 2010, 21, 085203. [Google Scholar] [CrossRef]
- Park, S.; Tuller, S.E.; Jo, M. Application of universal thermal climate index (UTCI) for microclimatic analysis in urban thermal environments. Landsc. Urban Plan. 2014, 125, 146–155. [Google Scholar] [CrossRef]
- Cheung, P.K.; Jim, C.Y. Determination and application of outdoor thermal benchmarks. Build. Environ. 2017, 123, 333–350. [Google Scholar] [CrossRef]
- Zhang, M.J.; You, W.; Qin, Q.; Peng, D.; Hu, Y.; Gao, Z.; Buccolieri, R. Investigation of typical residential block typologies and their impact on pedestrian-level microclimate in summers in Nanjing, China. Front. Archit. Res. 2021, 11, 278–296. [Google Scholar] [CrossRef]
- Xue, J.; Hu, X.; Shu, S.N.; Wu, Y.; Li, X.; Chai, L.; Lai, D. Outdoor Thermal Comfort at a University Campus: Studies from Personal and Long-Term Thermal History Perspectives. Sustainability 2020, 12, 9284. [Google Scholar] [CrossRef]
- Błażejczyk, K.; Bröde, P.; Fiala, D.; Havenith, G.; Kunert, A. Principles of the new universal thermal climate index (UTCI) and its application. Misc. Geogr. 2010, 14, 91–102. [Google Scholar] [CrossRef]
- Wang, B.; Yi, Y.K. Developing an adapted utci (universal thermal climate index) for the elderly population in china’s severe cold climate region. Sustain. Cities Soc. 2021, 69, 102813. [Google Scholar] [CrossRef]
- Grifoni, R.C.; Tascini, S.; Cesario, E.; Marchesani, G.E. Cool façade optimization: A new parametric methodology for the urban heat island phenomenon (UHI). In Proceedings of the 2017 IEEE International Conference on Environment and Electrical Engineering and 2017 IEEE Industrial and Commercial Power Systems Europe (EEEIC/I&CPS Europe), Milan, Italy, 6–9 June 2017; pp. 1–5. [Google Scholar] [CrossRef]
- Bröde, P.; Fiala, D.; Blazejczyk, K.; Holmér, I.; Jendritzky, G.; Kampmann, B.; Tinz, B.; Havenith, G. Deriving the operational procedure for the universal thermal climate index (UTCI). Int. J. Biometeorol. 2012, 56, 481–494. [Google Scholar] [CrossRef] [PubMed]
- Talhi, A.; Barlet, A.; Bruneau, D.; Boudjamâa, A. Towards a prediction of outdoor human thermal comfort adapted for designers of urban spaces: Examining UTCI and APCI in the context of Algiers (Algeria). Int. J. Biometeorol. 2020, 64, 651–662. [Google Scholar] [CrossRef] [PubMed]
- Lai, D.Y.; Guo, D.H.; Hou, Y.F.; Lin, C.; Chen, Q. Studies of outdoor thermal comfort in northern China. Build. Environ. 2014, 77, 110–118. [Google Scholar] [CrossRef]
- Lin, Y.K.; Ho, T.J.; Wang, Y.C. Mortality risk associated with temperature and prolonged temperature extremes in elderly populations in Taiwan. Environ. Res. 2011, 111, 1156–1163. [Google Scholar] [CrossRef] [PubMed]
- Collins, K.J.; Exton-Smith, A.N. Thermal homeostasis in old age. J. Am. Geriatr. Soc. 1983, 31, 519–524. [Google Scholar]
- Tochihara, Y.; Yamashita, K.; Fujii, K.; Kaji, Y.; Wakabayashi, H.; Kitahara, H. Thermoregulatory and cardiovascular responses in the elderly towards a broad range of gradual air temperature changes. J. Therm. Biol. 2021, 99, 103007. [Google Scholar] [CrossRef]
- Okan, F.; Okan, S.; Zincir, H. Effect of sunlight exposure on vitamin d status of individuals living in a nursing home and their own homes. J. Clin. Densitom. 2020, 23, 21–28. [Google Scholar] [CrossRef]
- Hanley, D.A.; Cranney, A.; Jones, G.; Whiting, S.J.; Leslie, W.D. Vitamin d in adult health and disease: A review and guideline statement from osteoporosis Canada. Can. Med. Assoc. J. 2010, 182, 1315–1319. [Google Scholar] [CrossRef]
- Arnljots, R.; Arnljots, E.S.; Thorn, J.; Marie, J.E.; Michael, M.; Pär-Daniel, S. Bacteriuria and vitamin D deficiency: A cross sectional study of 385 nursing home residents. BMC Geriatr. 2019, 19, 381. [Google Scholar] [CrossRef]
- Wolf, E. Glare and age. Arch. Ophthalmol. 1960, 64, 502–514. [Google Scholar] [CrossRef]
- Van Den Berg, T.J.; Franssen, L.; Coppens, J.E. Straylight in the human eye: Testing objectivity and optical character of the psychophysical measurement. Spec. Issue 4th Eur. Meet. Vis. Physiol. Opt. (EMPO) 2009, 29, 345–350. [Google Scholar] [CrossRef] [PubMed]
- Alessio, F.; Roberta, D.; Daniele, Z. The glare effect test and the impact of age on luminosity thresholds. Front. Psychol. 2017, 8, 1132–1134. [Google Scholar] [CrossRef]
- Mead, M.N. Benefits of sunlight: A bright spot for human health. Environ. Health Perspect. 2008, 116, A160. [Google Scholar] [CrossRef] [PubMed]
- Samefors, M.; Tengblad, A.; Östgren, C.J. Sunlight Exposure and Vitamin D Levels in Older People-An Intervention Study in Swedish Nursing Homes. J. Nutr. Health Aging 2020, 24, 1047–1052. [Google Scholar] [CrossRef]
- Wolkoff, P.; Kjaergaard, S.K. The dichotomy of relative humidity on indoor air quality. Environ. Int. 2007, 33, 850–857. [Google Scholar] [CrossRef]
- Barreca, A.I. Climate change, humidity, and mortality in the United States. J. Environ. Econ. Manag. 2012, 63, 19–34. [Google Scholar] [CrossRef]
- Tyrovolas, S.; Chalkias, C.; Morena, M.; Kleomenis, K.; Nikos, T.; Akis, Z.; Efthimios, G.; George, M.; Vassiliki, B.; Christos, L.; et al. High relative environmental humidity is associated with diabetes among elders living in Mediterranean islands. J. Diabetes Metab. Disord. 2014, 13, 1. [Google Scholar] [CrossRef]
- Toumi, A.; Chlif, S.; Bettaieb, J.; Alaya, N.; Boukthir, A.; Ahmadi, Z.E.; Salah, A.B.; Ozcel, M.A. Temporal dynamics and impact of cli- mate factors on the incidence of zoonotic cutaneous leishmaniasis in central Tunisia. PLoS Negl. 2012, 6, e1633. [Google Scholar] [CrossRef]
- Davis, R.E.; McGregor, G.R.; Enfield, K.B. Humidity: A review and primer on atmospheric moisture and human health. Environ. Res. 2016, 144, 106–116. [Google Scholar] [CrossRef]
- Sadeghi, M.; de Dear, R.; Wood, G.; Samali, B. Development of a bioclimatic wind rose tool for assessment of comfort wind resources in Sydney, Australia for 2013 and 2030. Int. J. Biometeorol. 2018, 62, 1963–1972. [Google Scholar] [CrossRef]
- Ng, E.; Cheng, V. Urban human thermal comfort in hot and humid Hong Kong. Energy Build. 2012, 55, 51–65. [Google Scholar] [CrossRef]
- Walton, D.; Dravitzki, V.; Donn, M. The relative influence of wind, sunlight and temperature on user comfort in urban outdoor spaces. Build. Environ. 2007, 42, 3166–3175. [Google Scholar] [CrossRef]
- Andrade, H.; Alcoforado, M.J.; Oliveira, S. Perception of temperature and wind by users of public outdoor spaces: Relationships with weather parameters and personal characteristics. Int. J. Biometeorol. 2011, 55, 665–680. [Google Scholar] [CrossRef] [PubMed]
- Niu, J.; Liu, J.; Lee, T.C.; Niu, J.L.; Liu, J.L.; Lee, T.Z.; Lin, Z.; Mak, C.; Tse, K.T.; Tang, B.; et al. A new method to assess spatial variations of outdoor thermal comfort: Onsite monitoring results and implications for precinct planning. Build. Environ. 2015, 91, 263–270. [Google Scholar] [CrossRef]
- Dhariwal, J.; Manandhar, P.; Bande, L.; Marpu, P.; Armstrong, P.; Reinhart, C.F. Evaluating the effectiveness of outdoor evaporative cooling in a hot, arid climate. Build. Environ. 2019, 150, 281–288. [Google Scholar]
- Luo, H.; Liu, X.; Anderson, B.C.; Zhang, K.; Li, X.T.; Huang, B.; Li, M.; Mo, Y.; Fan, L.Q.; Shen, Q.; et al. Carbon sequestration potential of green roofs using mixed-sewagesludge substrate in Chengdu World Modern Garden City. Ecol. Indic. 2015, 49, 247–259. [Google Scholar] [CrossRef]
- Shajahan, A.; Culp, C.H.; Williamson, B. Effects of indoor environmental parameters related to building heating, ventilation, and air conditioning systems on patients’ medical outcomes: A review of scientific research on hospital buildings. Indoor Air. 2019, 29, 161–176. [Google Scholar] [CrossRef]
- Aghamolaei, R.; Lak, A. Outdoor Thermal Comfort for Active Ageing in Urban Open Spaces: Reviewing the Concepts and Parameters. Ageing Int. 2022. [Google Scholar] [CrossRef]
- Yang, L.; Liu, J.; Liang, Y.; Lu, Y.; Yang, H. Spatially varying effects of street greenery on walking time of older adults. ISPRS Int. J. Geo-Inf. 2021, 10, 596. [Google Scholar] [CrossRef]


| UTCI Range (°C) | Stress Category | Color | UTCI Range (°C) | Stress Category | Color |
|---|---|---|---|---|---|
| ≥47 | Extreme heat stress |  | ≥−6, <12 | Slight cold stress |  |
| ≥39, <47 | Very strong heat stress |  | ≥−11, <−6 | Moderate cold stress |  |
| ≥33, <39 | Strong heat stress |  | ≥−16, <−11 | Strong cold stress |  |
| ≥25, <33 | Moderate heat stress |  | ≥−21, <−16 | Very strong cold stress |  |
| ≥12, <25 | No thermal stress |  | <−21 | Extreme cold stress |  |
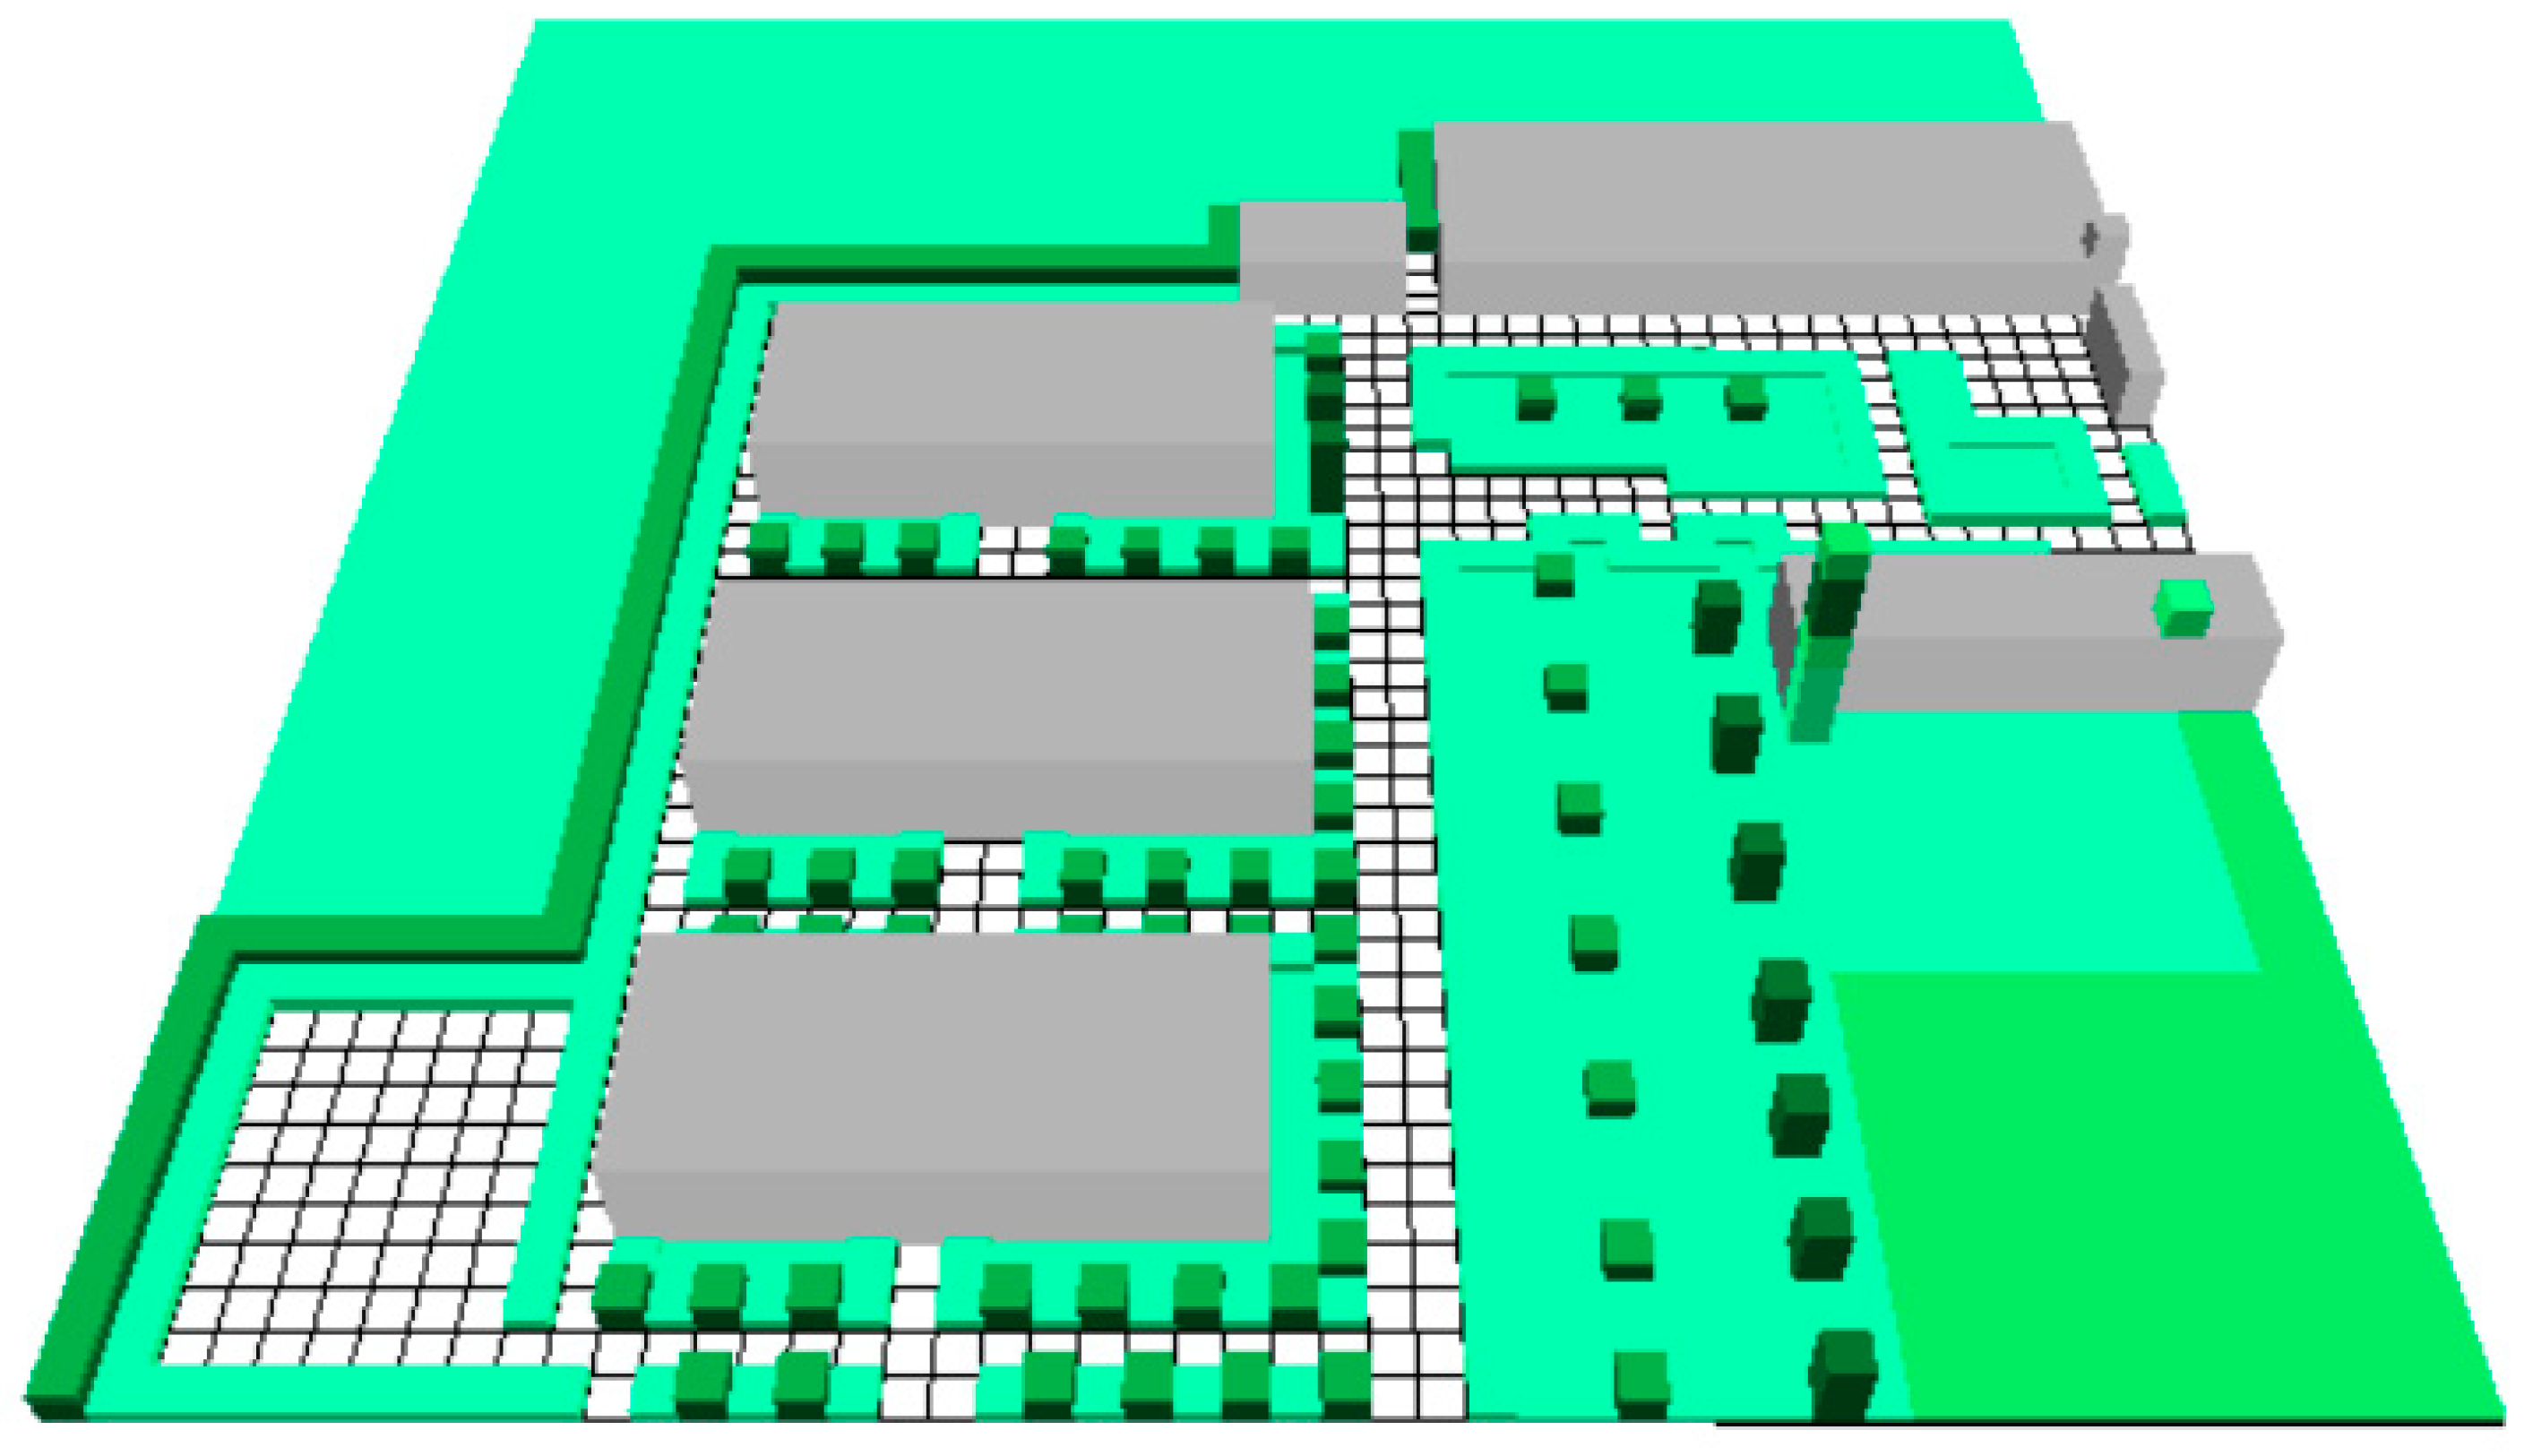
| Type | Size (m) | Number | Parameter Settings |
|---|---|---|---|
| Exterior wall | —— | Constant temperature, heat transfer coefficient is 1.0 W/(K·m2) (JGJ 134-2010) | |
| Interior wall, ceiling, and floor | 1.0 × 1.5 | 3 | Heat insulation |
| Window | 1.0 × 1.5 | 3 | Heat transfer coefficient is 2.5 W/(K·m2) (JGJ 134-2010) |
| Door | 1.2 × 2.4 | 1 | Heat insulation |
| Human | —— | 4 | Sitting height 1.2 m, lying height 0.6 m |
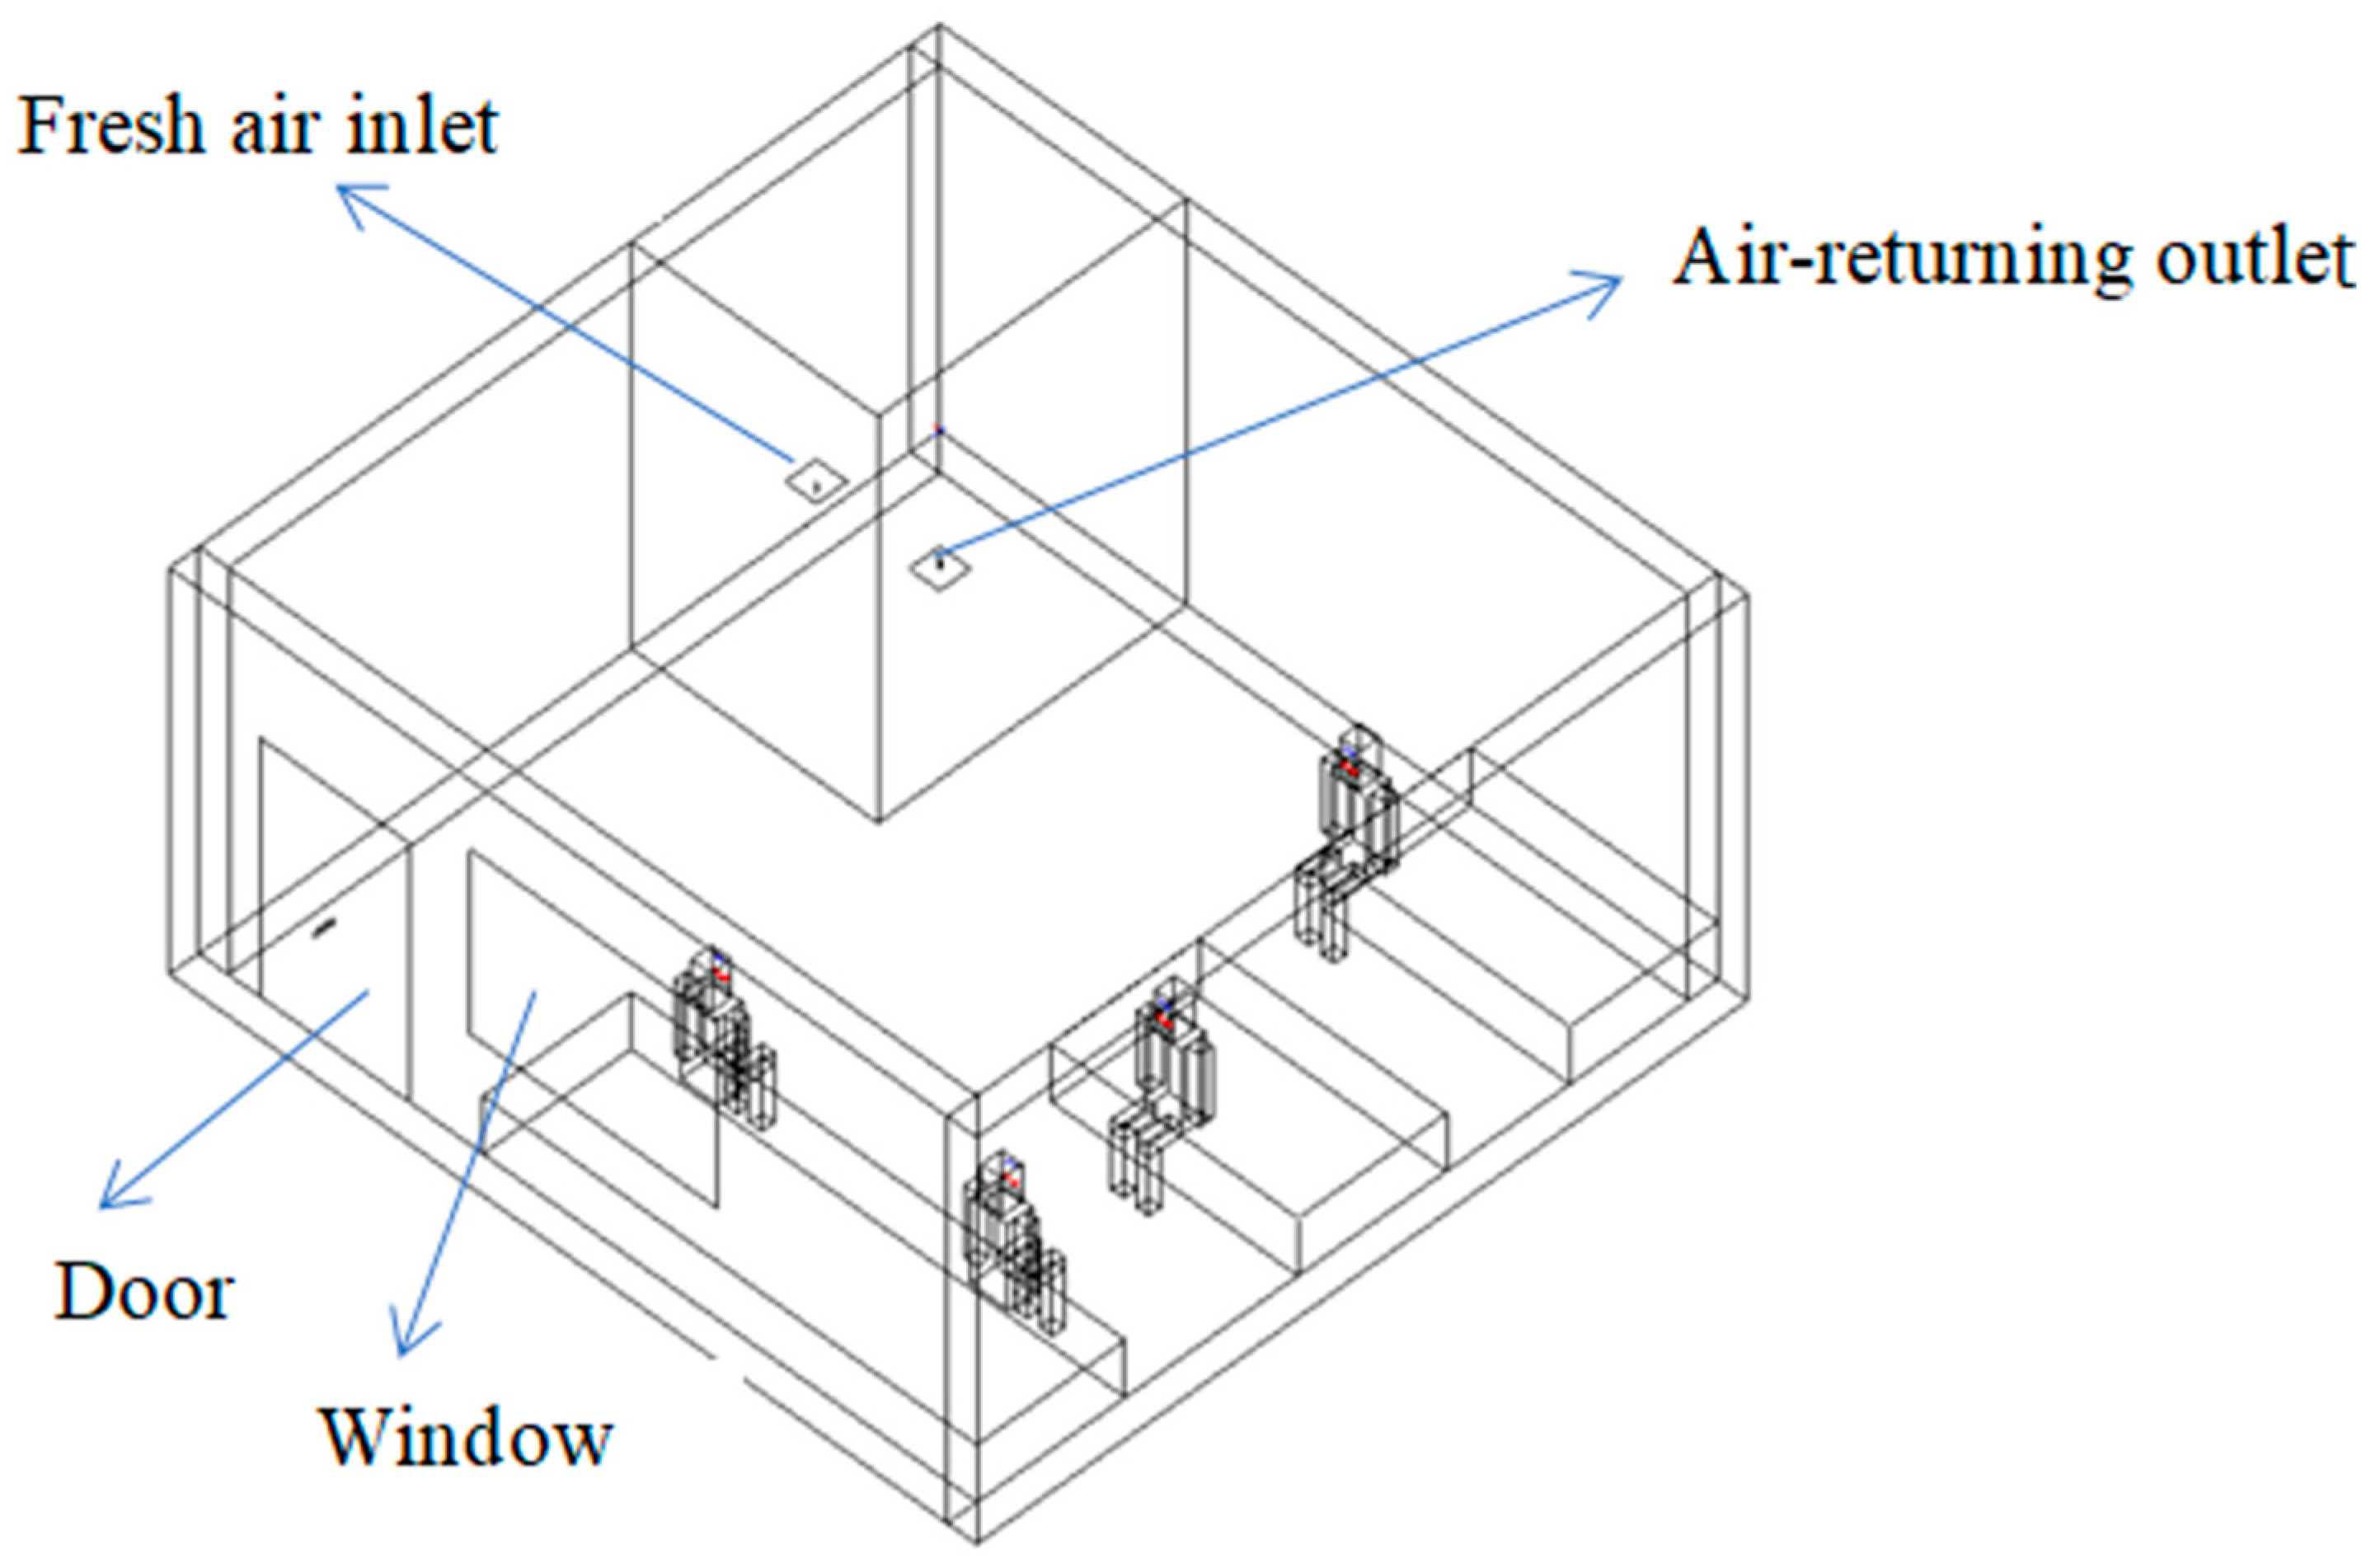
| Size of the fresh air inlet and air-returning outlet | —— | —— | 250 mm × 250 mm, 480 mm × 130 mm |
| Fresh air volume | —— | —— | 0.033 m3/s |
| Bed | 2.0 × 1.2 | 4 | —— |
| Parameters | Spaces | Spr. | Sum. | Aut. | Win. |
|---|---|---|---|---|---|
| Ta (°C) | Indoor space | 23.30 ± 0.3 | 28.58 ± 1.1 | 19.82 ± 0.6 | 11.92 ± 1.1 |
| Corridor | 24.30 ± 0.8 | 29.96 ± 1.6 | 19.75 ± 0.7 | 11.81 ± 1.6 | |
| Road | 26.52 ± 0.8 | 32.29 ± 1.9 | 20.24 ± 0.9 | 12.51 ± 2.1 | |
| Garden | 26.51 ± 1.3 | 32.27 ± 2.3 | 20.21 ± 1.0 | 12.59 ± 2.1 | |
| Mean | 25.16 b | 30.78 a | 20.01 c | 12.18 d | |
| SR (W/m2) | Indoor space | 2.72 ± 0.4 | 16.62 ± 2.0 | 2.08 ± 0.6 | 0.95 ± 0.7 |
| Corridor | 51.83 ± 14.4 | 49.60 ± 13.9 | 36.53 ± 25.2 | 20.30 ± 13.3 | |
| Road | 358.66 ± 89.9 | 364.86 ± 151.8 | 164.95 ± 80.7 | 147.11 ± 81.8 | |
| Garden | 217.94 ± 66.4 | 185.54 ± 65.6 | 108.23 ± 41.8 | 93.67 ± 56.0 | |
| Mean | 157.80 a | 154.15 a | 77.95 b | 65.51 b | |
| RH (%) | Indoor space | 69.05 ± 1.8 | 74.41 ± 4.8 | 71.15 ± 2.6 | 58.77 ± 10.6 |
| Corridor | 60.30 ± 4.4 | 65.19 ± 6.9 | 68.38 ± 3.6 | 54.52 ± 11.6 | |
| Road | 57.32 ± 3.6 | 59.40 ± 5.2 | 64.82 ± 4.6 | 52.88 ± 11.3 | |
| Garden | 51.34 ± 5.1 | 53.75 ± 9.6 | 64.38 ± 4.8 | 51.10 ± 11.3 | |
| Mean | 59.50 ab | 63.19 ab | 67.18 a | 54.31 b | |
| WS (m/s) | Indoor space | 0.00 ± 0.0 | 0.00 ± 0.0 | 0.00 ± 0.0 | 0.00 ± 0.0 |
| Corridor | 0.10 ± 0.1 | 0.07± 0.0 | 0.02 ± 0.0 | 0.15± 0.1 | |
| Road | 0.11 ± 0.1 | 0.12 ± 0.0 | 0.02 ± 0.0 | 0.14 ± 0.1 | |
| Garden | 0.06 ± 0.0 | 0.06 ± 0.0 | 0.00 ± 0.0 | 0.09± 0.1 | |
| Mean | 0.07 ab | 0.06 ab | 0.01 b | 0.10 a |
| Parameters | Correlation Coefficient of the Number of Corridor Users | Parameters | Correlation Coefficient of the Number of Road Users | Parameters | Correlation Coefficient of Number of Garden Users |
|---|---|---|---|---|---|
| ΔT1 | 0.014 | ΔT2 (X1) | 0.353 * | ΔT3 (X1) | 0.373 * |
| ΔSI1 (X1) | 0.388 * | ΔSI2 | 0.318 | ΔSI3 | 0.248 |
| ΔRH1 | −0.149 | ΔRH2 (X1) | −0.491 ** | ΔRH3 (X2) | −0.433 ** |
| ΔWS1 (X2) | 0.386 * | ΔWS2 | −0.242 | ΔWS3 | 0.021 |
| ΔUTCI1 (X3) | 0.330 * | ΔUTCI2 | 0.133 | ΔUTCI3 | 0.196 |
| Fit equation | Fit equation | Fit equation | |||
| Y1 = 41.782 + 0.064 X1 + 10.67 X2 + 1.189 X3 Degree of fitting (R2) = 0.213 | Y2 = 16.175 − 0.992 X1 − 0.926 X2 R2 = 0.266 | Y3 = 4.797 − 0.379 X1 − 0.189 X2 R2 = 0.202 | |||
Publisher’s Note: MDPI stays neutral with regard to jurisdictional claims in published maps and institutional affiliations. |
© 2022 by the authors. Licensee MDPI, Basel, Switzerland. This article is an open access article distributed under the terms and conditions of the Creative Commons Attribution (CC BY) license (https://creativecommons.org/licenses/by/4.0/).
Share and Cite
Zong, H.; Wang, J.; Zhou, T.; Sun, J.; Chen, X. The Influence of Transient Changes in Indoor and Outdoor Thermal Comfort on the Use of Outdoor Space by Older Adults in the Nursing Home. Buildings 2022, 12, 905. https://doi.org/10.3390/buildings12070905
Zong H, Wang J, Zhou T, Sun J, Chen X. The Influence of Transient Changes in Indoor and Outdoor Thermal Comfort on the Use of Outdoor Space by Older Adults in the Nursing Home. Buildings. 2022; 12(7):905. https://doi.org/10.3390/buildings12070905
Chicago/Turabian StyleZong, Hua, Jiao Wang, Ting Zhou, Jiarui Sun, and Xuehong Chen. 2022. "The Influence of Transient Changes in Indoor and Outdoor Thermal Comfort on the Use of Outdoor Space by Older Adults in the Nursing Home" Buildings 12, no. 7: 905. https://doi.org/10.3390/buildings12070905
APA StyleZong, H., Wang, J., Zhou, T., Sun, J., & Chen, X. (2022). The Influence of Transient Changes in Indoor and Outdoor Thermal Comfort on the Use of Outdoor Space by Older Adults in the Nursing Home. Buildings, 12(7), 905. https://doi.org/10.3390/buildings12070905