Article

Structural Performance of GFRP Bars Based High-Strength RC Columns: An Application of Advanced Decision-Making Mechanism for Experimental Profile Data

by
Muhammad Kashif Anwar
1,
Syyed Adnan Raheel Shah
1,*,
Marc Azab
2,
Ibrahim Shah
1,
Muhammad Khalid Sharif Chauhan
3 and
Fahad Iqbal
4
1
Department of Civil Engineering, Pakistan Institute of Engineering and Technology, Multan 66000, Pakistan
2
College of Engineering and Technology, American University of the Middle East, Kuwait
3
Department of Architecture, Multan College of Arts, Bahauddin Zakariya University, Multan 66000, Pakistan
4
Department of Mechanical and Structural Engineering and Materials Science, University of Stavanger, NO-4036 Stavanger, Norway
*
Author to whom correspondence should be addressed.
Buildings 2022, 12(5), 611; https://doi.org/10.3390/buildings12050611
Submission received: 25 March 2022 / Revised: 20 April 2022 / Accepted: 21 April 2022 / Published: 6 May 2022

Abstract

:
Several past studies have shown the use of glass fibre-reinforced polymer (GFRP) bars to alleviate the reinforced steel rusting issue in different concrete structures. However, the practise of GFRP bars in concrete columns has not yet achieved a sufficient confidence level due to the lack of a theoretical model found in the literature. The objective of the current study is to introduce a novel prediction model for the axial capability of concrete columns made with bars of GFRP. For this purpose, two different approaches, such as data envelopment analysis (DEA) and artificial neural networks (ANNs) modelling, are used on a collected dataset of 266 concrete column specimens made with GFRP bars from previous literature works. Eight parameters were used to predict the axial performance of GFRP-based RC columns. The proposed DEA and ANNs predictions demonstrated a good correlation with the testing dataset, having R2 values of 0.811 and 0.836, respectively. A comparative analysis of the DEA and ANNs models is undertaken, and it was found that the suggested models are capable of accurately forecasting the structural response of GFRP-made RC column structures. Then, a comprehensive parametric analysis of 266 GFRP-based columns was performed to study the effect of different materials and their geometrical shape.

1. Introduction

Steel corrosion is considered an important parameter for erosion in steel structures or infrastructures due to chloride attacks, such as those in coastal and freezes thaw salt climates [1,2,3,4,5]. However, structural deterioration such as cracking and spalling of the concrete cover would be a common and frequent issue throughout its service life, compromising the load-bearing capability of the RC structures or members. Nowadays, fibre-reinforced polymer (FRP) bars are widely used due to their resistance property against steel corrosion. FRP is also being used as interior stiffeners of bridge components in various countries, including Canada [6,7]. GFRP (Glass-FRP) bars also have been promoted to be applied in construction uses because of their inexpensive cost and excellent strength at low steel proportion [5]. They have become increasingly important in certain concrete structures that have been subjected to a particularly harsh environment [8].
Fibre-reinforced polymers, also called FRPs, have several advantages as compared to conventional or corrosive steel bars, including increased tensile strength, reduced maintenance costs, reduced temperature conductivity, chemical inertness, and electromagnetic resistance [9,10,11]. The FRP bars are used as longitudinal (lateral) reinforcement in reinforced concrete members, i.e., beams or columns, to provide lateral control against buckling due to their lower elastic modulus over steel bars. In the present hostile conditions, FRPs have become a suitable alternative to traditional steel in RC structures [12,13,14,15,16]. FRP reinforcement has been used as a substitute for steel in bridge decks, especially in the US and Canada [17]. Regarding this, no guidelines or standards for GFRP-reinforced columns have been proposed in North America. Similarly, the usage of GFRP bars as longitudinal braces in columns is not suggested by Canadian codes [18,19]. This is since the GFRP-reinforced sections exhibit unstable compressive behaviour. However, statistics and research articles on the structural performance of GFRP-RC (columns) are scarce in the literature.
In the past few decades, GFRP reinforcement has been used to provide flexural or shear support in RC structures [20,21]. Recently, the structural performance of GFRP steel bars used as transverse or longitudinal concrete reinforcement columns to withstand axial loads and flexural moments has gained considerable interest [22,23,24]. Numerous researchers are attempting to determine the strength reducing parameters for GFRP concrete reinforcement columns using a similar approach to steel bars [25,26,27,28]. Therefore, it is necessary to refine the strength decrease variables using a vast dataset of GFRP reinforced columns made by different studies in previous studies. Moreover, there are obvious limitations to such approaches used to estimate the behaviour of GFRP-reinforced compression members. For example, the tensile or compressive strengths of GFRP-reinforcement are not quite similar, and the contribution of GFRP reinforcement against the axial compressive abilities of the GFRP-RC compression member is not considered. The axial capacity and even ductility of GFRP bars in compression members are improved by increasing the confinement of concrete composite materials. In contrast, the axial load capacity was affected as compared to a concrete column embedded with steel bars [29,30,31,32,33]. Neglecting the impact of GFRP bars on the axial response of structural elements made with GFRP bars is conservative. The effects of GFRP bars on reinforced concrete columns overlap with the laboratory tests performed when examining the structural stability of GFRP bars [24,34].
In the previous literature, there are numerous studies on the employment of FRP bars in various structural elements [35,36,37,38,39,40,41,42,43,44,45,46,47,48]. De Luca et al. [49] studied the effects of glass FRP bars in compression members on a large scale. It was established that the axial load design of concrete compression members with GFRP was not like that of reinforced concrete columns made with steel bars. Moreover, a comparison was carried out between steel and GFRP bars in compression members. The samples were cast with both reinforcement bars and had equivalent dimensions. The central-strengthened GFRP concrete proved to have had no effect on the axial capacity of the columns. Moreover, samples with a smaller tie distance showed more ductile behaviour as compared to those with a wider tie distance. The presence of GFRP bars showed a 5 to 11% improvement in axial capacity when sufficient vertical ties were used [25,49,50]. The behaviour of square GFRP-based RC columns was studied by Tobbi et al. [25]. It is evident that the application of GFRP ties was an effective means of confining the concrete core. It was experimentally found that by reducing the tie spacing gap ranging between 120−80 mm, the axial load-bearing ability of the columns was raised by around 20%. Another researcher [51] investigated the load capacity of GFRP reinforcement in compression members. It was found that to achieve equivalent performance as shown by reinforced concrete made with steel bars, the hybrid columns should have higher GFRP spiral and vertical or longitudinal reinforcement ratios. Similarly, the authors developed equations for the prediction of stress-strain mechanisms along with axial strength in circular columns made of reinforced CFRP [26,52,53]. It was concluded that the longitudinal reinforcement of CFRP gave a 5 to 10% increase in ultimate axial strength. Hadi et al. [54] investigated 12 samples made of GFRP-reinforced bars measuring 205 and 800 mm in diameter and height, respectively. It was found that neglecting the presence of GFRP bars in column axial performance leads to a significant variation in experimental testing and empirical findings.
The empirical evidence estimates for the FRP-based RC columns were established with a restricted number of prior data, worksheets, and curve-fitting algorithms with basic curve fitting tools. To get an appropriate model, investigators cannot cover all the correlations and pairs of parameters. Artificial neural networks have grabbed the attention of academics in Civil Engineering for simulating a variety of structures [55]. ANNs are non-linear models and could capture complicated interactions between various parameters in a structure, even when the nature of such interactions is unknown. The numerical methods developed with regression analysis are thought to be ineffective in predicting the effects of FRP bars in concrete columns. The performance of such structures is influenced by the interaction of numerous variables, and hence, the prior experimental evidence is inconsistent. The interactions between the multiple parameters in the ANN algorithm are controlled automatically and updated based on the information collected for training. It is preferable to acquire a large set of data from the previous study to ensure the validity of such a proposed approach using linear regression. Numerous novel numerical simulations related to genetic coding, regression analysis, and artificial neural networks (ANNs) have been used as an optimum setting for FRP-based reinforced or confined concrete [12,56,57,58,59,60,61,62,63,64]. In parallel to these techniques, different researchers were applying benchmarking techniques like data envelopment analysis (DEA), which were emerging with the quality to evaluate multiple inputs and multiple output for converging into one index value for ranking and prioritizing the best available combinations [65,66,67,68,69,70,71,72,73,74,75,76,77,78]. However, FRP and GFRP related research was also growing and researchers [79,80,81,82,83,84,85,86,87,88,89,90,91,92,93] were focusing on this field with variety of experiments and variable exploration using different statistical techniques.
The application of data envelopment analysis (DEA) for measuring the axial performance of RC columns wrapped with GFRP bars has not yet been found in previous studies. Therefore, the main purpose of the current study is to introduce an effective and novel approach named data envelopment analysis (DEA) for the prediction analysis of the axial strength of GFRP bars in RC columns. Finally, the validity of the proposed models is checked based on the comparative analysis of both models. The collected dataset was consisting of specimens made with GFRP bars, which were collected from previous literature works. Moreover, a comprehensive parametric analysis of GFRP-based columns was performed to study the effects of different materials and their geometrical shapes. The results of this study will help researchers and structural engineers in the analysis and design of GFRP-made RC column members.

2. Development of Dataset

The experimental axial behaviour of GFRP-based RC columns has been studied extensively in the literature by several studies. The application of optimization can be divided into the following four categories: cost reduction, improve structural performance, reduce carbon emission, and multi-objective (combination of two or more). The optimization process of modelling approaches is based on three main components such as design parameters, cross-sectional areas, and constraints. The methodology to achieve structural optimization and acquire the best design is described by optimization methods and practices. Computing and design software are the two forms of software applications used in structure optimization. Optimization programs are run using computational software such as ANNs and DEA model, which determines the best outcome using repetitions. Then, the geometrical data of the concrete columns can easily be transferred to another software such as E-Tab.
A large dataset of 266 RC column specimens wrapped with FRP were collected in the context of these studies as provided in Supplementary Datasheet. FRP bars were used for longitudinal bars, and FRP or steel hoops, FRP spirals, were used for transverse reinforcement. The cross-sections of 142 samples were a circular shape, whereas the cross-sections of 124 samples were square or rectangular in shape. Out of these, 18 samples were made with steel spirals, 33 concrete samples with steel hoops placed transversely, and 97 samples of GFRP hoops. In total, 08 samples are wrapped from CFRP spirals, and 110 samples are confined in GFRP spiral (helical). The following parameters included in this dataset (study) are: (i) details of GFRP concrete columns related to its cross section, (ii) ultimate tensile stress (fu) of FRP reinforcement, (iii) compressive strength (fc) of concrete, (iv) ultimate tensile strain (εu) of FRP reinforcement, (v) elastic modulus (Ef) of FRP bars column, (vi) transverse (t) and (vii) longitudinal (l) reinforcement ratio, and (viii) column axial load carrying capacity (Pn).
Table 1 summarizes the statistical analyses of all these indicators. The coefficient of variance is abbreviated as COV, while the standard deviation of varying parameters is St. Dev. Statistical analyses were carried out for all eight variables, and descriptive analyses of these parameters are presented in Table 1. The standard deviations values are different among these variables. The standard deviation value for efficiency is less among all, which is 0.1738, and the average mean value is 0.8106. The standard deviation value of Ag is 53,563 mm, whereas their average mean value is 68,208. The Q3 values indicated that 75% of the datasets are equal or < than to this reading. The higher variation values indicate a greater spread of the datasets. Correlation analyses were also carried out to find out the significance level among the variables (Figure 1). When the p-values are <0.05, then it shows a statistically significant result among the two variables. If the p-value is >0.05, then it will not be a statistically significant result and we reject it. The probability values of all parameters are summarized in Figure 1.

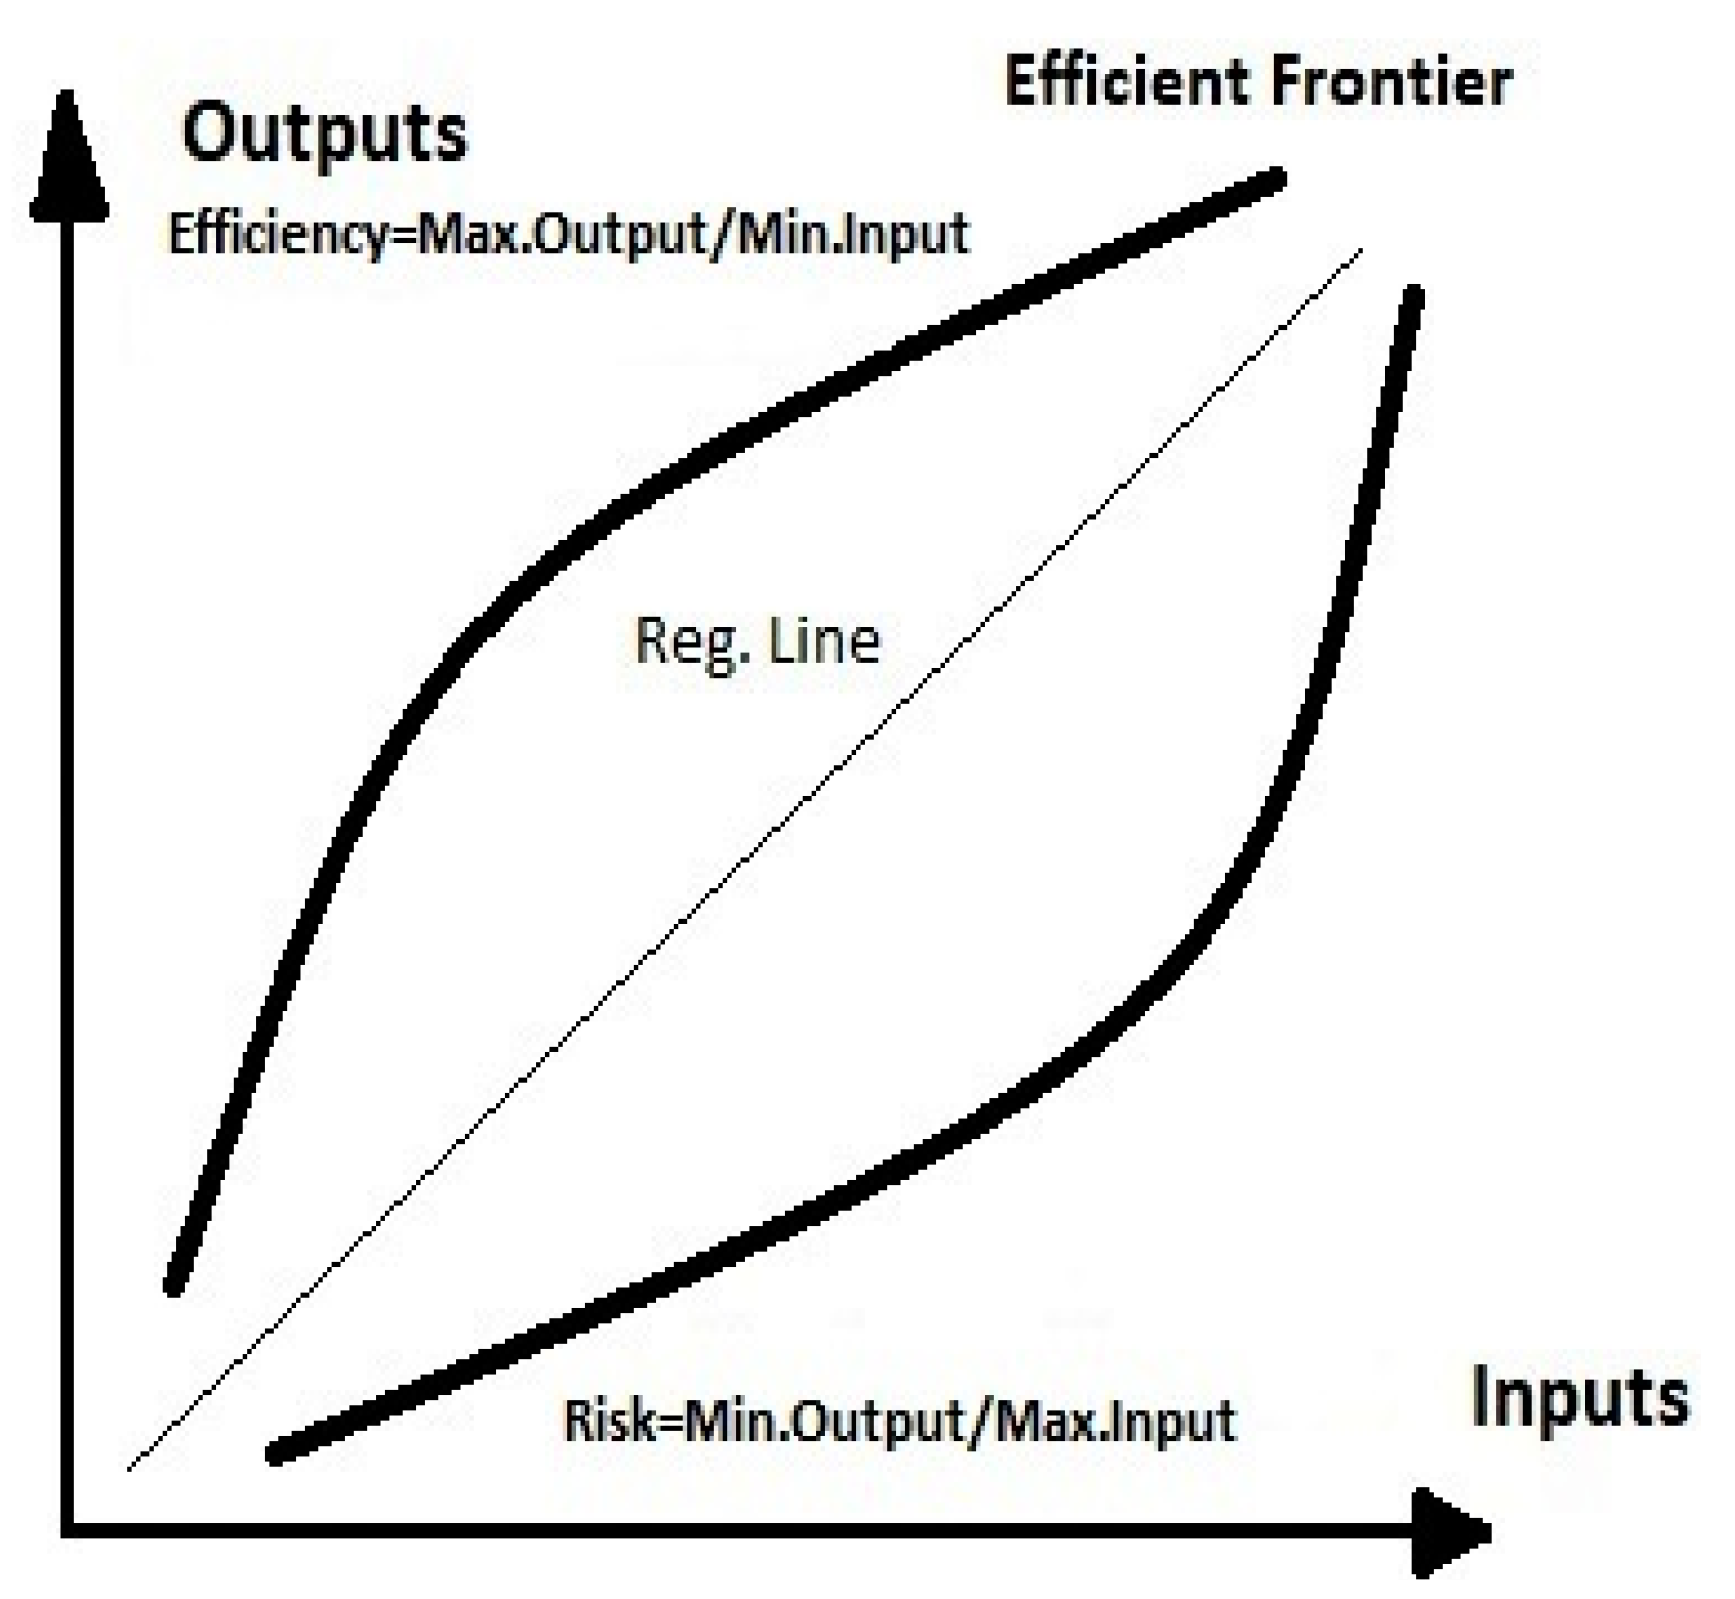
3. Data Envelopment Analysis (DEA) Model

There are basically two methodologies (such as parametric and non-parametric) in scientific research studies for determining the performance of the system, and each of them requires an output function. The parametric process uses a pre-existing functional form, whereas the nonparametric procedure does not rely on this. In fact, a structure with multiple inputs and outputs cannot be represented using the parametric form [65]. Nowadays, multiple input and output systems, instead of a one or a single output, are frequently used in practical applications. As a result, Charnes et al. [66] and Zhu et al. [67,68] developed DEA to analyse systems with multiple inputs and outputs. Cooper et al. introduced and presented a non-parametric method of assessing relative effectiveness while considering homogonous decision-making units called DMUs in 1978 [69]. DEA is a statistical linear programming approach that is used in this methodology (study). Several research articles based on the model have been published in different sectors (such as the finance industry, roads, agriculture, civil engineering, mining, academic institutions, healthcare, product management, energy, the environment, and many other fields) that have expanded tremendously during the previous four decades. Hence, the application of DEA has progressively spread in multiple fields of research [70,71,72,73,74]. Moreover, it is well suited to commercial practises, and it has been regarded as a valuable analytical research tool [67,75]. The DEA model assesses their effectiveness. It is based on a decision-making unit called the DMU, in which multiple parameters are used for the understanding of input or output variables, which are frequently complex and vital. An output frontier, also called an envelopment degree of outcome potential fit, determines a unit’s performance in DEA. A unit within the efficiency threshold is said to be an efficient unit; conversely, it is considered an inefficient unit. The rating of effectiveness for such a system is positive, ranging from 0 to 1. A rating of 1 means a unit is efficient, while a score of <1 represents an inefficient unit. A reference conceptual diagram can be seen in Figure 2.

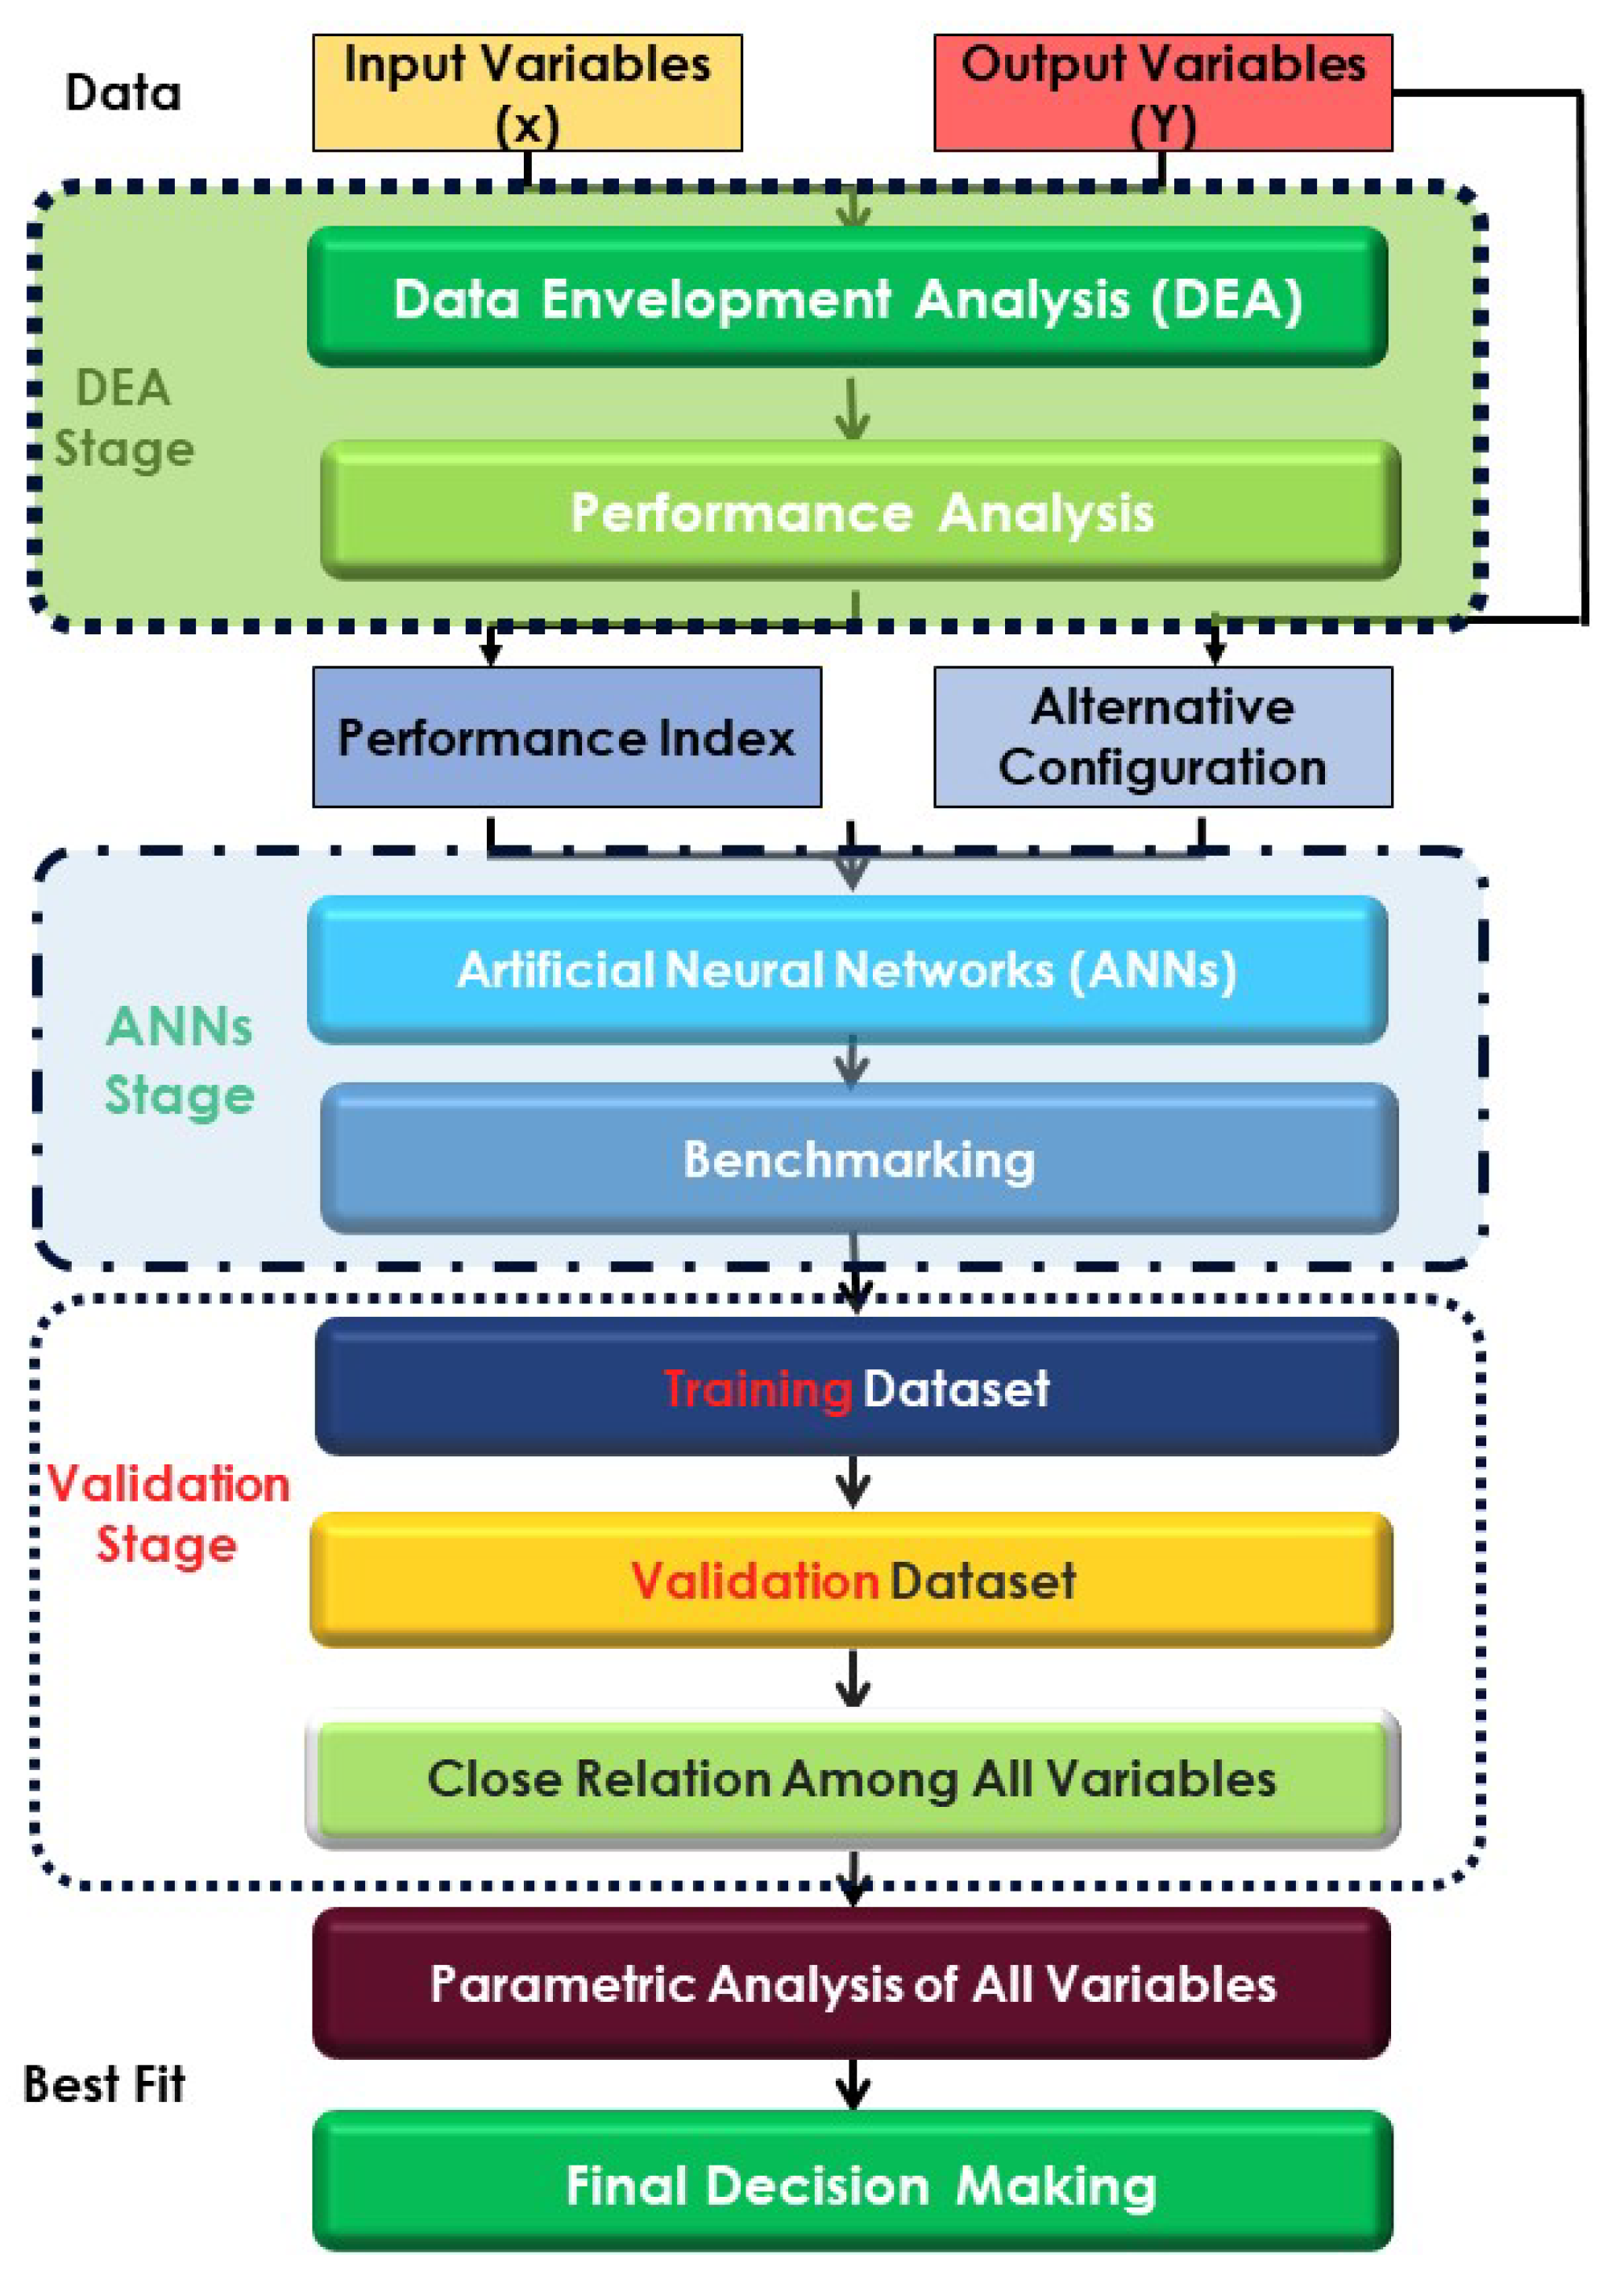
4. Research Methodology

4.1. Efficiency Calculation Model (Most Efficient Combination for Column Development)

Data envelopment analysis or modelling is a computational way of design as first proposed by Charnes et al. [66], which compares the performance of many decision-making units called DMUs based on so many inputs or outputs. Let’s define a set of ns in DMU, each of which uses “m input” to yield output “s”. When it comes to constant return scale, each efficiency of DMU is established based on its total weighted outcomes and is divided by the sum of its input nodes [76]. Figure 3 presents the research methodology (flow chart) adopted for the current research work.
  Efficiency   of   DMU j = e j =   weighted   sum   of   outputs     weighted   sum   of   inputs   = u 1 y 1 j + + u s y s j v 1 x 1 j + + v m x m j
DEA model optimizes the productivity of all DMUs based on the defined attributes. The overall performance ( e o ) for individual DMUO ( e j ) can be calculated by using the given below Equation (2) as per CRS in accordance with n multiple DMUs.
Max e o = r = 1 s u r y r o i = 1 m v i x i o   S . t .   e j = i = 1 s = 1 u r y r j i = 1 m x i j 1 , j = 1 , , n ,           u r 0 , r = 1 , , s , v i 0 , i = 1 , , m .
where the weight of the “outcome r” is denoted by “ u r ”, the weight of the “input i” is denoted by “ v i ” and the efficiency or performance of DMUj model is denoted by “ e j ”.
As Model Equation (3) is non-linear coding, Charnes Cooper [69] modifications can be used to change it to linear coding.
Max     e o = r = 1 s u r y r o   S . t .   r = 1 s u r y r j i = 1 m v i x i j 0 , j = 1 , , n , i = 1 m v i x i o = 1 , u r 0 , r = 1 , , s , v i 0 , i = 1 , , m .
The BBC (Banker, Charnes, Cooper) model of past DEA especially by Banker et al. (Equation (3)) can also be used to measure the accuracy of a specific DMUo with reference to the variable returns scale mechanism [76].
Max   e o = r = 1 s u r y r o + u 0 S . t .   r = 1 s u r y r j i = 1 m v i x i j + u 0 0 , j = 1 , , n , i = 1 m v i x i o = 1 , u r 0 , r = 1 , , s , v i 0 , i = 1 , , m . u 0   is   free   in   sign  
Here, u 0 value can be positive, negative, and neutral resulting in return scale of variable with careful consideration for an ideal solution. In most cases, RS reveals that a trade-off among inputs or outputs is expected before one of such variables.
In this study, axial response of GFRP bars in concrete structures is measured using this model with multiple input and output variables. These variables are then scored and analyzed using the DEA model to determine their efficiency or performance. The optimal axial capacity is often in the thoughts of a decision maker (researcher). However, a researcher (DM) may frequently make a note to develop a more detailed comparison among DMUs on predefined E. The current further analysis will facilitate to measure the ultimate efficiency in the separation of all the competent axial capacities of concrete column. Lingo software was also used to acquire the outputs of the DEA models in this study. Lingo is an advanced design tool and modelling application for prediction of complicated and large mathematical equations and can also deal with linear, non-linear, and hybrid forms of systems. Another benefit of this tool is that it has a simple structure and simplicity of design, as most of the commands (keys) and words applied are familiar as compared with those found in previous computational model literature works.

4.2. Ranking Process

In this section, we first employ a method for obtaining common weights, which is both helpful and necessary for ranking efficient axial strength. As a solution to the available alternative weights, the steps below are presented [77].
Step 1:
solve Equation (4) and obtain a set of effective DMUs; E = { j e j * = 1 , j { 1 , , n } } .
Step 2:
solve Equation (5) and calculate the optimum value called Δ.
Step 3:
solve Equation (6) and find max common weights as well as optimum estimate Φ.
Step 4:
solve Equation (7) and find out efficiency score (rating) for axial capacity of concrete column made of GFRP bars.
The performance of the set of useful DMUs for the axial compression loading member is determined in first stage. In stage 2, we shall try to minimize the overall virtual gap among all production quality and their productivity about frontier forecasts. We choose one appropriate weight in stage 3 as stage 2 often confronts the availability of other weights. As a result, we keep the ideal significance level of (5) as a linear programming criterion (6). We also use the optimization of the total input weights and elimination of the total output weights as the requirement in the current free factor u0. Therefore, accepting a smaller value of weights is related to a broader set of output metrics and similarity for output indicators. It is preferable to employ a wider set of input metrics weights rather than a narrower range of input indicators [77]. Proceed by establishing Equation (7) and then solving it to get the score of efficient DMUo, with θ0 value in the decision making of variables by using the infinity norm [78].
Δ * = Min         j E Δ j   S . t .                           r = 1 s u r y r j i = 1 m v i x i j + u 0 + Δ j = 0 , j E ,                                           u r ε > 0 , r = 1 , , s ,                                           v i ε > 0 , i = 1 , , m .                                           Δ j 0 , j E                                           u 0   is   free   insign  
φ * = Min   r = 1 s u r i = 1 m v i + u 0 S . t .                     r = 1 s u r y r j i = 1 m v i x i j + u 0 + Δ j = 0 , j E ,                                     j E Δ j = Δ *                                     u r ε > 0 , r = 1 , , s ,                                     v i ε > 0 , i = 1 , , m .                                     Δ j 0 , j E                                     u 0   is   free   in   sign
θ o * = Max   r = 1 s u r y r o i = 1 m v i x i o + u 0 v t y t 0 S . t .                       r = 1 s u r + i = 1 m v i v t = 1 ,                                     r = 1 s u r i = 1 m v i + u 0 = φ * ,                                     r = 1 s u r y r j i = 1 m v i x i j + u 0 0 , j E , j o ,                                     0 < ε u r , r = 1 , , s ,                                     0 < ε v i M , i = 1 , , m .                                     u 0   is   free   in   sign
Here, M is a real number (R), and r is equal to 1. y t 0   is   equal   to   m a x ( y r 0 ) . The gap among the efficient DMUs in represented by Δj with frontier efficiency. Note that Δj is equal to zero and denotes that DMUj is in Hyperplane i = 1 m v i x i + r = 1 s u r y r = 0 . So, given Equation (8) can be used as per available data variables as follows:
  Efficiency   of   DMU j = e j =   weighted   sum   of   outputs     weighted   sum   of   inputs   = u 1 f c + u 2 P n v 1 Ag + v 2 fu + v 3 Ef + v 4 ε u + v 5 ρ l + v 6 Af + v 7 P t
The value of the 1 is considered as best option. It will help to calculate the best efficient combination for column with highest strength and axial load capacity. From the developed data set, only best available combination from each research resource have been shown in Table 2. Green colour shows excellent combination and orange colour shows good available conditions within a single source but have value less than 1.

5. Results and Discussions

5.1. Assesment of Artificial Neural Networks Modelling

The testing data collected from the literature are used for training and validation of the ANNs model for better analysis result. A large dataset of 266 RC column specimens wrapped with FRP was collected in the context of these studies, as provided in the Supplementary Datasheet. The FRP bars were used for longitudinal bars, and FRP or steel hoops, and FRP spirals, were used for transverse reinforcement. The cross-sections of 142 samples were of a circular shape, whereas the cross-sections of 124 samples were square or rectangular in shape. Out of these, 18 samples were made with steel spirals, 33 concrete samples with steel hoops placed transversely, and 97 samples of GFRP hoops. In total, 08 samples are wrapped in CFRP spirals, and 110 samples are confined in GFRP spirals (helical). K-fold cross-validation is recommended for such a given data size, as per the relevant papers. The data from the similar research works were combined to create a unique predictive model for each axial capacity parameter under consideration, such as (i) details of GFRP concrete columns related to its cross section, (ii) ultimate tensile stress (fu) of FRP reinforcement, (iii) compressive strength (fc) of concrete, (iv) ultimate tensile strain (εu) of FRP reinforcement, (v) elastic modulus (Ef) of FRP bars column, (vi) transverse (t), and (vii) longitudinal (pl) reinforcement ratio, while column axial load carrying capacity (Pn) is taken as an output variable for the training of dataset using ANNs model. In this study, seven hidden layers were selected for ANNs modelling, equivalent to seven input parameters for better understanding and desired output of the system, as shown in Figure 4.

5.2. Assesment Procedure

An extensive empirical approach from the past research was assessed on the produced data source of GFRP-wrapped RC columns to acquire a general equation for axial capacity. The existing approaches used for modelling the axial strength of concrete members wrapped with GFRP bars were also studied. Different statistical indicators (such as root mean squared error (RMSE), the sum of squared error (SSE), and coefficient of determination (R2)) were used to evaluate such equations. The value of R2 is a significant statistical indicator used for the perfect fit and prediction of the experimental dataset and was used in the comparison analysis as given by Equation (9).
R 2 ( x , y ) = ( n ( x y ) ( x ) ( y ) [ n x 2 ( x ) 2 ] [ n y 2 ( y ) 2 ) 2                                
where the total data size is represented by “n”, “x” denotes the axial load capability of GFRP bars in concrete elements as determined by tests, and “y” is the parameter projected by empirical equations for the load ability of RC columns made with GFRP bars. The model has been presented by Afifi et al. [26] and found the greatest R2 value (R2 = 0.711). The performance of the prediction model improves with the increase in the R2 value. When R2 equals 1.0, it indicates that the experimental and estimated findings for the load-carrying capacity of concrete columns are perfectly correlated. Therefore, the current proposed model is inspired by the model presented by Afifi et al. [26]. The input of FRP reinforcement in the measurement of the axial load capacity of compression members made with GFRP bars was considered due to their reduced cross-sectional area and tensile strength, Eq 10, represents the suggested model in its general form.
P n = α 1 ( A z A F R P ) f c + α 2 f F R P A F R P
where α1 and α2 are called reduction factors, Ag represents the gross (total) sectional area of testing specimens, AFRP represents the net sectional area used for FRP-reinforcement, and fFRP represents their tensile characteristics. The ranges of such determinants were established using the curve fitting approach in MATLAB software by changing error rates to produce better fitting. Equation (11) can be used to show the relationships as given by [12].
  α 1 = 0.85 β f c
Here, β is a constant. The readings of β constant of 0.0029 and 0.021 were obtained by the curve fitting method to acquire the close relationship of the experimental datasets. The axial strength of GFRP bars in confined concrete elements is measured with the following developed model:
P n = ( 0.85 0.0029 f c ) ( A g A F R P ) f c + 0.0208 f F R P A F R P
The proposed Equation (12) is used for measuring the axial performance of columns made from GFRP bars or with any type of FRP bar spiral or hoops. A reduction factor (α) larger than (>) 0.646 (i.e., α1 = 0.85—0.0029fc ≥ 0.646) should be used for measuring axial strength. The precision of this proposed model was better as compared with all previously established simulations with certain constraints. For example, compressive strength should be within the range (20–70 MPa), fFRP factor should be 406 to 1680 (n/mm2), and εu (peak tensile strain) should be between 0.97−2.42%. The proposed equation in this study responded well with an R2 value equal to 0.73.

5.3. Assesment of Cross-Validation Mechanisms of ANNs Model

The K-fold method is used for cross-validation of a dataset through ANNs modelling. In the K-fold mechanism, the value of k is taken as five, as this method works on 80 and 20 principles. For example, there are overall 266 samples used as a dataset for modelling of ANNs. Out of these, 18 samples were made with steel spirals, 33 concrete samples with steel hoops placed transversely, and 97 samples of GFRP hoops. In total, 08 samples are wrapped in CFRP spirals, and 110 samples are confined in GFRP spirals (helical). The experimental datasets consist of the physical and mechanical parameters to predict the axial performance of GFRP-based concrete column members. Out of 266 specimens, 212 (80%) samples were used for the training of the dataset, while 54 samples (20%) were used for the testing of the ANNs model. The final results obtained from the training stage of the ANNs model on the considered parameters can be seen in Figure 4. The training and validation phase of the ANNs model showed (as shown in Table 3) good matching for the axial capacity of compression members made with GFRP bars.
Training and validation graphical profile can also be seen in Figure 5a,b showing relationship between actual efficiency calculate through DEA and predicted efficiency through ANN. In addition to that, Figure 5c,d shows comparative relationship related to residual profile for training and validation data.

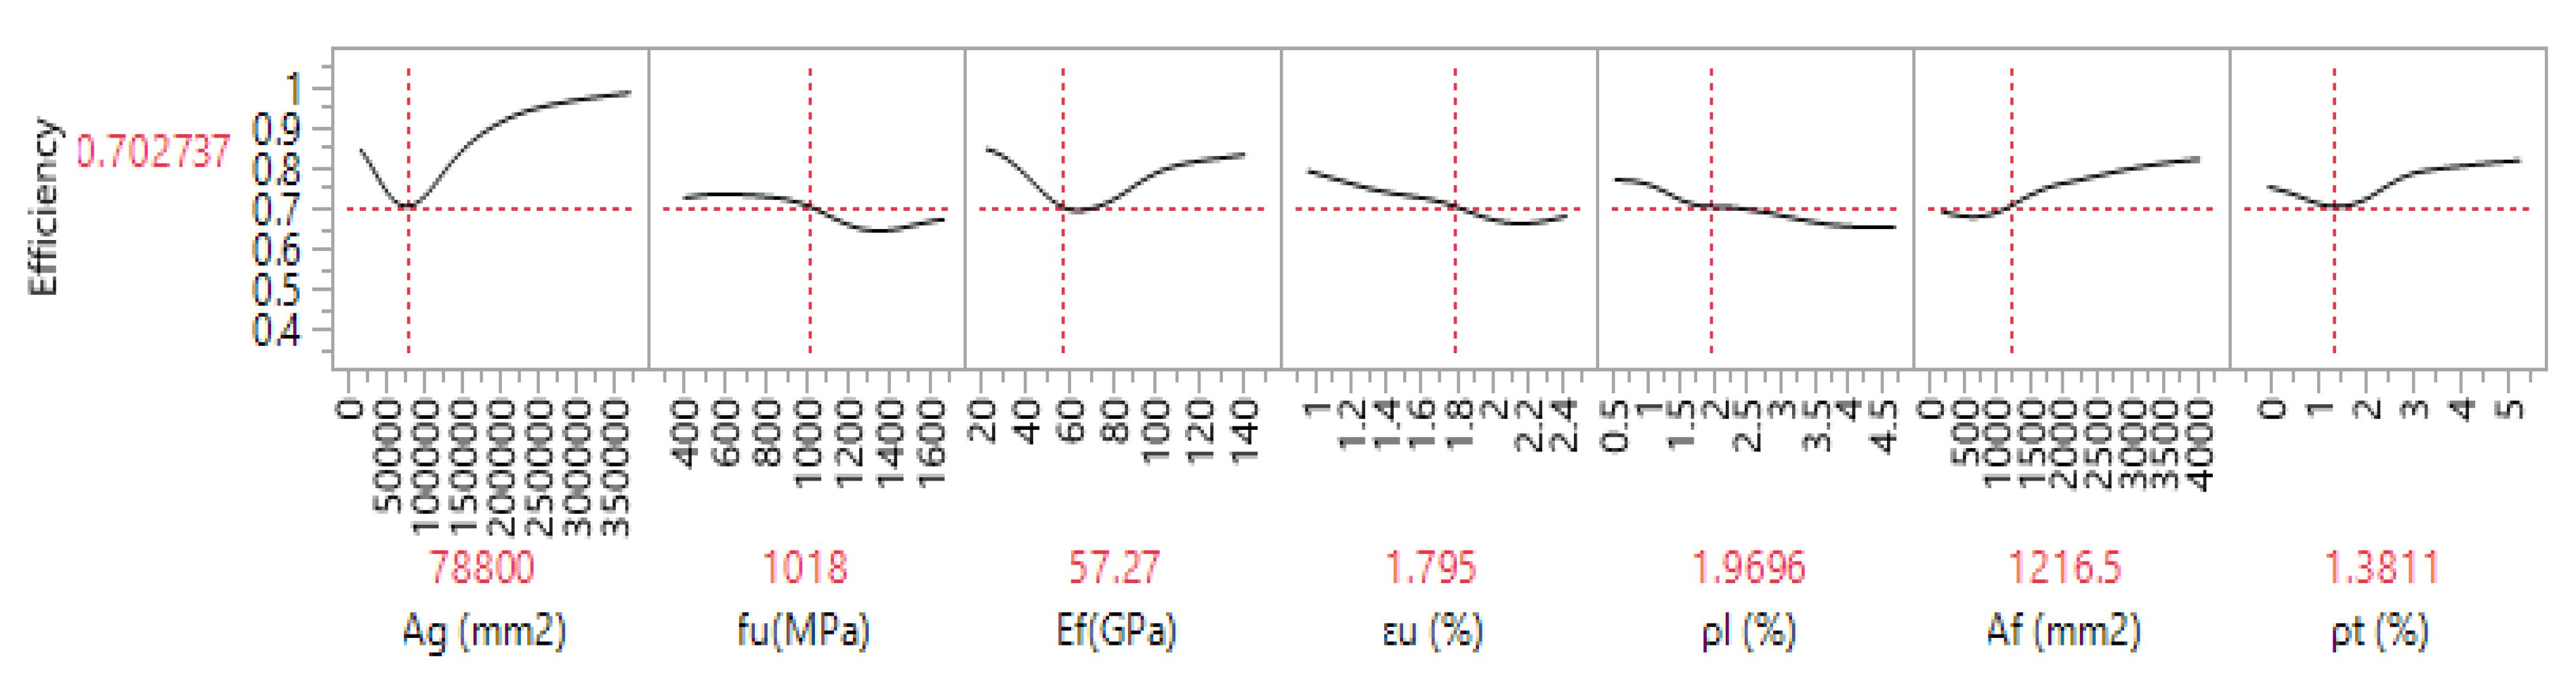
5.4. Prediction Profiler

The prediction profiler plot has been performed on the various parameters using artificial neural network modelling, as shown in Figure 6. The given figure showed the relationships among different variables. The first row (from the left) of the prediction profile showed the efficiency of the model against the cross-sectional area of the columns. It has been observed that initial efficiency was reduced with increasing the cross-sectional area of the column, whereas it tends to increase with an increase in its value. The relationship between tensile strength and the efficiency of axial strength is seen in Figure 6 in the second row (from the left). It was observed that fu values were increased with a decrease in the efficiency range. Similarly, the interaction of efficiency and Ef (elastic modulus) is presented in the third row (from the left), and it was observed that at the start, the efficiency value had decreased with the change in Ef, and afterwards, there was a significant increase in efficiency value observed with increasing Ef values. The relationship of efficiency against ultimate tensile strain and longitudinal bar ratio was plotted in the fourth and fifth rows are given below in Figure 6. There is a decreased trend in efficiency values recorded with an increase in their percentage values, i.e., εu (%) and pl (%). There is an increasing trend observed between efficiency and Af values, which can be seen in Figure 6, in the second row from the right. In the last row from the left, there is a plot between efficiency and pt (%). It can be observed from their plot that initially, there were showed decreased efficiency values with increasing pt percentages. Afterwards, there is a significant increase in efficiency was recorded with increasing pt percentages as per the previous dataset obtained from different research works.

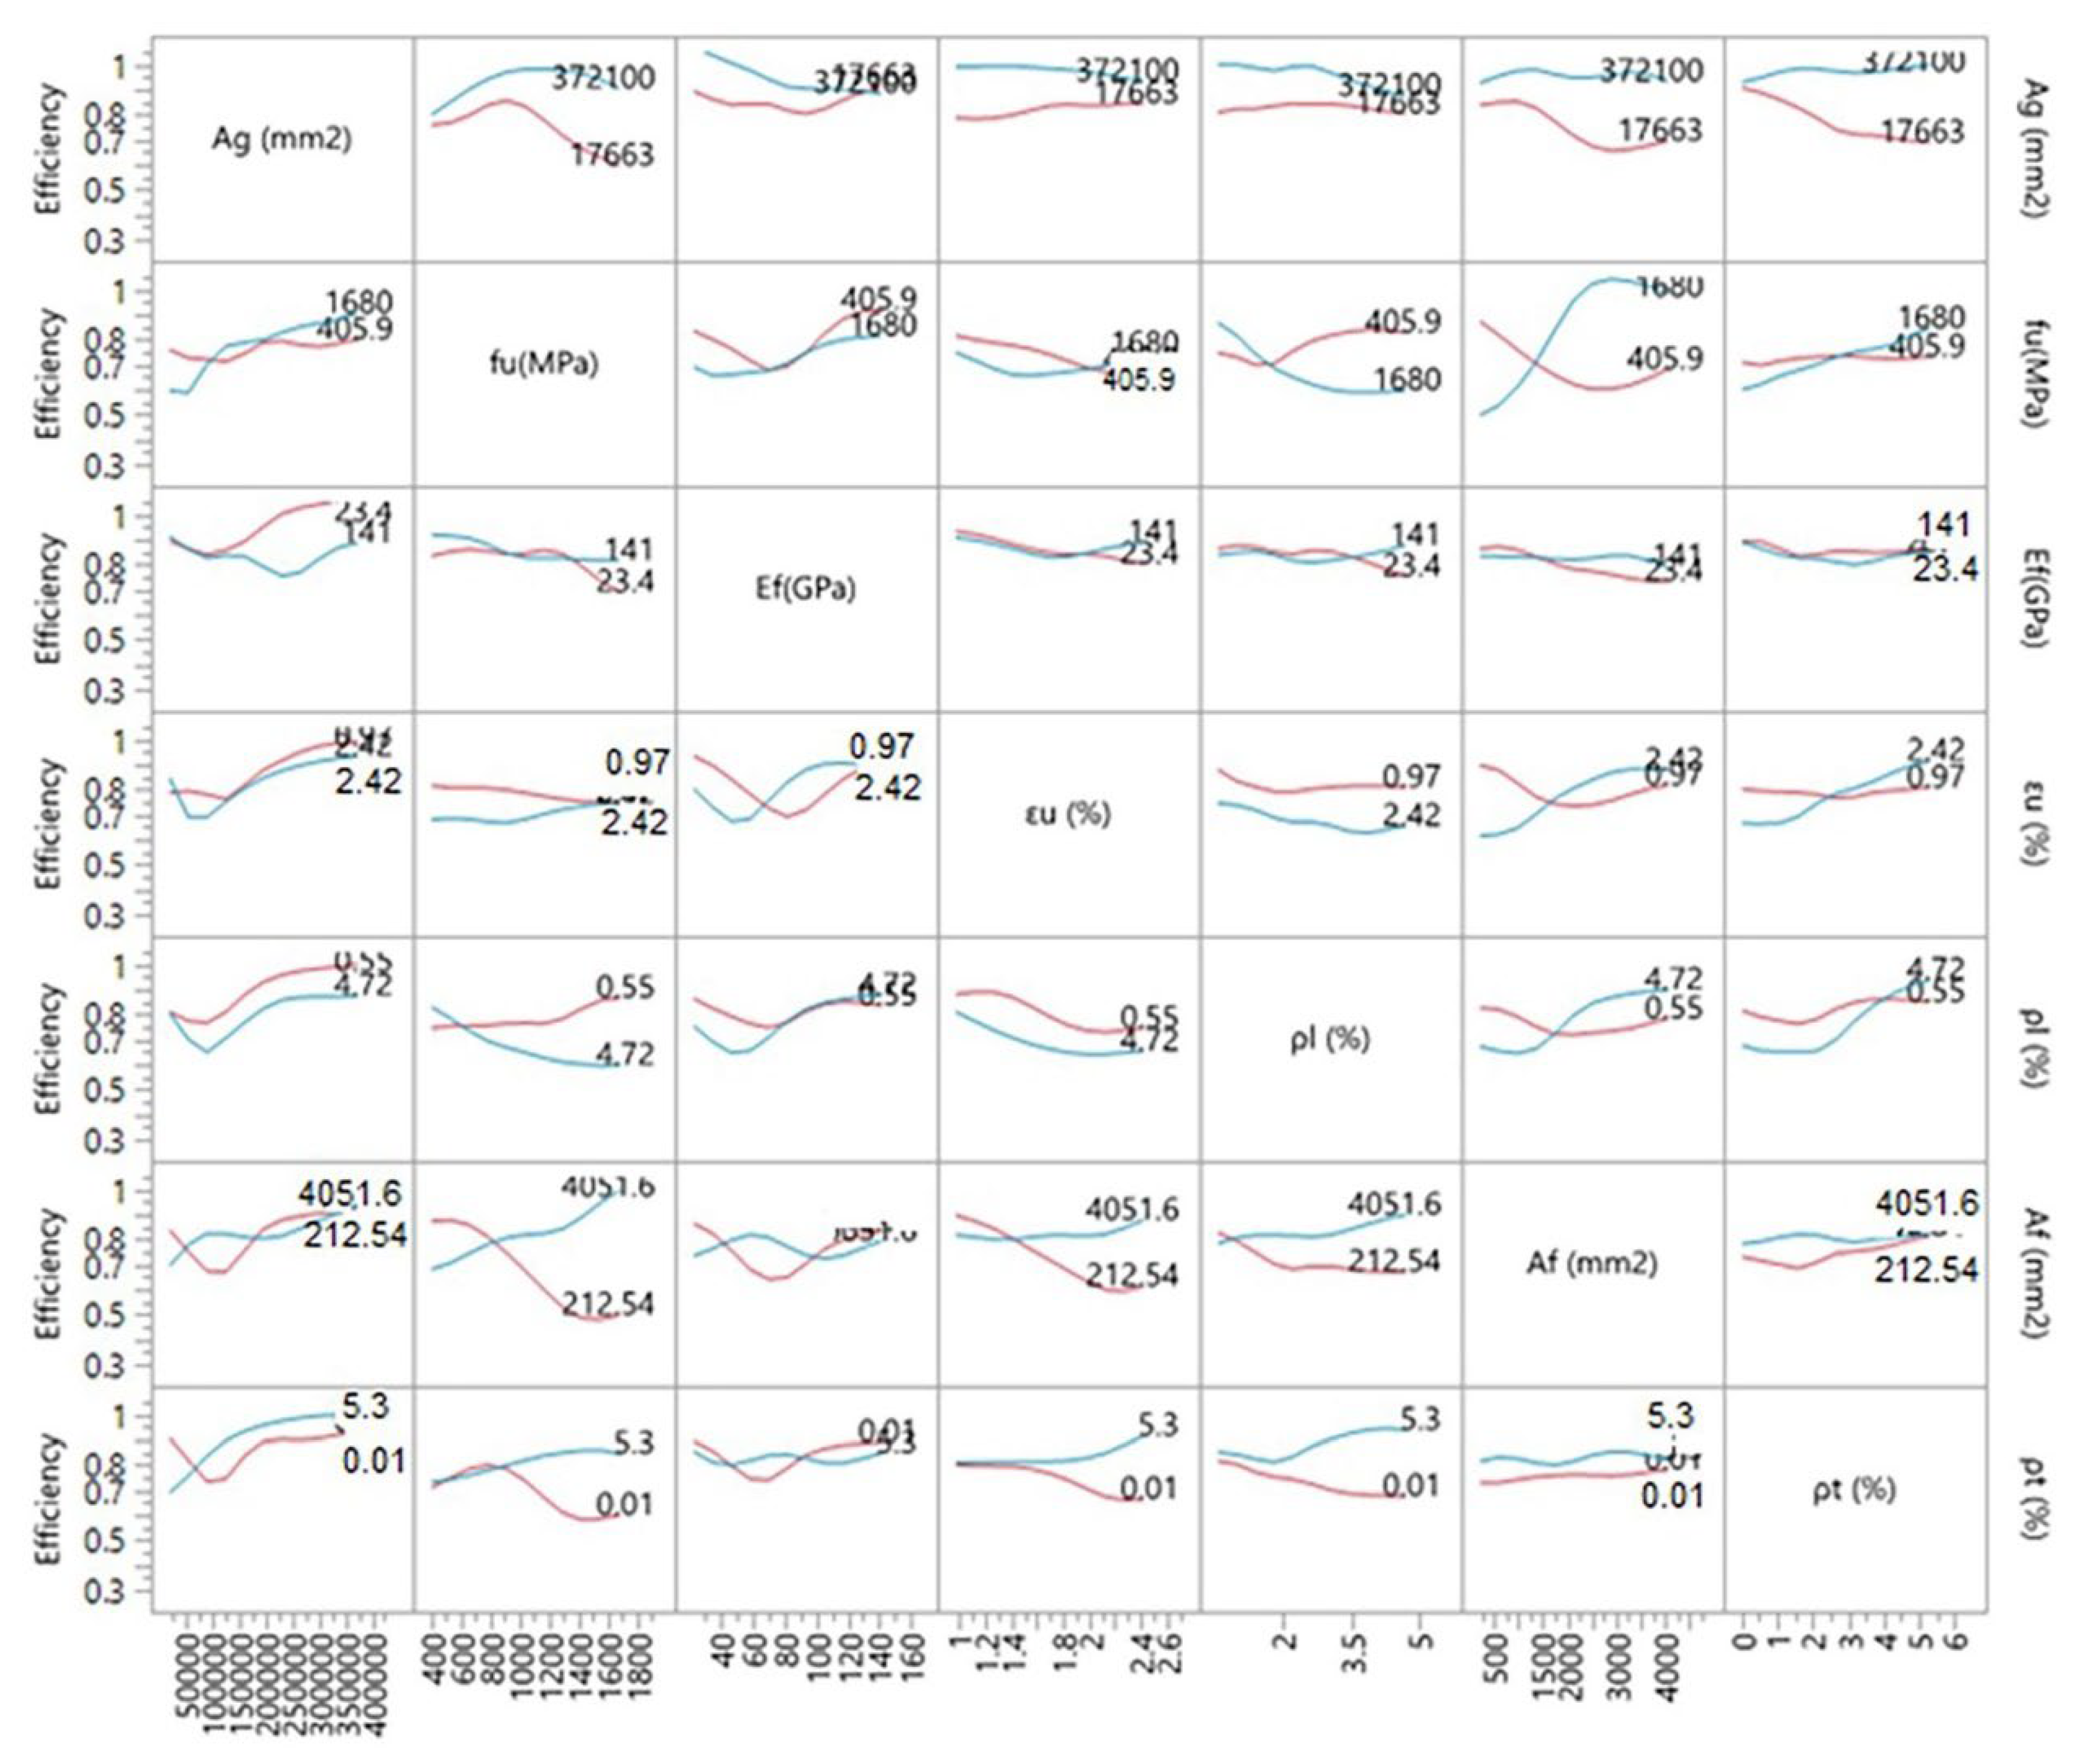
5.5. Interaction Profiler

The interaction profiler, or plot among various parameters for the prediction of the axial strength of GFRP embedded bars in RC columns, is presented in Figure 7. The interaction plot helps us to study and understand the behaviour or relationship between different variables for better comparative analysis. The efficiency or performance of GFRP reinforcement against different factors is presented in Figure 7. In the first row (from the left), the efficiency of GFRP bars and the cross-sectional area of columns in mm2 units are presented and show an increase in efficiency values with an increase in Ag values of the specimens. The relationship between fu and efficiency is presented in the second row from the left of Figure 7. It was observed that, overall, the value of fu was increased with the addition of GFRP bars. The fu values of GFRP bars are greatly affected by two main parameters, such as the Ag of the columns and the compressive strength of GFRP-made concrete columns. Similarly, there is a decreased trend line was observed between the efficiency of GFRP bars against elastic modulus values, as can be seen in the third row (from the left). The interaction profiler between the efficiency of GFRP-made RC columns against both the tensile strain and longitudinal reinforcement ratio (pl) of concrete columns prepared with GFRP bars in the fourth and fifth row from the left side. It was observed that the efficiency of GFRP bars has decreased with both increasing εu (%) and pl percentages. Moreover, the interaction plot between efficiency and Af (mm) is presented in the sixth row from the left. Initially, the efficiency of the GFRP bars is reduced, and after that, there is increase trend in efficiency was observed with an increase in Af values. In the last row from the left side, there is an interaction plot between efficiency and pt (%) of GFRP-made specimens, which shows an increased trendline with an increasing percentage of pl. In conclusion, we can say that the performance of GFRP bars has been improved with their addition to RC columns as compared to traditional reinforced concrete structures, but the increase in their strength is greatly affected by several factors.

5.6. Comparison of Predictions

The axial performances of GFRP-RC columns were carried out using ANNs, DEA and empirical models. The developed database had 266 specimen results out of which 124 are square or rectangular columns and 142 are circular columns. The results clearly shows that the suggested equation and models can accurately predicted the axial behaviour of concrete structures wrapped with GFRP. The axial capacity of glass FRP-based RC columns are compared based on R-square values for all suggested models. The R2 value of 0.83 and 0.86 were observed during training and validation of ANNs model whereas, the root mean square error (RMSE) values were 0.1146 and 0.1108 during training and validation of ANNs model. Similarly, the R2 value of 0.73 were obtained during extensive empirical model on all collected base of 266 specimens. Due to concrete cover and FRP reinforcement, the reducing indicators for the axial capacity of GFRP-made RC columns should be 0.85- 0.0029f’c and 0.021 as obtained from empirical model. The efficiency of 1 reflects the strong axial performance of GFRP wrapped columns which was observed during prediction using DEA model as described in Table 2. The accuracy of DEA model was quite better as compared to other models based on results prediction. As a result, the suggested models are capable of accurately forecasting the structural response of GFRP-made RC column structures.

6. Parametric Study

The suggested experimental model was developed by considering concentric stress or estimating the axial behaviour of compression members of 266 specimens having a rectangular shape made with GFRP bars. Four major factors (such as the cross-section of column side length (B), compressive strength (fc’), vertical bar ratio of FRP (ρl), as well as tensile behaviour of reinforced column with FRP reinforcement (fu) have been studied and investigated throughout the parametric investigation in this research work. The other variables were assumed constant while the significance of one parameter was investigated.

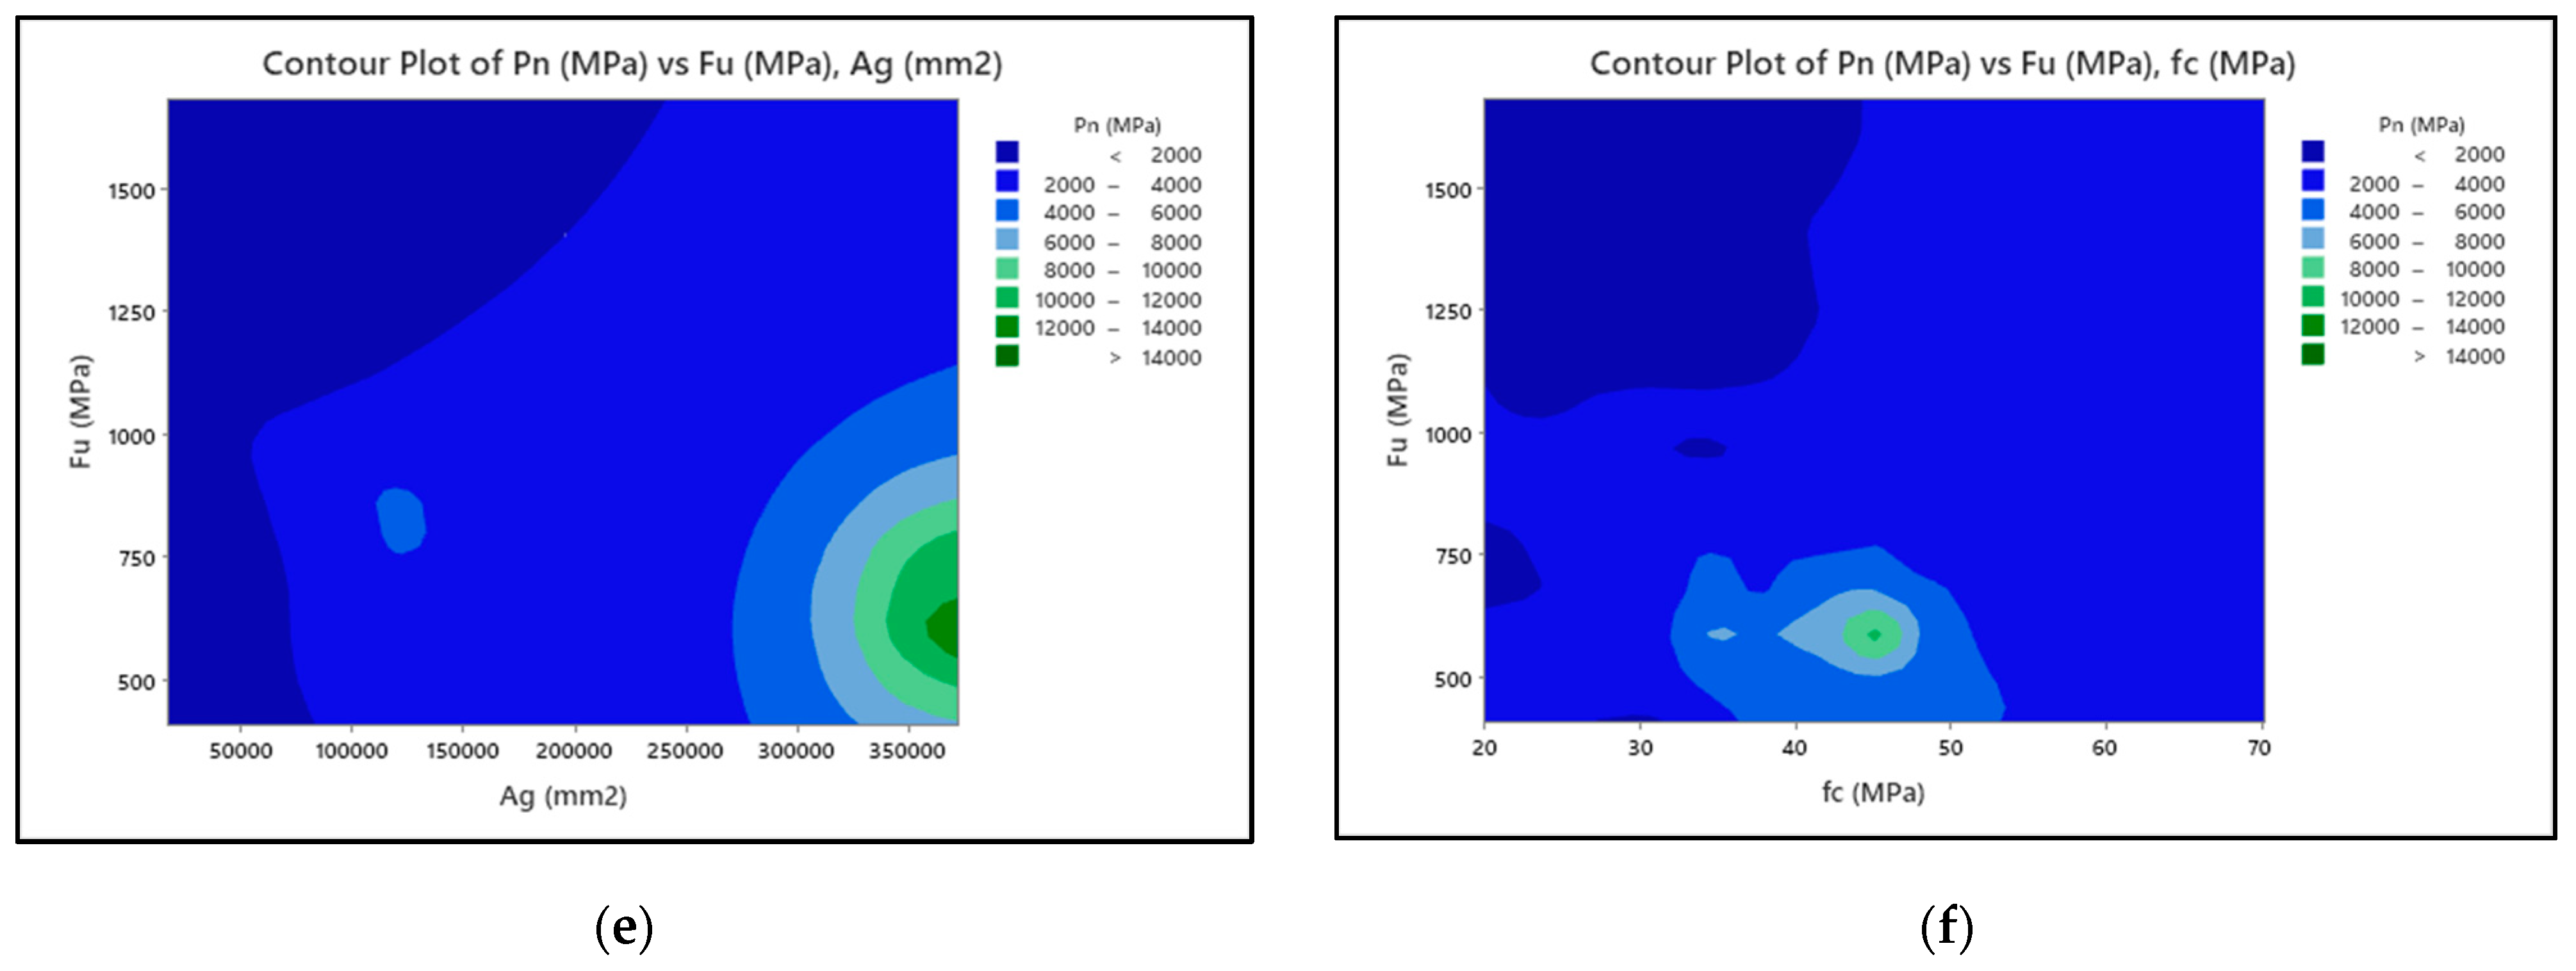
6.1. Influence of GFRP on Column Cross Sectional Area (Ag)

Figure 8 exhibits the influence or behaviour of “Ag” (unit in mm2) on reinforced concrete columns made with GFRP bars in 2D contour plots. The different values of “Ag” ranging between 17,663–372,100 mm2 were employed for parametric analysis. It was discovered that changing “Ag (mm2)” resulted in an increase in fc’ between 20−70 MPa along with a fu value of 1680 (n/mm2) and 4.72% of ρl value. Moreover, the axial behaviour of GFR-RC specimens was increased. The effect of increasing the “Ag” value was observed along with a range of ρl between 0.55–4.72%. Moreover, increasing the “B” values between 150 and 375 mm in conjunction with elevating fu values within 405–1680 (n/mm2) increased the overall axial performance of GFRP-RC structures.

6.2. Influence of GFRP on Compressive Strengths (fc’ ) of Concrete

Figure 8 demonstrates the behaviour of the compressive strength (f’c) of the GFRP bar embedded in a concrete column. It was discovered that raising the f’ c ranging between 20 and 70 (n/mm2) with the increasing gross sectional area “Ag” ranging from 17,663–372,100 mm2 increased the axial strength of GFRP bars in compression members. Similarly, the factor that increases f’ c is also increasing ρl by 0.55–4.72%. Likewise, boosting fc’ between 20–70 (n/mm2) while rising fu value by 405 to 1680 (unit MPa) resulted in a rise of column axial capacity. As a result, optimizing the fu and fc measurements for concrete strength as well as FRP reinforcement had the same effect.

6.3. Influence of Longitudinal Steel Ratio (pl)

The investigated readings of ρl were found to range from 0.55 to 4.72%, as presented in contour plot of Figure 8. The percentage change in the axial performance of GFRP bars in the RC column was 33.18%, when the ρl was increased from 0.55 to 4.72% and the compressive strength was increased from 20 to 70 MPa. The gain in ρl value with the growth in fu ranging from 405 to 1680 MPa only had a benefit of 0.28%. Besides this, improving ρl by 0.55–4.72% in conjunction with expanding “Ag” values from 17,663 to 372,100 mm2 improved the load-carrying capacity of columns made with GFRP bars.

6.4. Effect of the FRP Reinforcement on Tensile Properties (Fu)

The results of fu variation due to the addition of GFRP reinforcement in confined structures are presented in Figure 8. The mechanical performance in terms of fu was investigated thoroughly within the range of 405 to 1680 n/mm2. It was concluded that the axial performance of GFRP-based concrete specimens was improved by 0.28% as the ρl value changed by 0.55 to 4.72%. The effect of increasing fu was just 24.16% while increasing “Ag” between 17,663–372,100 mm2. The increase in axial strength was recorded as 357.5% when the compressive strength was between 20 and 70 MPa, whereas the fu value changed from 405 to 1680 MPa. By studying the impact of any two factors in each subplot, all the parametric data analyses were seen in a 2D way. The axial strength of compression members made with GFRP reinforcement has been increased. This increase is significantly affected by two factors, such as the cross-sectional area of testing specimens and fc. The axial capacities of columns were enhanced by expanding the overall cross-sectional surface area of specimens. The influence of longitudinal FRP bars on their tensile strength and reinforcement ratio (ρl) was minimal.

7. Conclusions

The main objective of this article is to provide a novel DEA model and ANNs prediction of the axial strength of GFRP-based compression members using a large testing dataset compiled from prior research. To accomplish this, a careful analysis of previous related simulations for studying and modelling the axial bearing strength of GFRP in concrete members was carried out to determine the effective simple version of the presented empirical analysis. DEA and ANNs approaches were presented to provide the perfect match to the testing datasets. In addition, extensive experimental research was carried out using the suggested empirical approach to evaluate the impacts of various contents and structural variables on GFRP embedded RC columns. The following main findings of this research are given below:
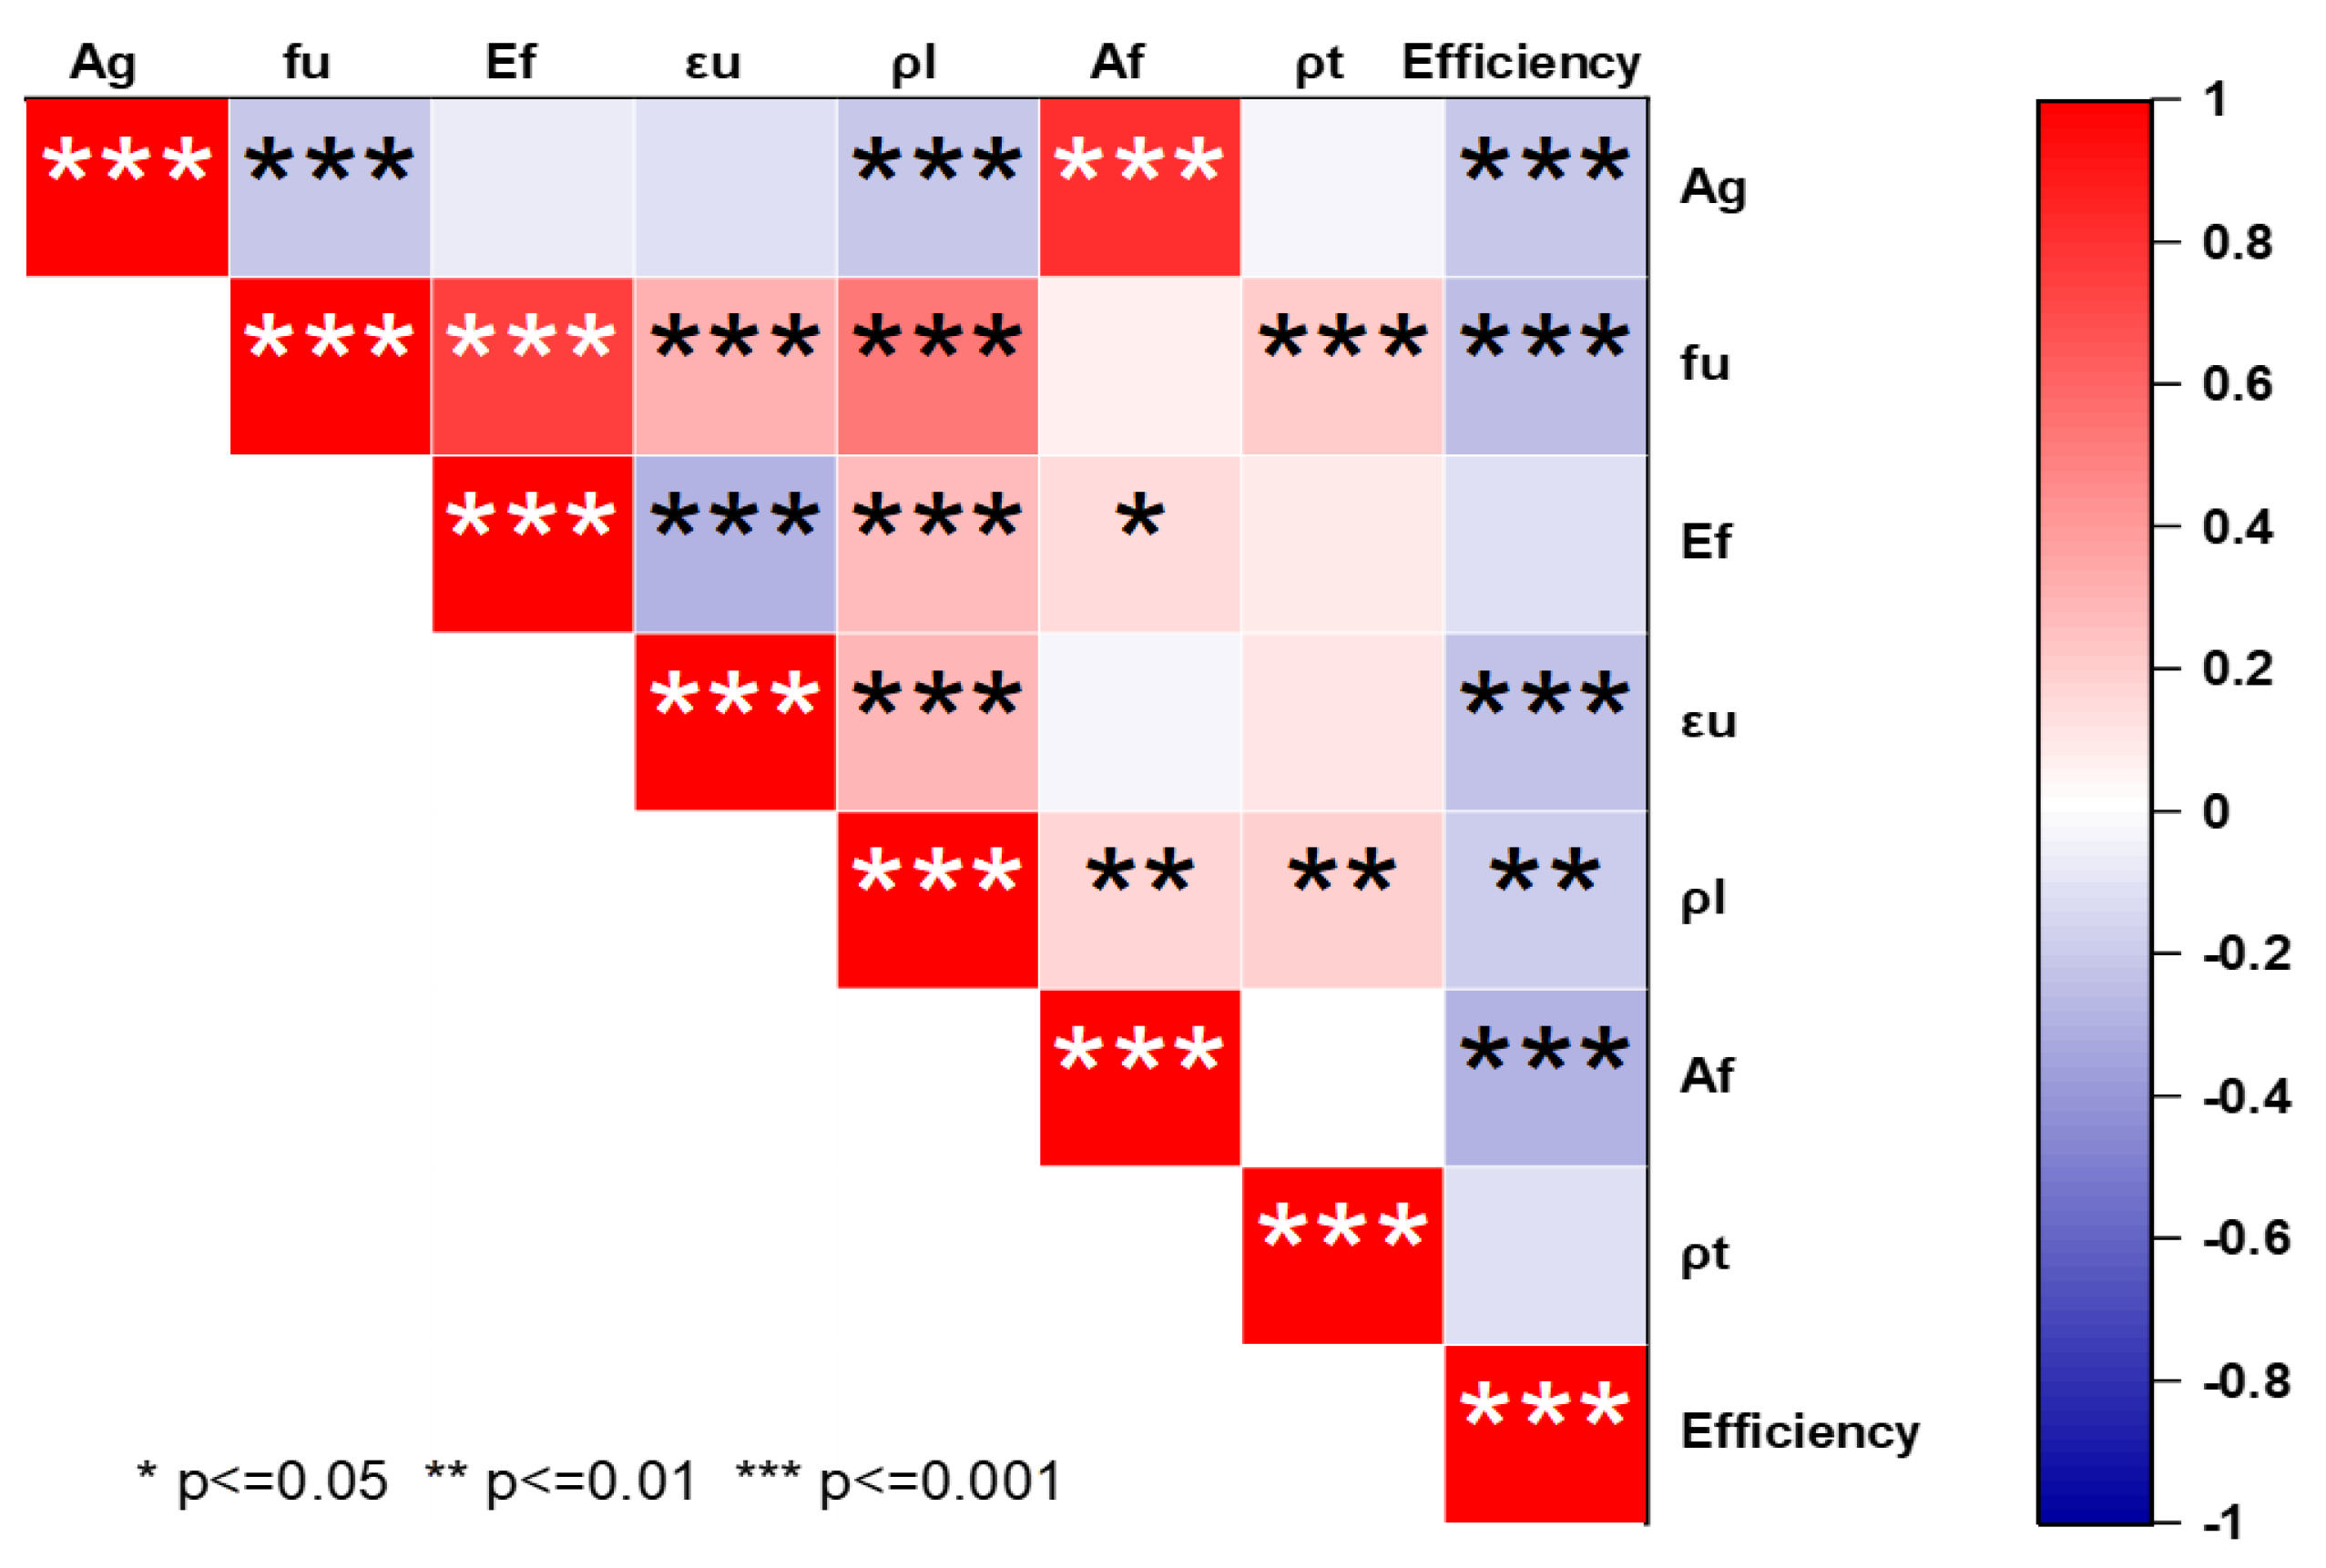
  • In this study, the DEA analysis was performed on the collected dataset obtained from similar past research works, and the DEA model showed a good correlation between different parameters, as can be observed in Table 2. A rating of 1 means the relationship among variables (units) is efficient, while a score of <1 represents an inefficient unit.
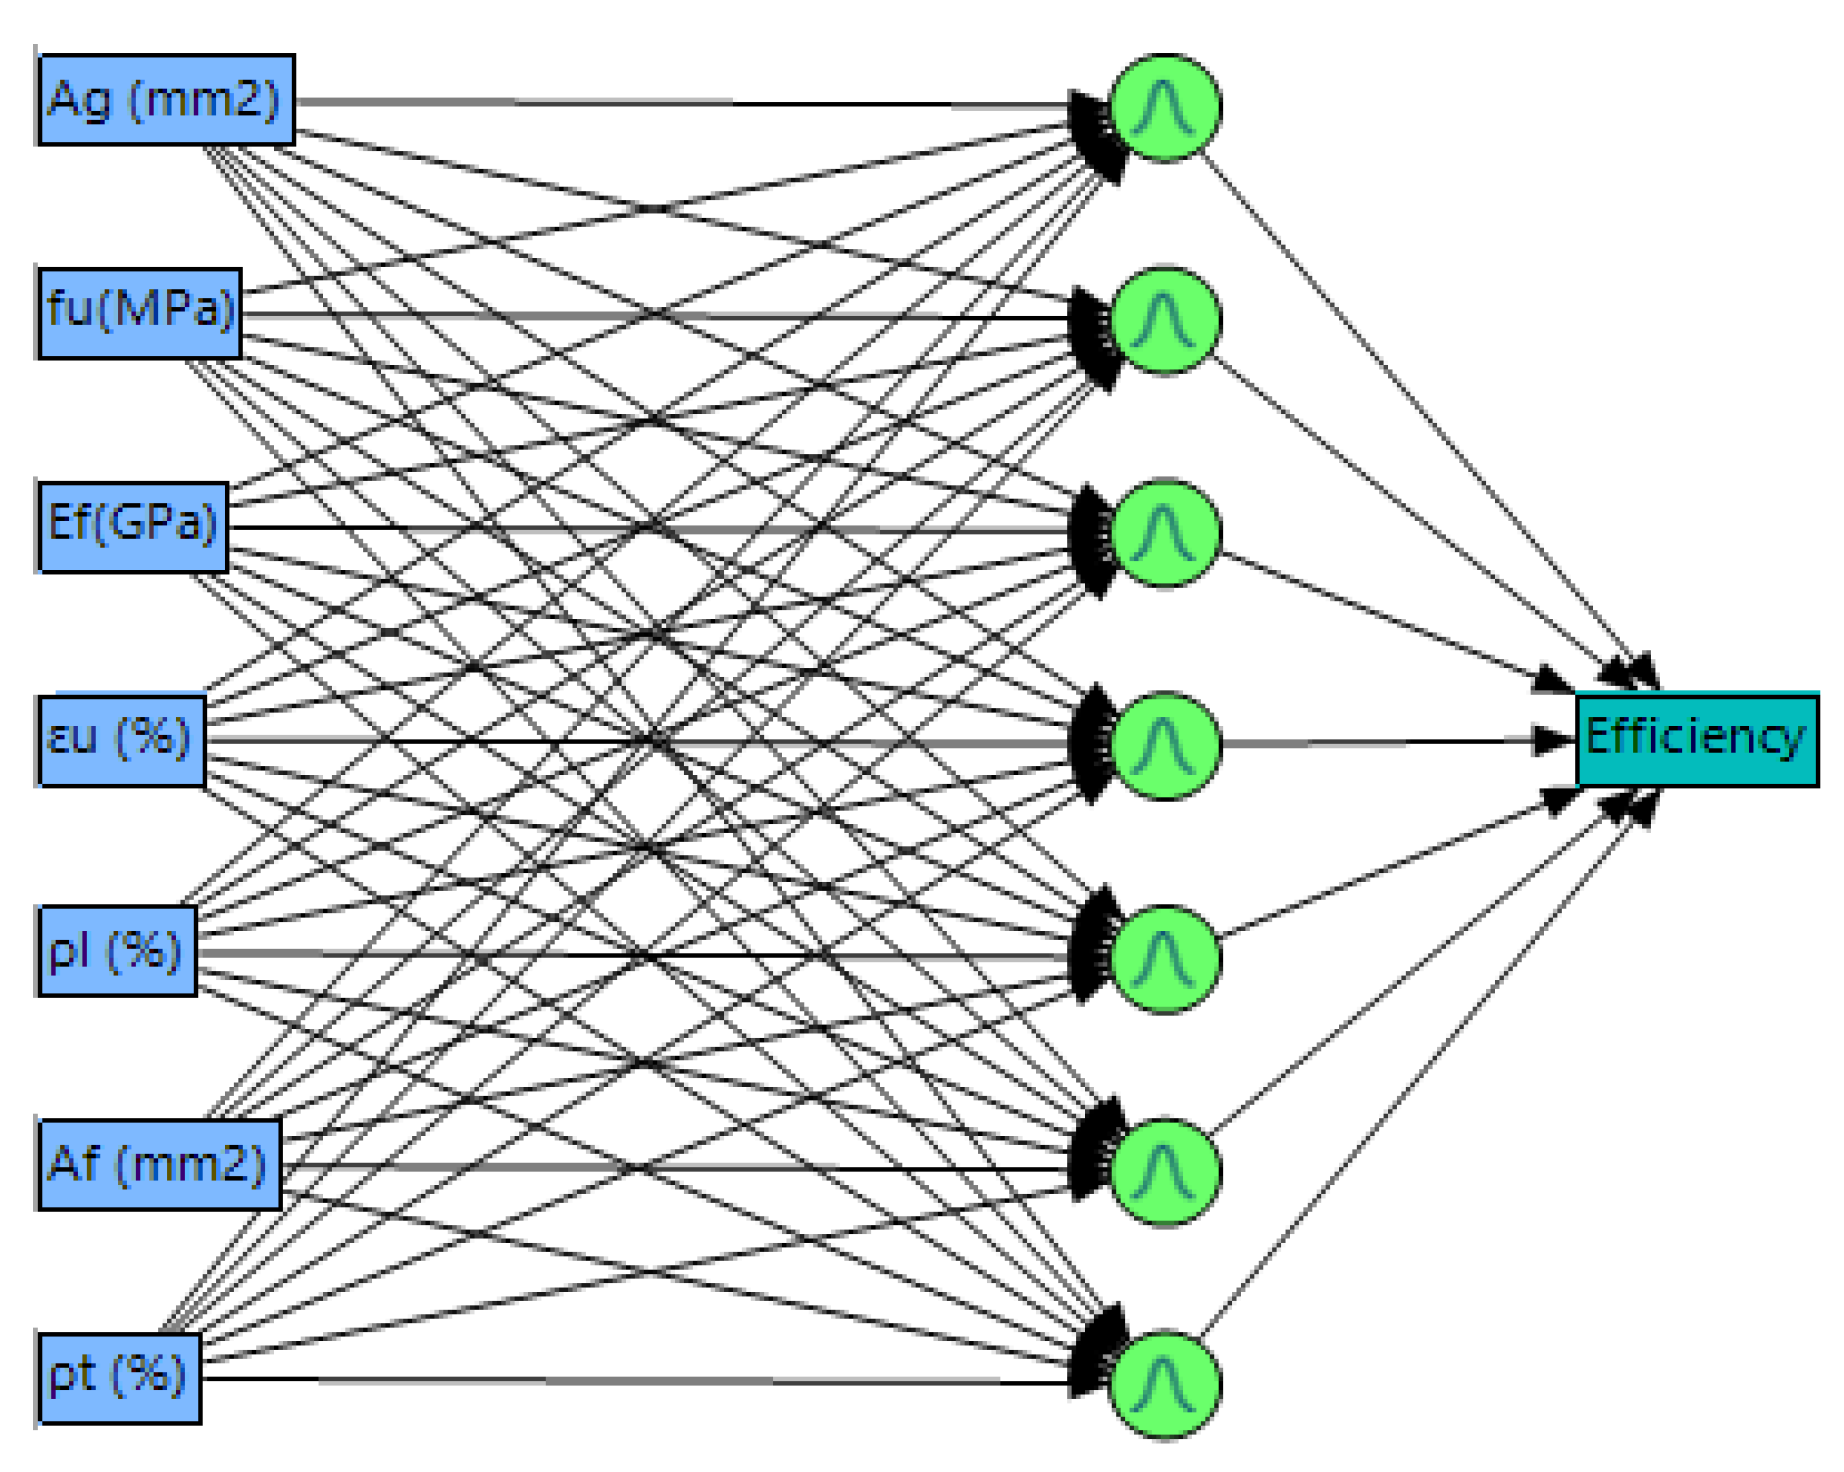
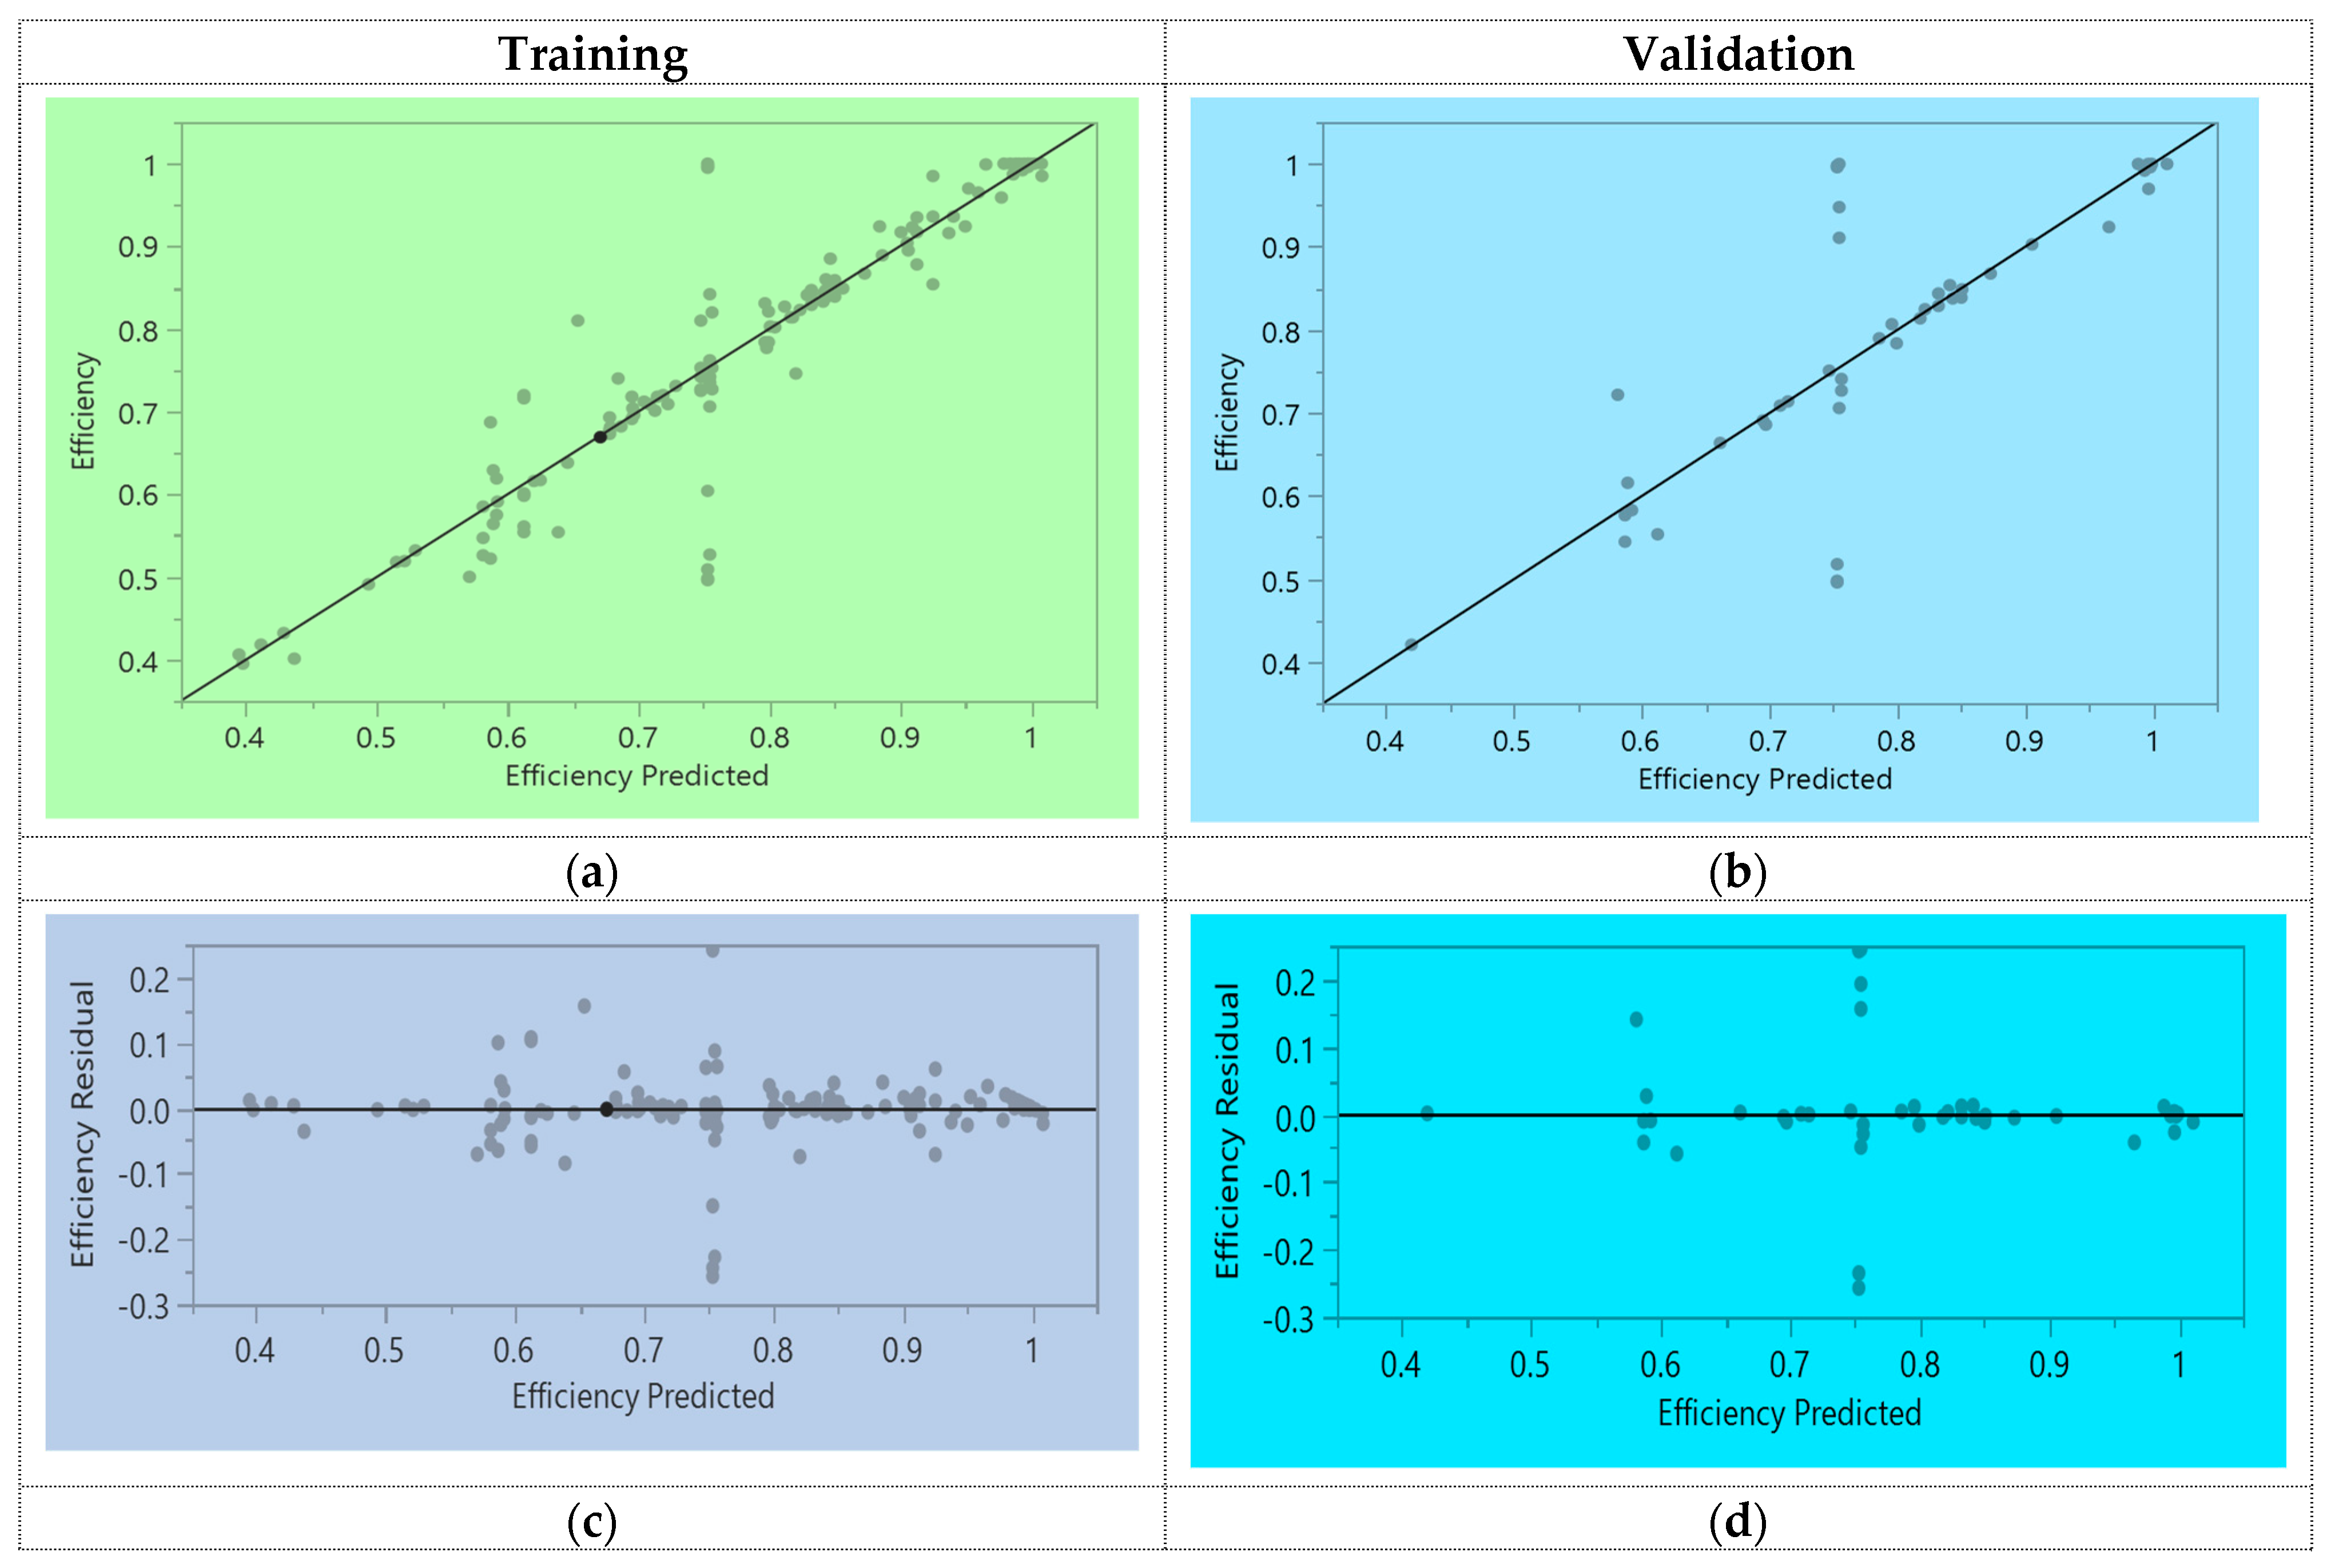
  • In this study, also ANNs technique for prediction were suggested through a massive set of databases for a total of 266 reinforced concrete samples made of GFRP derived from the literature. The ANNs structure has seven hidden layers and displayed a strong relationship with an R2 value of 0.836 and 0.864 during the validation and testing phases of ANNs modelling, respectively.
  • When compared to earlier published models, the empirically suggested estimate for the axial performance of GFRP bars in RC columns showed better results for a built dataset of 266 samples with an R2 = 0.73. Due to concrete cover and FRP reinforcement, the reducing indicators for the axial capacity of GFRP-made RC columns should be 0.85- 0.0029f’c and 0.021.
  • The validity of the models was tested by a comparison analysis of the estimations of the currently proposed models (such as empirical and DEA simulations) for all 266 concrete specimens. Moreover, R2 = 0.913 reflects the strong axial performance prediction for RC columns made with GFRP bars. As a result, the suggested models are capable of accurately forecasting the structural response of GFRP-made RC column structures in the form of efficiency.
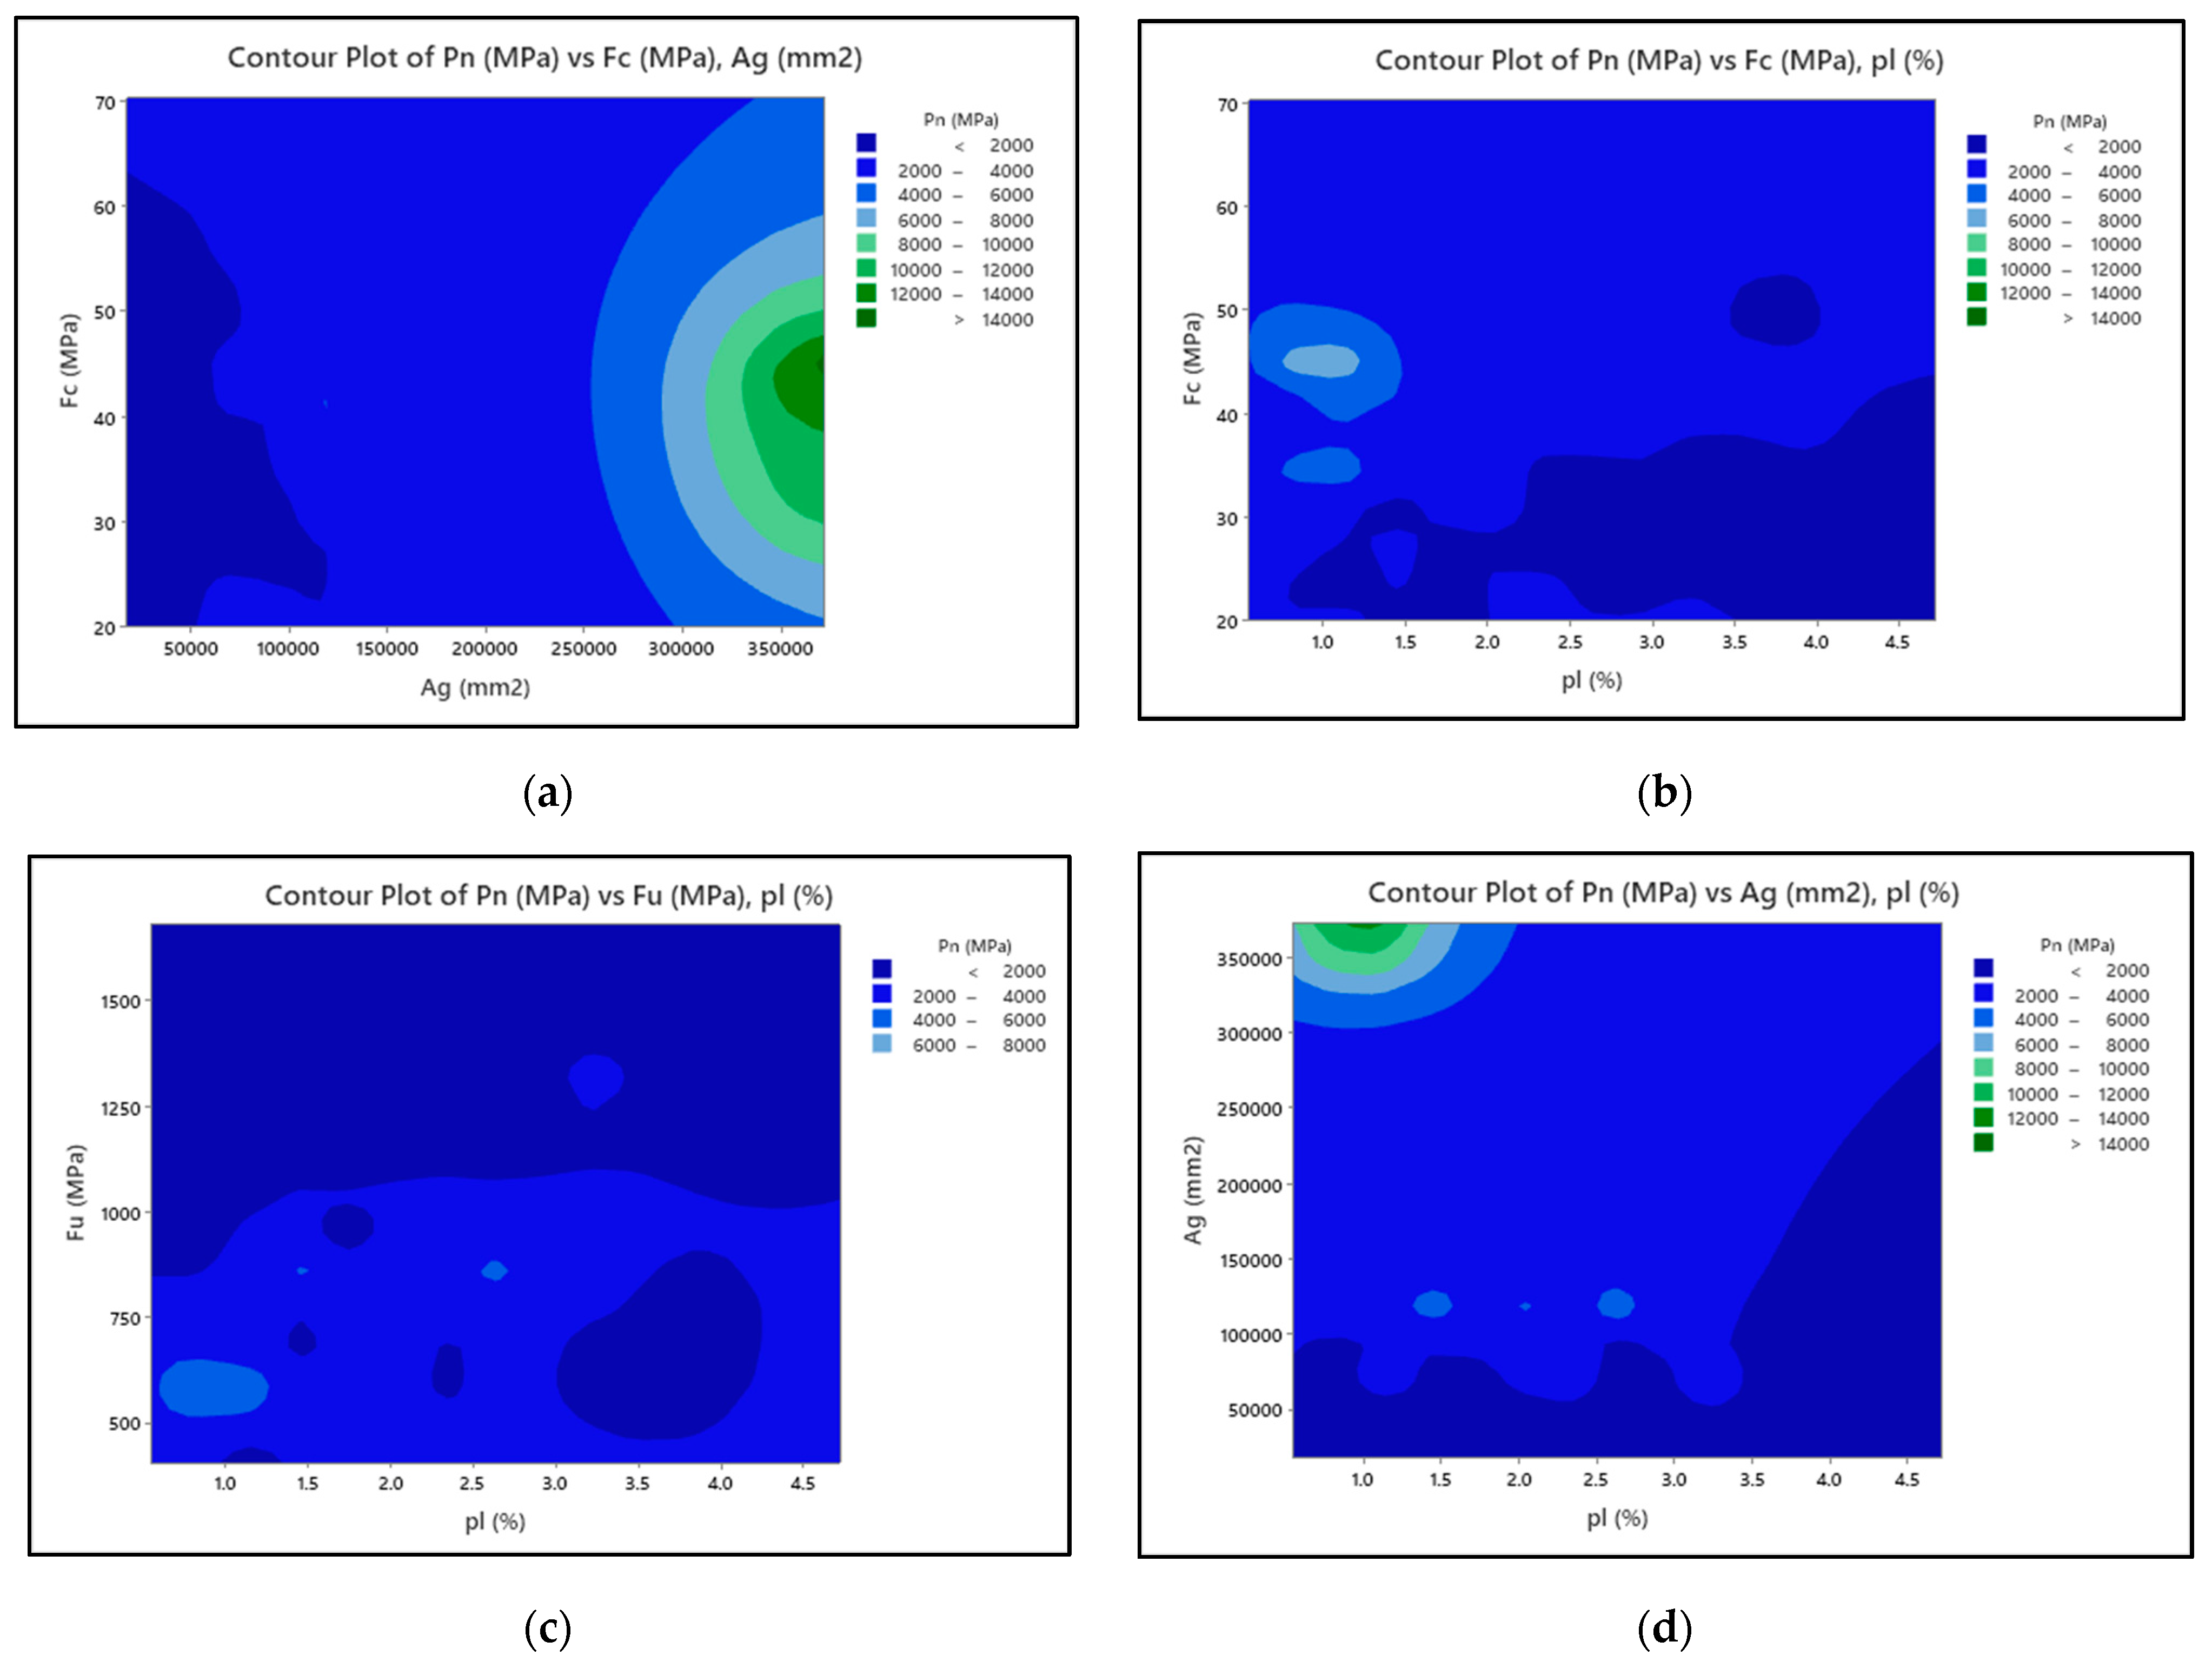
  • The parametric analysis adopting the presented empirical relationship demonstrated that as the geometry area of the column (B) and the concrete strength increase, the overall axial strength of GFRP bars in concrete columns also increases dramatically. The axial capacity of column specimens was enhanced the overall cross-sectional area of the specimen was raised by 1.5 times more. Both the tensile strength and the reinforcement ratio (ρl) of GFRP bars had no impact on the resulting axial load of an RC compression member composed of GFRP.
  • To conclude this, the DEA approach is an effective tool for solving complex relationships among different parameters i.e., multiple inputs and multiple outputs, of concrete structures and GFRP concrete columns for future construction projects.

8. Limitations of the Study

Due to the rapid advancement of GFRP bar fabrication methods, there are several variances in long-term structural performance among the wide variety of GFRP bars made by different companies. The test findings revealed that the strength drop in our study and all this comparative research is slightly different. Variances in material characteristics, i.e., matrix and GF, and exposed environmental constraints, particularly the solution temperature, were attributed to this cause. More research on the structural and durability properties of GFRP bars is necessary to enrich the existing knowledge.

Author Contributions

Conceptualization, M.K.A. and S.A.R.S.; methodology, S.A.R.S.; software, S.A.R.S. and M.K.A.; validation M.A., M.K.S.C. and I.S.; formal analysis, M.K.A.; investigation, I.S. and F.I.; writing—original draft preparation, M.K.A. and S.A.R.S.; writing—review and editing, M.A. and F.I. All authors have read and agreed to the published version of the manuscript.

Funding

This research received no external funding.

Institutional Review Board Statement

Not applicable.

Informed Consent Statement

Not applicable.

Data Availability Statement

Data will be available on suitable demand.

Conflicts of Interest

The authors declare no conflict of interest.

References

  1. Benmokrane, B.; El-Salakawy, E.; El-Ragaby, A.; Lackey, T. Designing and Testing of Concrete Bridge Decks Reinforced with Glass FRP Bars. J. Bridge Eng. 2006, 11, 217–229. [Google Scholar] [CrossRef] [Green Version]
  2. Benmokrane, B.; El-Salakawy, E.; El-Ragaby, A.; El-Gamal, S. Performance evaluation of innovative concrete bridge deck slabs reinforced with fibre-reinforced-polymer bars. Can. J. Civ. Eng. 2007, 34, 298–310. [Google Scholar] [CrossRef]
  3. Raza, A.; Khan, Q.U.Z.; Ahmad, A. Numerical Investigation of Load-Carrying Capacity of GFRP-Reinforced Rectangular Concrete Members Using CDP Model in ABAQUS. Adv. Civ. Eng. 2019, 2019, 1–21. [Google Scholar] [CrossRef] [Green Version]
  4. Raza, A.; Rafique, U. Efficiency of GFRP bars and hoops in recycled aggregate concrete columns: Experimental and numerical study. Compos. Struct. 2021, 255, 112986. [Google Scholar] [CrossRef]
  5. Ruan, X.; Lu, C.; Xu, K.; Xuan, G.; Ni, M. Flexural behavior and serviceability of concrete beams hybrid reinforced with GFRP bars and steel bars. Compos. Struct. 2020, 235, 111772. [Google Scholar] [CrossRef]
  6. Mufti, A.A.; Neale, K.W. State-of-the-art of FRP and SHM applications in bridge structures in Canada. In Composites & Polycon; The American Composites Manufacturers Association: Tampa, FL, USA, 2007. [Google Scholar]
  7. Robert, M.; Benmokrane, B. Combined effects of saline solution and moist concrete on long-term durability of GFRP reinforcing bars. Constr. Build. Mater. 2013, 38, 274–284. [Google Scholar] [CrossRef]
  8. Carvelli, V.; Pisani, M.A.; Poggi, C. Fatigue behaviour of concrete bridge deck slabs reinforced with GFRP bars. Compos. Part B Eng. 2010, 41, 560–567. [Google Scholar] [CrossRef]
  9. Raza, A.; Shah, S.A.R.; Haq, F.U.; Arshad, H.; Raza, S.S.; Farhan, M.; Waseem, M. Prediction of axial load-carrying capacity of GFRP-reinforced concrete columns through artificial neural networks. Structures 2020, 28, 1557–1571. [Google Scholar] [CrossRef]
  10. Lu, C.; Yang, J.; Li, H.; Liu, R. Experimental Studies on Chloride Penetration and Steel Corrosion in Cracked Concrete Beams under Drying-Wetting Cycles. J. Mater. Civ. Eng. 2017, 29, 04017114. [Google Scholar] [CrossRef]
  11. Singh, A.P.; Yadav, A.; Mishra, S.; Khan, K.L.A.; Gupta, A. Effect of Metallic Fillers on Mechanical Properties of FRP Composite. In Lecture Notes in Mechanical Engineering; Springer Science and Business Media LLC: Berlin/Heidelberg, Germany, 2021; pp. 615–624. [Google Scholar]
  12. Hadhood, A.; Mohamed, H.M.; Benmokrane, B.; Nanni, A.; Shield, C.K. Assessment of Design Guidelines of Concrete Columns Reinforced with Glass Fiber-Reinforced Polymer Bars. ACI Struct. J. 2019, 116, 193–207. [Google Scholar] [CrossRef]
  13. Mohamed, H.M.; Benmokrane, B. Design and Performance of Reinforced Concrete Water Chlorination Tank Totally Reinforced with GFRP Bars: Case Study. J. Compos. Constr. 2014, 18, 05013001. [Google Scholar] [CrossRef] [Green Version]
  14. Tošić, N.; De La Fuente, A.; Marinković, S. Shrinkage of recycled aggregate concrete: Experimental database and application of fib Model Code. Mater. Struct. 2018, 51, 126. [Google Scholar]
  15. Hassan, A.; Khairallah, F.; Mamdouh, H.; Kamal, M. Evaluation of Self-Compacting Concrete Columns Reinforced with Steel and FRP Bars with Different Strengthening Techniques. Structures 2018, 15, 82–93. [Google Scholar] [CrossRef]
  16. Ahmad, A.; Khan, Q.U.Z.; Raza, A. Reliability analysis of strength models for CFRP-confined concrete cylinders. Compos. Struct. 2020, 244, 112312. [Google Scholar] [CrossRef]
  17. Li, W.; Luo, Z.; Wu, C.; Tam, V.W.; Duan, W.H.; Shah, S.P. Experimental and numerical studies on impact behaviors of recycled aggregate concrete-filled steel tube after exposure to elevated temperature. Mater. Des. 2017, 136, 103–118. [Google Scholar] [CrossRef]
  18. Nobre, J.; Bravo, M.; de Brito, J.; Duarte, G. Durability performance of dry-mix shotcrete produced with coarse recycled concrete aggregates. J. Build. Eng. 2019, 29, 101135. [Google Scholar] [CrossRef]
  19. Karabinis, A.I.; Rousakis, T.C. Concrete confined by FRP material: A plasticity approach. Eng. Struct. 2002, 24, 923–932. [Google Scholar] [CrossRef]
  20. Mohamed, H.M.; Benmokrane, B. Reinforced Concrete Beams with and without FRP Web Reinforcement under Pure Torsion. J. Bridge Eng. 2016, 21, 04015070. [Google Scholar] [CrossRef]
  21. Mohamed, H.M.; Chaallal, O.; Benmokrane, B. Torsional Moment Capacity and Failure Mode Mechanisms of Concrete Beams Reinforced with Carbon FRP Bars and Stirrups. J. Compos. Constr. 2015, 19, 04014049. [Google Scholar] [CrossRef]
  22. Dong, M.; Elchalakani, M.; Karrech, A.; Pham, T.M.; Yang, B. Glass fibre-reinforced polymer circular alkali-activated fly ash/slag concrete members under combined loading. Eng. Struct. 2019, 199, 109598. [Google Scholar] [CrossRef]
  23. Elchalakani, M.; Dong, M.; Karrech, A.; Li, G.; Ali, M.S.M.; Yang, B. Experimental Investigation of Rectangular Air-Cured Geopolymer Concrete Columns Reinforced with GFRP Bars and Stirrups. J. Compos. Constr. 2019, 23, 04019011. [Google Scholar] [CrossRef]
  24. Elshamandy, M.G.; Farghaly, A.S.; Benmokrane, B. Experimental Behavior of Glass Fiber-Reinforced Polymer-Reinforced Concrete Columns under Lateral Cyclic Load. ACI Struct. J. 2018, 115, 337–349. [Google Scholar] [CrossRef] [Green Version]
  25. Tobbi, H.; Farghaly, A.S.; Benmokrane, B. Concrete Columns Reinforced Longitudinally and Transversally with Glass Fiber-Reinforced Polymer Bars. ACI Struct. J. 2012, 109, 551–558. [Google Scholar]
  26. Afifi, M.Z.; Mohamed, H.M.; Benmokrane, B. Axial Capacity of Circular Concrete Columns Reinforced with GFRP Bars and Spirals. J. Compos. Constr. 2014, 18, 04013017. [Google Scholar] [CrossRef]
  27. Zadeh, H.J.; Nanni, A. Design of RC Columns Using Glass FRP Reinforcement. J. Compos. Constr. 2013, 17, 294–304. [Google Scholar] [CrossRef]
  28. Xue, W.; Hu, X.; Fang, Z. Experimental studies of GFRP reinforced concrete columns under static eccentric loading. In Proceedings of the 7th International Conference On Fiber Reinforced Polymer (FRP) Composites in Civil Engineering (CICE 2014), International Institute for FRP in Construction (IIFC), Vancouver, BC, Canada, 20–22 August 2014. [Google Scholar]
  29. Elchalakani, M.; Ma, G. Tests of glass fibre reinforced polymer rectangular concrete columns subjected to concentric and eccentric axial loading. Eng. Struct. 2017, 151, 93–104. [Google Scholar] [CrossRef]
  30. Khorramian, K.; Sadeghian, P. Experimental and analytical behavior of short concrete columns reinforced with GFRP bars under eccentric loading. Eng. Struct. 2017, 151, 761–773. [Google Scholar] [CrossRef]
  31. Tabatabaei, A.; Eslami, A.; Mohamed, H.M.; Benmokrane, B. Strength of compression lap-spliced GFRP bars in concrete columns with different splice lengths. Constr. Build. Mater. 2018, 182, 657–669. [Google Scholar] [CrossRef]
  32. Raza, A.; Rehman, A.U.; Masood, B.; Hussain, I. Finite element modelling and theoretical predictions of FRP-reinforced concrete columns confined with various FRP-tubes. Structures 2020, 26, 626–638. [Google Scholar] [CrossRef]
  33. Raza, A.; Ali, B.; Nawaz, M.A.; Ahmed, I. Structural performance of FRP-RC compression members wrapped with FRP composites. Structures 2020, 27, 1693–1709. [Google Scholar] [CrossRef]
  34. Elchalakani, M.; Ma, G.; Aslani, F.; Duan, W.H. Design of GFRP-reinforced rectangular concrete columns under eccentric axial loading. Mag. Concr. Res. 2017, 69, 865–877. [Google Scholar] [CrossRef]
  35. Tighiouart, B.; Benmokrane, B.; Mukhopadhyaya, P. Bond strength of glass FRP rebar splices in beams under static loading. Constr. Build. Mater. 1999, 13, 383–392. [Google Scholar] [CrossRef]
  36. Elgabbas, F.; Vincent, P.; Ahmed, E.A.; Benmokrane, B. Experimental testing of basalt-fiber-reinforced polymer bars in concrete beams. Compos. Part B Eng. 2016, 91, 205–218. [Google Scholar] [CrossRef]
  37. Bouguerra, K.; Ahmed, E.; El-Gamal, S.; Benmokrane, B. Testing of full-scale concrete bridge deck slabs reinforced with fiber-reinforced polymer (FRP) bars. Constr. Build. Mater. 2011, 25, 3956–3965. [Google Scholar] [CrossRef]
  38. Benmokrane, B.; El-Salakawy, E.; El-Gamal, S.; Goulet, S. Construction and Testing of an Innovative Concrete Bridge Deck Totally Reinforced with Glass FRP Bars: Val-Alain Bridge on Highway 20 East. J. Bridge Eng. 2007, 12, 632–645. [Google Scholar] [CrossRef]
  39. El-Sayed, A.K.; El-Salakawy, E.; Benmokrane, B. Mechanical and Structural Characterization of New Carbon FRP Stirrups for Concrete Members. J. Compos. Constr. 2007, 11, 352–362. [Google Scholar] [CrossRef]
  40. Guérin, M.; Mohamed, H.M.; Benmokrane, B.; Nanni, A.; Shield, C.K. Eccentric Behavior of Full-Scale Reinforced Concrete Columns with Glass Fiber-Reinforced Polymer Bars and Ties. ACI Struct. J. 2018, 115, 489–499. [Google Scholar] [CrossRef]
  41. Guérin, M.; Mohamed, H.M.; Benmokrane, B.; Shield, C.K.; Nanni, A. Effect of Glass Fiber-Reinforced Polymer Reinforcement Ratio on the Axial–Flexural Strength of Reinforced Concrete Columns. ACI Struct. J. 2018, 115, 1049–1061. [Google Scholar] [CrossRef]
  42. Hadhood, A.; Mohamed, H.M.; Benmokrane, B. Axial Load–Moment Interaction Diagram of Circular Concrete Columns Reinforced with CFRP Bars and Spirals: Experimental and Theoretical Investigations. J. Compos. Constr. 2017, 21, 04016092. [Google Scholar] [CrossRef]
  43. Hadhood, A.; Mohamed, H.M.; Ghrib, F.; Benmokrane, B. Efficiency of glass-fiber reinforced-polymer (GFRP) discrete hoops and bars in concrete columns under combined axial and flexural loads. Compos. Part B Eng. 2017, 114, 223–236. [Google Scholar] [CrossRef]
  44. Hadhood, A.; Mohamed, H.M.; Benmokrane, B. Failure envelope of circular concrete columns reinforced with glass fiber-reinforced polymer bars and spirals. ACI Struct. J. 2017, 114, 1417–1428. [Google Scholar] [CrossRef]
  45. Hadhood, A.; Mohamed, H.M.; Benmokrane, B. Strength of circular HSC columns reinforced internally with carbon-fiber-reinforced polymer bars under axial and eccentric loads. Constr. Build. Mater. 2017, 141, 366–378. [Google Scholar] [CrossRef]
  46. Hadhood, A.; Mohamed, H.M.; Benmokrane, B. Experimental Study of Circular High-Strength Concrete Columns Reinforced with GFRP Bars and Spirals under Concentric and Eccentric Loading. J. Compos. Constr. 2017, 21, 04016078. [Google Scholar] [CrossRef]
  47. Hadhood, A.; Mohamed, H.M.; Benmokrane, B. Assessing Stress-Block Parameters in Designing Circular High-Strength Concrete Members Reinforced with FRP Bars. J. Struct. Eng. 2018, 144, 04018182. [Google Scholar] [CrossRef]
  48. Hadhood, A.; Mohamed, H.M.; Benmokrane, B. Flexural Stiffness of GFRP- and CFRP-RC Circular Members under Eccentric Loads Based on Experimental and Curvature Analysis. ACI Struct. J. 2018, 115, 1185–1198. [Google Scholar] [CrossRef]
  49. De Luca, A.; Matta, F.; Nanni, A. Behavior of Full-Scale Glass Fiber-Reinforced Polymer Reinforced Concrete Columns under Axial Load. ACI Struct. J. 2010, 107, 589–596. [Google Scholar]
  50. Karim, H.; Sheikh, M.N.; Hadi, M.N. Axial load-axial deformation behaviour of circular concrete columns reinforced with GFRP bars and helices. Constr. Build. Mater. 2016, 112, 1147–1157. [Google Scholar] [CrossRef] [Green Version]
  51. Pantelides, C.P.; Gibbons, M.E.; Reaveley, L.D. Axial Load Behavior of Concrete Columns Confined with GFRP Spirals. J. Compos. Constr. 2013, 17, 305–313. [Google Scholar] [CrossRef]
  52. Afifi, M.Z.; Mohamed, H.M.; Chaallal, O.; Benmokrane, B. Confinement Model for Concrete Columns Internally Confined with Carbon FRP Spirals and Hoops. J. Struct. Eng. 2015, 141, 04014219. [Google Scholar] [CrossRef]
  53. Afifi, M.Z.; Mohamed, H.M.; Benmokrane, B. Strength and Axial Behavior of Circular Concrete Columns Reinforced with CFRP Bars and Spirals. J. Compos. Constr. 2014, 18, 04013035. [Google Scholar] [CrossRef]
  54. Hadi, M.N.S.; Karim, H.; Sheikh, M.N. Experimental Investigations on Circular Concrete Columns Reinforced with GFRP Bars and Helices under Different Loading Conditions. J. Compos. Constr. 2016, 20, 04016009. [Google Scholar] [CrossRef] [Green Version]
  55. Ashrafi, H.R.; Jalal, M.; Garmsiri, K. Prediction of load–displacement curve of concrete reinforced by composite fibers (steel and polymeric) using artificial neural network. Expert Syst. Appl. 2010, 37, 7663–7668. [Google Scholar] [CrossRef]
  56. Cevik, A.; Cabalar, A.F. A genetic-programming-based formulation for the strength enhancement of fiber-reinforced-polymer-confined concrete cylinders. J. Appl. Polym. Sci. 2008, 110, 3087–3095. [Google Scholar] [CrossRef]
  57. Cevik, A.; Guzelbey, I.H. Neural network modeling of strength enhancement for CFRP confined concrete cylinders. Build. Environ. 2008, 43, 751–763. [Google Scholar] [CrossRef]
  58. Cevik, A.; Göğüş, M.T.; Güzelbey, I.H.; Filiz, H. Soft computing based formulation for strength enhancement of CFRP confined concrete cylinders. Adv. Eng. Softw. 2010, 41, 527–536. [Google Scholar] [CrossRef]
  59. Naderpour, H.; Kheyroddin, A.; Amiri, G.G. Prediction of FRP-confined compressive strength of concrete using artificial neural networks. Compos. Struct. 2010, 92, 2817–2829. [Google Scholar] [CrossRef]
  60. Elsanadedy, H.; Al-Salloum, Y.; Abbas, H.; Alsayed, S. Prediction of strength parameters of FRP-confined concrete. Compos. Part B Eng. 2012, 43, 228–239. [Google Scholar] [CrossRef]
  61. Pham, T.; Hadi, M. Predicting Stress and Strain of FRP-Confined Square/Rectangular Columns Using Artificial Neural Networks. J. Compos. Constr. 2014, 18, 04014019. [Google Scholar] [CrossRef] [Green Version]
  62. Cascardi, A.; Micelli, F.; Aiello, M.A. An Artificial Neural Networks model for the prediction of the compressive strength of FRP-confined concrete circular columns. Eng. Struct. 2017, 140, 199–208. [Google Scholar] [CrossRef]
  63. Naderpour, H.; Nagai, K.; Fakharian, P.; Haji, M. Innovative models for prediction of compressive strength of FRP-confined circular reinforced concrete columns using soft computing methods. Compos. Struct. 2019, 215, 69–84. [Google Scholar] [CrossRef]
  64. Naderpour, H.; Nagai, K.; Haji, M.; Mirrashid, M. Adaptive neuro-fuzzy inference modelling and sensitivity analysis for capacity estimation of fiber reinforced polymer-strengthened circular reinforced concrete columns. Expert Syst. 2019, 36, 12410. [Google Scholar] [CrossRef]
  65. Balf, F.R.; Kordkheili, H.M. A New Method for Predicting the Ingredients of Self-Compacting Concrete (SCC) Including Fly Ash (FA) Using Data Envelopment Analysis (DEA). Arab. J. Sci. Eng. 2021, 46, 4439–4460. [Google Scholar] [CrossRef]
  66. Charnes, A.; Cooper, W.; Golany, B.; Seiford, L.; Stutz, J. Foundations of data envelopment analysis for Pareto-Koopmans efficient empirical production functions. J. Econ. 1985, 30, 91–107. [Google Scholar] [CrossRef]
  67. Zhu, J. Multi-factor performance measure model with an application to Fortune 500 companies. Eur. J. Oper. Res. 2000, 123, 105–124. [Google Scholar] [CrossRef]
  68. Cook, W.D.; Zhu, J. Data Envelopment Analysis. Modeling Performance Measurement: Applications and Implementation Issues in DEA; Springer: Boston, MA, USA, 2005; pp. 1–27. [Google Scholar]
  69. Charnes, A.; Cooper, W.W.; Rhodes, E. Measuring the efficiency of decision-making units. Eur. J. Oper. Res. 1978, 2, 429–444. [Google Scholar] [CrossRef]
  70. Dadashi, A.; Mirbaha, B. Prioritizing highway safety improvement projects: A Monte-Carlo based Data Envelopment Analysis approach. Accid. Anal. Prev. 2019, 123, 387–395. [Google Scholar] [CrossRef]
  71. Li, H.X.; Li, Y.; Jiang, B.; Zhang, L.; Wu, X.; Lin, J. Energy performance optimisation of building envelope retrofit through integrated orthogonal arrays with data envelopment analysis. Renew. Energy 2020, 149, 1414–1423. [Google Scholar] [CrossRef]
  72. Palafox-Alcantar, P.; Hunt, D.; Rogers, C. The complementary use of game theory for the circular economy: A review of waste management decision-making methods in civil engineering. Waste Manag. 2020, 102, 598–612. [Google Scholar] [CrossRef]
  73. Zhang, J.; Li, H.; Xia, B.; Skitmore, M. Impact of environment regulation on the efficiency of regional construction industry: A 3-stage Data Envelopment Analysis (DEA). J. Clean. Prod. 2018, 200, 770–780. [Google Scholar] [CrossRef]
  74. Jiang, H.; Hua, M.; Zhang, J.; Cheng, P.; Ye, Z.; Huang, M.; Jin, Q. Sustainability efficiency assessment of wastewater treatment plants in China: A data envelopment analysis based on cluster benchmarking. J. Clean. Prod. 2020, 244, 118729. [Google Scholar] [CrossRef]
  75. Zhu, J. Quantitative Models for Performance Evaluation and Benchmarking: Data Envelopment Analysis with Spreadsheets; Springer: Berlin/Heidelberg, Germany, 2014; Volume 213. [Google Scholar]
  76. Banker, R.D.; Charnes, A.; Cooper, W.W. Some Models for Estimating Technical and Scale Inefficiencies in Data Envelopment Analysis. Manag. Sci. 1984, 30, 1078–1092. [Google Scholar] [CrossRef] [Green Version]
  77. Liu, F.-H.F.; Peng, H.H. Ranking of units on the DEA frontier with common weights. Comput. Oper. Res. 2008, 35, 1624–1637. [Google Scholar] [CrossRef]
  78. Balf, F.R.; Rezai, H.Z.; Jahanshahloo, G.; Lotfi, F.H. Ranking efficient DMUs using the Tchebycheff norm. Appl. Math. Model. 2012, 36, 46–56. [Google Scholar] [CrossRef]
  79. Mohamed, H.M.; Afifi, M.Z.; Benmokrane, B. Performance Evaluation of Concrete Columns Reinforced Longitudinally with FRP Bars and Confined with FRP Hoops and Spirals under Axial Load. J. Bridge Eng. 2014, 19, 04014020. [Google Scholar] [CrossRef]
  80. Al Ajarmeh, O.S.; Manalo, A.C.; Benmokrane, B.; Karunasena, W.; Mendis, P. Axial performance of hollow concrete columns reinforced with GFRP composite bars with different reinforcement ratios. Compos. Struct. 2019, 213, 153–164. [Google Scholar] [CrossRef]
  81. Al Ajarmeh, O.; Manalo, A.; Benmokrane, B.; Karunasena, W.; Mendis, P.; Nguyen, Q.T. Compressive behavior of axially loaded circular hollow concrete columns reinforced with GFRP bars and spirals. Constr. Build. Mater. 2019, 194, 12–23. [Google Scholar] [CrossRef]
  82. Alsayed, S.H.; Al-Salloum, Y.A.; Almusallam, T.H.; Amjad, M.A. Concrete columns reinforced by glass fiber reinforced polymer rods. In Proceedings of the Fourth Interna-tional Symposium on Fiber-Reinforced Polymer Reinforcement for Rein-forced Concrete Structures, Baltimore, MD, USA, 21 October–5 November; 1999. [Google Scholar]
  83. Hadi, M.N.S.; Youssef, J. Experimental Investigation of GFRP-Reinforced and GFRP-Encased Square Concrete Specimens under Axial and Eccentric Load, and Four-Point Bending Test. J. Compos. Constr. 2016, 20, 04016020. [Google Scholar] [CrossRef] [Green Version]
  84. Hassan, A.; Khairallah, F.; Mamdouh, H.; Kamal, M. Structural behaviour of self-compacting concrete columns reinforced by steel and glass fibre-reinforced polymer rebars under eccentric loads. Eng. Struct. 2019, 188, 717–728. [Google Scholar] [CrossRef]
  85. Maranan, G.; Manalo, A.; Benmokrane, B.; Karunasena, W.; Mendis, P. Behavior of concentrically loaded geopolymer-concrete circular columns reinforced longitudinally and transversely with GFRP bars. Eng. Struct. 2016, 117, 422–436. [Google Scholar] [CrossRef]
  86. Prachasaree, W.; Piriyakootorn, S.; Sangsrijun, A.; Limkatanyu, S. Behavior and Performance of GFRP Reinforced Concrete Columns with Various Types of Stirrups. Int. J. Polym. Sci. 2015, 2015, 1–9. [Google Scholar] [CrossRef] [Green Version]
  87. Sankholkar, P.P.; Pantelides, C.P.; Hales, T.A. Confinement Model for Concrete Columns Reinforced with GFRP Spirals. J. Compos. Constr. 2018, 22, 04018007. [Google Scholar] [CrossRef]
  88. Sun, L.; Wei, M.; Zhang, N. Experimental study on the behavior of GFRP reinforced concrete columns under eccentric axial load. Constr. Build. Mater. 2017, 152, 214–225. [Google Scholar] [CrossRef]
  89. Tikka, T.; Francis, M.; Teng, B. Strength of concrete beam-columns reinforced with GFRP bars. In Proceedings of the 2nd International Structures Specialty Conference, Winnipeg, MB, Canada, 9–12 June; 2010. [Google Scholar]
  90. Tu, J.; Gao, K.; He, L.; Li, X. Experimental study on the axial compression performance of GFRP-reinforced concrete square columns. Adv. Struct. Eng. 2019, 22, 1554–1565. [Google Scholar] [CrossRef]
  91. Xue, W.; Peng, F.; Fang, Z. Behavior and Design of Slender Rectangular Concrete Columns Longitudinally Reinforced with Fiber-Reinforced Polymer Bars. ACI Struct. J. 2018, 115, 311–322. [Google Scholar] [CrossRef]
  92. Zhang, X.; Deng, Z. Experimental study and theoretical analysis on axial compressive behavior of concrete columns reinforced with GFRP bars and PVA fibers. Constr. Build. Mater. 2018, 172, 519–532. [Google Scholar] [CrossRef]
  93. Khan, Q.S.; Sheikh, M.N.; Hadi, M.N.S. Axial-Flexural Interactions of GFRP-CFFT Columns with and without Reinforcing GFRP Bars. J. Compos. Constr. 2017, 21, 04016109. [Google Scholar] [CrossRef] [Green Version]
Figure 1. Significance level of the parameter used for GFRP-based reinforced concrete column.
Buildings 12 00611 g001
Figure 2. Conceptual-DEA frontier pattern with reference to regression.
Buildings 12 00611 g002
Figure 3. Flowchart of research methodology.
Buildings 12 00611 g003
Figure 4. ANNs structure for the dataset.
Buildings 12 00611 g004
Figure 5. Training and testing plot for efficiency of GFRP-based RC columns.
Buildings 12 00611 g005
Figure 6. Prediction profiler of all parameters for GFRP-based RC columns (specimens).
Buildings 12 00611 g006
Figure 7. Interaction profiler between efficiency and seven different parameters for GFRP-made RC columns.
Buildings 12 00611 g007
Figure 8. Parametric analysis of the axial capacity of GFRP-made RC column.
Buildings 12 00611 g008aBuildings 12 00611 g008b
Table 1. Statistical analysis of the parameter for GFRP-based RC columns.
VariableMeanSt. DevCOVMinQ1MedianQ3Max
Ag (mm2)68,20853,56378.5317,66335,19861,04873,025372,100
fu(MPa)1018.0337.633.17405.9735.0930.01289.01680.0
Ef(GPa)57.2725.5244.5523.4044.2554.9059.00141.00
εu (%)1.79500.387321.580.97001.50001.60002.30002.4200
ρl (%)1.96960.880844.720.55001.30001.90002.20004.7200
Af (mm2)1216.5783.164.37212.5711.41175.81567.74051.6
ρt (%)1.38111.052776.220.01000.63001.10001.91005.3000
Efficiency0.81060.173821.450.39520.70300.83550.99571.0000
Table 2. DEA-based efficient combination evaluation of GFRP-based columns.
SourcesInputsOutputs Efficiency Remarks (Option)
Ag (mm2)fu(MPa)Ef(GPa)εu (%)ρl (%)Af (mm2)ρt (%)fc’ (MPa)Pn (kN)
S1 [79]70,65093455.41.561.1783.8712028260.917Good
S2 [52]71,595.1493455.41.562.21567.741.52228710.669Good
S3 [80] 49,062.51237602.12.411175.801.4931.815880.532Good
S4 [81]49,455.7851281.561.32.11.78759.681.57251035.30.432Good
S5 [82]112,500800401.511175.800.153932851.000Excellent
112,500800401.511175.800.153932851.000Excellent
S6 [49]372,10060844.21.3814051.600.6343.715,2351.000Excellent
372,10071244.41.614051.600.6340.612,9490.895Good
S7 [22]36,286.625930591.60.55212.540.944010181.000Excellent
36,286.625930591.60.73283.390.944011790.997Good
36,286.625930591.60.73283.392.754014591.000Excellent
36,286.625880591.60.73283.392.75405230.999Good
S8 [29]41,6001200502.41.8759.680.532.813670.803Good
S9 [34]
25,600930591.71.8759.680.532.83531.000Excellent
25,600930591.71.8759.680.532.82341.000Excellent
S10 [40]164,025600401.511700.310.6625.346160.720Good
S11 [41]164,025600401.52.54051.600.6325.352940.722Good
S12 [43]73,024.62516801411.192.21567.742.683525640.810Good
S13 [44]73,024.62516801411.193.32351.6113526700.860Good
S14 [48]
73,024.62516801411.192.21567.741.83526520.820Good
S15 [47]
73,024.625128954.92.32.21567.741.170.247091.000Excellent
73,024.625128954.92.32.21567.741.170.246891.000Excellent
73,024.625128954.92.32.21567.741.170.251201.000Excellent
73,024.625128954.92.32.21567.741.770.246801.000Excellent
S16 [54]
32,989.6251200502.41.6759.684.23713090.831Good
S17 [83]44,100164167.92.411506.452.7429.312850.619Good
S18 [84]17,662.5800300.972.1425.081.740426.591.000Excellent
17,662.5800301.352.1425.081.740411.881.000Excellent
17,662.5800301.572.1425.081.740387.361.000Excellent
17,662.5800301.42.1425.083.440529.561.000Excellent
17,662.5800301.72.1425.083.440490.331.000Excellent
17,662.5800301.92.1425.083.440460.911.000Excellent
17,662.5800301.282.1425.081.740490.331.000Excellent
17,662.5800301.52.1425.081.740460.911.000Excellent
17,662.5800301.72.1425.081.740430.41.000Excellent
S19 [50]
32,989.6251600662.424.72759.683.823720410.841Good
S20 [54]
35,281.041600662.424.72759.681.913730681.000Excellent
S21 [85]
49,062.5118462.61.892.431175.800.7834.4219880.682Good
S22 [79]
70,65093455.41.562.21567.743.1442.929350.827Good
S23 [51]50,645.0674043.31.711.6783.870.753619750.854Good
S24 [86]
22,500735501.51.4283.390.0120.83701.000Excellent
17,662.5735501.51.9283.390.0120.83451.000Excellent
22,500735501.51.4283.390.0120.83651.000Excellent
S25 [87]
32,349.06580046.21.572.5783.873.25013531.000Excellent
32,349.06580046.21.572.5783.873.25012851.000Excellent
32,349.06580046.21.573.71175.803.25016231.000Excellent
32,349.06580046.21.573.71175.803.25015701.000Excellent
S26 [88]
22,500110354.11.51.04425.080.6323.516770.847Good
S27 [89]
22,500630401.52.3506.450.3325.74011.000Excellent
22,500630401.52.3506.450.3325.71201.000Excellent
22,500630401.53.4759.680.3325.72151.000Excellent
22,500630401.52.3506.450.3325.73821.000Excellent
22,500630401.52.3506.450.3325.71291.000Excellent
22,500630401.53.4759.680.3325.72201.000Excellent
S28 [25]
122,50072847.61.531.92550.471.732.640060.720Good
S29 [25]122,50074748.21.560.81012.902.5536.439000.959Good
S30 [90]
40,000735461.60.8283.393.132.1936.80.916Good
S31 [91]
90,000654392.11.31175.800.3755.221911.000Excellent
S32 [83]44,100405.923.41.81.15506.452.2429.312851.000Excellent
44,100405.923.41.81.15506.452.2429.38031.000Excellent
S33 [92]
122,500840451.871.391567.741.842.556700.985Good
Note: In this table, only the most efficient values from each source have been shown. (Value 1 is an excellent value and less than that is accepted as a good value). Green value of efficiency (i.e., 1) shows the best output, a best combination of the columns produced with the help of GFRP. Green colour shows excellent combination (i.e., 1) and orange colour shows good available conditions within a single source but have value less than 1.
Table 3. Training and Validation parameters for GFRP-made RC columns Efficiency using ANNs.
MeasuresTrainingValidation
R20.83635990.864329
RMSE0.11461420.1108383
Sum Freq21254
Publisher’s Note: MDPI stays neutral with regard to jurisdictional claims in published maps and institutional affiliations.

