
Self-Compacting Earth-Based Composites: Mixture Design and Multi-Performance Characterisation


Abstract
:
1. Introduction
2. Materials and Methods
2.1. Raw Materials Characterisation
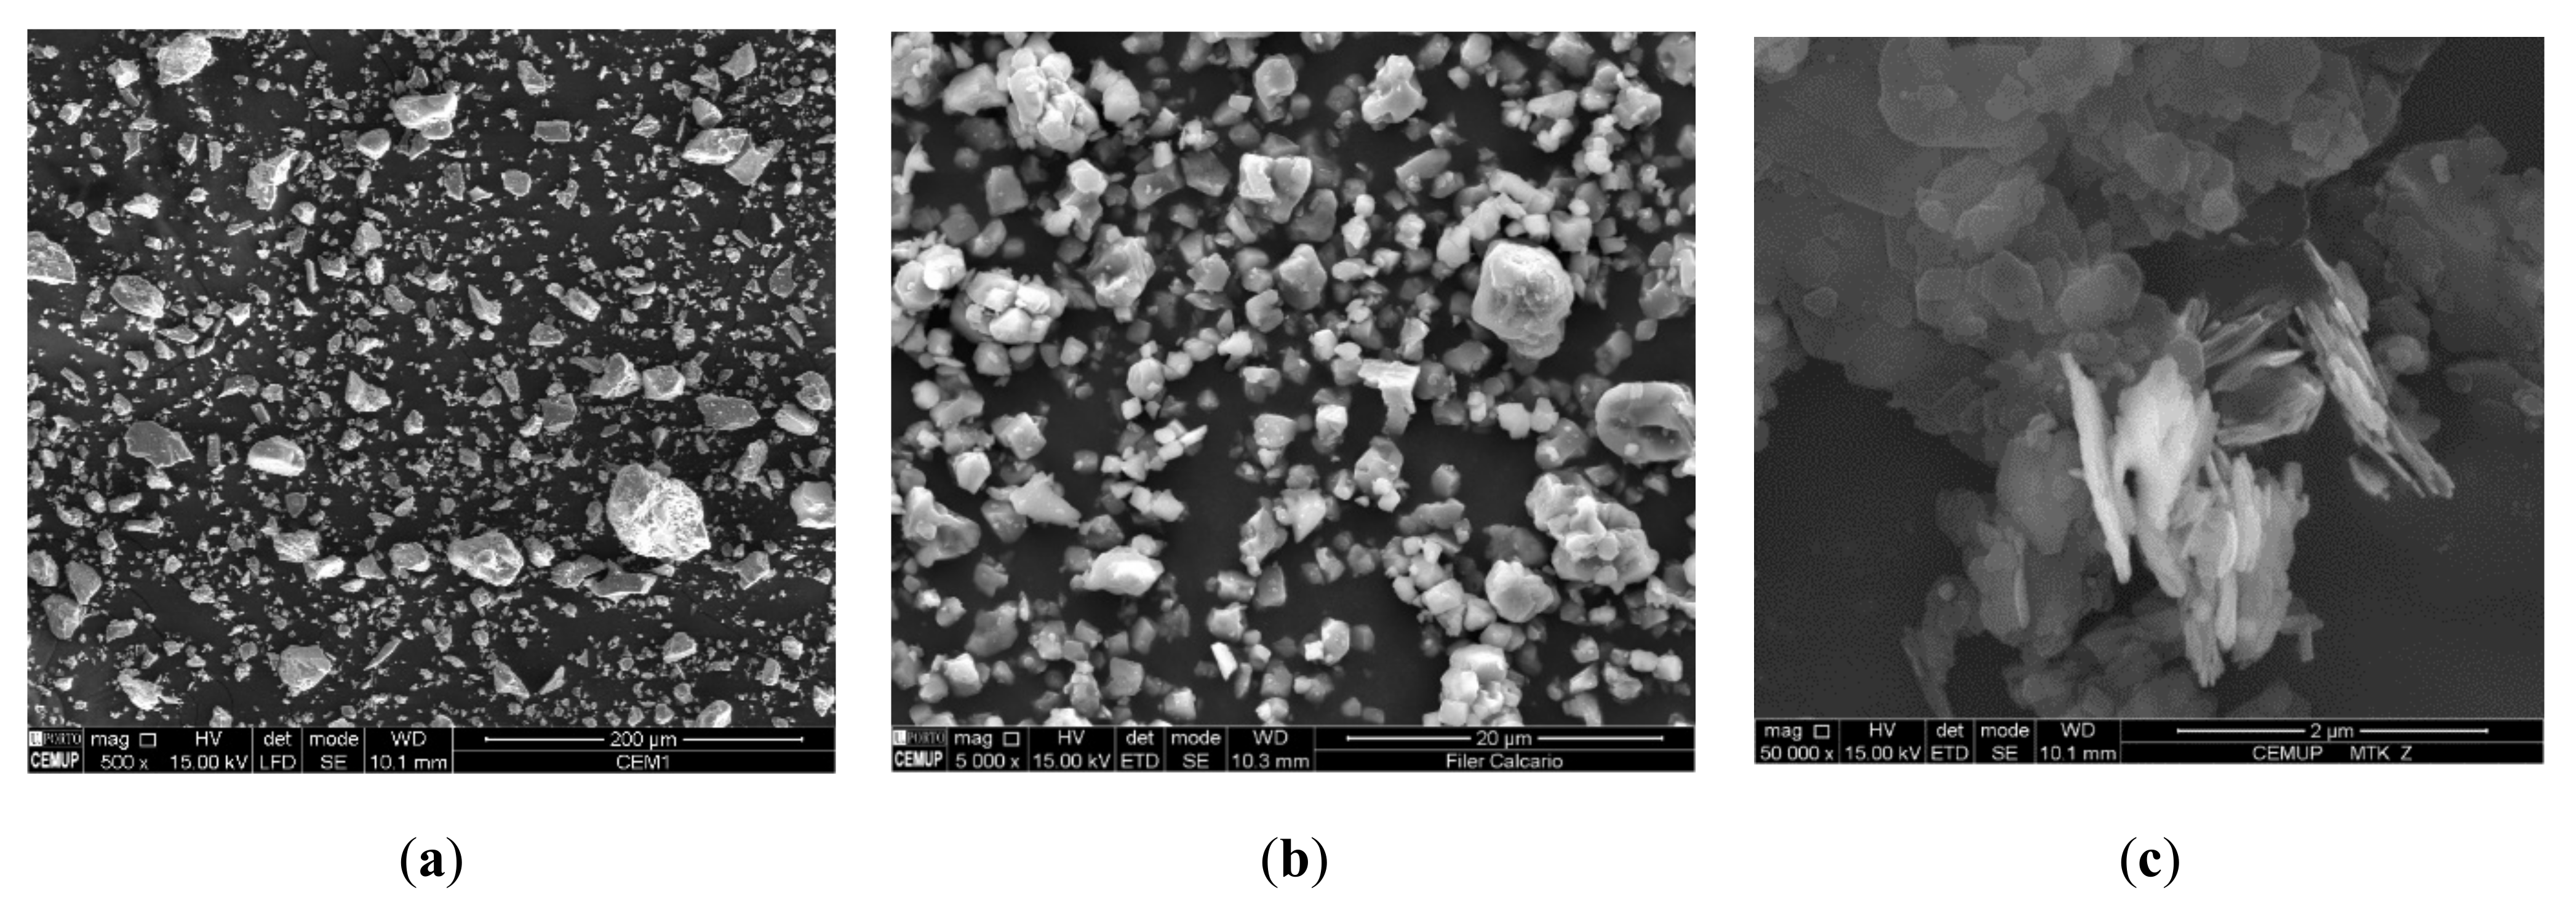
2.1.1. Binder Fraction
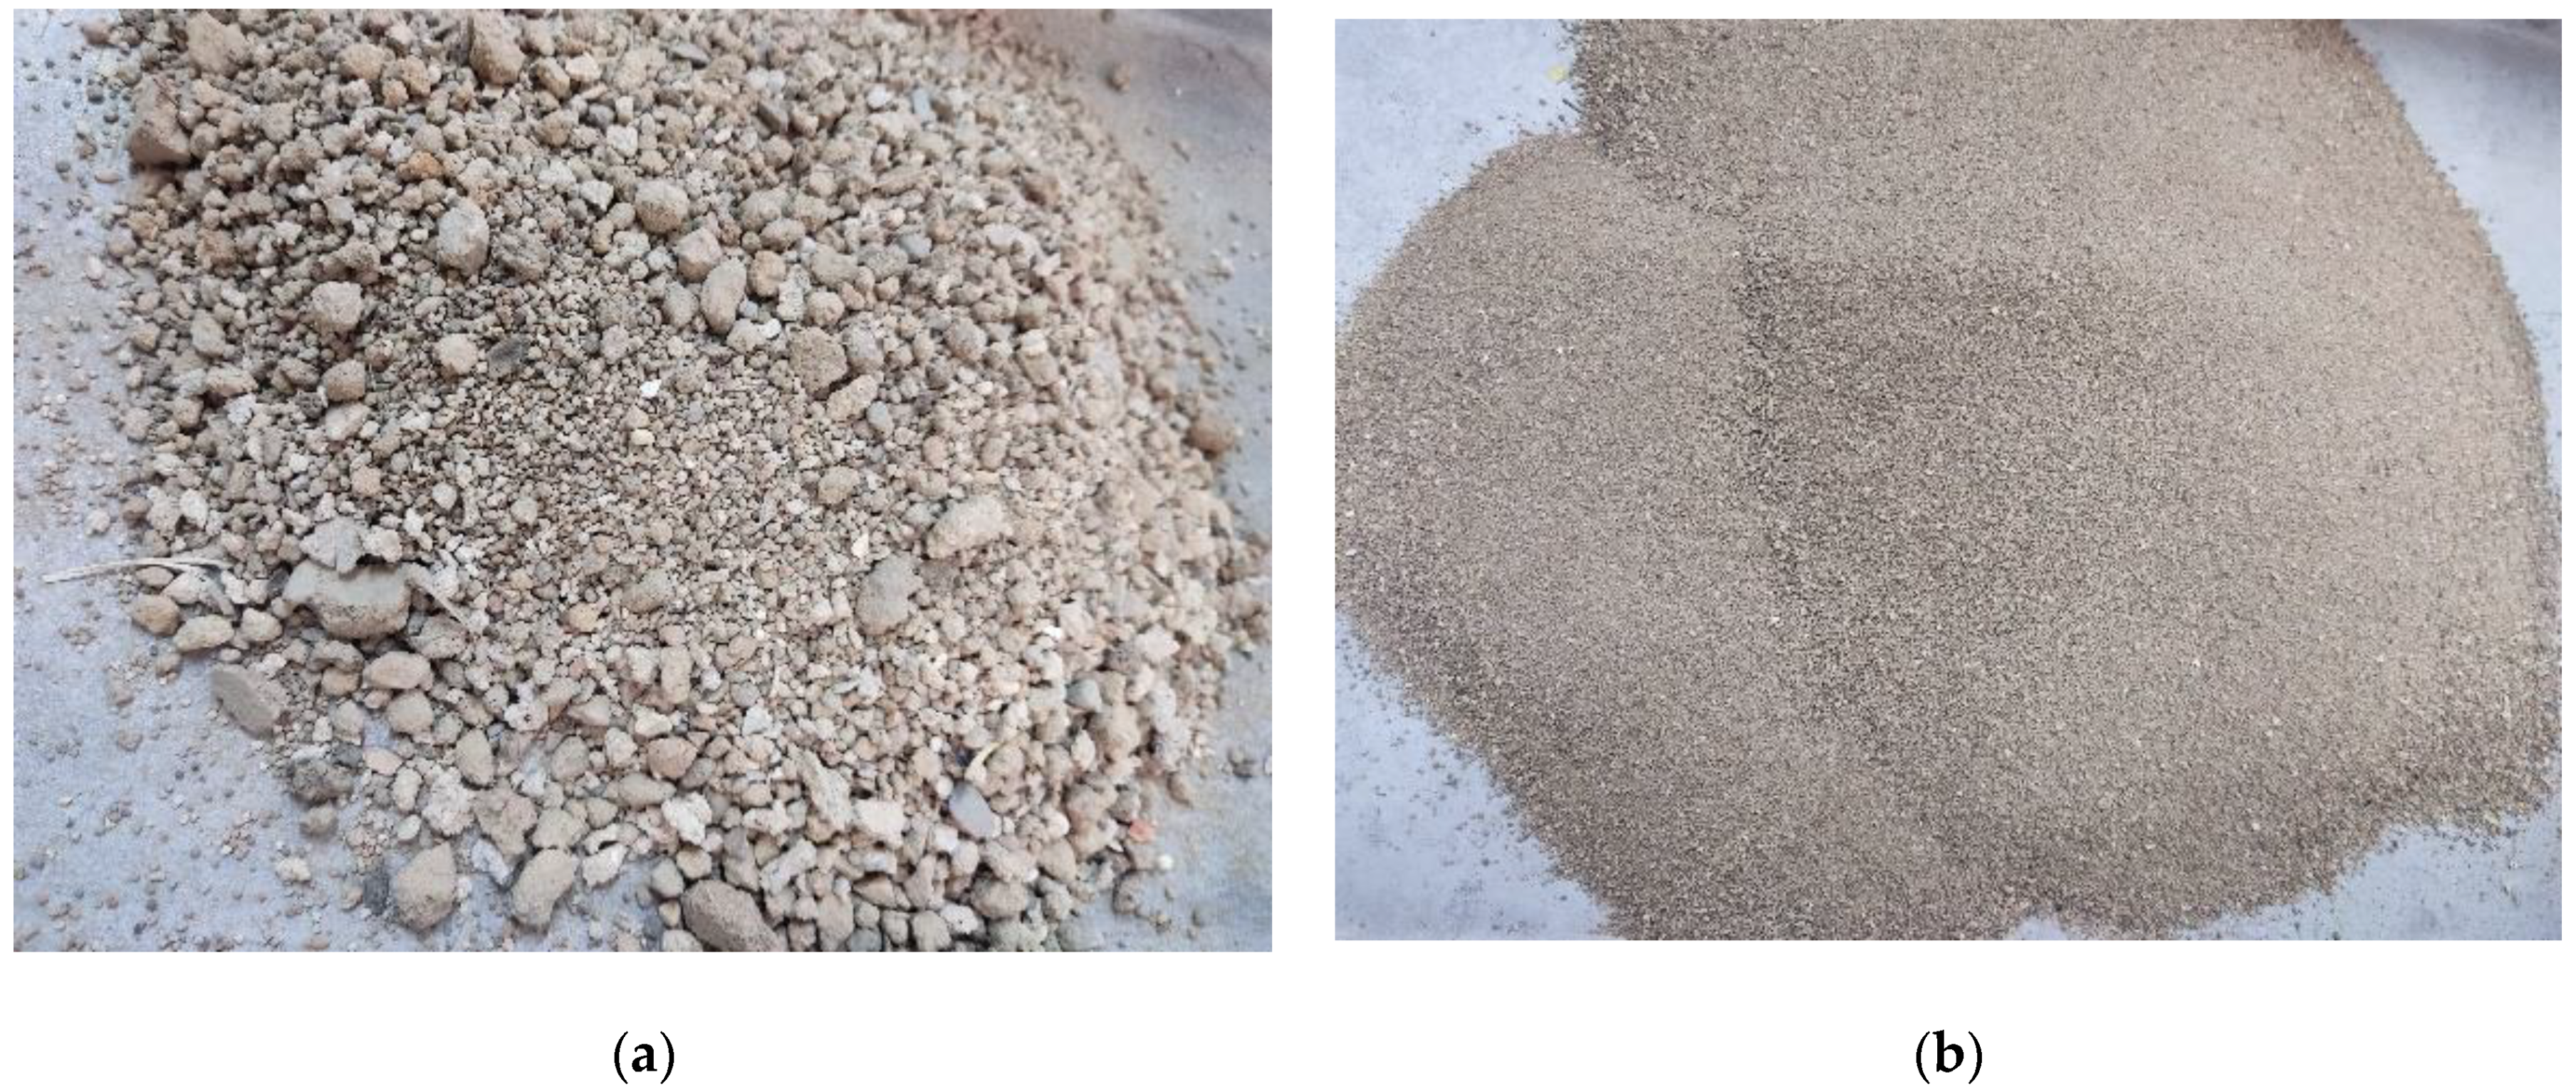
2.1.2. Soil
2.2. Experimental Programme
2.2.1. Mixtures Design and Specimens Manufacture
- b/soil—binder to soil weight ratio;
- c/soil—cement to soil weight ratio;
- sp/fines (%)—superplasticiser to fines weight ratio (fines were considered: the clay content of the soil, cement, limestone and metakaolin);
- w/c—water to cement weight ratio;
- w/soil—water to soil weight ratio.
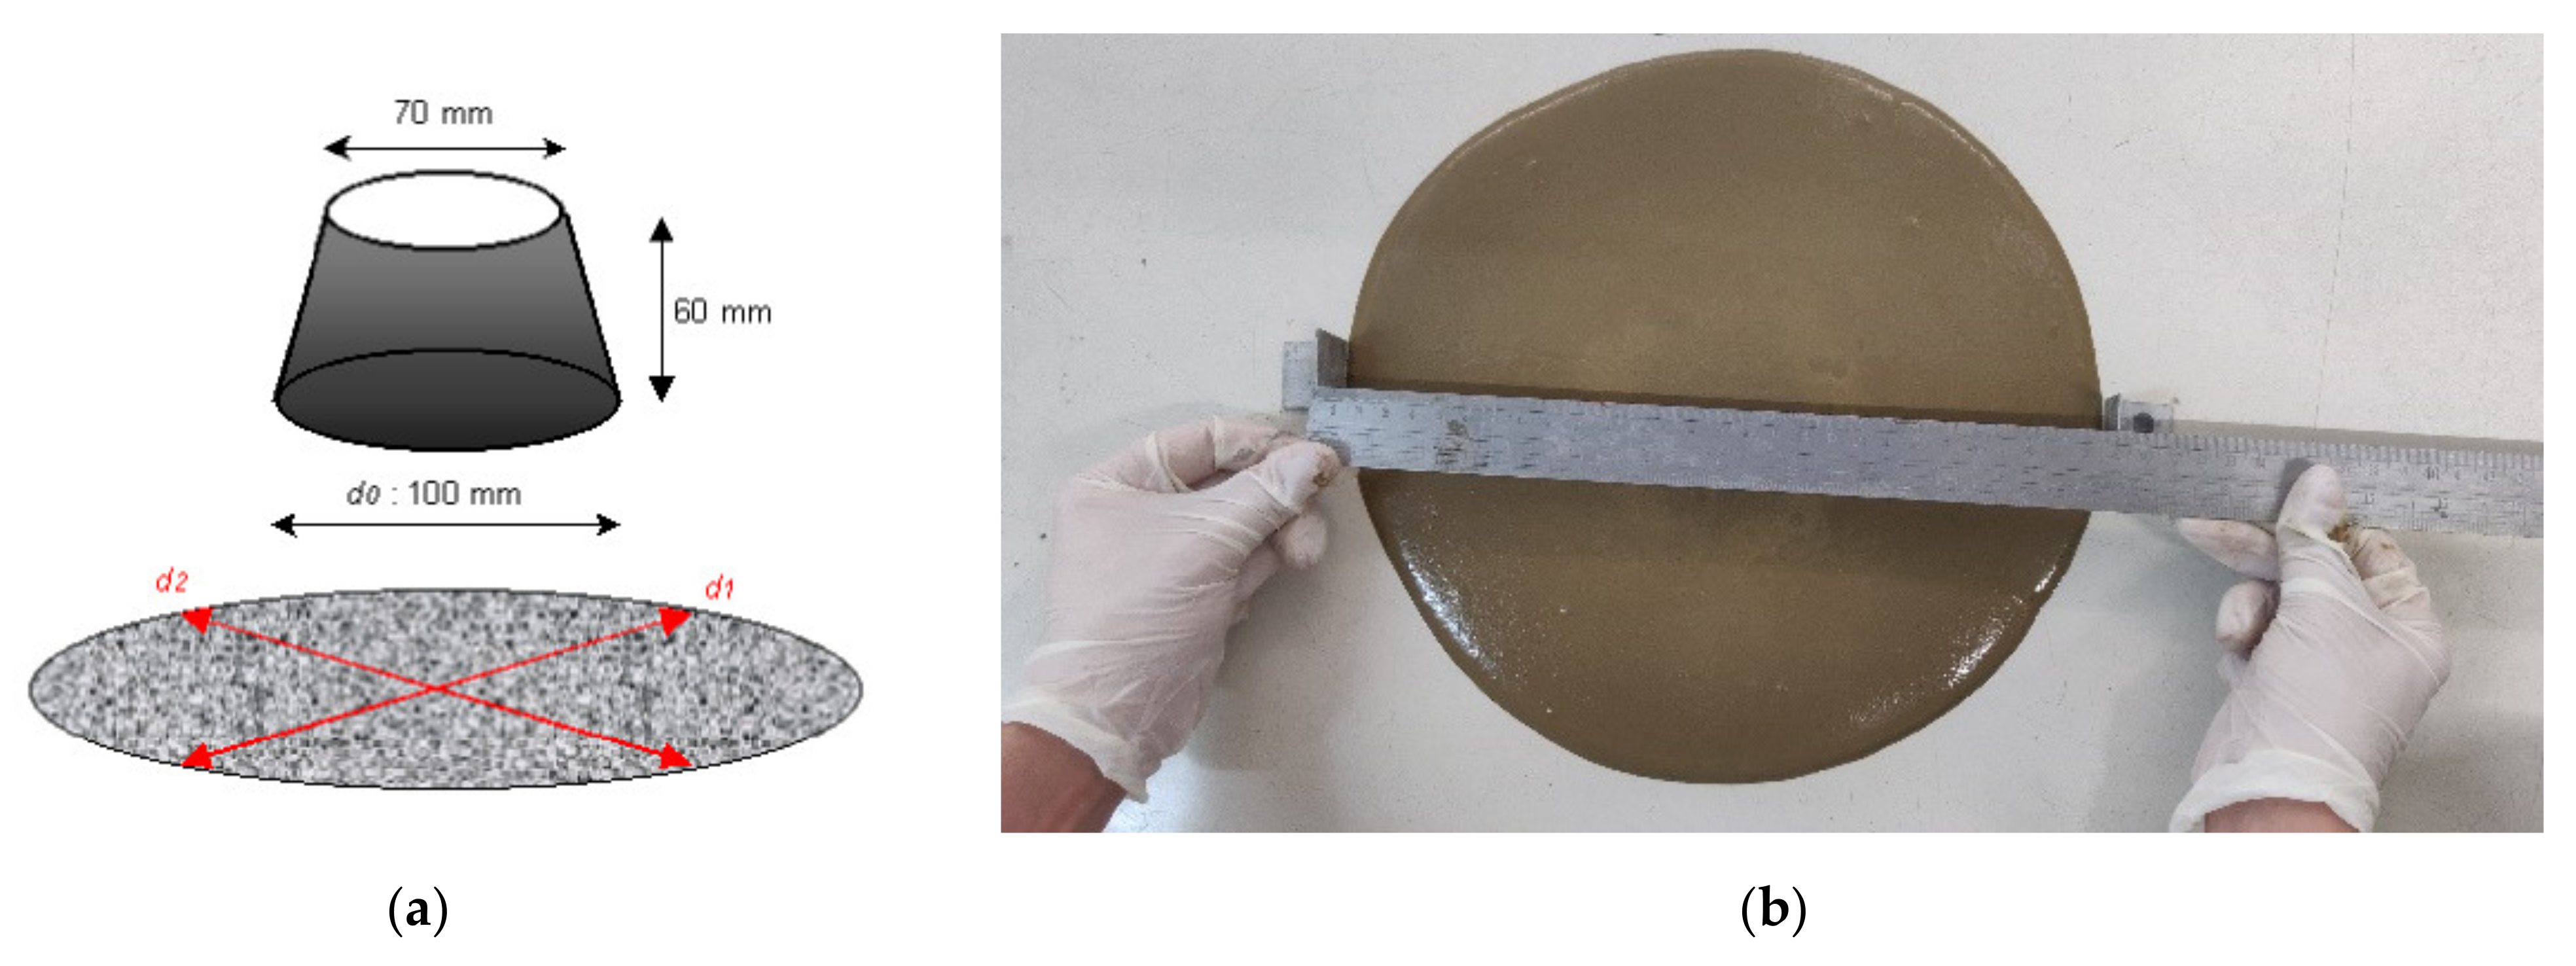
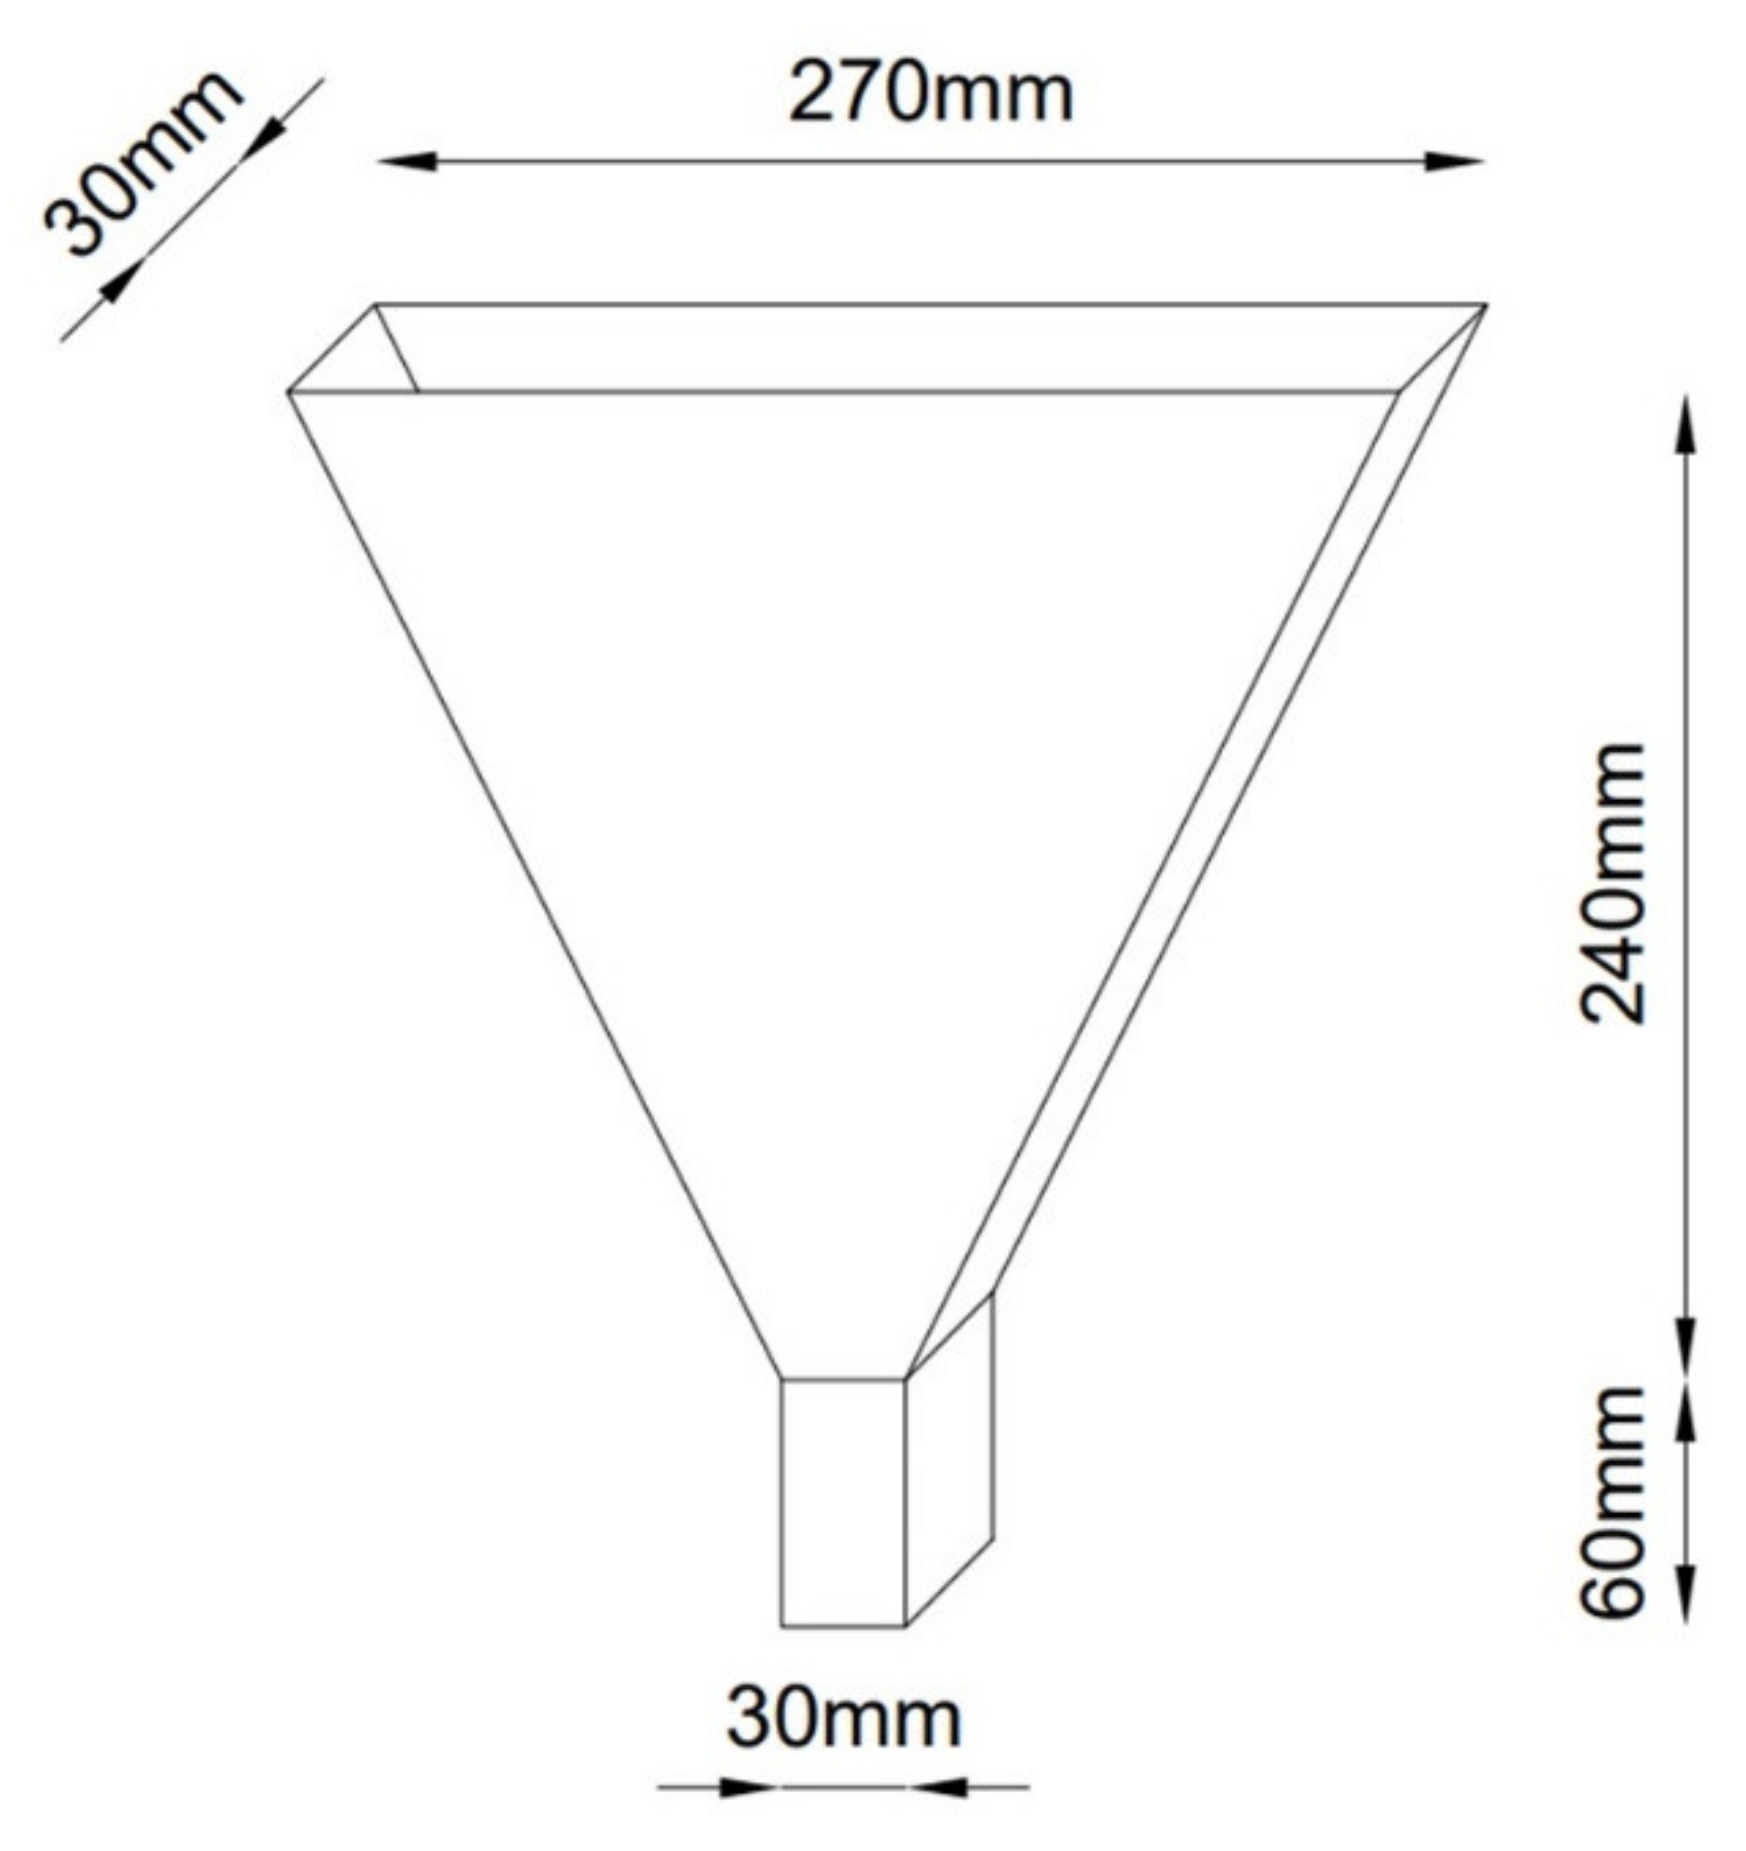
2.2.2. Fresh State Tests
2.2.3. Electrical Resistivity
2.2.4. Mechanical Strength
2.2.5. Drying Shrinkage
2.2.6. Water Capillary Absorption
3. Results and Discussion
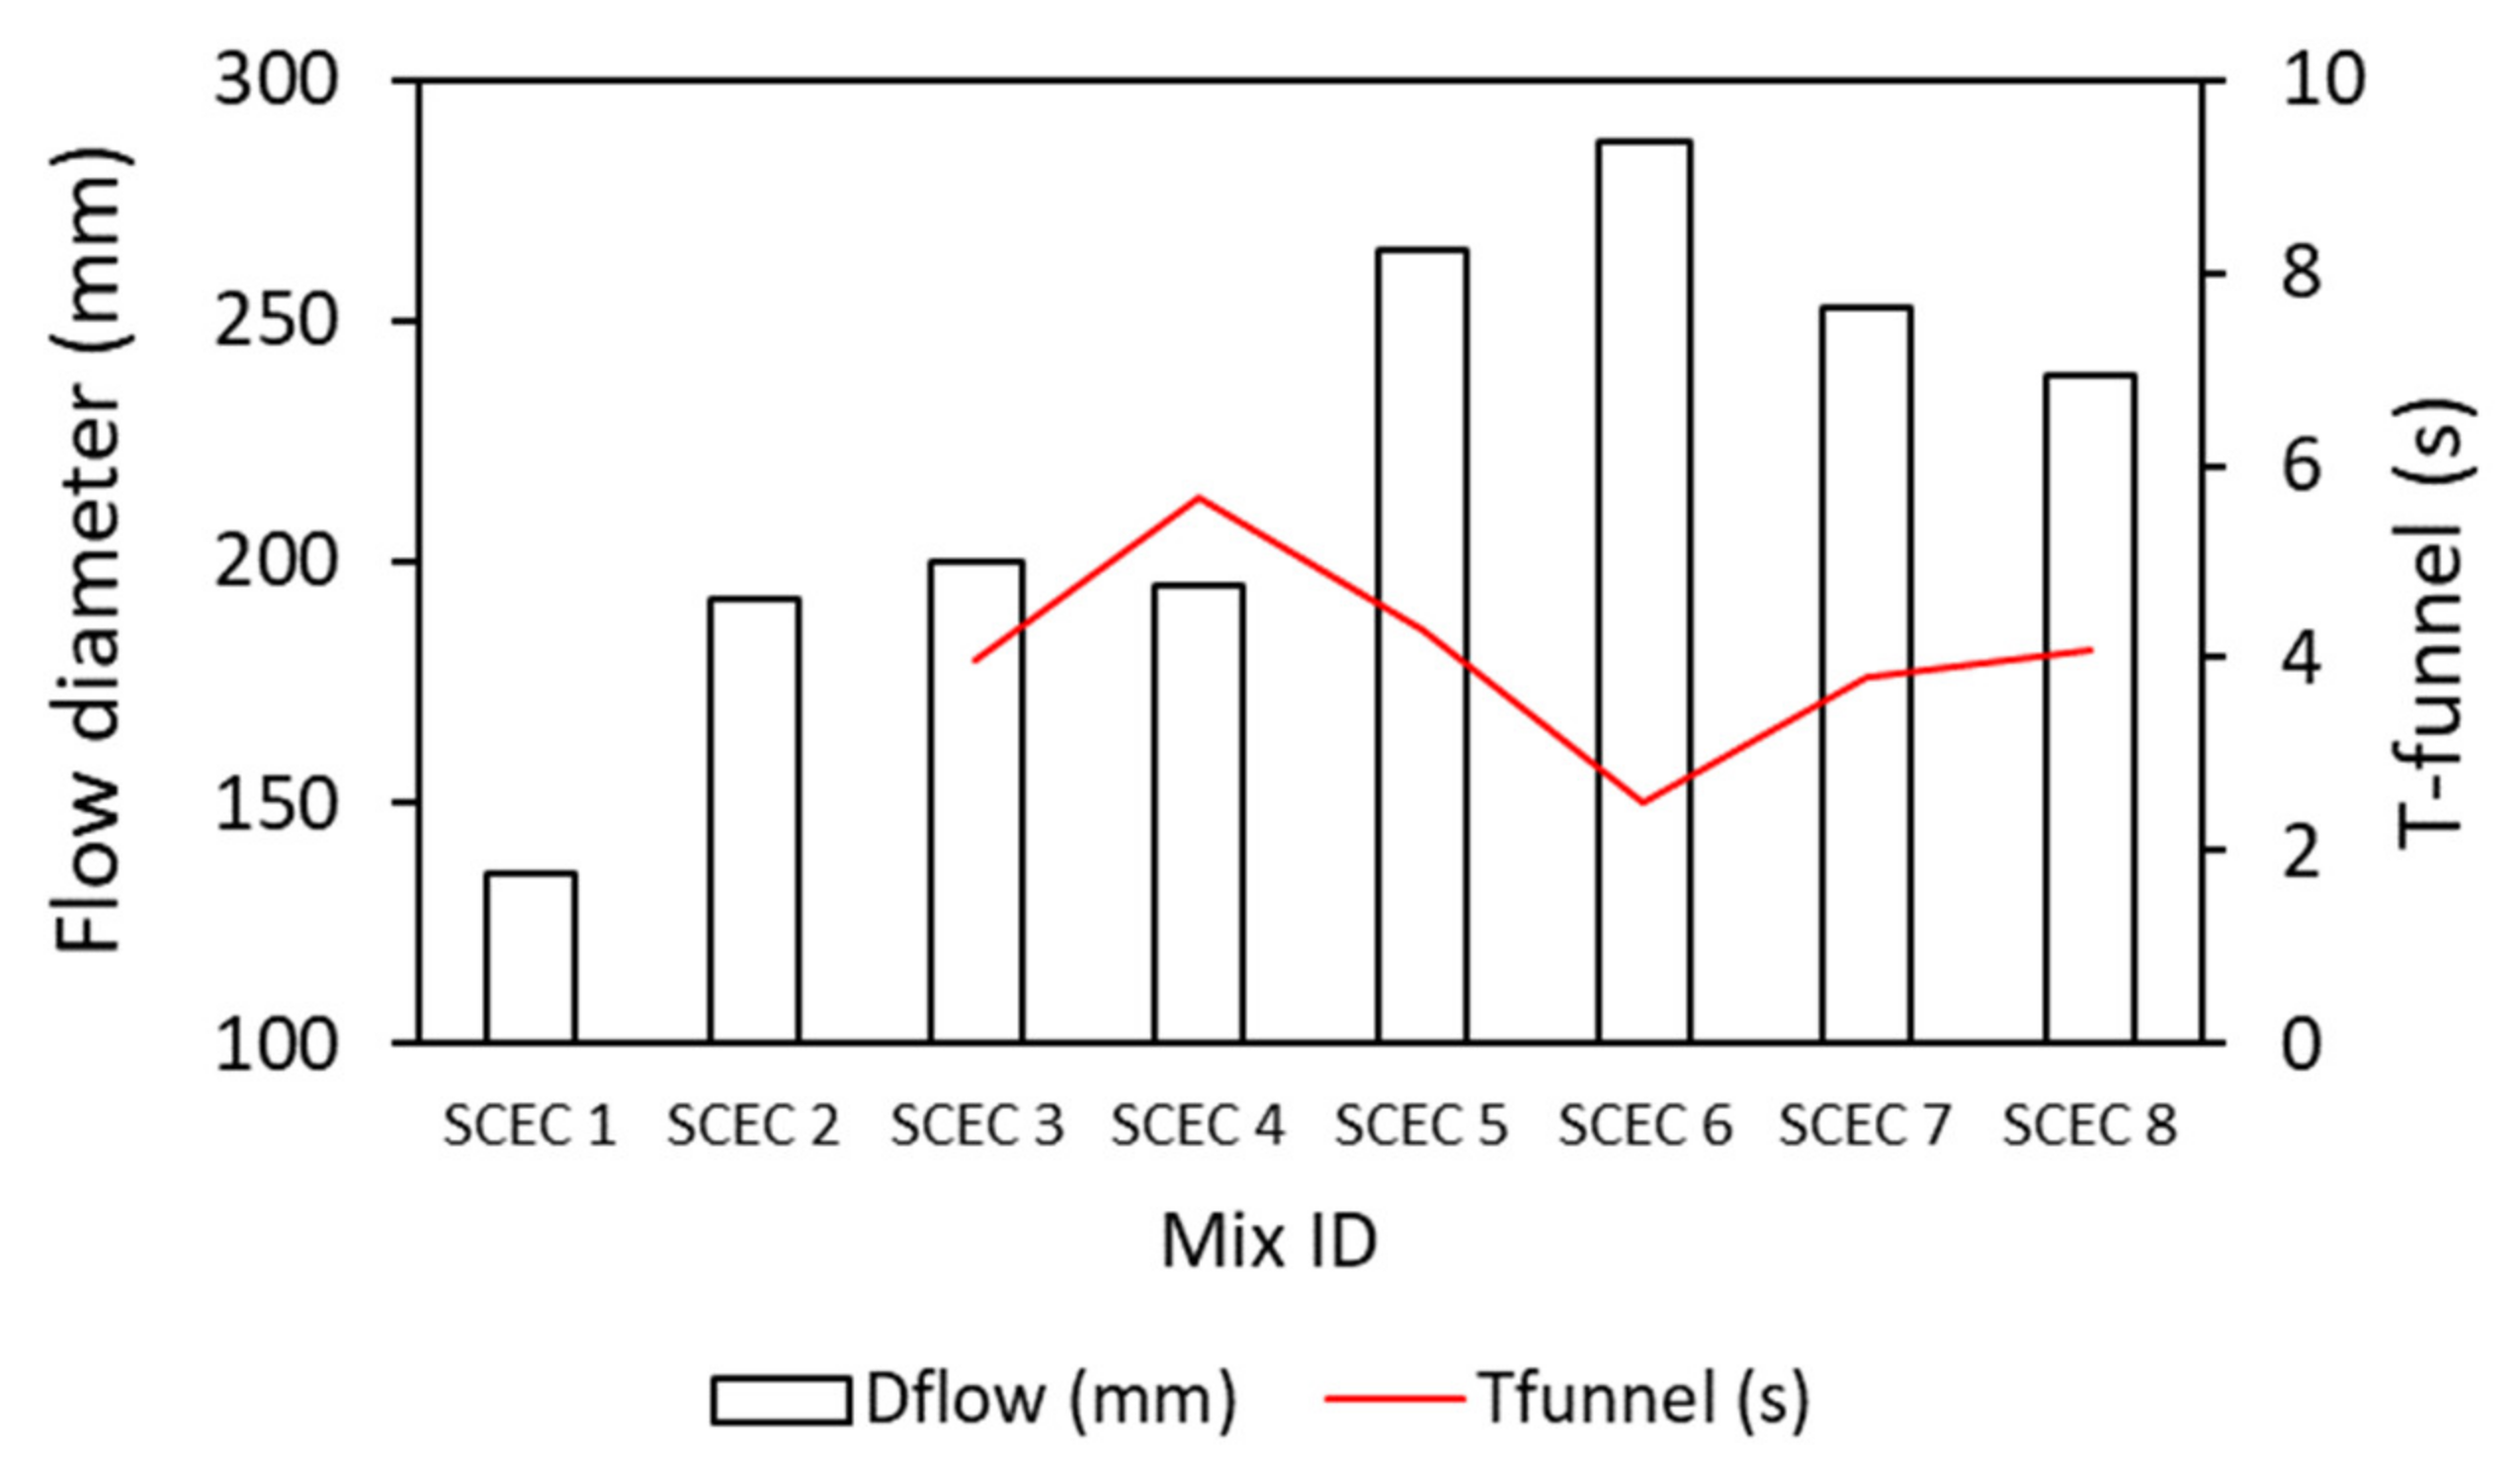
3.1. Self-Compactability
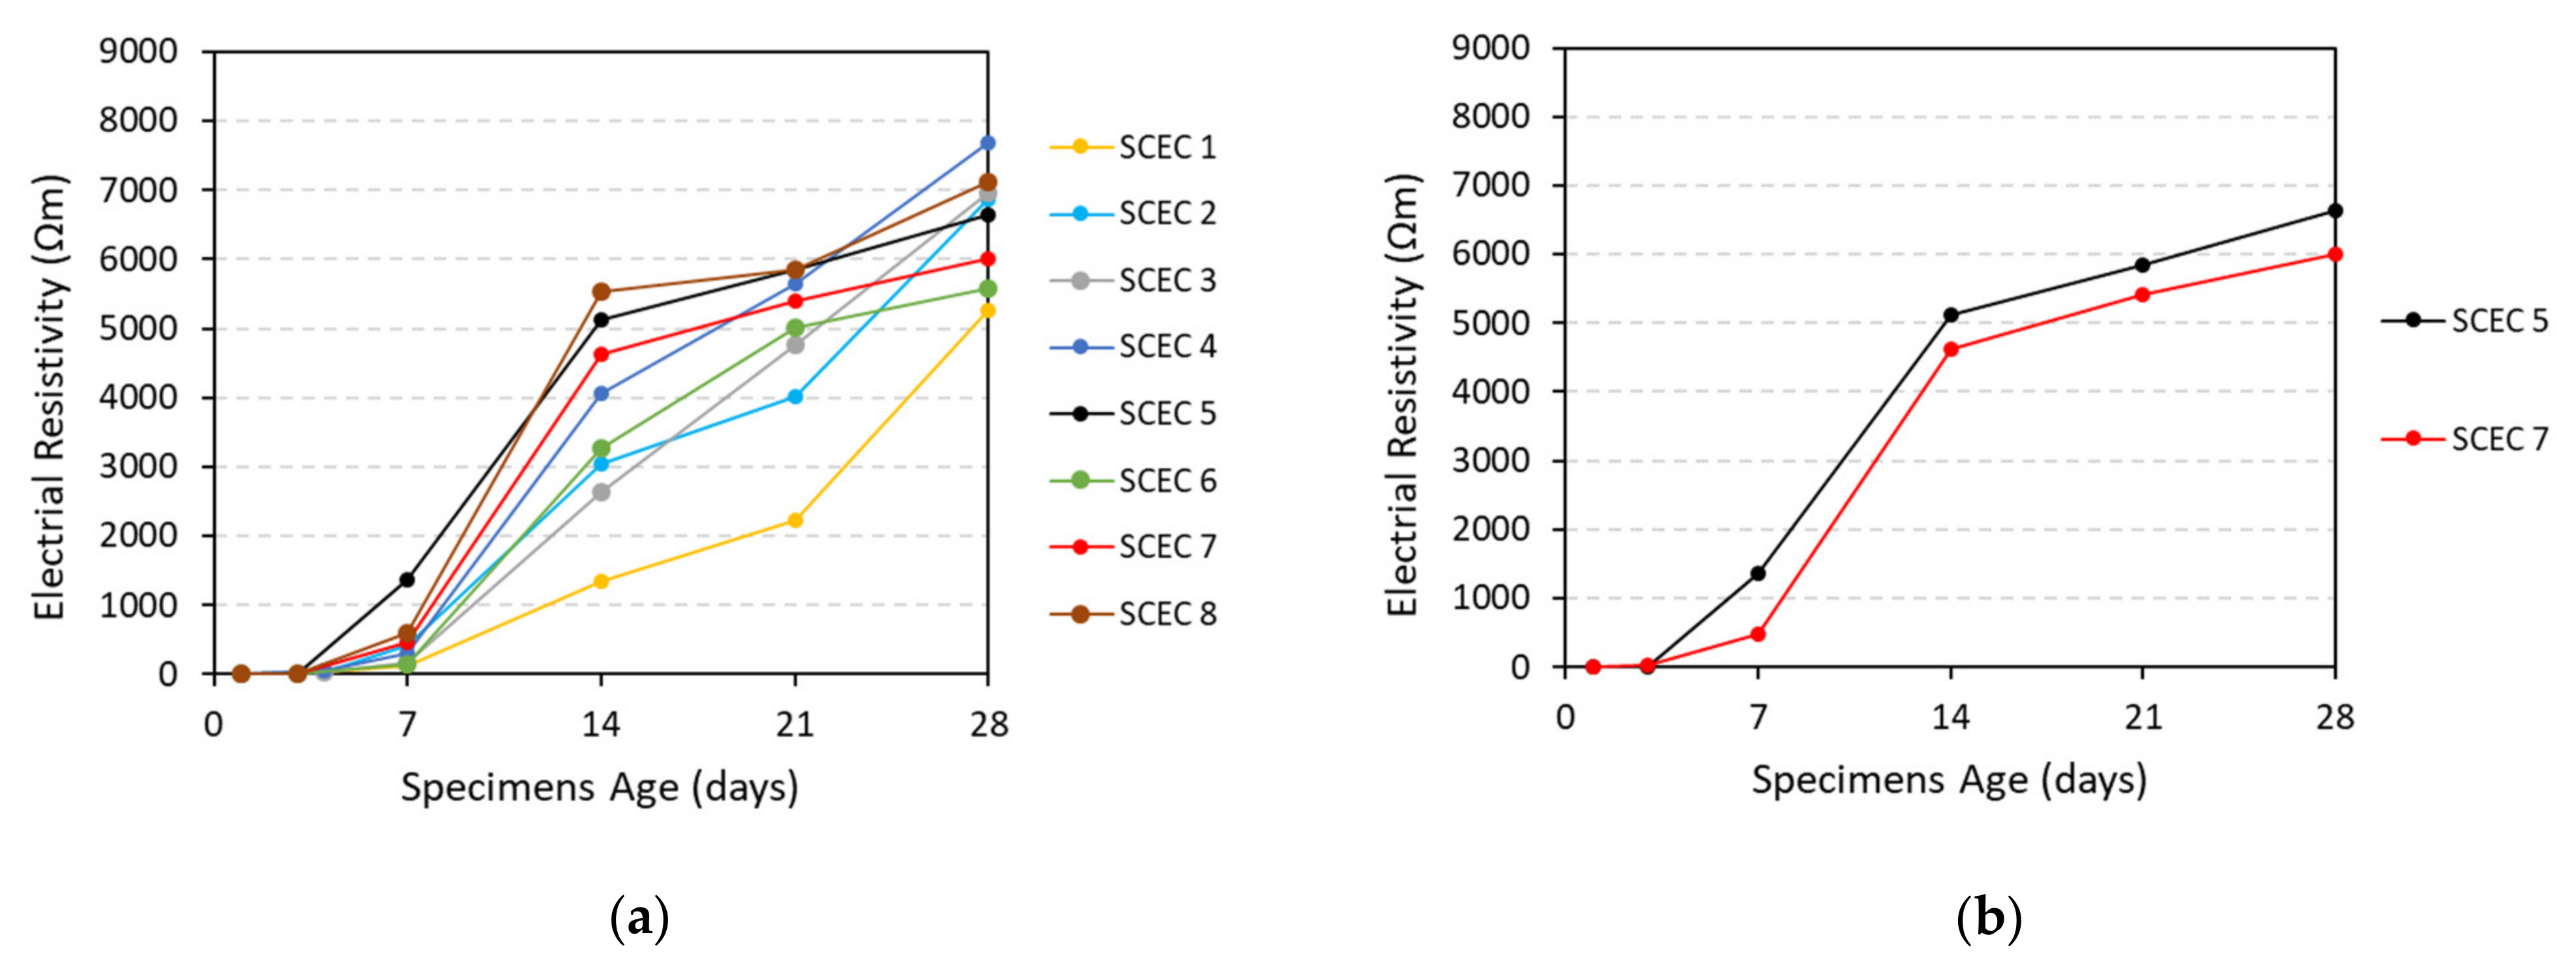
3.2. Electrical Resistivity
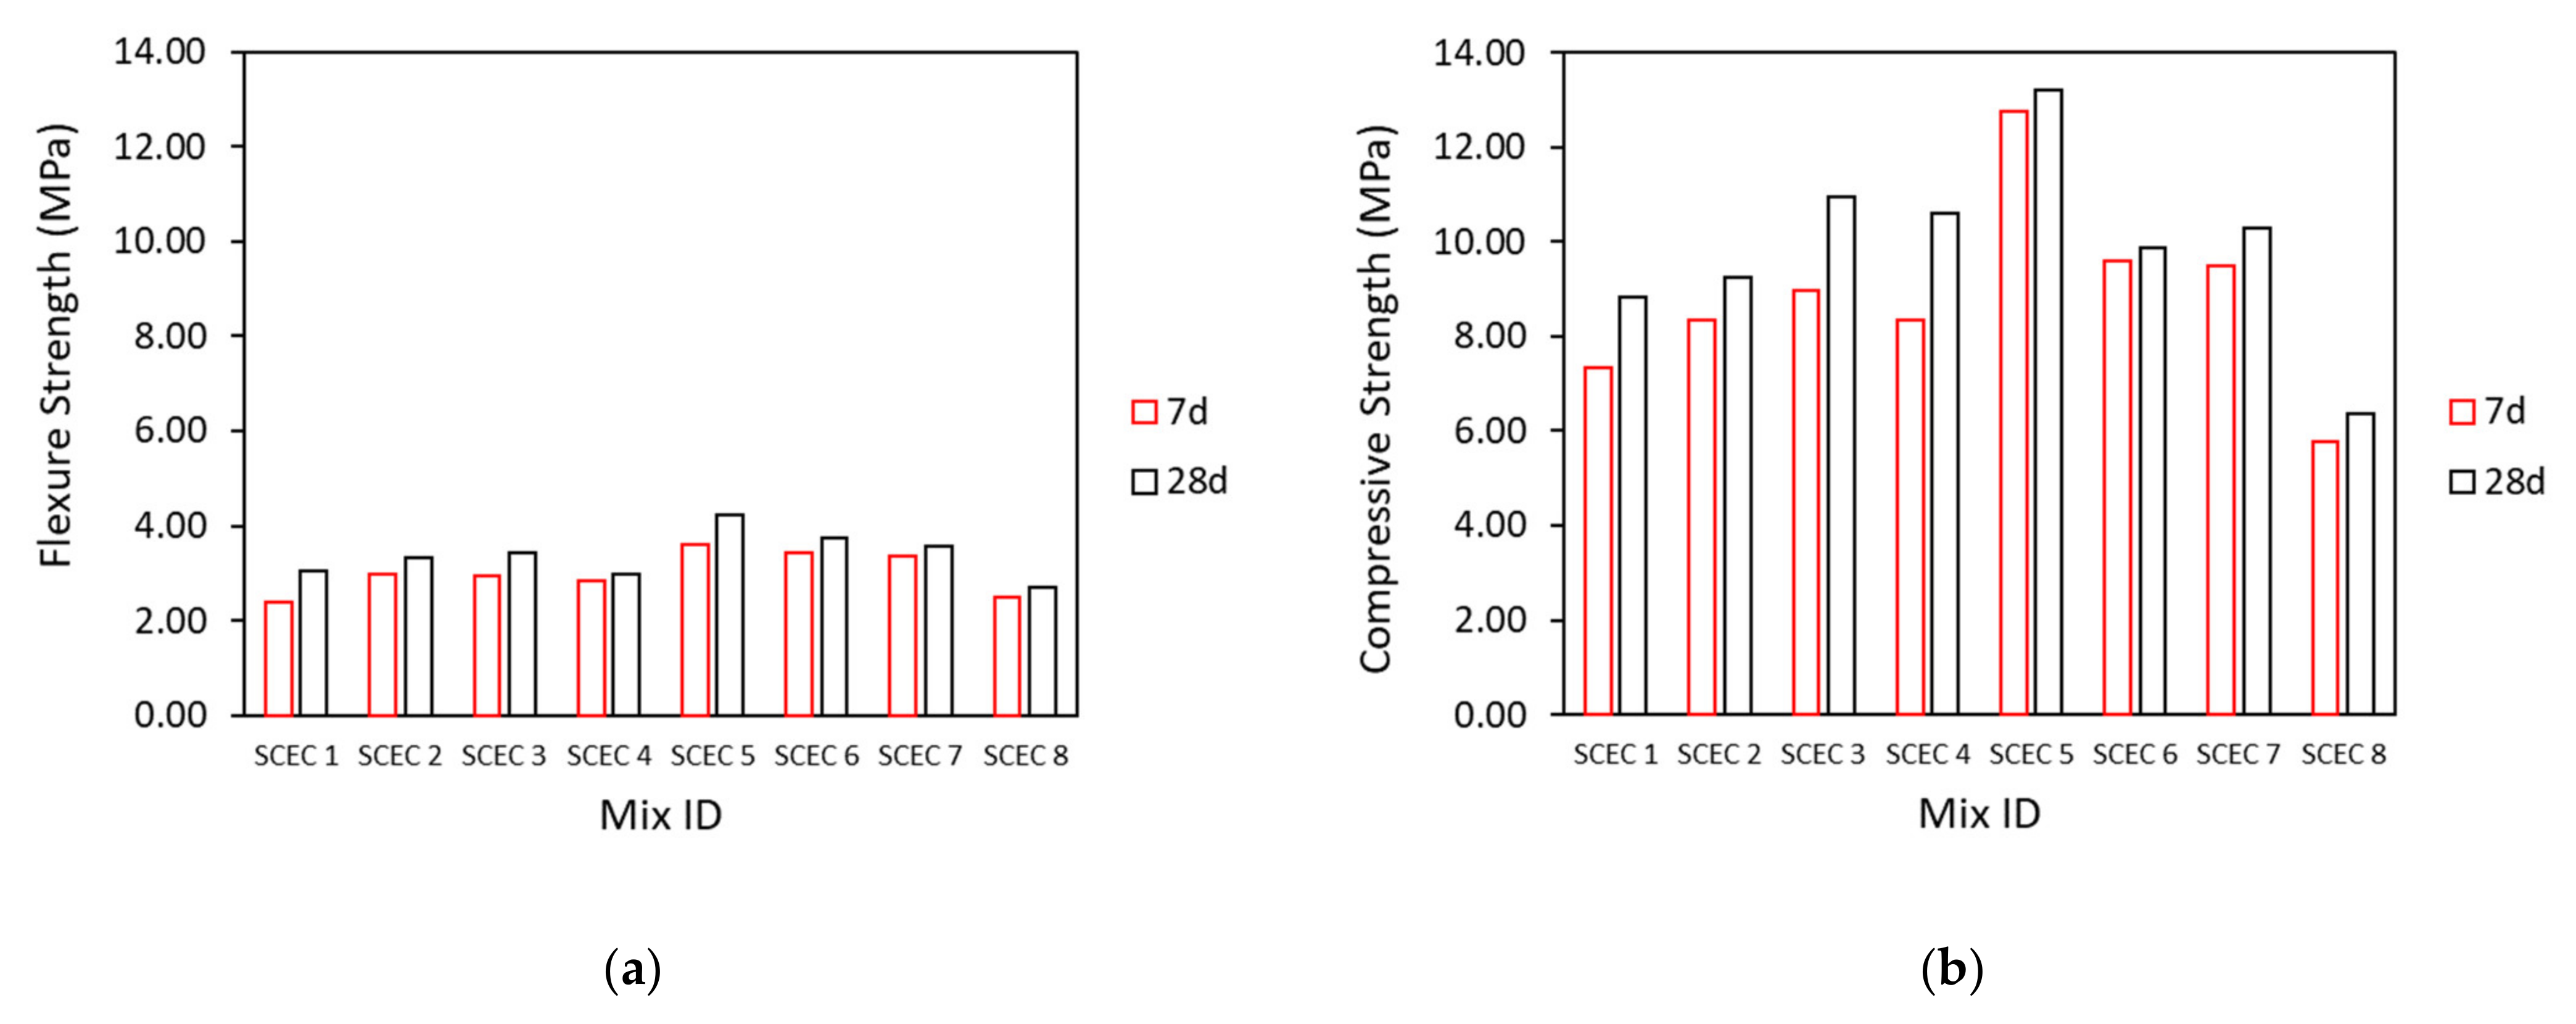
3.3. Mechanical Performance
3.4. Optimal Mixture Selection and Additional Characterisation
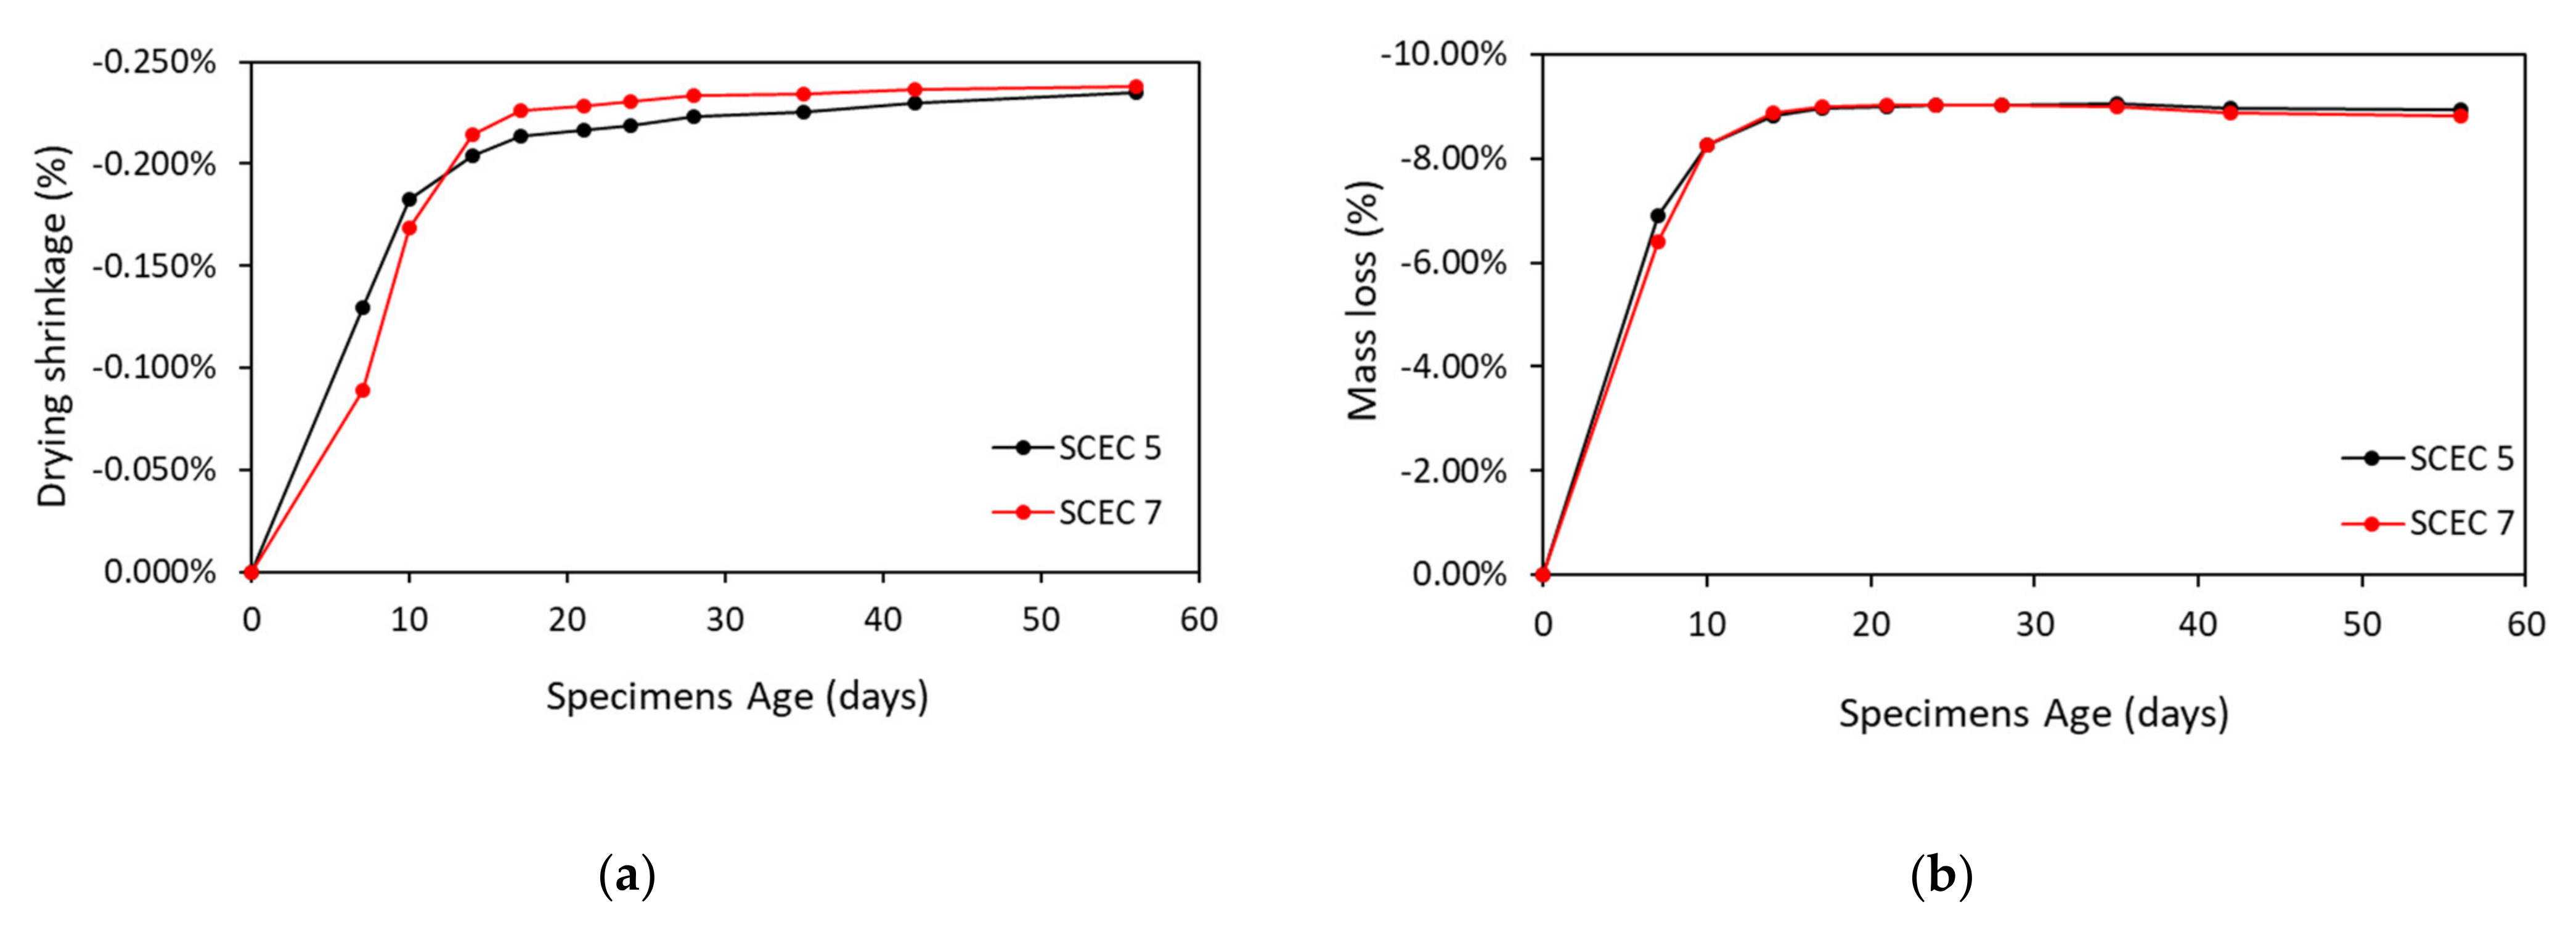
3.4.1. Drying shrinkage
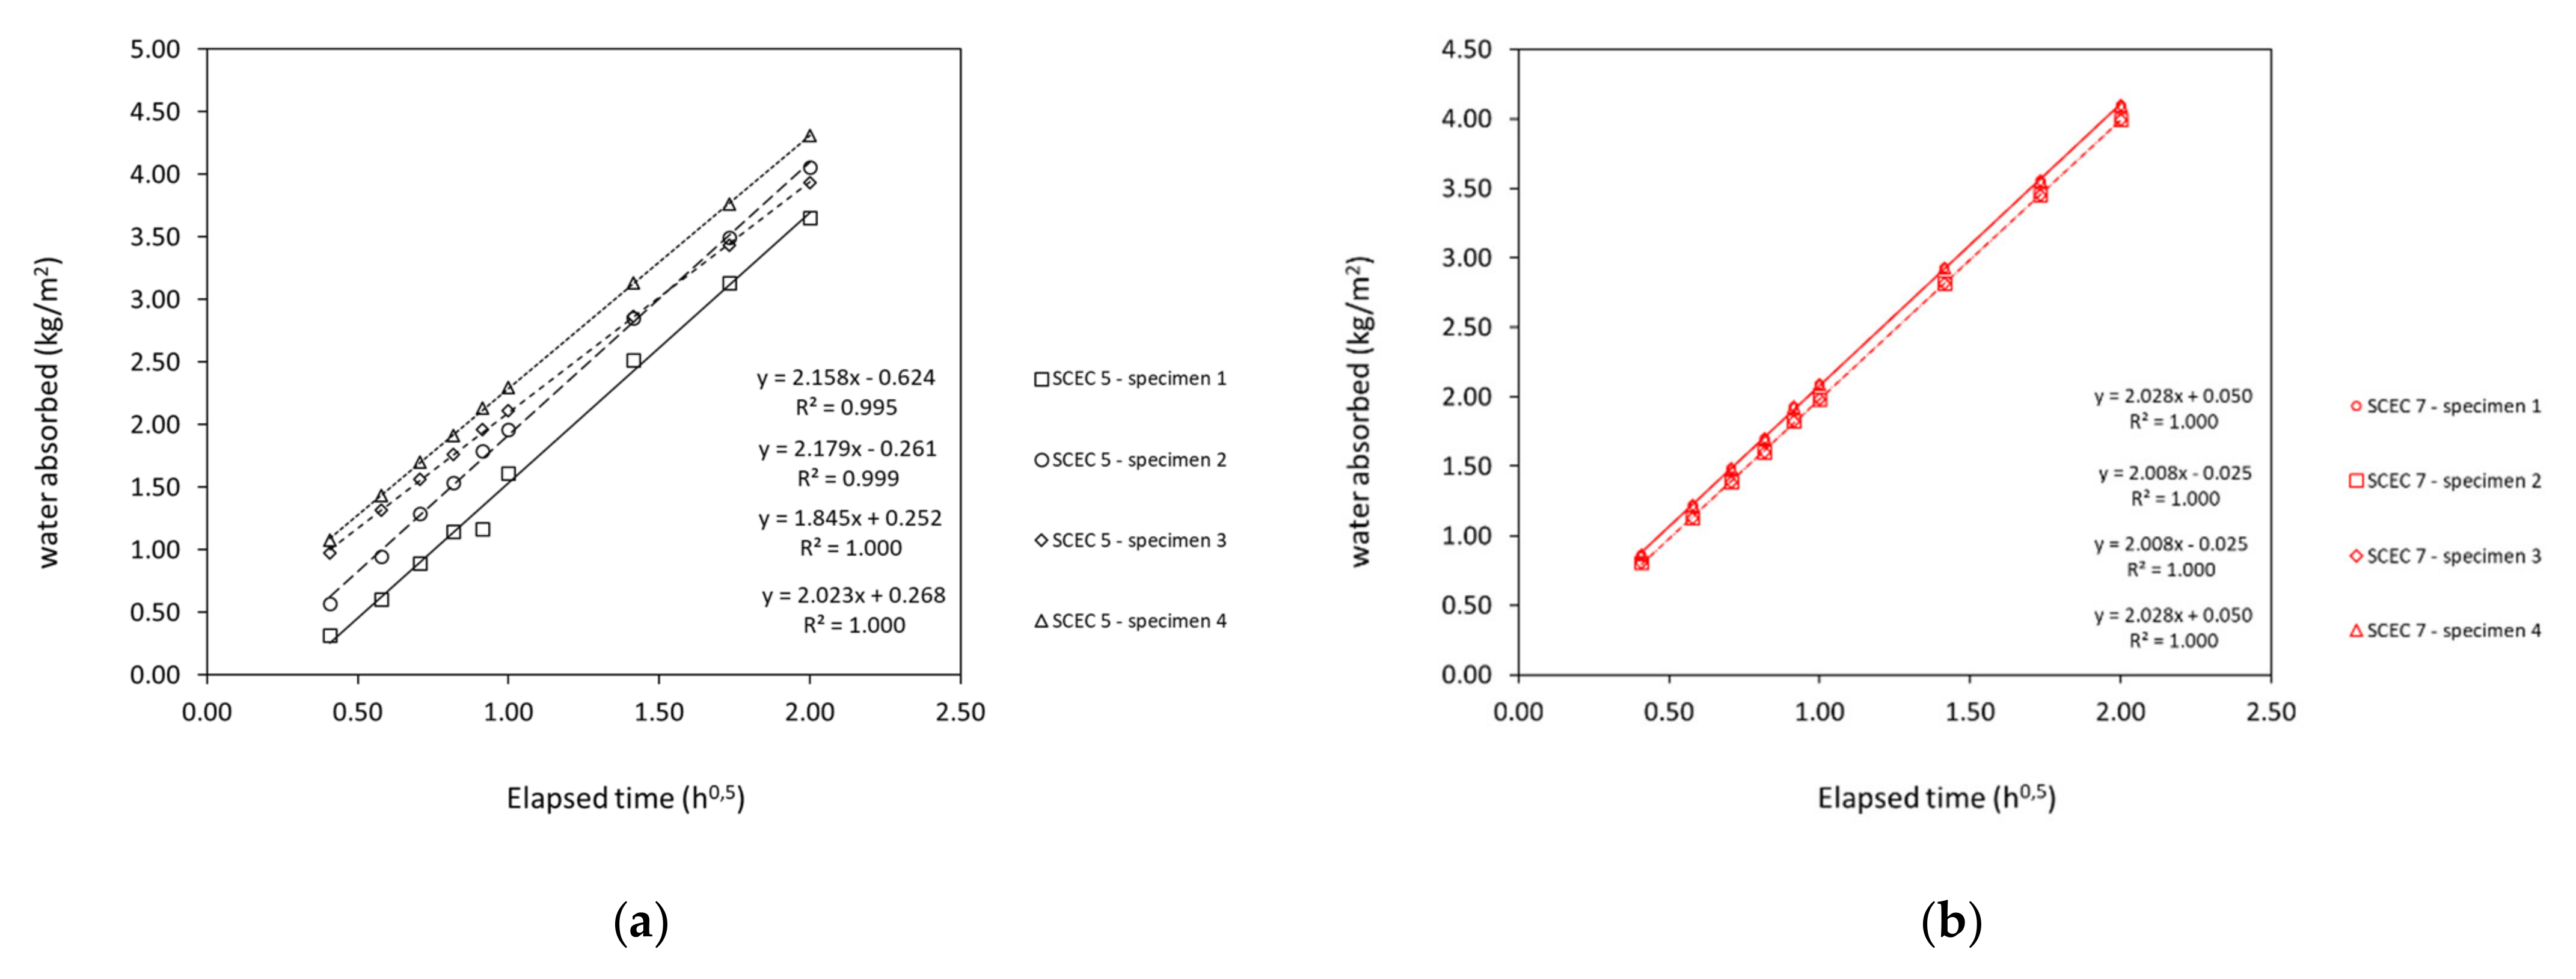
3.4.2. Sorptivity
4. Conclusions
- The methodology developed allowed flowable composites, which can have the formwork removed after 24 h;
- The polycarboxylate ether superplasticiser played an important role with a cementitious blend ensured self-compactability;
- Specimens presented a very good surface finishing quality;
- The transfer of physics and rheology principles used in cement-based materials science seems to fit stabilised earth materials;
- Electrical resistivity increased with time and achieved at least 5600Ωm at 28 days, with a still-growing pattern at this age;
- Capillary water absorption was equivalent to good quality concrete and seemed very promising, particularly considering the desire to build with fully exposed earth walls;
- SCEC presents higher compressive strengths compared to the literature survey on stabilised earth-based material.
Author Contributions
Funding
Institutional Review Board Statement
Informed Consent Statement
Data Availability Statement
Acknowledgments
Conflicts of Interest
Abbreviations
| b/soil | binder to soil weight ratio |
| c/soil | cement to soil weight ratio |
| Dflow | Spread flow diameter (mm) |
| h | hours |
| LF | Limestone filler |
| LOI | Loss on ignition (%) |
| MTK | Metakaolin |
| PC | Portland cement |
| PCE | Polycarboxylate ethers |
| PSD | Particle size distribution |
| S | Sorptivity coefficient (kg/(m2 h0.5)) |
| SCM | Supplementary cementitious materials |
| SCEC | Self-compactable earth-based composites |
| SEM | Scanning electron microscopy |
| Sp | Superplasticiser |
| RH | Relative Humidity (%) |
| sp/fines (%) | Superplasticiser to fines weight ratio (where fines where considered: clay content of the soil, cement, limestone and metakaolin) |
| T | Temperature (ºC) |
| T-funnel | Funnel time flow (s) |
| w/b | water to binder weight ratio |
| w/c | water to cement weight ratio |
| w/soil | water to soil weight ratio |
Appendix A

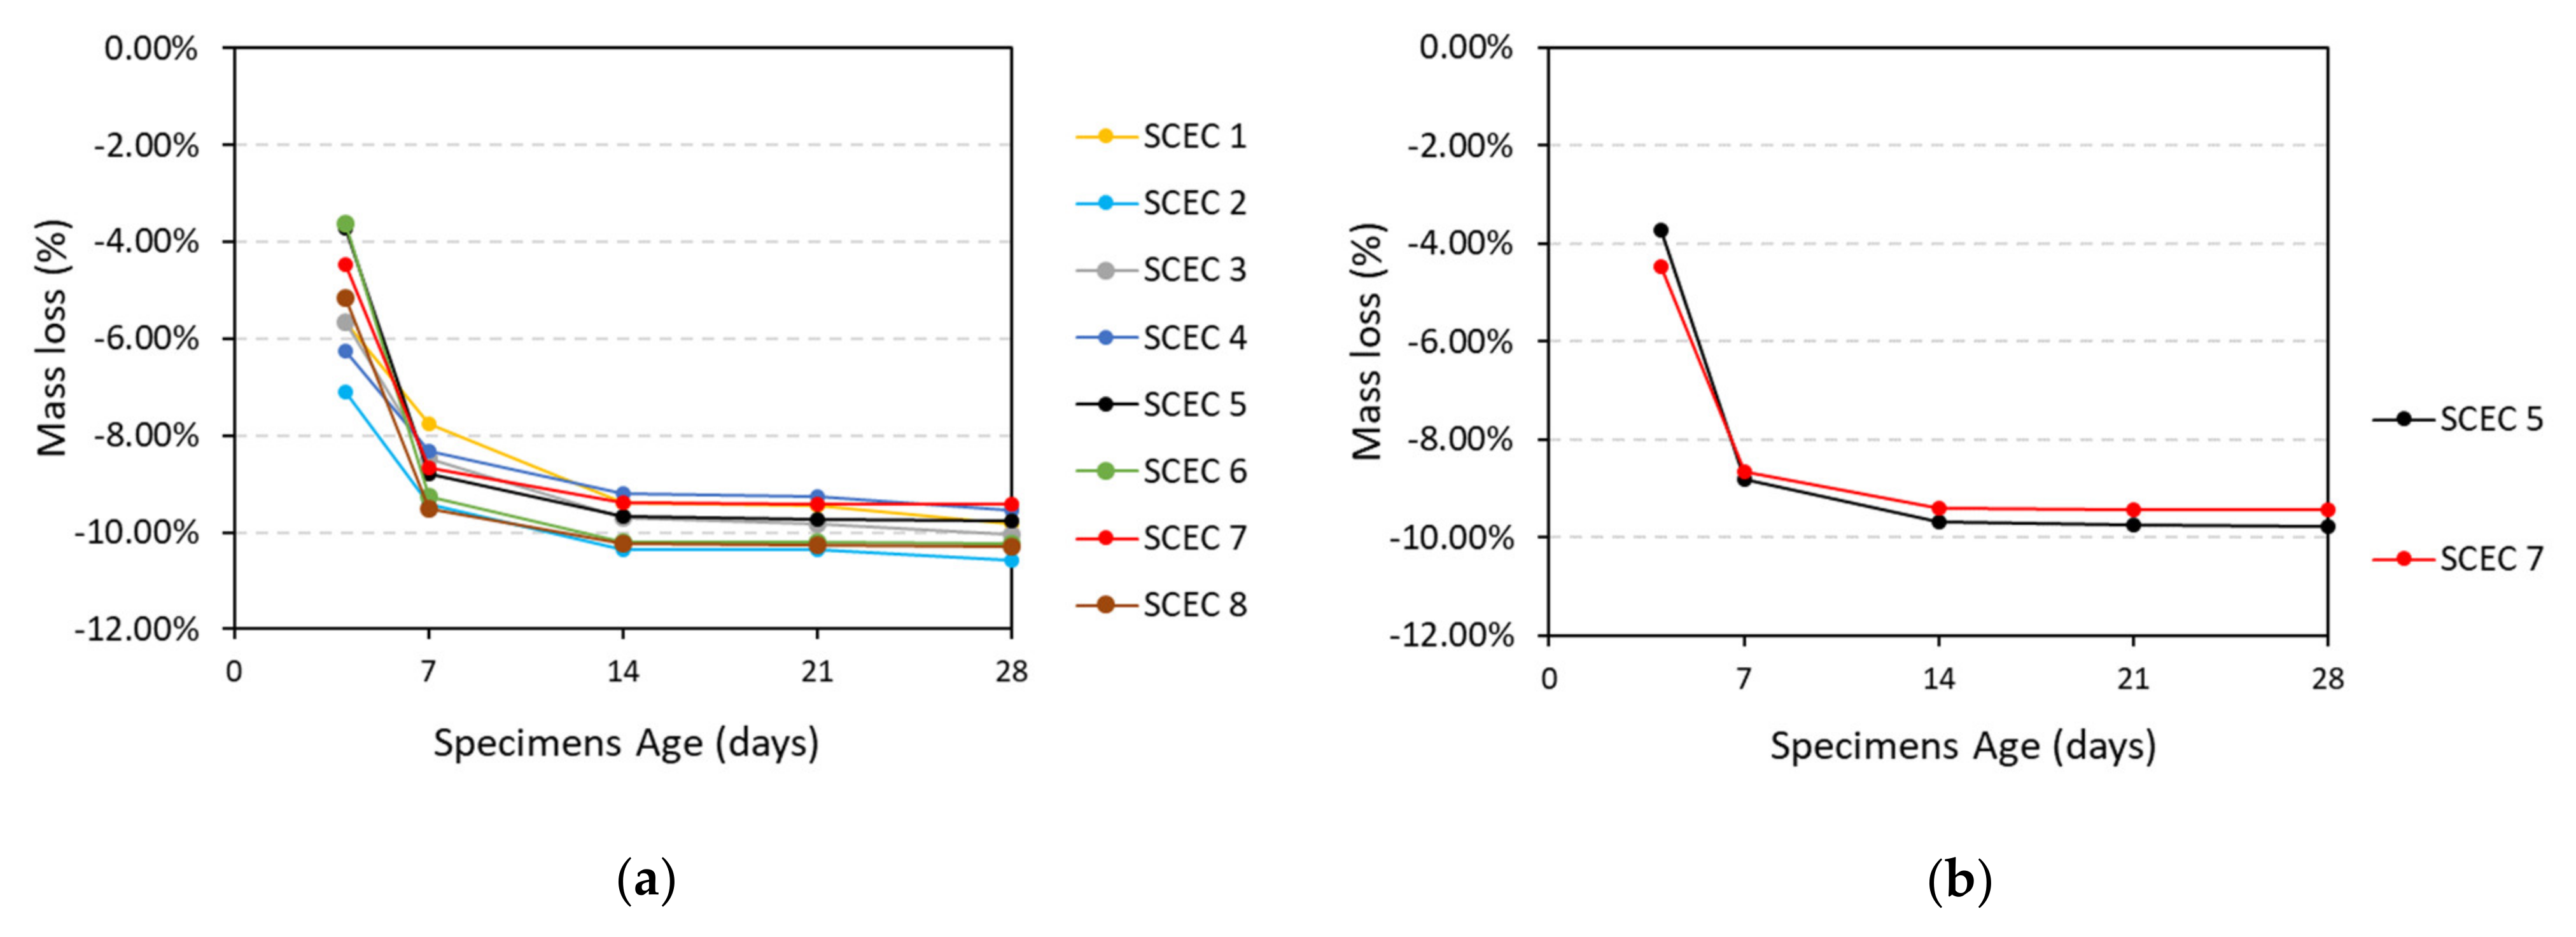
| Mix ID | Dflow (mm) | T-Funnel (s) | Electrical Resistivity (Ωm), 28d | Mass Loss (%),28d | Flexural Strength (MPa), 7d | Flexural Strength (MPa), 28d | Compressive Strength (MPa), 7d | Compressive Strength (MPa), 28d | Shrinkage (%), 56d | Sorptivity (kg/(m2 h0.5)) |
|---|---|---|---|---|---|---|---|---|---|---|
| SCEC 1 | 135 | * | 5255 | −9.83% | 2.38 | 3.06 | 7.33 | 8.83 | ||
| SCEC 2 | 193 | * | 6862 | −10.59% | 2.98 | 3.32 | 8.33 | 9.25 | ||
| SCEC 3 | 200 | 4.0 | 6963 | −10.03% | 2.95 | 3.43 | 8.97 | 10.93 | ||
| SCEC 4 | 195 | 5.7 | 7683 | −9.54% | 2.86 | 3.00 | 8.35 | 10.61 | ||
| SCEC 5 | 265 | 4.3 | 6638 | −9.78% | 3.62 | 4.22 | 12.76 | 13.21 | −0.235 | 2.05 |
| SCEC 6 | 288 | 2.5 | 5571 | −10.22% | 3.44 | 3.74 | 9.59 | 9.86 | ||
| SCEC 7 | 253 | 3.8 | 5997 | −9.42% | 3.37 | 3.56 | 9.48 | 10.28 | −0.238 | 2.16 |
| SCEC 8 | 239 | 4.1 | 7118 | −10.29% | 2.49 | 2.69 | 6.36 | 5.76 |
References
- United Nations. World Population Prospects 2019—Highlights. New York Dep. Econ. Soc. Aff. 2019, 45. [Google Scholar]
- Niroumand, H.; Zain, M.F.M.; Jamil, M. A guideline for assessing of critical parameters on Earth architecture and Earth buildings as a sustainable architecture in various countries. Renew. Sustain. Energy Rev. 2013, 28, 130–165. [Google Scholar] [CrossRef]
- World Green Building Council. Green Building & the Sustainable Development Goals. 2019. Available online: https://www.worldgbc.org/green-building-sustainable-development-goals (accessed on 31 March 2022).
- Maskell, D.; Heath, A.; Walker, P. Laboratory scale testing of extruded earth masonry units. Mater. Des. 2013, 45, 359–364. [Google Scholar] [CrossRef] [Green Version]
- Auroville Earth Institute. Available online: http://www.earth-auroville.com/world_techniques_introduction_en.php (accessed on 31 March 2022).
- Keefe, L. Earth Building: Methods and Materials, Repair and Conservation; Taylor & Francis: Abingdon, UK, 2005. [Google Scholar]
- CRAterre. Available online: http://craterre.org/ (accessed on 21 February 2022).
- Gandreau, D.; Delboy, L. Inventory of Earthen Architecture. 2012. Available online: file:///C:/Users/casa/Downloads/activity-21–20.pdf (accessed on 31 March 2022).
- Damme, H.V.; Houben, H. Earth concrete. Stabilisation revisited. Cem. Concr. Res. 2018, 114, 90–102. [Google Scholar] [CrossRef]
- Sameh, S.H. Promoting earth architecture as a sustainable construction technique in Egypt. J. Clean. Prod. 2014, 65, 362–373. [Google Scholar] [CrossRef]
- Seco, A.; Urmeneta, P.; Prieto, E.; Marcelino, S.; García, B.; Miqueleiz, L. Estimated and real durability of unfired clay bricks: Determining factors and representativeness of the laboratory tests. Constr. Build. Mater. 2017, 131, 600–605. [Google Scholar] [CrossRef] [Green Version]
- Miqueleiz, L.; Ramírez, F.; Seco, A.; Nidzam, R.M.; Kinuthia, J.M.; Tair, A.A.; Garcia, R. The use of stabilised Spanish clay soil for sustainable construction materials. Eng. Geol. 2012, 133, 9–15. [Google Scholar] [CrossRef]
- Shukla, A.; Tiwari, G.N.; Sodha, M.S. Embodied energy analysis of adobe house. Renew. Energy 2009, 34, 755–761. [Google Scholar] [CrossRef]
- Champiré, F.; Fabbri, A.; Morel, J.C.; Wong, H.; McGregor, F. Impact of relative humidity on the mechanical behavior of compacted earth as a building material. Constr. Build. Mater. 2016, 110, 70–78. [Google Scholar] [CrossRef]
- Morel, J.C.; Charef, R.; Hamard, E.; Fabbri, A.; Beckett, C.; Bui, Q.B. Earth as construction material in the circular economy context: Practitioner perspectives on barriers to overcome. Philos. Trans. R. Soc. B 2021, 376, 20200182. [Google Scholar] [CrossRef]
- Fabbri, A.; Morel, J.C.; Aubert, J.E.; Bui, Q.B.; Gallipoli, D.; Reddy, B.V. Testing and Characterisation of Earth-based Building Materials and Elements. Rilem State Art Rep. 2022, 35, 296. [Google Scholar] [CrossRef]
- Fabbri, A.; Morel, J.C.; Aubert, J.E.; Bui, Q.B.; Gallipoli, D.; Ventura, A.; Reddy, V.B.V.; Hamard, E.; Pelé-Peltier, A.; Abhilash, H.N. An overview of the remaining challenges of the RILEM TC 274-TCE, testing and characterisation of earth-based building materials and elements. RILEM Tech. Lett. 2021, 6, 150–157. [Google Scholar] [CrossRef]
- Hall, M.R.; Swaney, W. Modern Earth Buildings: Materials, Engineering, Constructions and Applications; Hall, M., Lindsay, R., Krayenhoff, M., Eds.; Woodhead Publishing Series in Energy; Woodhead Publishing: Sawston, UK, 2012; Volume 23, pp. 650–687. [Google Scholar] [CrossRef]
- Gomaa, M.; Jabi, W.; Soebarto, V.; Xie, Y.M. Digital manufacturing for earth construction: A critical review. J. Clean. Prod. 2022, 338, 130630. [Google Scholar] [CrossRef]
- Ouellet-Plamondon, C.M.; Habert, G. Self-Compacted Clay based Concrete (SCCC): Proof-of-concept. J. Clean. Prod. 2016, 117, 160–168. [Google Scholar] [CrossRef] [Green Version]
- Clausell, J.R.; Quintana-Gallardo, A.; Signes, C.H.; Serrano-Lanzarote, B. Environmental evaluation of a self-compacted clay based concrete with natural superplasticisers. Mater. Struct. Mater. Et Constr. 2021, 54, 1–16. [Google Scholar] [CrossRef]
- Ma, C.; Chen, B.; Chen, L. Variables controlling strength development of self-compacting earth-based construction. Constr. Build. Mater. 2016, 123, 336–345. [Google Scholar] [CrossRef]
- Landrou, G.; Brumaud, C.; Winnefeld, F.; Flatt, R.J.; Habert, G. Lime as an Anti-Plasticizer for Self-Compacting Clay Concrete. Materials 2016, 9, 330. [Google Scholar] [CrossRef] [Green Version]
- Ouellet-Plamondon, C.; Habert, G. Proof of concept of self-compacting clay concrete to scale-up earth construction. In Proceedings of the American Society of Agricultural and Biological Engineers Annual International Meeting 2014 (ASABE 2014), Montreal, QC, Canada, 13–16 July 2014. [Google Scholar] [CrossRef]
- Ma, C.; Chen, L.; Chen, B. Experimental Study of Effect of Fly Ash on Self-Compacting Rammed Earth Construction Stabilized with Cement-Based Composites. J. Mater. Civ. Eng. 2016, 28, 04016022. [Google Scholar] [CrossRef]
- Ardant, D.; Brumaud, C.; Habert, G. Influence of additives on poured earth strength development. Mater. Struct. 2020, 53, 1–17. [Google Scholar] [CrossRef]
- Pellenq, R.J.M.; Damme, H.V. Why Does Concrete Set?: The Nature of Cohesion Forces in Hardened Cement-Based Materials. MRS Bull. 2004, 29, 319–323. [Google Scholar] [CrossRef]
- Michot, L.J.; Villiéras, F. Chapter 2.10—Surface Area and Porosity. Available online: http://www.sciencedirect.com/science/article/pii/B9780080982595000123 (accessed on 31 March 2022).
- Imanzadeh, S.; Hibouche, A.; Jarno, A.; Taibi, S. Formulating and optimising the compressive strength of a raw earth concrete by mixture design. Constr. Build. Mater. 2018, 163, 149–159. [Google Scholar] [CrossRef]
- Barbero-Barrera, M.M.; Jové-Sandoval, F.; Iglesias, S.G. Assessment of the effect of natural hydraulic lime on the stabilisation of compressed earth blocks. Constr. Build. Mater. 2020, 260, 119877. [Google Scholar] [CrossRef]
- Sitton, J.D.; Zeinali, Y.; Heidarian, W.H.; Story, B.A. Effect of mix design on compressed earth block strength. Constr. Build. Mater. 2018, 158, 124–131. [Google Scholar] [CrossRef]
- Keable, J.; Keable, R. Rammed Earth Structures: A Code of Practice; Pratical Action Publishing: Rugby, UK, 2011. [Google Scholar] [CrossRef]
- Ávila, F.; Puertas, E.; Gallego, R. Characterisation of the mechanical and physical properties of unstabilised rammed earth: A review. Constr. Build. Mater. 2021, 270, 121435. [Google Scholar] [CrossRef]
- Matos, A.M.; Maia, L.; Nunes, S.; Milheiro-Oliveira, P. Design of self-compacting high-performance concrete: Study of mortar phase. Constr. Build. Mater. 2018, 167, 617–630. [Google Scholar] [CrossRef]
- Nunes, S.; Matos, A.M.; Duarte, T.; Figueiras, H.; Sousa-Coutinho, J. Mixture design of self-compacting glass mortar. Cem. Concr. Compos. 2013, 43, 1–11. [Google Scholar] [CrossRef]
- EFNARC The European Guidelines for Self-Compacting Concrete—Specification, Production and Use. 2005. Available online: http://www.efca.info/download/european-guidelines-for-self-compacting-concrete-scc/ (accessed on 25 October 2021).
- Polder, R.B. Test methods for on site measurement of resistivity of concrete—A RILEM TC-154 technical recommendation. Constr. Build. Mater. 2001, 15, 125–131. [Google Scholar] [CrossRef]
- Rilem, T.C. RILEM TC 116-PCD: Permeability of concrete as a criterion of its durability. Mater. Struct. 1999, 32, 163–173. [Google Scholar]
- Okamura, H.; Ouchi, M. Self-Compacting Concrete. J. Adv. Concr. Technol. 2003, 1, 5–15. [Google Scholar] [CrossRef]
- Hall, C.; Hall, C. Water sorptivity of mortars and concretes: A review. Mag. Concr. Res. 1989, 41, 51–61. [Google Scholar] [CrossRef]
- Gourav, K.; Ullas, S.N.; Reddy, B.V.V. Studies on properties of Flowable Earth Mix concrete for monolithic load bearing walls. Constr. Build. Mater. 2020, 250, 118876. [Google Scholar] [CrossRef]
- Milani, A.P.S.; Silva, C.I.D. Influence of superplasticiser on cement-stabilised self-compacting earth. Proc. Inst. Civ. Eng. - Ground Improv. 2019, 172, 85–95. [Google Scholar] [CrossRef]
- Xiao, L. Interpretation of Hydration Process of Concrete Based on Electrical Resistivity Measurement. 2007. Available online: http://lbezone.ust.hk/pdfviewer/web/viewer.html?file=aHR0cDovL2xiZXpv-mUudXN0LmhrL29iai8xL28vYjk0MzY5My9iOTQzNjkzLnBkZg== (accessed on 14 June 2017).
- Cao, Z.; Xiang, L.; Peng, E.; Li, K. Experimental Study on Electrical Resistivity of Cement-Stabilized Lead-Contaminated Soils. Adv. Civ. Eng. 2018, 2018, 11. [Google Scholar] [CrossRef]
- Zhang, D.; Cao, Z.; Fan, L.; Liu, S.; Liu, W. Evaluation of the influence of salt concentration on cement stabilised clay by electrical resistivity measurement method. Eng. Geol. 2014, 170, 80–88. [Google Scholar] [CrossRef]
- Bahar, R.; Benazzoug, M.; Kenai, S. Performance of compacted cement-stabilised soil. Cem. Concr. Compos. 2004, 26, 811–820. [Google Scholar] [CrossRef]
- Ramezanianpour, A.A.; Jovein, H.B. Influence of metakaolin as supplementary cementing material on strength and durability of concretes. Constr. Build. Mater. 2012, 30, 470–479. [Google Scholar] [CrossRef]
- Mobasher, B.; Shekarchi, M.; Bonakdar, A.; Bakhshi, M.; Mirdamadi, A. Transport properties in metakaolin blended concrete. Constr. Build. Mater. 2010, 24, 2217–2223. [Google Scholar] [CrossRef]
- Scrivener, K.; Martirena, F.; Bishnoi, S.; Maity, S. Calcined clay limestone cements (LC3). Cem. Concr. Res. 2018, 114, 49–56. [Google Scholar] [CrossRef]
- Matschei, T.; Lothenbach, B.; Glasser, F.P. The role of calcium carbonate in cement hydration. Cem. Concr. Res. 2007, 37, 551–558. [Google Scholar] [CrossRef]
- Cid-Falceto, J.; Mazarrón, F.R.; Cañas, I. Assessment of compressed earth blocks made in Spain: International durability tests. Constr. Build. Mater. 2012, 37, 738–745. [Google Scholar] [CrossRef]
- Ávila, F.; Puertas, E.; Gallego, R. Characterisation of the mechanical and physical properties of stabilised rammed earth: A review. Constr. Build. Mater. 2022, 325, 126693. [Google Scholar] [CrossRef]
- Kariyawasam, K.K.G.K.D.; Jayasinghe, C. Cement stabilised rammed earth as a sustainable construction material. Constr. Build. Mater. 2016, 105, 519–527. [Google Scholar] [CrossRef]
- Woyciechowski, P.; Narloch, P.L.; Cichocki, D. Shrinkage Characteristics of Cement Stabilised Rammed Earth. 2017. Available online: https://com-mendeley-prod-publicsharing-pdfstore.s3.eu-west-1.amazonaws.com/460c-CC-BY (accessed on 29 March 2022).
- Kouta, N.; Saliba, J.; Saiyouri, N. Monitoring of earth concrete damage evolution during drying. Constr. Build. Mater. 2021, 313, 125340. [Google Scholar] [CrossRef]
- Benazzoug, M.; Bahar, R. Effect of the Addition of Chemical Stabilizers on the Characteristics of Clays. In Ground Improvement and Earth Structures. GeoMEast 2017. Sustainable Civil Infrastructures; Bouassida, M., Meguid, M., Eds.; Springer: Cham, Switzerland, 2018; pp. 121–132. [Google Scholar] [CrossRef]
- RILEM TC 230-PSC. Performance-Based Specifications and Control of Concrete Durability State-of-the-Art Report. 2015. Available online: http://www.springer.com/978-94-017-7308-9 (accessed on 16 April 2018).
- Eires, R.; Camões, A.; Jalali, S. Enhancing water resistance of earthen buildings with quicklime and oil. J. Clean. Prod. 2017, 142, 3281–3292. [Google Scholar] [CrossRef]
- Benhaoua, W.; Grine, K.; Kenai, S. Performance of Stabilized Earth with Wheat Straw and Slag. MRS Adv. 2020, 5, 1285–1294. [Google Scholar] [CrossRef]
- Medvey, B.; Dobszay, G. Durability of Stabilized Earthen Constructions: A Review. Geotech. Geol. Eng. 2020, 38, 2403–2425. [Google Scholar] [CrossRef] [Green Version]


| Cement | LF | MTK | ||
|---|---|---|---|---|
| Main oxide composition (%) | SiO2 | 19.80 | 51.70 | |
| CaO | 61.32 | 99.0 | ||
| Fe2O3 | 3.16 | 0.02 | 0.46 | |
| Na2O | 0.15 | |||
| Al2O3 | 5.08 | 43.20 | ||
| MgO | 1.82 | |||
| K2O | 0.58 | |||
| SO3 | 2.90 | |||
| LOI (%) | 2.54 | 0.75 | ||
| Physical properties | Density (kg/m3) | 3110 | 2680 | 2200 |
| Specific surface (m2/kg) | 440 | 550 | 2950 | |
| Initial setting time (min) | 141 | |||
| Final setting time (min) | 201 | |||
| D10 (μm) | 1.40 | 1.12 | 2.02 | |
| D50 (μm) | 10.00 | 4.55 | 7.12 | |
| D90 (μm) | 25.00 | 15.36 | 21.13 | |
| Mechanical properties | Rc,2 (MPa) | 32.2 | ||
| Rc,7 (MPa) | 47.4 | |||
| Rc,28 (MPa) | 60.8 | |||
| Property | Test Standard/Procedure | Curing Regime | Testing Age | Number of Samples for Each Age and Each Mix | Samples Geometry |
|---|---|---|---|---|---|
| Mixture compositions study | |||||
| Slump (Section 2.2.2) | EFNARC | ||||
| T-funnel (Section 2.2.2) | EFNARC | ||||
| Electrical resistivity and mass loss (Section 2.2.3) | Two electrode method | 20 ± 2 °C and HR = 50 ± 5% | 1,2, 7, 14, 21, 28 days | 3 | Prismastic 40 × 40 × 160 mm3 |
| Mechanical strength (Section 2.2.4) | EN 196-1 | 7 and 28 days | 3 | Prismastic 40 × 40 × 160 mm3 | |
| Optimal mixtures additional characterisation | |||||
| Drying shrinkage and mass loss (Section 2.2.5) | ASTM C 596 | 20 ± 2 °C and HR = 50 ± 5% | 4, 7, 14, 21, 28, 56 days | 3 | Prismastic 25 × 25 × 285 mm3 |
| Water absorption by capillarity (Section 2.2.6) | RILEM TC 116-PCD | 20 ± 2 °C and HR = 50 ± 5% during 28 days (+14 days at 40 °C, until constant mass) | 42 days | 4 | Cylindrical h = 75 mm, Ø = 100 mm |
| Mix ID | SCEC 1 | SCEC 2 | SCEC 3 | SCEC 4 | SCEC 5 | SCEC 6 | SCEC 7 | SCEC 8 |
|---|---|---|---|---|---|---|---|---|
| Constituint materials | kg/m3 | |||||||
| Cement | 155.00 | 155.00 | 155.00 | 155.00 | 155.00 | 155.00 | 160.00 | 122.25 |
| MTK | 31.00 | 31.00 | 46.50 | 85.00 | 46.50 | 0.00 | 0.00 | 0.00 |
| LF | 23.25 | 23.25 | 23.25 | 0.00 | 23.25 | 80.00 | 82.50 | 62.00 |
| Soil | 1550.00 | 1550.00 | 1550.00 | 1550.00 | 1550.00 | 1550.00 | 1600.00 | 1630.00 |
| Sp | 8.09 | 10.00 | 12.00 | 14.00 | 16.00 | 16.00 | 16.00 | 16.00 |
| Water | 310.00 | 300.00 | 290.00 | 280.00 | 289.00 | 289.00 | 269.00 | 269.00 |
| Main ratios | ||||||||
| b/soil | 0.135 | 0.135 | 0.145 | 0.155 | 0.145 | 0.152 | 0.152 | 0.113 |
| c/soil | 0.100 | 0.100 | 0.100 | 0.100 | 0.100 | 0.100 | 0.100 | 0.075 |
| sp/fines (%) | 2.047% | 2.530% | 2.921% | 3.286% | 3.895% | 3.800% | 3.682% | 4.212% |
| w/c | 2.000 | 1.935 | 1.871 | 1.806 | 1.865 | 1.865 | 1.681 | 2.200 |
| w/soil | 0.202 | 0.195 | 0.189 | 0.183 | 0.189 | 0.189 | 0.171 | 0.168 |
| Sorptivity (kg/(m2 h0,5)) | Concrete Quality |
|---|---|
| >15 | Very poor |
| 10–15 | Poor |
| 6–10 | Good |
| >6 | Very good |
Publisher’s Note: MDPI stays neutral with regard to jurisdictional claims in published maps and institutional affiliations. |
© 2022 by the authors. Licensee MDPI, Basel, Switzerland. This article is an open access article distributed under the terms and conditions of the Creative Commons Attribution (CC BY) license (https://creativecommons.org/licenses/by/4.0/).
Share and Cite
Matos, A.M.; Varum, H. Self-Compacting Earth-Based Composites: Mixture Design and Multi-Performance Characterisation. Buildings 2022, 12, 612. https://doi.org/10.3390/buildings12050612
Matos AM, Varum H. Self-Compacting Earth-Based Composites: Mixture Design and Multi-Performance Characterisation. Buildings. 2022; 12(5):612. https://doi.org/10.3390/buildings12050612
Chicago/Turabian StyleMatos, Ana Mafalda, and Humberto Varum. 2022. "Self-Compacting Earth-Based Composites: Mixture Design and Multi-Performance Characterisation" Buildings 12, no. 5: 612. https://doi.org/10.3390/buildings12050612
APA StyleMatos, A. M., & Varum, H. (2022). Self-Compacting Earth-Based Composites: Mixture Design and Multi-Performance Characterisation. Buildings, 12(5), 612. https://doi.org/10.3390/buildings12050612