Article

Effects of Bottom-Overhead Design Variables on Pedestrian-Level Thermal Comfort during Summertime in Different High-Rise Residential Buildings: A Case Study in Chongqing, China

1
School of Architecture and Urban Planning, Chongqing University, Chongqing 400030, China
2
General Research Institute of Architecture & Planning Design Co., Ltd., Chongqing University, Chongqing 400045, China
*
Author to whom correspondence should be addressed.
Buildings 2022, 12(3), 265; https://doi.org/10.3390/buildings12030265
Submission received: 24 January 2022 / Revised: 15 February 2022 / Accepted: 18 February 2022 / Published: 24 February 2022
(This article belongs to the Topic Climate Change and Environmental Sustainability)

Abstract

:
The design of bottom-overhead (or lift-up) buildings is advantageous in improving the thermal environment of high-density cities and enhancing the comfort level of occupants’ activity space on the ground floor. This study aims to investigate the impact of multiple architectural design variables on the ground floor overhead area of slab-like and tower high-rise residential buildings from the perspective of pedestrian-level thermal comfort with ENVI-met simulations and Standard Effective Temperature (SET*) evaluation. The design variables of the 25 tested models include the number of continuously arranged buildings, aspect ratio, overhead form, overhead space height, positions of overhead space enclosures, and openness degree, derived from existing overhead buildings in Chongqing. The results demonstrate that when the number of continuously arranged buildings and the aspect ratio increase, the overhead area has a more comfortable environmental state, while the overhead height is negatively correlated. In addition, when the enclosures are on opposite sides and their openness degree is 0.75–0.5, the area tends to be more comfortable. For slab-like buildings, the thermal comfort of the partial-overhead form is the worst while the semi-overhead form is relatively better. However, the overhead form has no significant impact on the thermal comfort of tower buildings. These findings can provide some suggestions and inspiration for the design of overhead buildings to create a more sustainable and livable microenvironment.

1. Introduction

High-density compact cities have well-connected transportation networks and facilitate social interactions, continuously looking to improve economic vibrancy and development vitality [1]. However, the dense, congested arrangement of high-rise buildings also seriously affects the urban climate: the “wall resistance effect” abates the penetration of natural wind into the city [2,3,4], which directly causes the formation of weak wind circulation near the ground of urban high-rise residential areas with poor ventilation and the exacerbation of the pedestrian-level wind thermal comfort [5,6,7]. Under the background of emphasizing low-carbon development and reaching the peak of carbon emissions, alleviating the Urban Heat Island (UHI) effect plays an essential role in energy conservation and emission reduction countermeasures.
Many studies have indicated that the overhead ground floor of buildings can introduce fresh air [8,9,10,11,12,13,14], promote air circulation, and speed up the removal of moisture and heat, thereby ameliorating the thermal environment [15,16,17,18,19,20]. It is beneficial to use an architectural design method to alleviate the UHI effect and enhance pedestrian-level comfort around the building. In the bottom-overhead design, some walls or windows are removed from the ground floor of a single building or building group to keep a certain distance between the main functional area and the ground [8], whose space presents a comparatively penetrating state. Most of the overhead buildings’ main structures are elevated from the ground by columns, shear walls, or a central core, either individually or a combination of all three [11]. As a mountain city with low wind velocity and a lack of wind resources [21], it has been proven that Chongqing has suitable terrain and climate adaptability in long-term practice. However, considering global warming, an average rising trend of 0.10 °C/decade was found for the annual mean temperature in Chongqing [21], which is much higher than the global rising trend of 0.074 °C/decade, indicating a higher degree of urban warming in Chongqing. Correspondingly, the overall level of the outdoor thermal environment in summer in Chongqing is steadily decreasing. Even if the overhead design is adopted, the space underneath a building may not maintain a comfortable atmosphere. Therefore, a more exemplary identification of the influence factors of the overhead floor environment is necessary for inspiring more appropriate designs.
Owing to its architectural characteristics and functions, the overhead design has been widely applied in southern China and subtropical south-eastern Asia. Some scholars have studied the impact on the microclimate environment of the overhead floor in the aspect of the design variables of buildings. For example, Chalermwat et al. [22] selected the typical traditional folk house forms with an overhead floor and studied the building arrangement direction and density effects on the wind field. In recent years, inspired by the adoption of overhead buildings in mainland China, many scholars and teams have started to promote and study the use of overhead buildings. Du et al. [13] quantitatively analyzed the differences in the comfort of buildings in terms of wind environment with four shapes of “—", “□”, “L” and “U”, and with and without the lift-up design using the CFD simulation technique. Zhang et al. [23,24] conducted wind tunnel tests on 28 overhead building models by changing the size and shape of the center core and found that the height of the core is the most influential factor. Additionally, Chew and Norford [9] also recommend modifying the corners of a central core to enlarge the area where there are acceptable wind conditions for pedestrians. After this, Du et al. [25] revealed that the number of center cores is another important parameter, perhaps only second to the center core aspect ratio. Chen and Mak [26] evaluated pedestrian-level wind (PLW) comfort around isolated overhead buildings with 22 unconventional configurations (including polygonal, slab-like, cruciform, trident, and assembled models). Some studies have comprehensively used thermal comfort evaluation indicators. Xia et al. [11] investigated pedestrian-level wind flow and thermal comfort of the overhead design in three different types of buildings with wind tunnel tests. A.U. Weerasuriya et al. [27] defined the wind velocity comfort standard and Universal Thermal Climate Index (UTCI) equivalent temperature comfort range to evaluate the optimum lift-up designs obtained by the optimization algorithm. Furthermore, the Mean Wind Velocity Ratio (MVR) and PET were also chosen by Chen [14] and Du et al. [28]. Chen evaluated the comprehensive impact of building height and upstream buildings on pedestrian comfort around overhead buildings. Du et al. developed a multi-stage optimization method to determine the optimum wind environment and thermal comfort around buildings with a lift-up design in an ideal urban canyon.
The studies mentioned above involved various influential factors and provided profound findings and insightful research directions related to overhead buildings. However, most of them only utilized wind parameters to evaluate environmental quality. Certain studies [18,27,28,29,30,31,32,33,34,35] indicated that the outdoor thermal environment is relatively complex and needs comprehensive evaluation indexes to be assessed quantitatively rather than individual meteorological parameters. Additionally, most studies adopted traditional and ideal rectangular or square-plan building models with a single overhead form whose variables only included building dimensions and core size. The resulting optimized building model may not suit actual construction and use. This study thereby aims to fill this research gap. After sufficiently investigating the current situation of the ground floor overhead space of high-rise residential buildings in Chongqing, this paper summarizes the crucial design variables of overhead buildings: building configuration, number of buildings continuously arranged, aspect ratio, overhead form, overhead space height, overhead space enclosure position, and openness degree. Then, two representative configurations of high-rise residential buildings in Chongqing with different design variables are selected and modified as test models. ENVI-met simulations are utilized to reproduce the thermal environment in the overhead area as this software has been widely used for microclimate measurement, urban open space (such as blocks, courtyards, and green infrastructure) analysis, heat island, and thermal comfort in previous studies [36,37,38,39]. Its accuracy is first calibrated by comparing the on-site measurement data. The modified Standard Effective Temperature (SET*) is selected to evaluate pedestrian thermal comfort, whose numerical range of comfort identification of the simulation results is delimited in combination with the questionnaire survey results of the Thermal Sensation Vote (TSV) of local occupants.
The rest of this manuscript is organized as follows: Section 2 describes the methodology used in this study, including on-site measurement, ENVI-met software and its calibration, comfort evaluation methods, and a detailed description of the building models with different design variables. Then, Section 3 explains the simulation and thermal comfort evaluation results. Quantitative analysis and discussion are conducted to examine the effect of design variables on the thermal comfort of overhead buildings. Several limitations of this study and future work are discussed in Section 4. Finally, Section 5 concludes the study.

2. Methodology

2.1. Methodological Framework

The methodological framework of this study is shown in Figure 1. Firstly, we conducted field investigations to characterize the design variables of the overhead floors of existing high-rise residential buildings, simultaneously measured their thermal environment, and questioned the thermal sensation of space users and activists. Then, building models were constructed and parameterized by using ENVI-met. The observed air temperature (Ta) and relative humidity (RH) were compared with the results predicted by ENVI-met to calibrate the simulation performance. Furthermore, the calculated SET* value and survey results of TSV from the crowd are linearly fitted to obtain a thermal comfort zone. Additionally, 25 building models with different design variables are established and simulated, respectively, to predict the impact of each variable on the thermal environment and thermal comfort of the overhead area. The assorted simulated results are compared to acquire rules and conclusions.

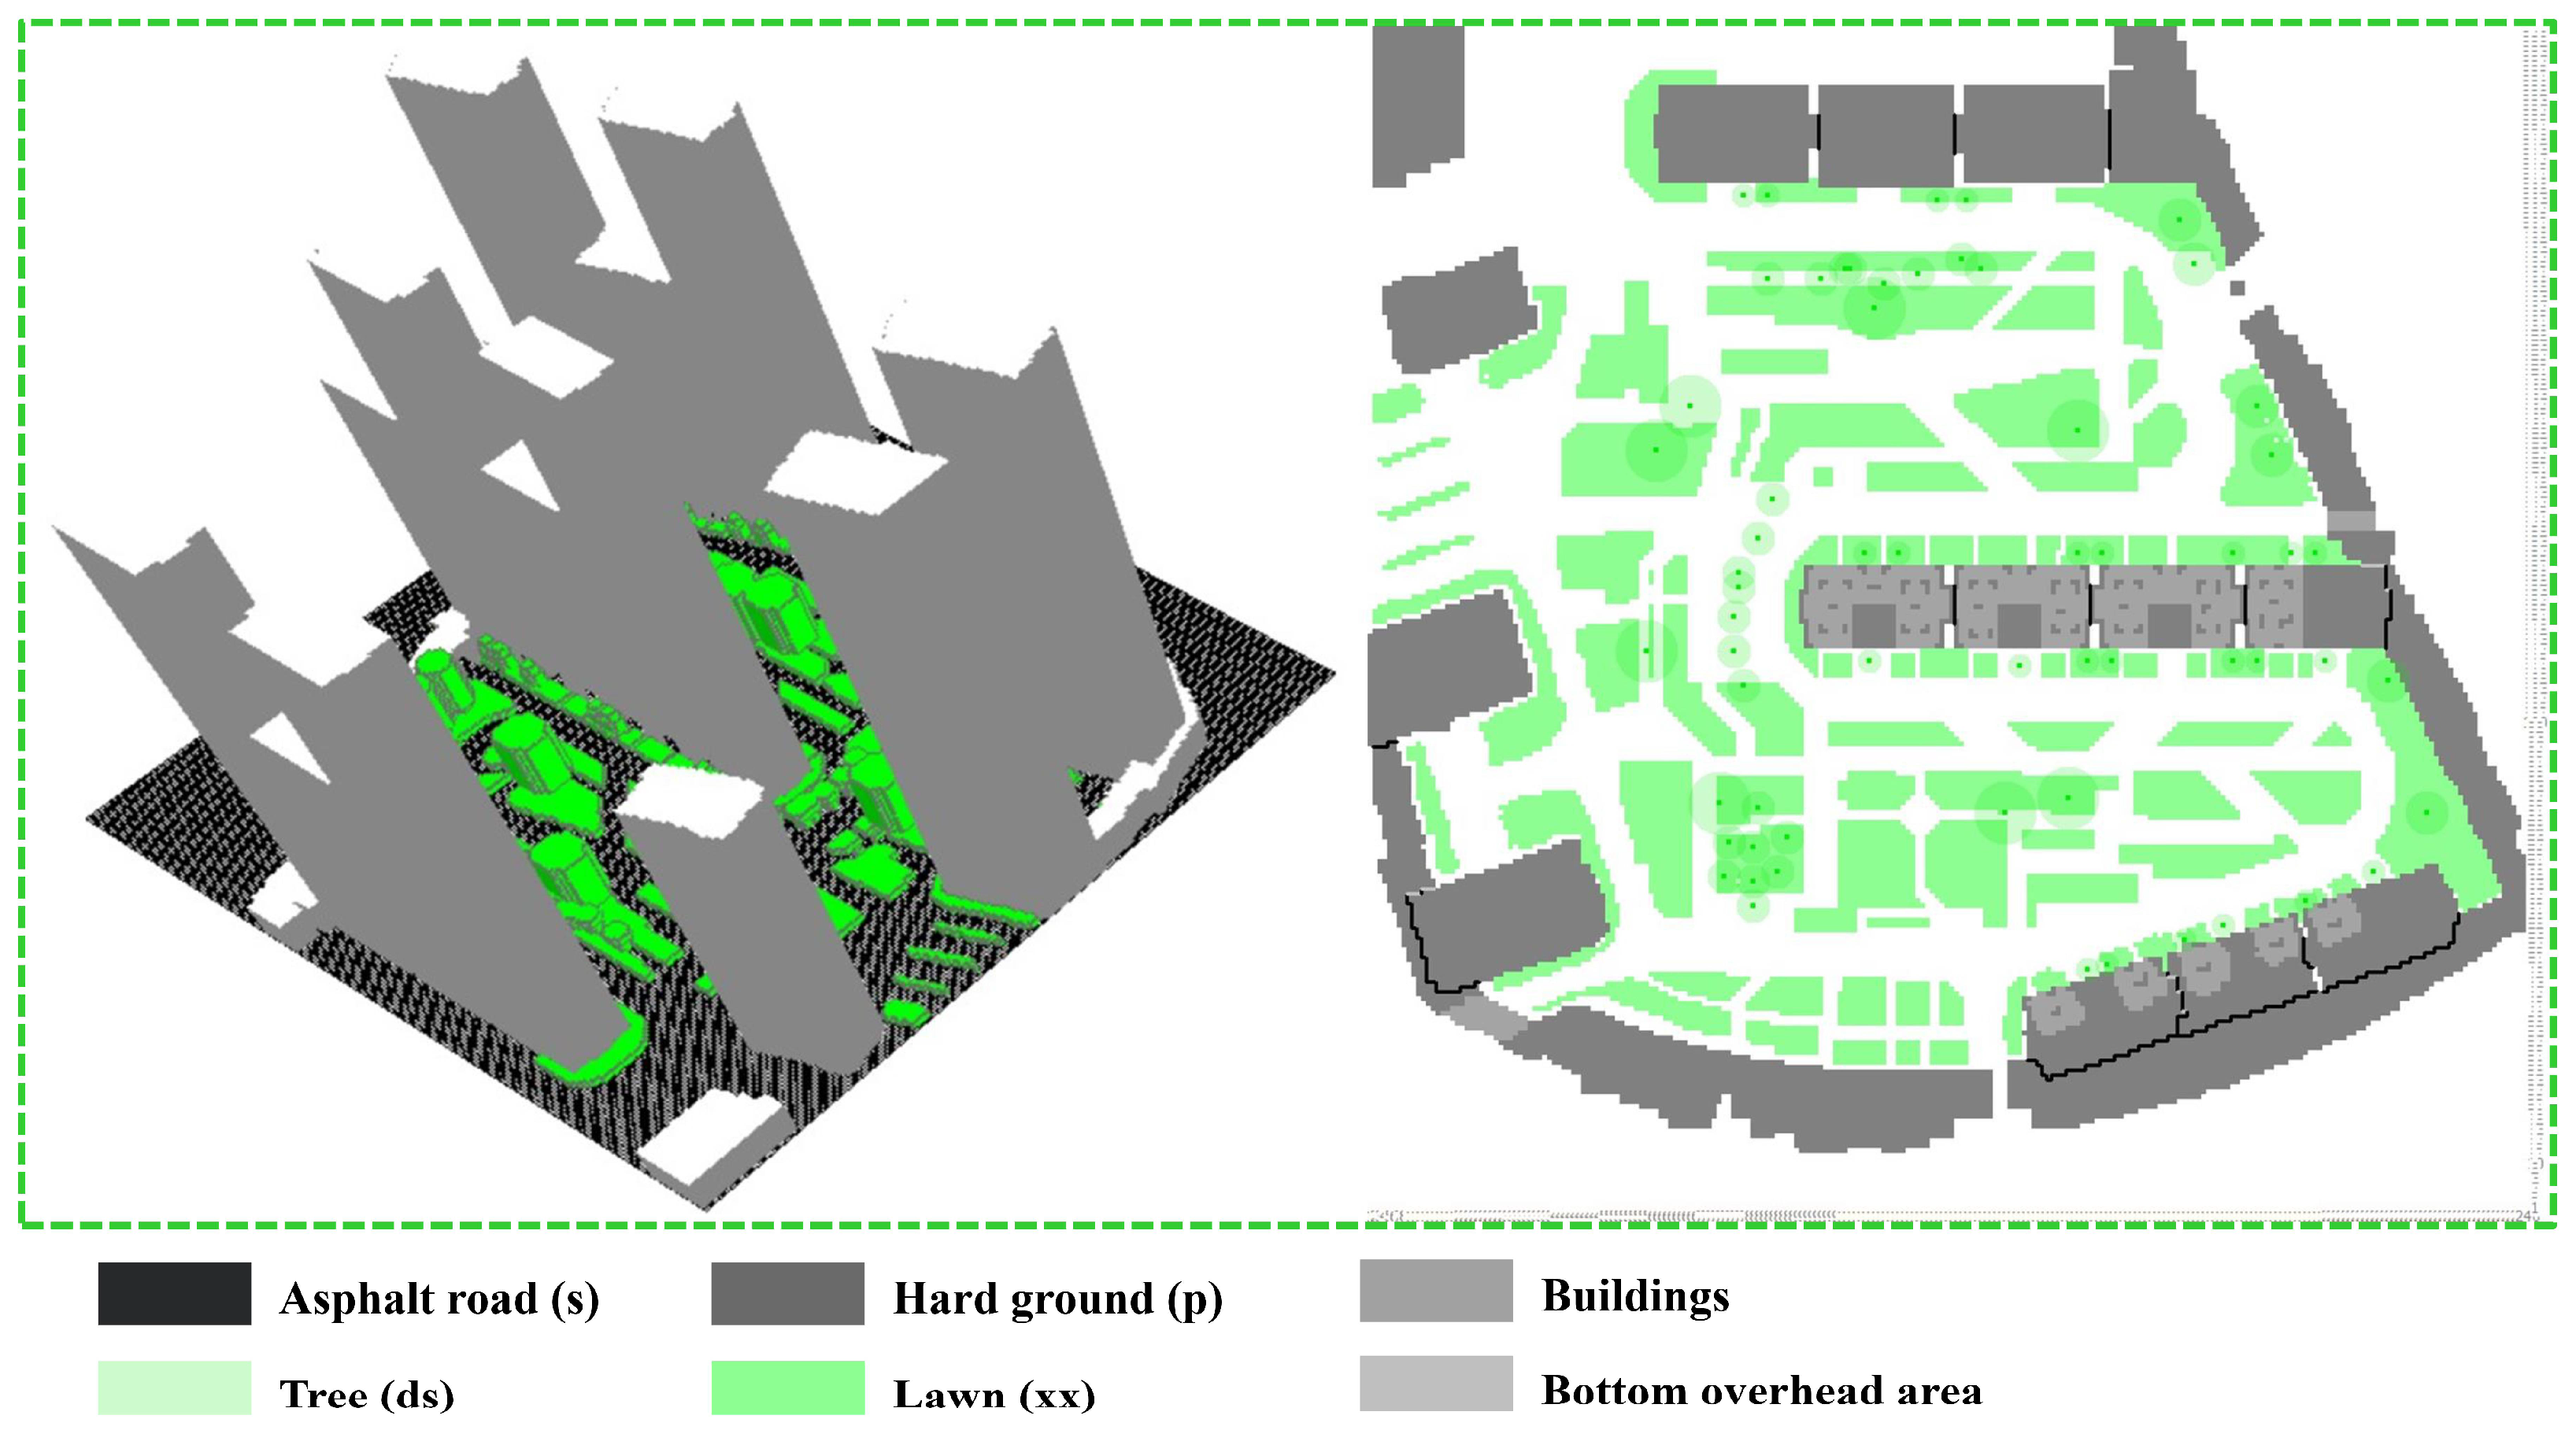
2.2. On-Site Measurement

According to the investigation results of the existing high-rise overhead residential buildings in Chongqing, China, the overhead buildings are concentrated mainly in the high-density downtown areas. Yubei District is recognized as the core living area of Chongqing with generally more recently built high-rise buildings, with an abundance of the overhead form and overall design. Therefore, this survey and measurement study in this section was conducted in Zhongyu I-City (29.6° N, 106.54° E), No. 333, Donghu South Road; Gongyuan Zhishang (29.59° N, 106.55° E), No.99, Wenhui Road and Shangyu Street Park Alley (29.59° N, 106.55° E), No.1, Shangyu Street, Yubei District, central Chongqing, China, as shown in Figure 2. Considering that the annual maximum temperature is mainly in August in Chongqing [40], during which the students are spending their summer vacation at home and residents are more willing to gather in the overhead space, the measurements were conducted on seven sunny days from 5 August to 12 August 2021. Micro-meteorological stations equipped with Louver radiation shields [41] were used to measure air temperature and relative humidity at the pedestrian level (i.e., 1.5 m above the ground) with accuracy values of ±0.2 °C and ±2.5%, respectively. The fixed stations were set up within the overhead space and their locations are shown in Figure 2. The Ta and RH were automatically recorded with an interval of 30 min. After extracting the data from the data logger, the average for each quarter was calculated. Wind velocity was tested by mobile transverse measurement using handheld anemometers with an accuracy of ±0.1 m/s. Surveyors were required to change their positions in the overhead area every 30 min while keeping the anemometers at the same level.

2.3. ENVI-Met Simulation

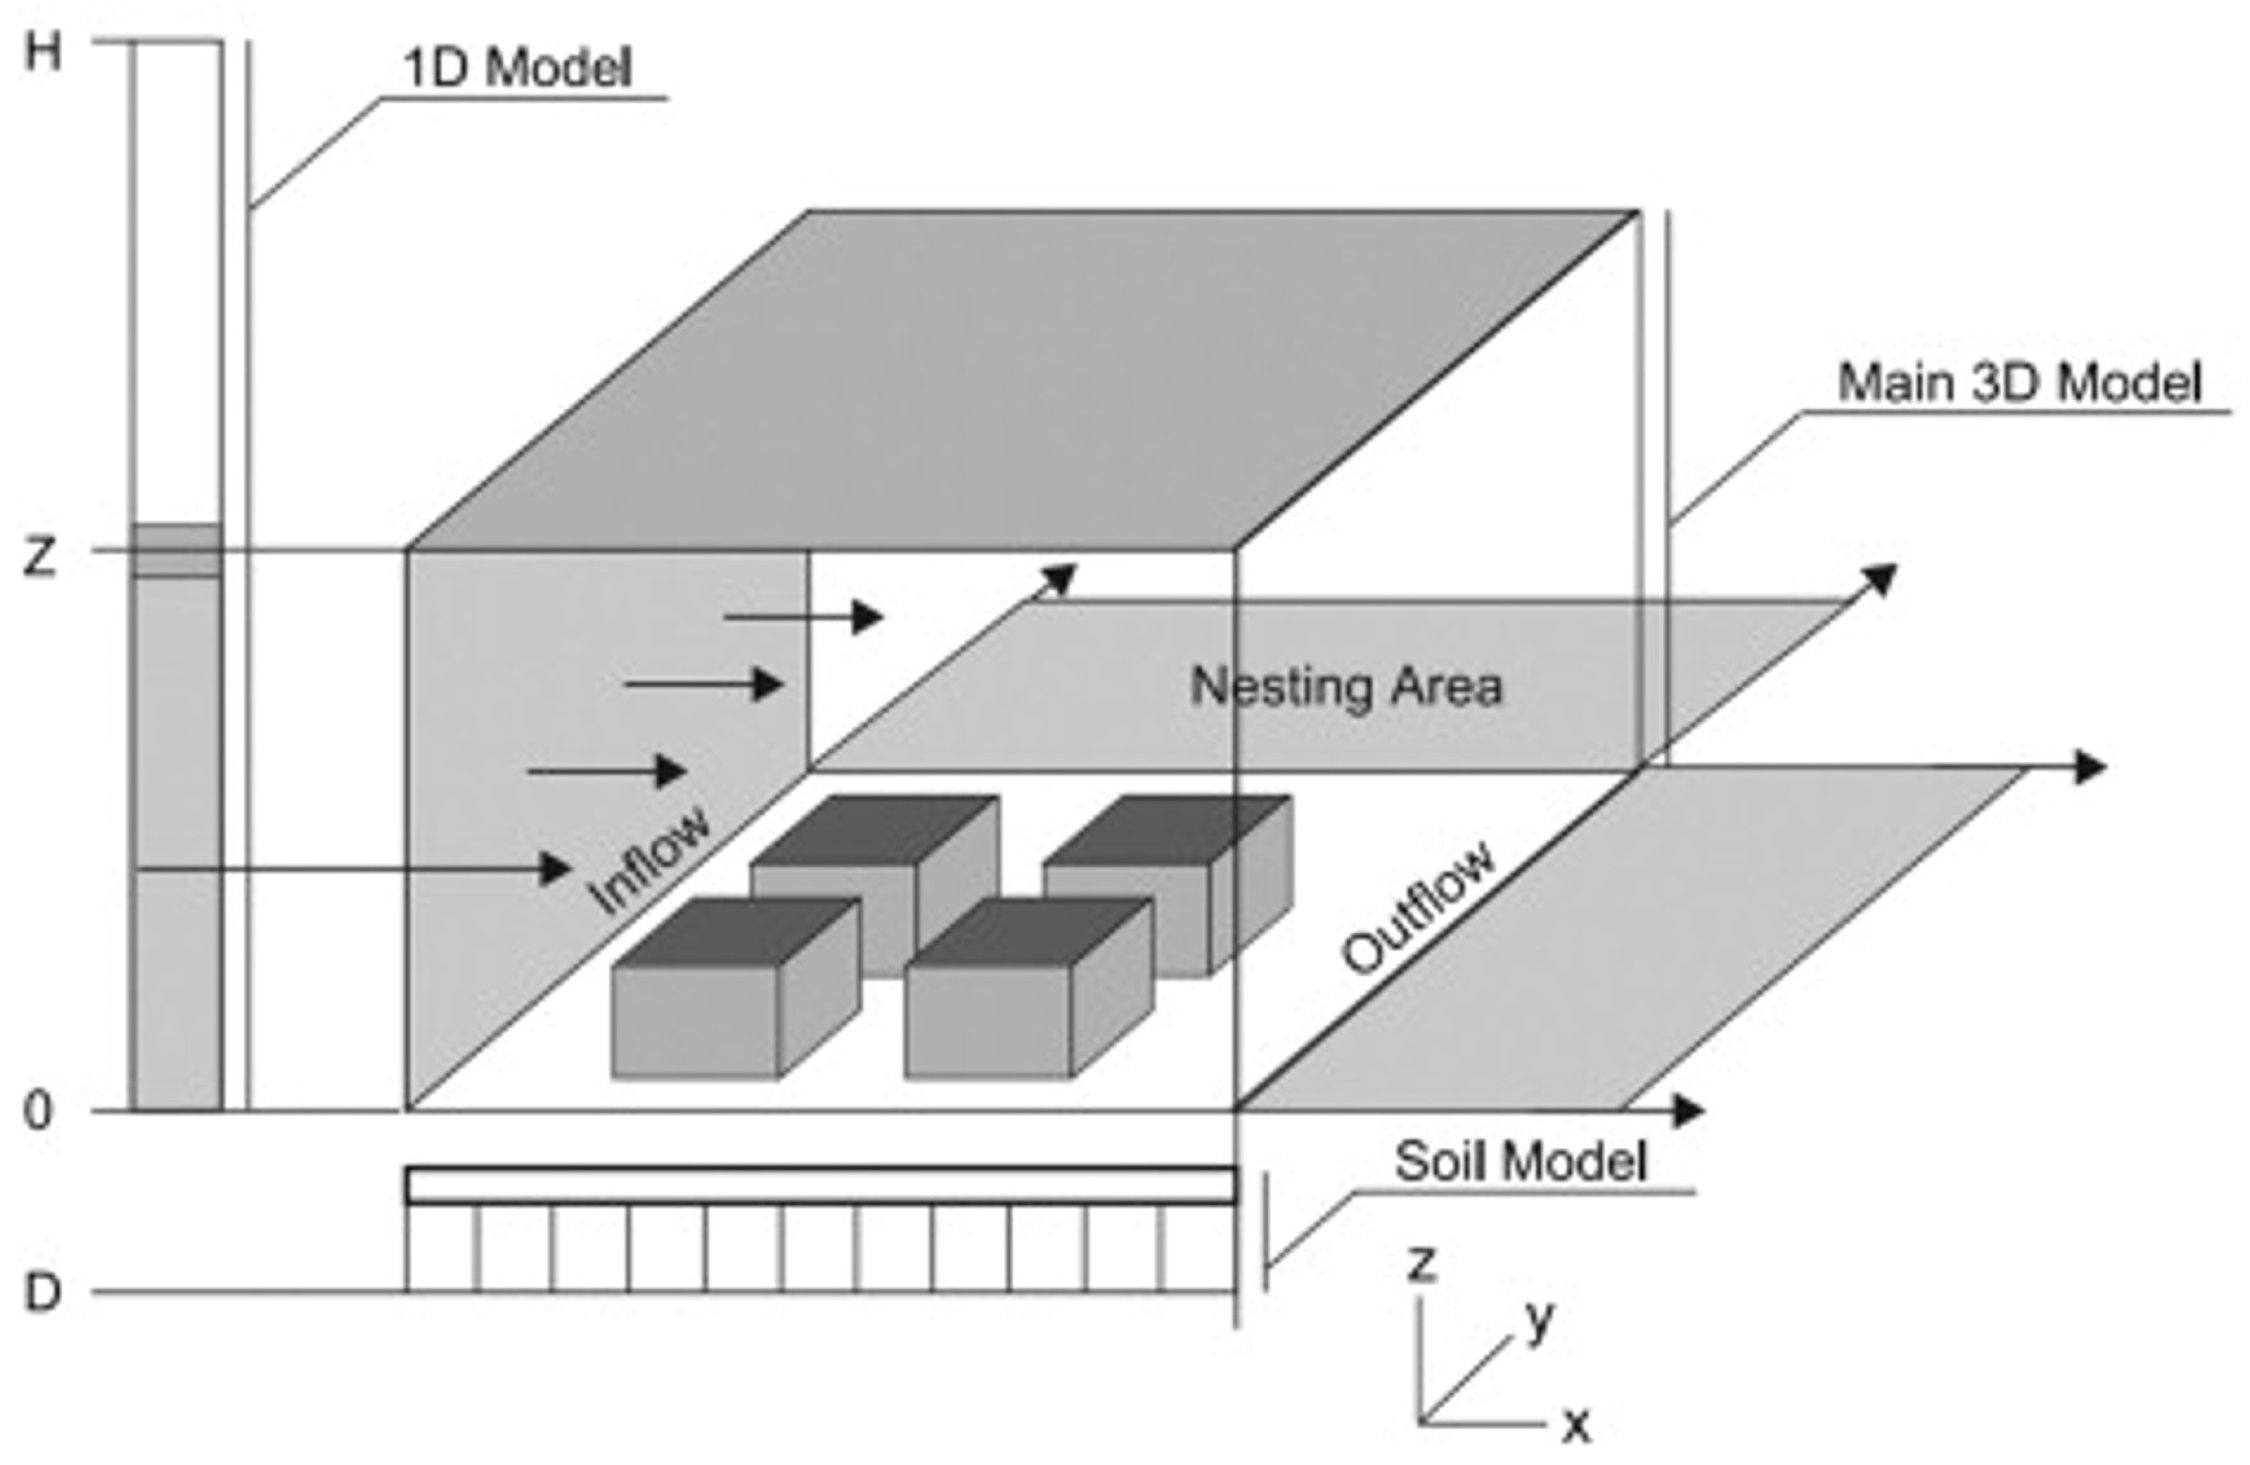
2.3.1. Details of ENVI-Met Model

ENVI-met is a three-dimensional microclimate continuous numerical simulation software used to calculate the urban environment model [42]. It can be updated dynamically according to the thermal conditions and the driving forces of wind and solar radiation with a fast calculation velocity [43,44]. Figure 3 shows a schematic diagram of the ENVI-met model layout. It comprises a three-dimensional main model, one-dimensional boundary model, soil model, and nested grid. The 1D model establishes a connection between the boundary conditions of the 3D model and the atmospheric boundary conditions up to 2500 m in the vertical direction [45] to realize the continuation and transformation between both boundary conditions and increase the simulation accuracy.
The core of the model is to calculate the impact of the underlying urban surface on the regional climate environment by simulating the thermal stress relationship between the building’s external surface, vegetation, and the atmosphere. The basic equations from the physical model are related to (a) mean airflow, (b) temperature and humidity, (c) turbulence and exchange processes, and (d) radiative fluxes [45,46]. The complete model system includes additional models such as biometeorological or particle dispersion models. Taleghani et al. [45] described the mean airflow as an example to illustrate the basic concept of three-dimensional turbulent flow given by the non-hydrostatic incompressible Navier–Stokes equations in the Boussinesq-approximated form. In addition, Bruse and Fleer [42] also widely explained the calculations of temperature, humidity, turbulence, exchange processes, and vegetation resistance. These calculation models and equations constitute the basis of the simulations of this study.

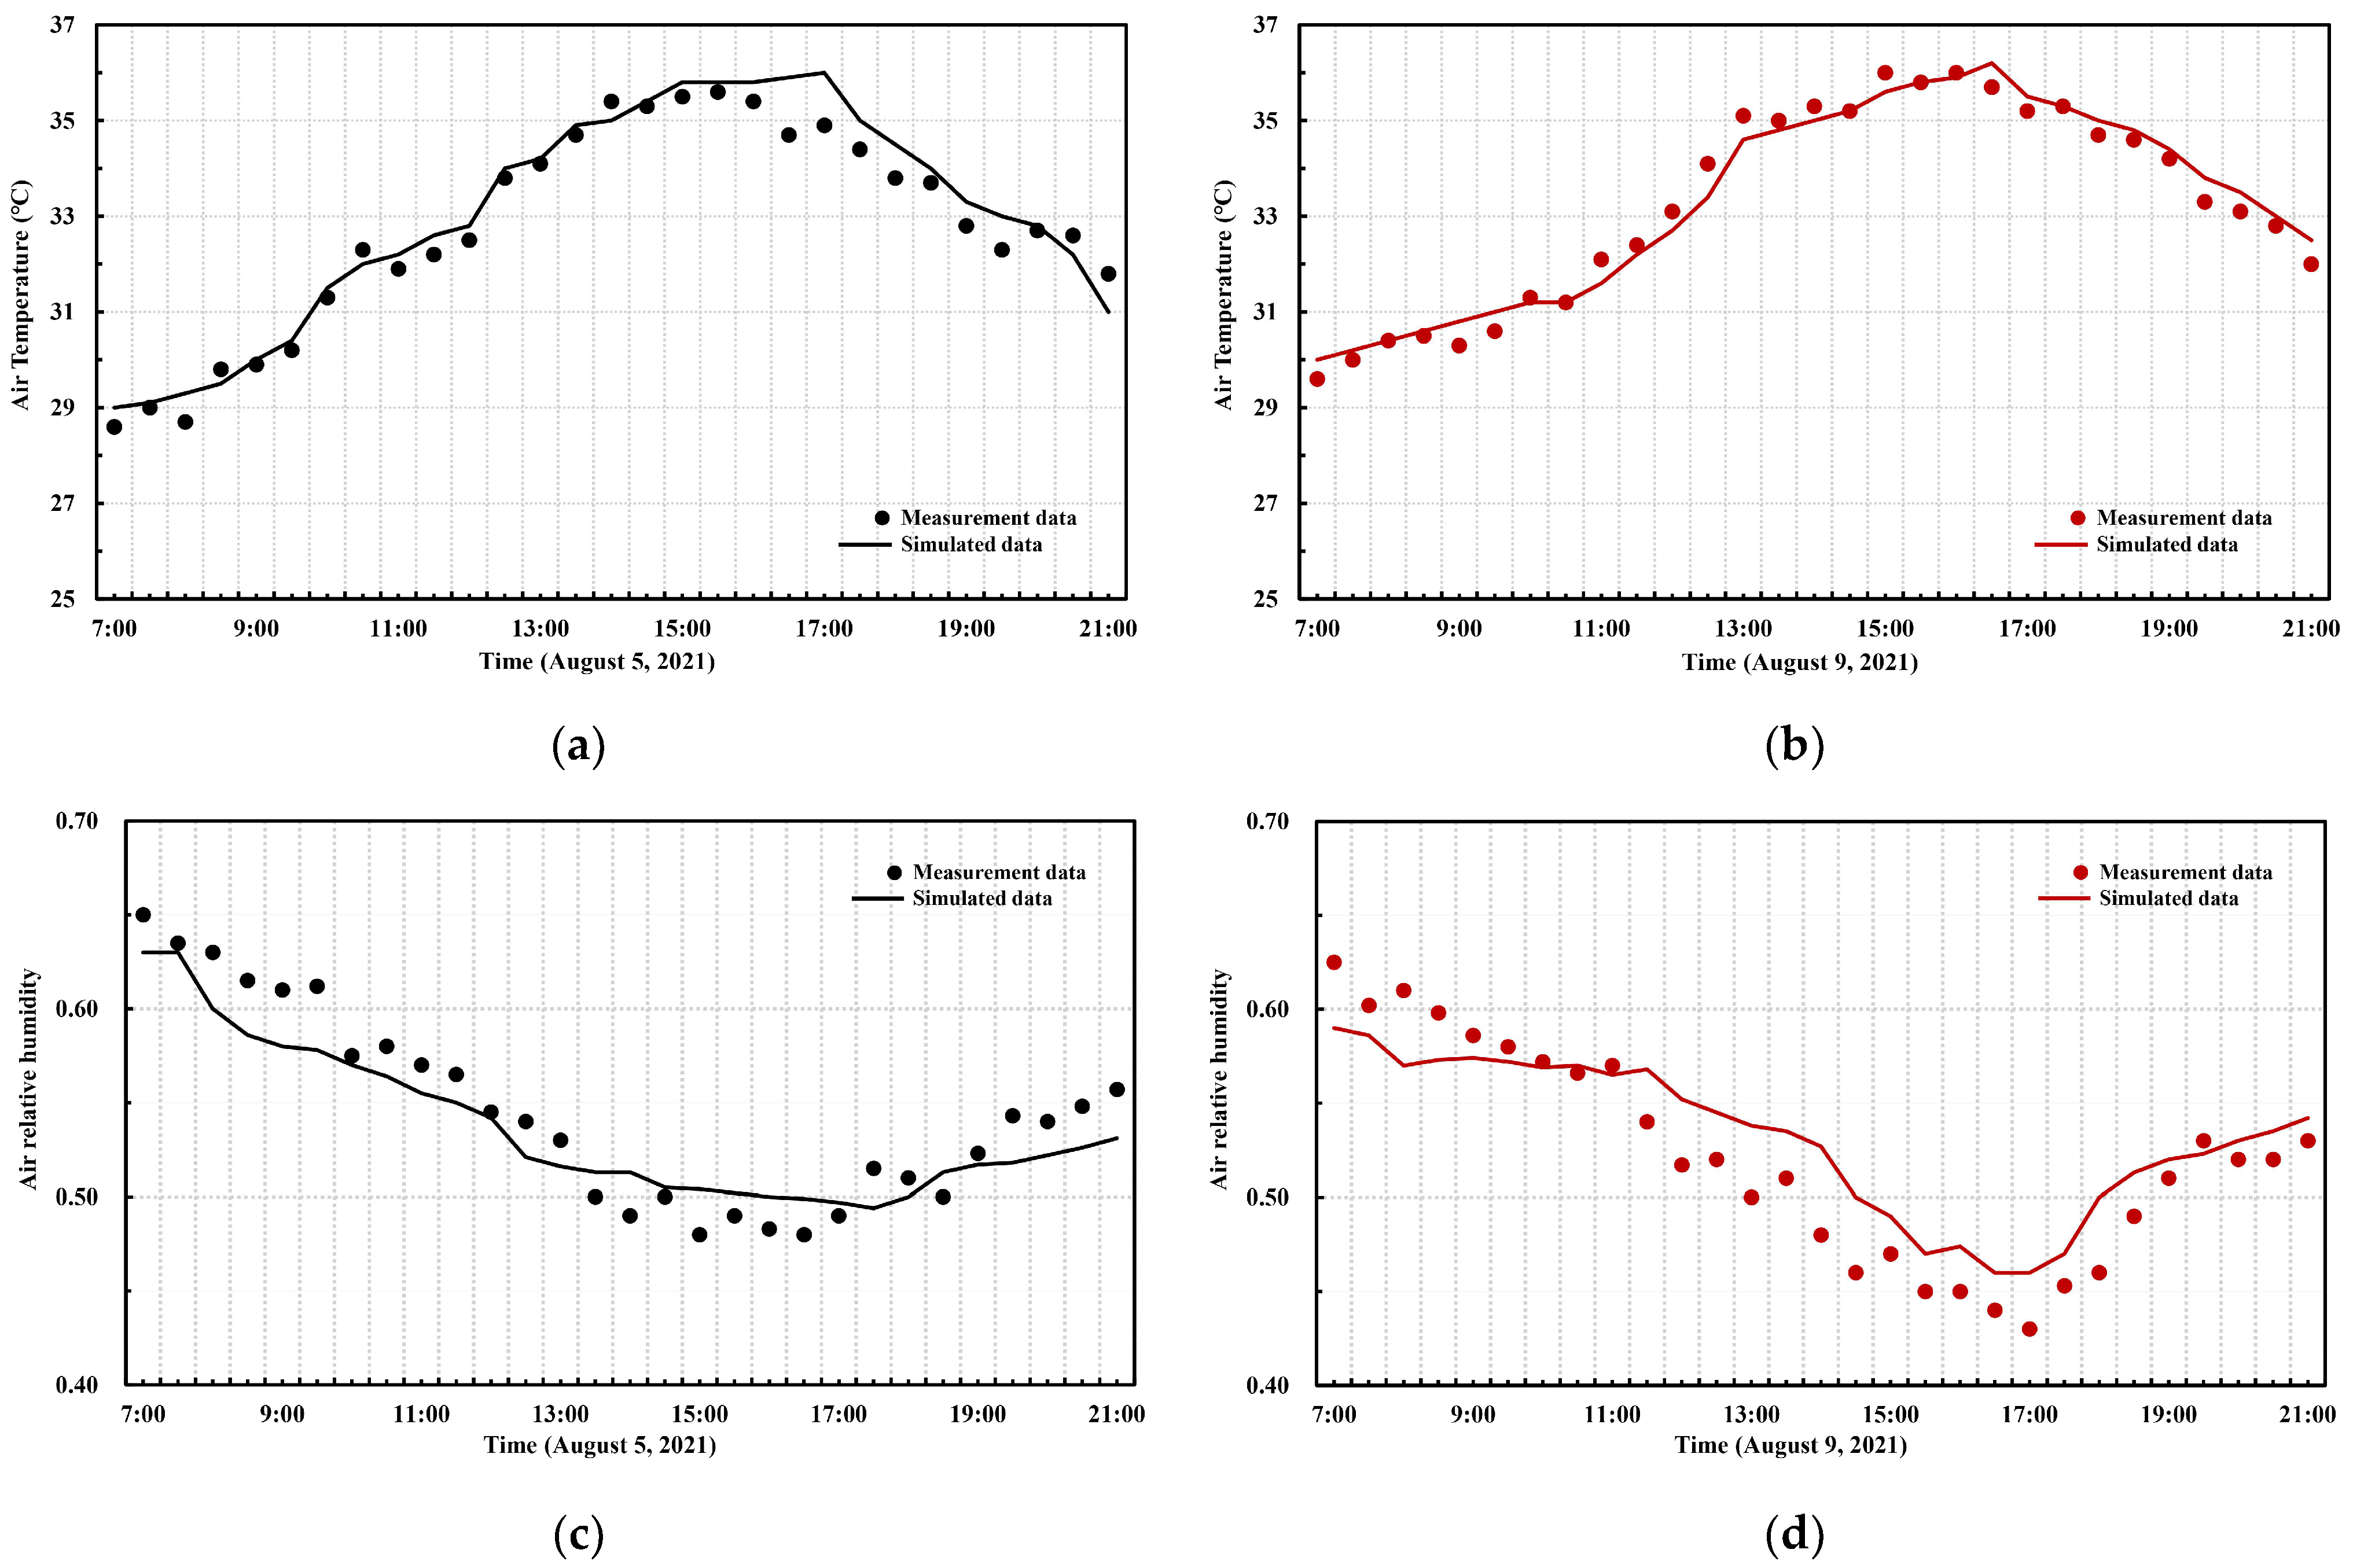
2.3.2. Calibration of ENVI-Met

In this step, the accuracy and stability of ENVI-met 4.4 models (the three residential quarters were used as samples) were calibrated through a comparison between field measurements and simulation results. The three-dimensional geometric information, building size, and soil database were derived from engineering construction drawings and field measurements. To overcome the influence of the initialization (6 h) and to reduce the computation time, the simulations were started on two typical sunny, hot, and windless summer days, 5 and 9 August 2021, at 00:00 am for a continuous 24 h period. The following is a detailed description of the simulation and calibration study of Zhongyu I-city, Chongqing, as an example.
The simulation position is at the pedestrian height of 1.5 m. In order to ensure the boundary conditions of the simulation target area accurately reflect the real situation, the calculation domain was expanded by an area of 57,600 m2 (240 m × 240 m) and was modeled up to a vertical height of 180 m. The model grid resolution was set as 1 × 1 × 6, which meant the building models were established in the grid space of 240 × 240 × 30. The vertical grids were performed with an equidistant division of 5 layers, and then the lowest layer was divided into six layers with each layer being 1 m. Additionally, to minimize boundary effects, five nested grids were added to move the horizontal boundary away from the study area to ensure the stability of the simulation [47].
On the basis of the definitions of different types of plants and underlying surfaces coming with ENVI-met preloaded database, lawn (xx) and tree (ds) were selected as vegetation and asphalt road (s), hardstand (p), and soil (l) were selected as the underlying surface in the tested model (Figure 4). The meteorological data from the field measurements and nearby weather stations were derived to initialize the simulation and force hourly temperature and humidity distribution. Forced lateral boundary conditions were used to initialize the mode [47]. The albedo and thermal conductance of the building envelope and other relevant initial parameter values are shown in Table 1.
The measured and simulated air temperature and relative humidity during 7:00 am–21:00 pm, on 5th and 9th of August are compared in Figure 5 (respectively (a), (b), (c), and (d)). In the comparison of air temperature, it is found that the simulated air temperature on the 9th is basically consistent with the measured situation. The peak of simulated air temperature is 0.3 °C higher than the peak of according to the measurement while on the different occurrence time. Besides, there are some deviations between the 5th-day simulation and measured data, of which the maximum deviation is 1.2 °C. As shown in Figure 4c,d, the comparison of relative humidity depicts that the trend of simulated data is roughly in accordance with the measured situation with maximum deviations of 4% and 5% for each day. However, the simulated value is slightly larger than the measured ones as a whole between 15:00 pm and 17:00 pm. The reasons for the disagreement between the results could be the fact that ENVI-met does not include sky situation and cloudiness in its input parameters and the actual environment also contains the heat and moisture dissipation of human bodies, equipment, waters, and greenness. In addition, the simulation building properties were set up with the same thermal conductivity and emissivity, which was different from the actual situation and led to certain deviations.
ENVI-met has been previously validated in different climates and countries such as China [48,49], Japan [50], Singapore [51], Germany [42], the Netherlands [45], USA [52] and UAE [53]. Tsoka [54] summarized 189 studies and concluded that the model maintained high accuracy and reliability in different regions worldwide. Taleghani et al. [45] also found that larger calculation domains would cause smaller simulation errors in the boundary sensitivity check process. The mean error between simulations and measurement data was tested using the statistical method Coefficient of Variance in Root mean Square Error (CVRMSE) and was found to be under acceptable limits, i.e., below 10% [37]. Therefore, to sum up, the rest of the simulations in this research have the same reliability with regard to using ENVI-met as the research tool.

2.4. Output Parameters and Thermal Comfort Criterion

On the one hand, the quality of the thermal environment and comfort cannot be evaluated by single climate parameter indicators; on the other hand, due to its diverse forms, configurations, sizes, and occupants’ activities that are bound to affect the distribution of solar radiation and wind field, the overhead space could have various microclimate conditions. The main evaluation mechanism indices of thermal comfort indicators include Predicted Mean Vote (PMV) [55], Standard Effective Temperature (SET), Outdoor SET (OUT_SET) [56], Physiological Equivalent Temperature (PET) [57], and Universal Thermal Climate Index (UTCI) [58]. Among them, PET and UTCI are considered to be appropriate but sometimes complicated indexes for evaluating outdoor thermal comfort [29,59]. PMV and SET are used in indoor evaluations; hence, errors will occur when they are directly used in outdoor thermal comfort assessments [60]. However, overhead space can be regarded as semi-outer space owing to its particular functional properties and the existence of enclosure structures. Therefore, the air temperature, humidity, and wind velocity are taken as the output variables of thermal environment simulations, and SET* is used as the thermal comfort evaluation index.
SET* is defined as the equivalent air temperature of an isothermal environment at 50% RH in which a subject, while wearing clothing standardized for the activity concerned, has the same heat stress (skin temperature Tsk) and thermoregulatory strain (skin wetness, w) as in the actual environment [61]. Scholars [29,30,62,63,64,65] from many countries and regions have studied the relationship between thermal sensation and SET*(or PMV) in different specific space environments. The research indicates that people in different regions have different adaptability for various reasons, resulting in significant differences in the thermal comfort zone and thermal sensation. Therefore, in the specific bottom-overhead space in Chongqing during summer, it is necessary to delimit the thermal comfort zone in combination with the actual thermal sensation of occupants.
Jin [65] proposed a more suitable establishment method of thermal adaptation models in China by analyzing de Dear [66,67] and Humphreys’ studies. Based on his method, this study first conducted a series of questionnaire surveys and interviews of users in the overhead space of three residential quarters where on-site measurements were conducted. There are seven levels of TSV [68], with the investigation contents and options being set as cold, slightly cold, cool, moderate, warm, slightly hot, and hot, corresponding to the numbers −3, −2, −1, 0, 1, 2, and 3, respectively, forming a “−3 to 3” thermal sensation scale. Secondly, SET* values corresponding to each time point during the on-site measurement were calculated by using the tested Ta, RH, and wind velocity. The uniform average value of clothing resistance is 3.3 clo. There were two kinds of activities: meditation (1 met: 56.2 W/m2) and walking (2 met: 116.3 W/m2). Then, a linear regression model of TSV and SET* was fitted by counting the TSVs of each calculated SET* with an interval of 1°C. According to Jin and Fanger [55,65], the comfort range is defined as enabling 80% of participants to achieve a satisfactory sensation, corresponding to TSV = 0.85. Consequently, the thermal comfort zone of SET* in this study was calculated as 22.1 °C to 28.8 °C, and the neutral temperature was 25.4 °C. Hence, SET* = 25.4 °C is assumed to be the most desirable temperature for pedestrians. When the SET* value is over 25.4 °C, the smaller the SET* value, the better the thermal comfort.

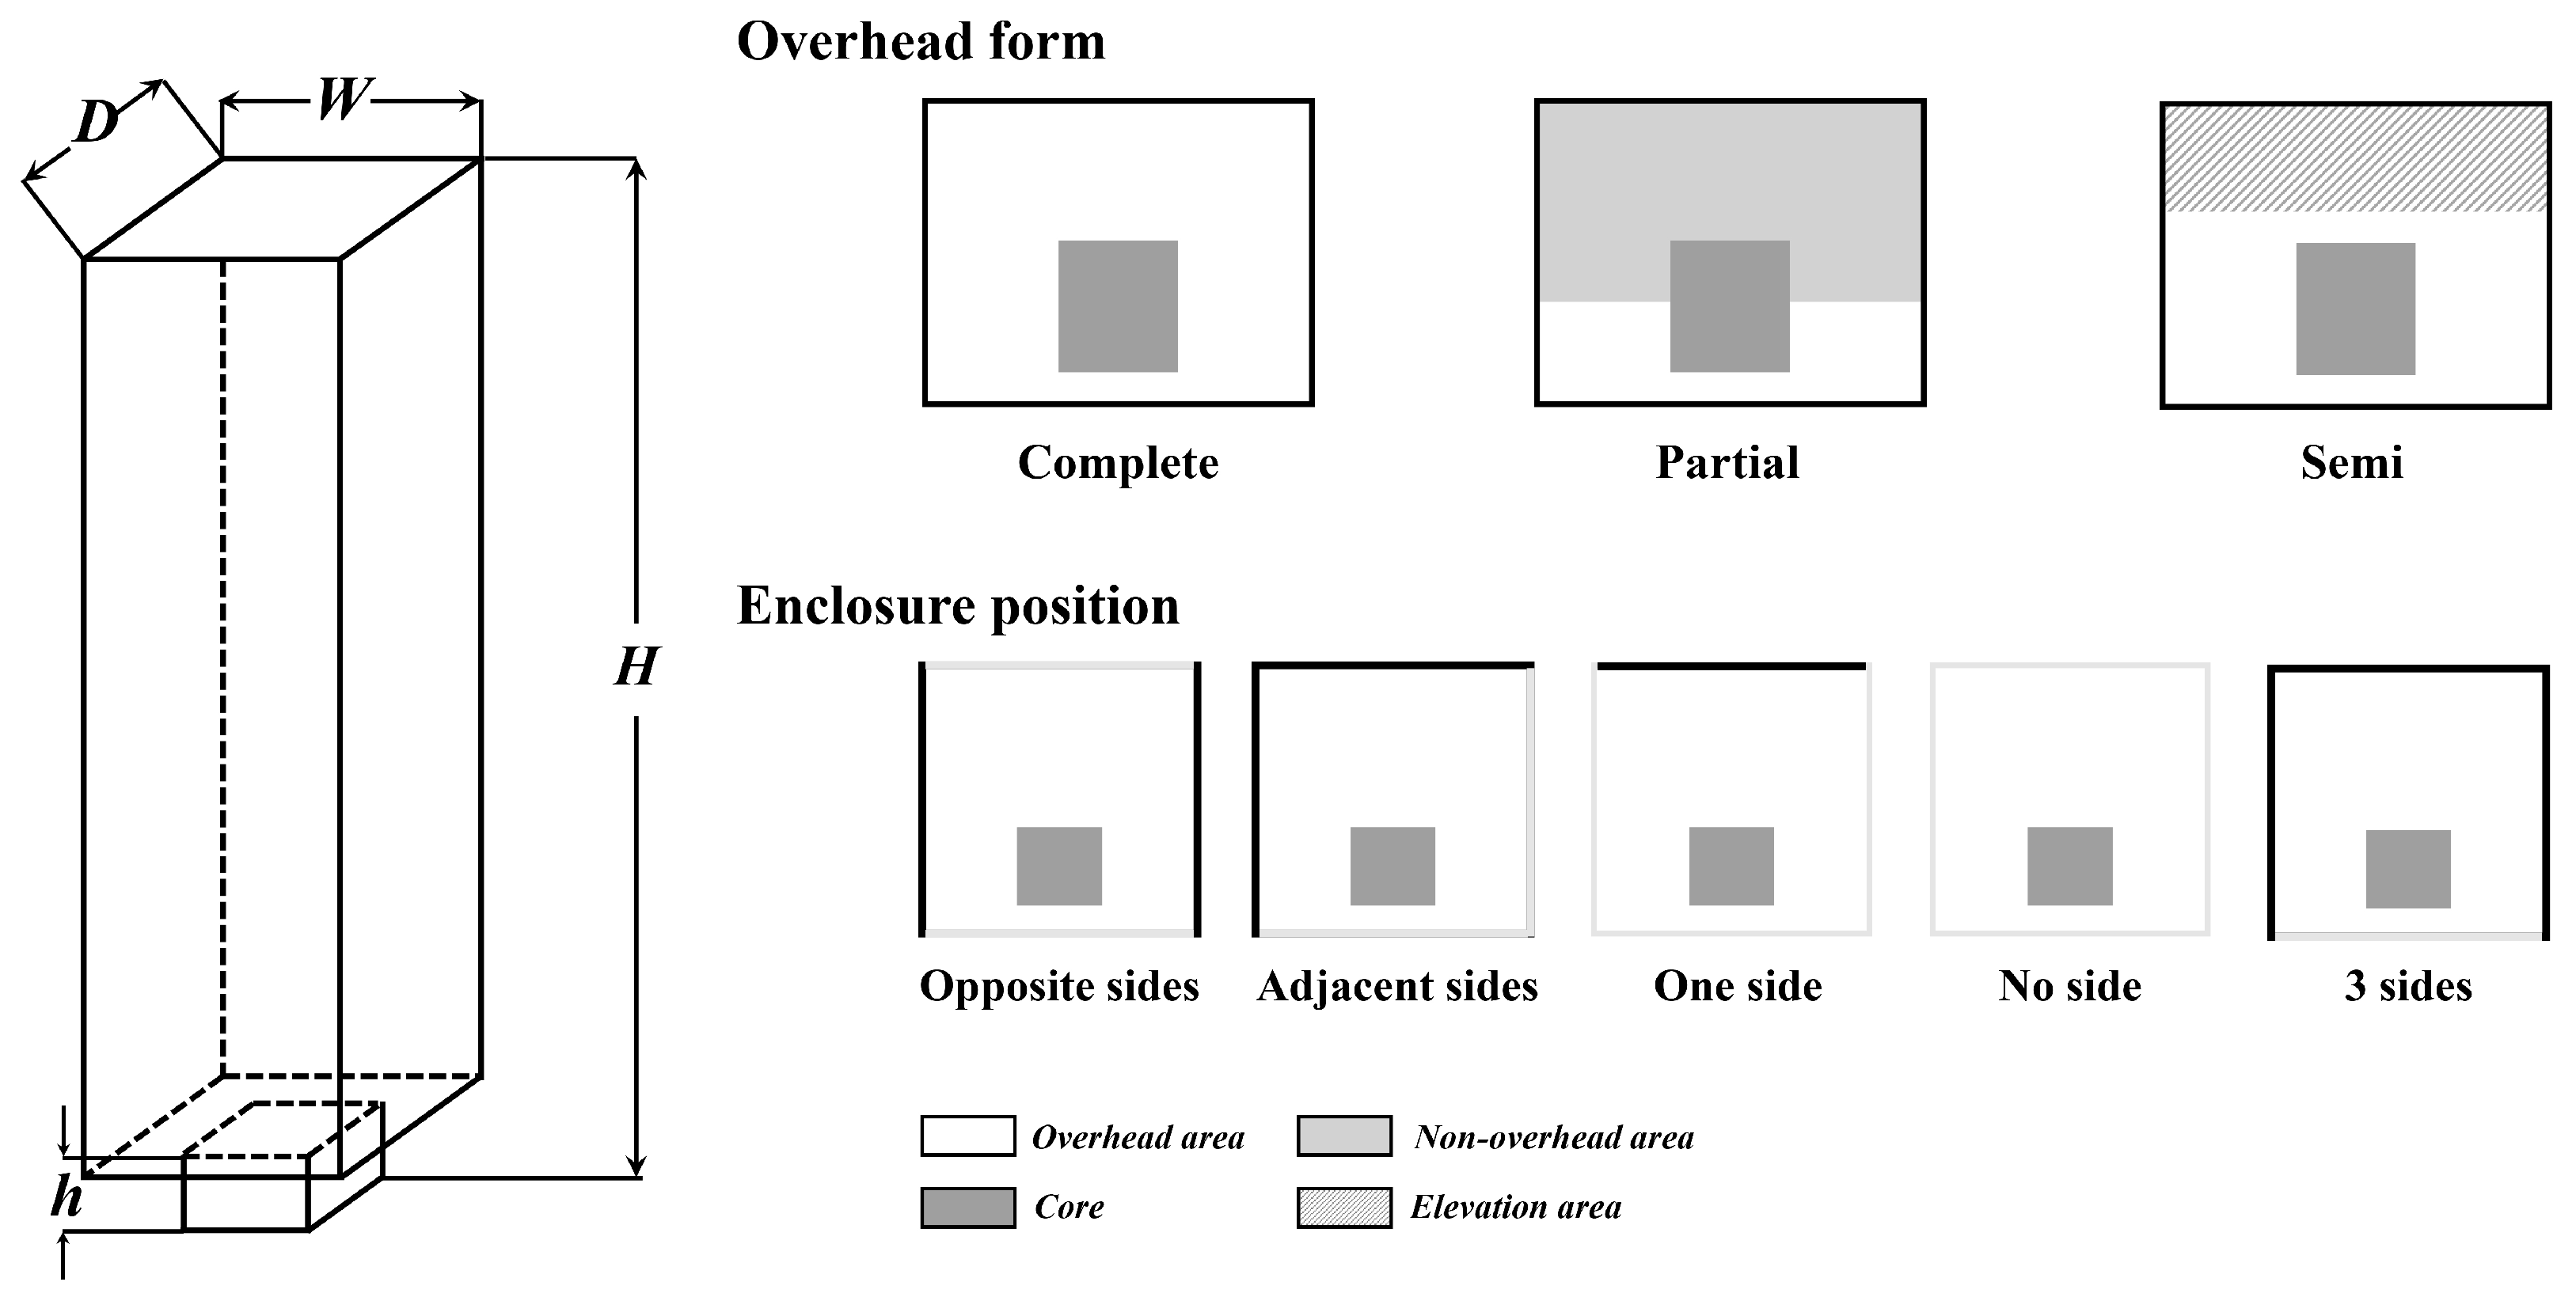
2.5. Description of Tested Building Design Variables and Case Arrangement

The standard functional layer of high-rise residential buildings generally arranges multiple houses of different sizes around the vertical traffic core, whose basic configuration has been practically stereotyped into two types in present China: slab-like and tower building (abbreviated as SB and TB). The plane of the overhead space is characterized in line with the standard layer as well. Compared with tower buildings, the slab-like building has a significantly larger width than depth, fewer numbers of households on the standard layer, and several units are frequently abreast together, while the plane of tower buildings is generally square but with varied outline appearances, their units are arranged in an independent scattered form, with less continuity.
Therefore, this study chose Zhongyu I-city and Gongyuan Zhishang residential quarters as the reference prototypes, representing slab-like and tower building, respectively, to establish the benchmark models, as shown in Figure 6. The models were assumed to have no interference from other buildings around the simulation area. They were simplified and facade elements were eliminated, such as window opening or a concavo–convex surface, and the underlying surface material around the tested objects was established according to the actual situation. Then, based on the characteristics and spatial range of overhead residential buildings, the design variables were divided into two categories: the architectural form and the design elements of bottom-overhead space. As the building height has been proved to influence the comfort around overhead floors [1,8,11], the design variables in terms of building form mainly considered the width depth ratio (W/D) and the quantity of slab-like buildings continuously arranged. As for the design variables of overhead space, the research focuses on the height of the overhead floor (h), overhead form, enclosures position, and openness degree (OP). The detailed information regarding these variables is described in the following paragraphs.
In the field investigation, it was found that only the most slab-like high-rise residential buildings would be arranged continuously in practice. The benchmark model of slab buildings was a continuous arrangement of two units without space in the middle. Therefore, the arrangement numbers varied; one unit was placed independently (SB1) and three units were placed continuously (SB2). The slab-like benchmark model has an aspect ratio of 2, while the tower benchmark model has one of 1.33. According to the common plane of residential buildings of Chongqing, for both types of other tested models, the width remained unchanged, and their aspect ratios were set as 1.66 (SB3, TB1), 1.33 (SB4), and 1 (TB2), respectively.
Additionally, based on the survey results, the overhead forms were mainly divided into complete-overhead (SB0, TB0), partial-overhead (SB5, TB3), and semi-overhead (SB6, TB4) types. The complete-overhead type refers to the whole floor space being all lift-up except the entrance hall and central core tube necessary for traffic; the partial-overhead type is when a small part of the overhead space is open while the rest is erected with compact solid structure; and the semi-overhead type means that there is height difference or artificially elevated bottom interface of the space, as illustrated in Figure 7. In models of previous studies, it was presumed that the overhead area was completely open without any enclosure structures such as walls or pillars, but the actual state is not this case: different enclosure types, amounts, and positions have a great impact on the permeability of and the degree of peripheral heat radiation of the area. The slab-like benchmark model adopted a complete-overhead form, which was open on the north and south sides and enclosed on the east and west sides, forming an enclosure position of opposite sides. The tower benchmark model was fully open without any enclosure. Therefore, for slab-like buildings, the enclosure position variables were single sided (SB8), adjacent two sided (SB9), three sided (SB10); for tower buildings, they were single-sided (TB7), opposite-two-sided (TB8), and adjacent-two-sided (TB9). In addition, the openness degree was defined as the open area/side area, and set as 1–0.75 (SB0, TB10), 0.75–0.5 (SB11, TB0) and 0.5–0.25 (SB12, TB11). Models related to the height of overhead space were tested at h = 4 m, 5 m, and 6 m. Thus, as shown in Table 2, there were 25 building models (including benchmark model) and all heights were 90 m high (H).

3. Results

As 15:00 pm is the most extreme time of summer thermal environment in a day in Chongqing [40], the Ta, RH, and wind velocity of each case at 15:00 pm were selected as the research object. Because ENVI-met cannot intuitively display the distribution of SET* in the overhead area, the visual numerical legend was divided into 20 intervals firstly. Then, the values of Ta, RH, and wind velocity with the largest occupied area were calculated as the representative values by the process of color and area recognition. Thirdly, combined with the relevant parameters of SET* given in Section 2 (such as clothing resistance and occupants activities), the representative values of SET* used as the evaluation basis were calculated by a calculation program. Figure 8 shows the maximum, minimum, and representative values of Ta, RH, wind velocity, and SET* values within the overhead area of each simulation building model, respectively.
In terms of air temperature, all values of all models are distributed at 32.2–37.6 °C. TB2 has the largest Ta of all models and SB10 has the smallest. The representative values of most models are distributed between their Ta, max and Ta, min and are closer to the minimum value. It should be noted that the Ta, rep of SB2, SB10, TB0, and TB4 are almost equal to the Ta, min. In terms of relative humidity, the numerical distribution is 48–58%. For SB models, most of the numerical distributions are relatively consistent, but SB9 has the maximum relative humidity difference, up to 6%. SB10 has the maximum RHmin value of all models: 54.4%. In addition, the RHmax of SB10, SB12, TB1, TB8, and TB9 are also RHrep in the overhead areas. The wind speed distribution range is 0.12−1.5 m/s. The overhead areas of TB8, TB9, and TB10 have the maximum wind velocity difference: 1.38 m/s. However, SB10 is abnormal with the three values being the same: 0.12 m/s. As presented in Figure 8d, the representative values of SET* of all models are over the neutral temperature: 25.4 °C. Among them, SB2 and SB6 have the minimum SET*, while SB5 has the maximum.

3.1. Thermal Environment Results of Building Configuration Variables

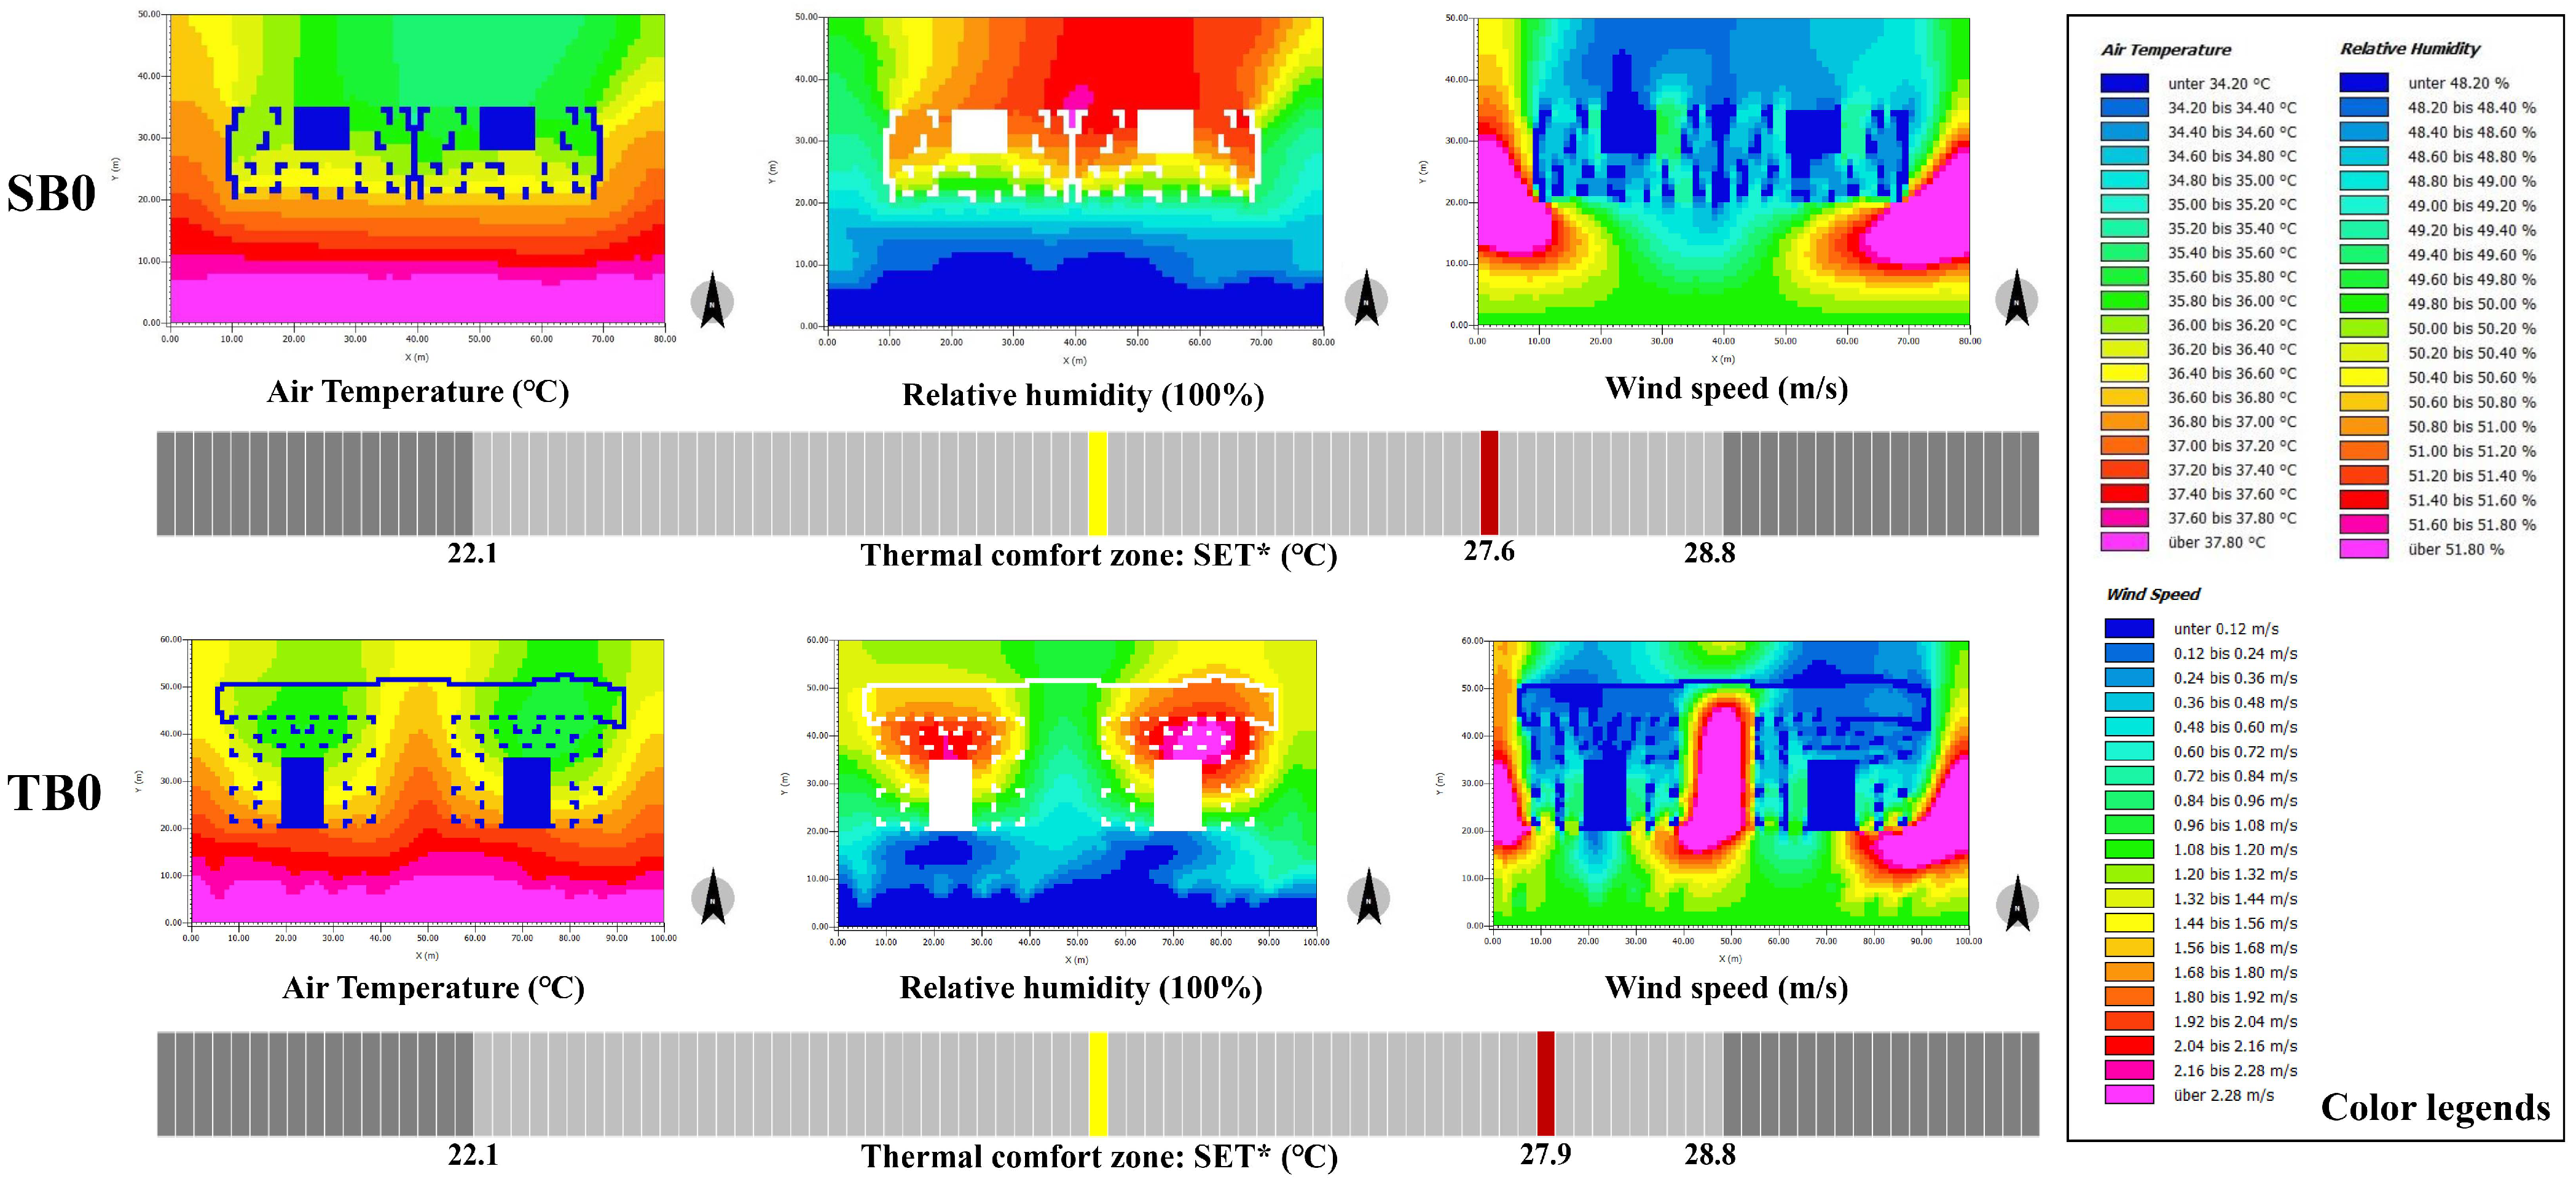
3.1.1. General Thermal Impact in the Lift-Up Area

Figure 9 shows the simulation results of the thermal environment of slab-like benchmark building model (SB0) and the tower benchmark building model (TB0), respectively. It can be found that the Ta distribution characteristics of overhead space in slab-like buildings are more obvious than in tower buildings but both perform as a generally gradual increase from the inside middle part to the outside. The distribution feature of RH is similar to those of Ta but displays a decline tendency on numerical value. The overall RH distribution in SB0 is relatively even, while a high RH is mainly concentrated in the north part in TB0 with a dot radiation form. In terms of wind velocity, both models have high wind velocity on both sides of the building, indicating the blocking effect of the building on the incoming wind. The SET* values of SB0 and TB0 are 27.6 °C and 27.9 °C, respectively, within the thermal comfort zone.

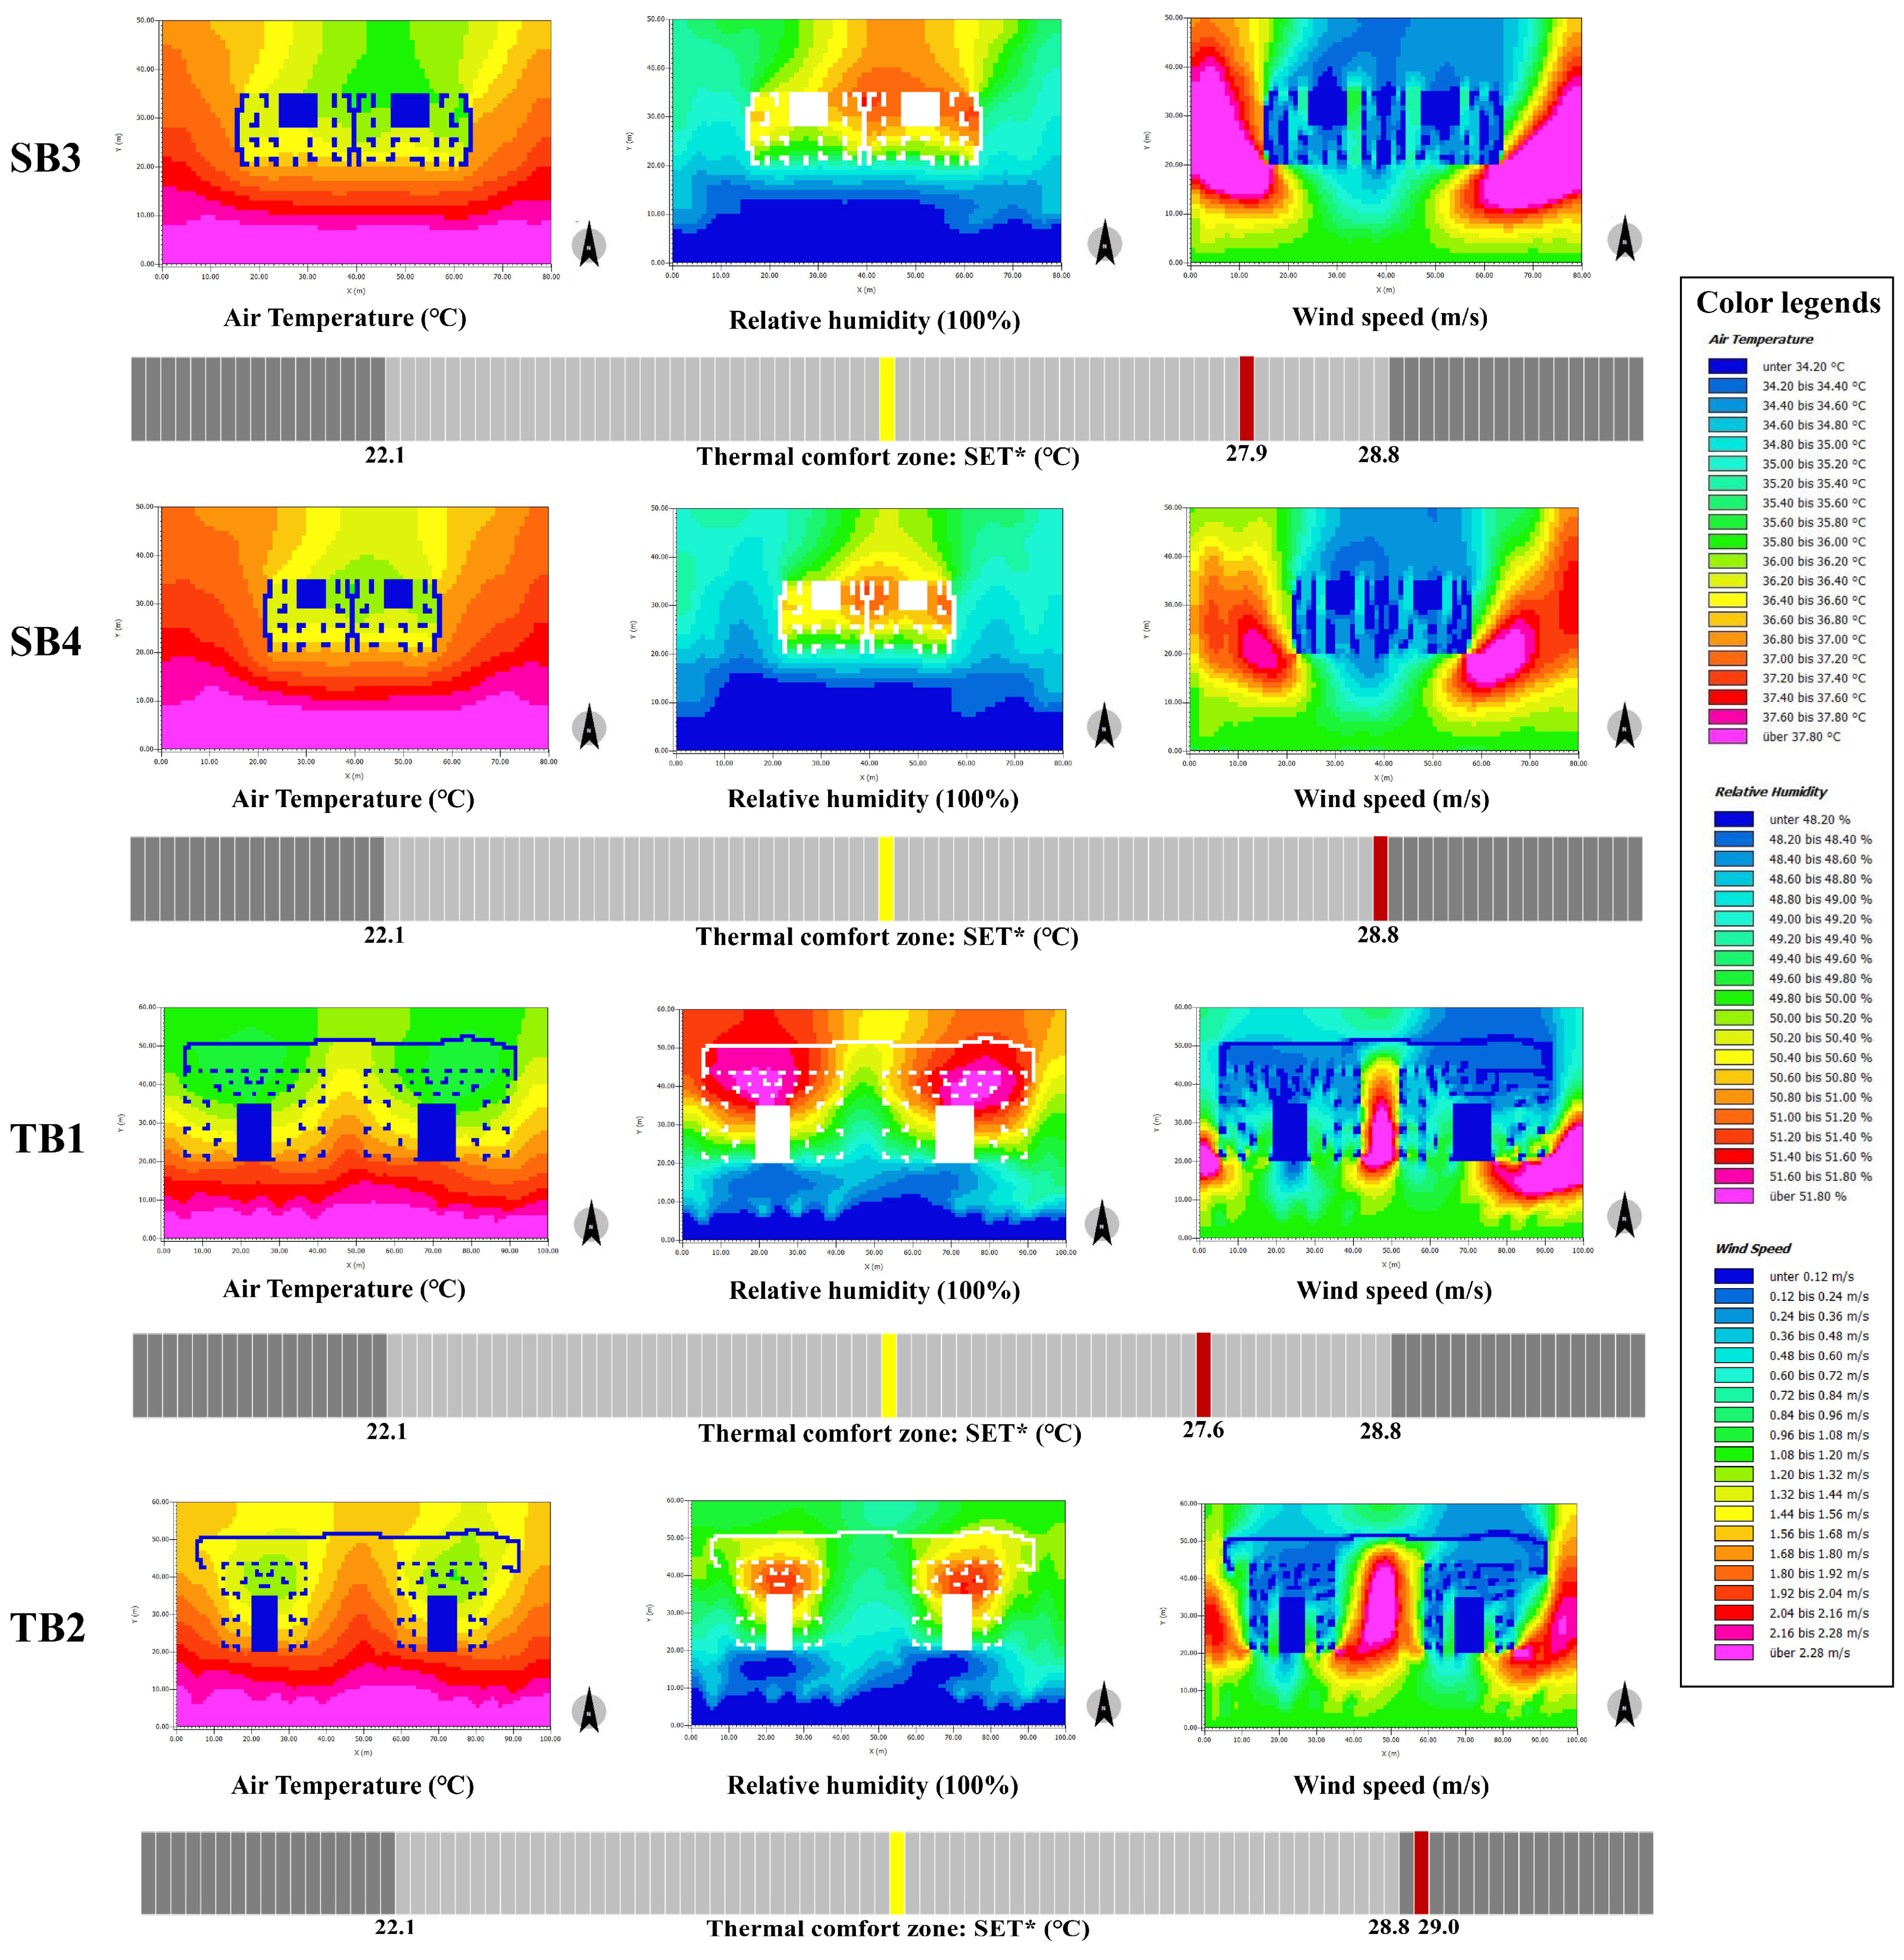
3.1.2. Comparison of Continuous Arrangement Number of Slab-like Buildings

Figure 10 shows the simulation results of SB1 and SB2, respectively. Comparing the numerical results of SB0 and thermal distribution in the overhead area, it can be found that Ta has an obvious decreases trend with the increase in continuous unit quantities. When a single slab house is arranged, the Ta in the overhead area is concentrated approximately at 36.3 °C with slight differences between north and south sides. Additionally, the more units of slab-like building arranged, the lower Ta of the outer space on the leeward side. On the windward side, RH is slightly lower and higher on the leeward side, keeping a relatively stable state with increasing quantity. However, the variation law of wind velocity is opposite to that of Ta. With the increase in the number of buildings in parallel, there is a significantly enlarged wind velocity area in the center of the overhead floor, and the representative value of wind velocity also increases in turn. The SET* of SB1, SB0 and SB2 are 27.9 °C, 27.6 °C and 27.5 °C, respectively, which tend to be more approaching to the neutral value, indicating that increasing the arranged numbers of the slab-like building can improve the overhead area’s satisfactory thermal comfort state as a result of the interaction between the overall building and the external environment.

3.1.3. Effects of Different W/D

Comparing the results of SB0 with SB3 and SB4, TB0 with TB1 and TB2 (Figure 11) in combination with Figure 8, it can be seen that the change in aspect ratio of two kinds of buildings will both cause changes in Ta, RH and wind velocity on the overhead floor, which is manifested by the decrease in W/D can simultaneously increase Ta and decrease RH and wind velocity slightly. However, unlike the evident difference of Ta between the north and south sides of TB cases, a decrease in aspect ratio causes a certain decrease in such a difference. As for thermal comfort evaluation indexes, with aspect ratio decreases, the SET* value of two types of buildings will both gradually increase and deviate from the neutral temperature. TB2′s SET*(29.0 °C) even exceeds the thermal comfort zone with W/D = 1, which may be mainly because reducing the aspect ratio leads to a smaller range of the overhead floor but more deeply impacted by the external environment such as solar radiation and outside temperature. Meanwhile, when the aspect ratio decreases, if the internal structure remains unchanged, the ventilation will worsen, which also leads to a lower wind velocity and worse thermal comfort.

3.2. Thermal Environment Results of Overhead Area Variables

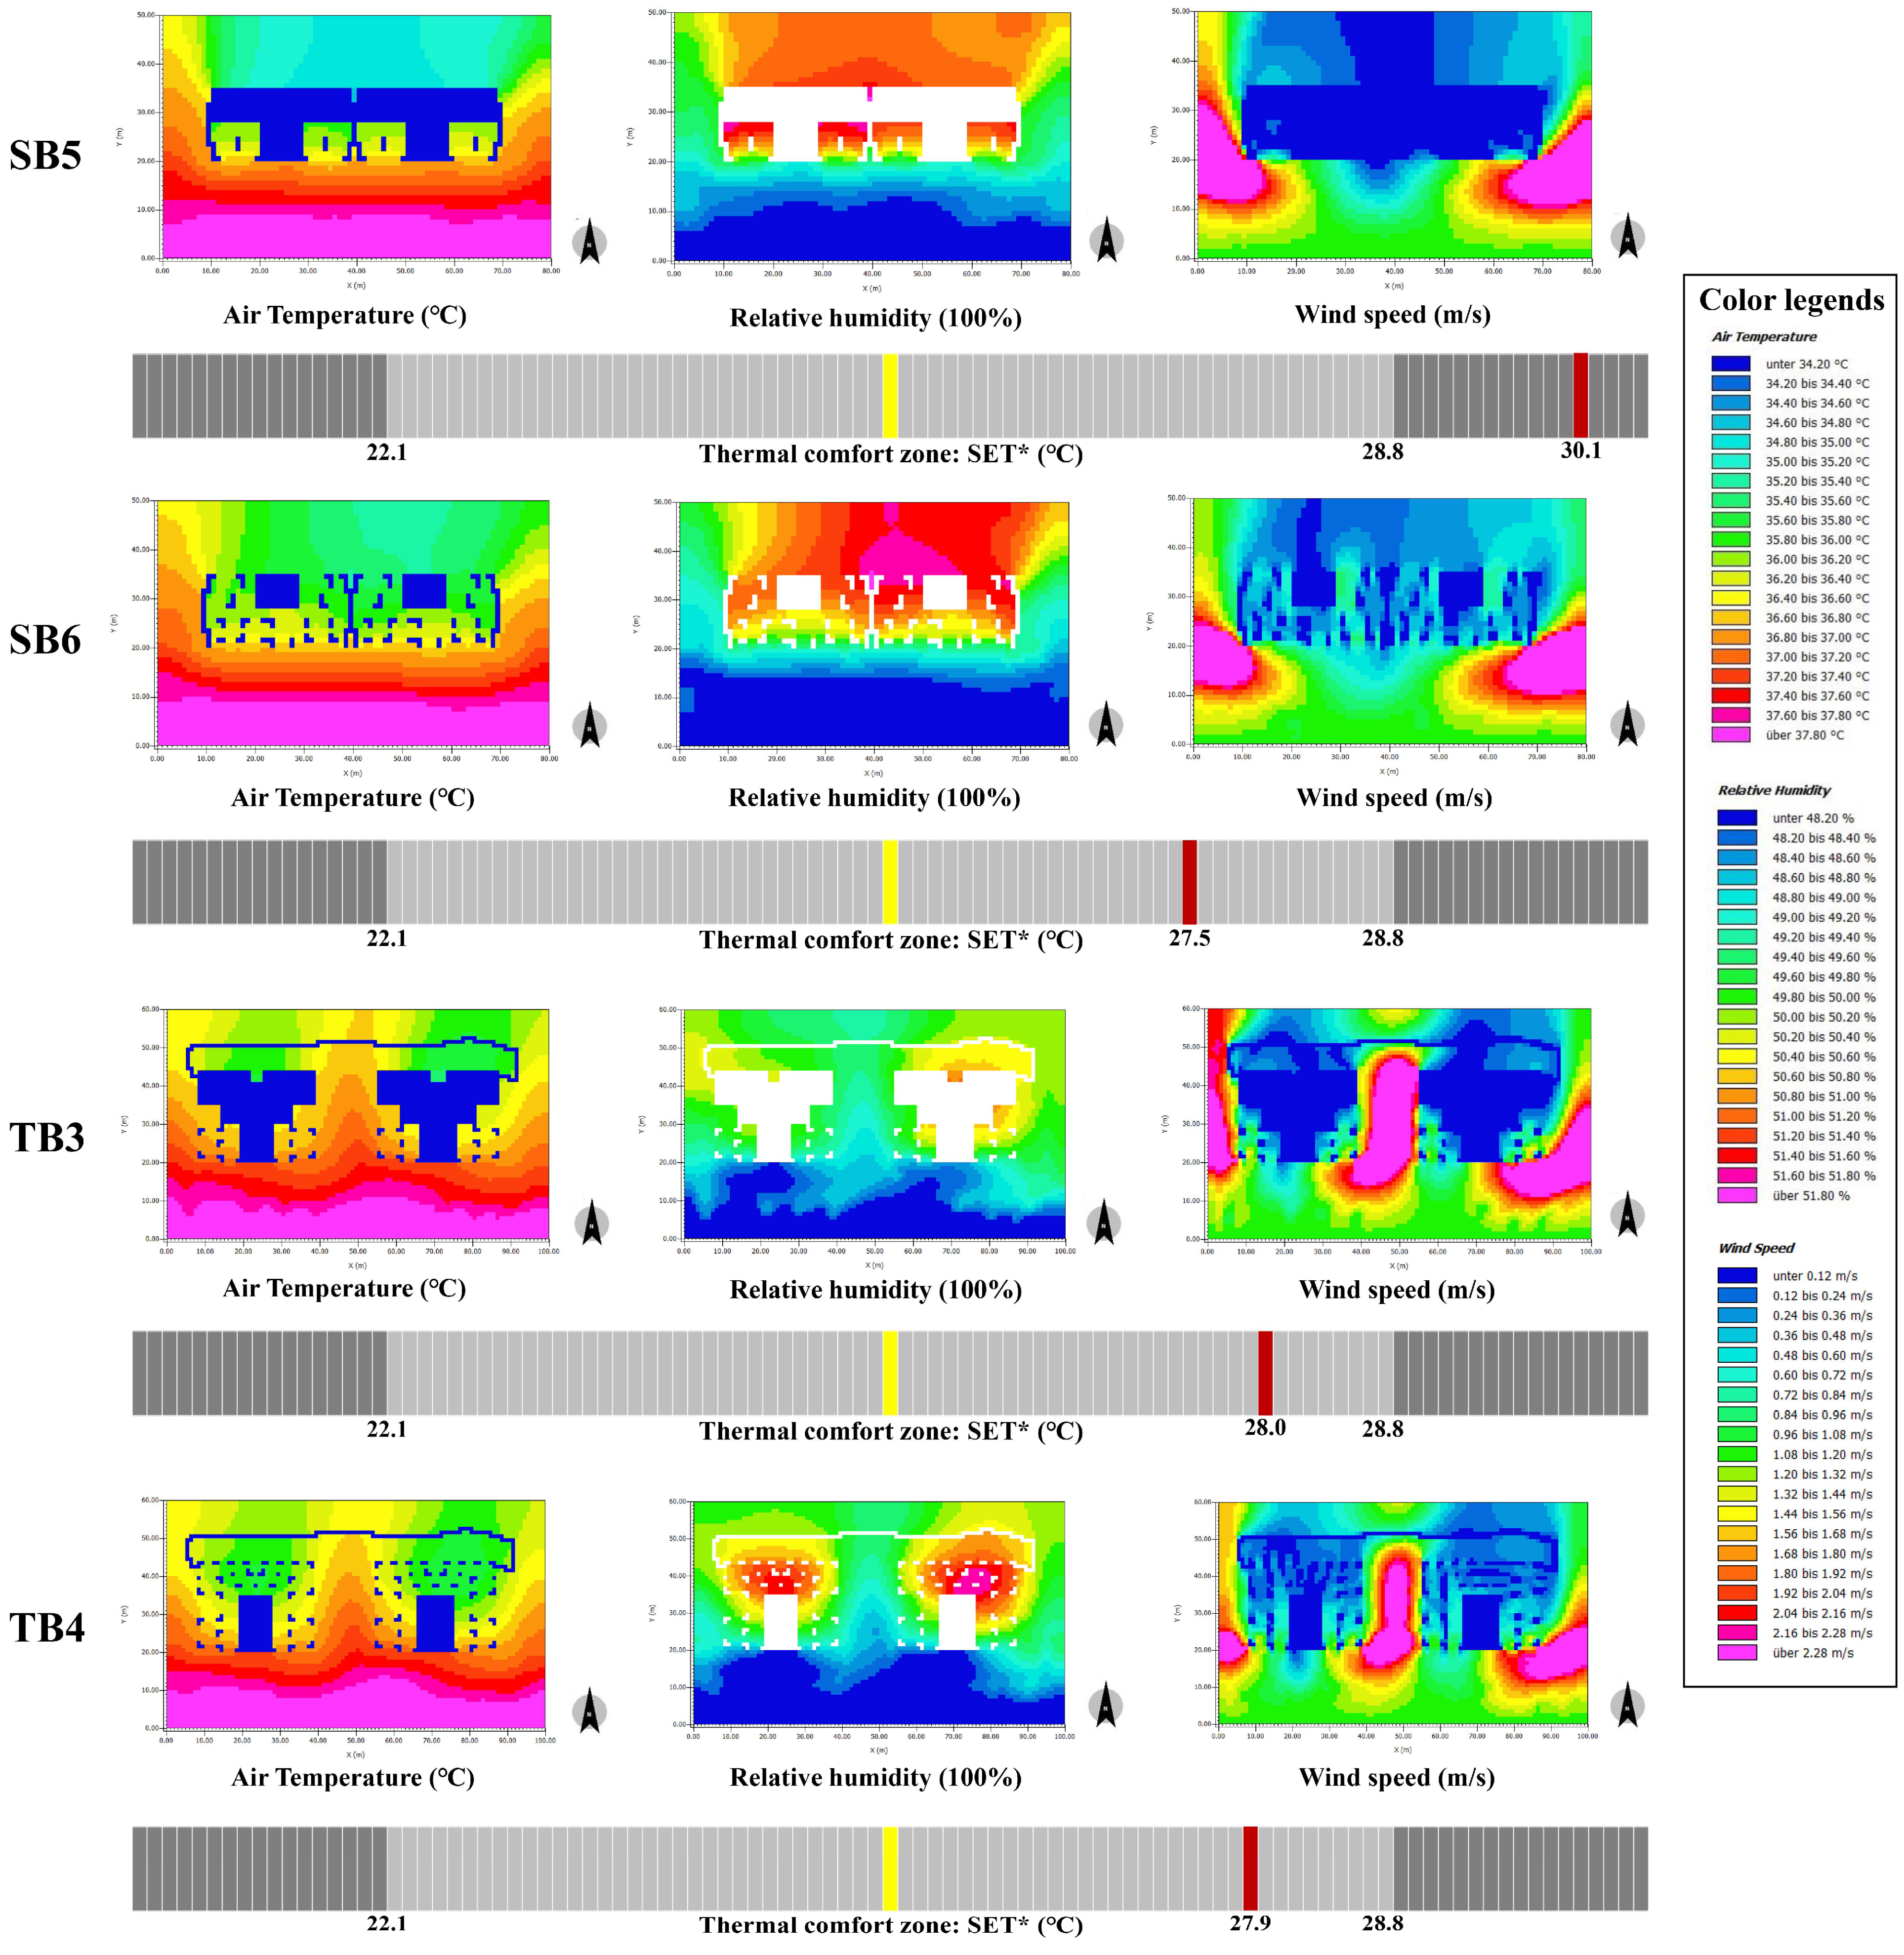
3.2.1. Effects of Overhead Form

The thermal environment simulation results of SB5, SB6, TB3, and TB4 are shown in Figure 12, respectively. Based on the comparison with the benchmark building models, for cases of the SB models, the Ta difference between the complete-overhead form and the semi-overhead form is small with a close representative Ta value. However, the value of partial-overhead form is vastly higher. In the aspect of RH, there was no significant difference among the three forms. Additionally, it is worth mentioning that in the partial-overhead form, the internal wind velocity is nearly 0 m/s, which may be because of various enclosure structures and components with a large area severely affecting the wind field distribution of the overhead area and forming a windless space. In addition, the SET* values of SB5 and SB6 are 27.5 °C and 30.1 °C. SB6 has the largest SET* most configuration among the 25 building models, which means the partial-overhead form of the slab-like building brings the most uncomfortable and unacceptable pedestrian thermal environment, while the effect difference between the complete-overhead and semi-overhead types is inapparent.
For the cases of the TB models, the thermal environment distribution is similar to those of SB models. The TB3 model adopts the partial-overhead form and has the highest representative Ta value among all models, up to 36.7 °C, but this is a significantly lower RH than those of the other two forms with representative value difference close to 2%. However, there is no apparent difference in the SET* value among the three TB models compared with SB models. The author speculates that this may be comprehensively related to the impact of the different aspect ratios of the slab-like and tower building.

3.2.2. Effects of Overhead Space’s Height

As shown in Figure 8 and Figure 13, the Ta and wind velocity of the two types of cases increase slightly with the increase in the overhead floor height; on the contrary, RH shows a decreasing trend. In terms of the overall situation of thermal comfort, heightening the overhead area results in an increase in SET*. When the height is 6 m, the SET* reaches the maximum value (28.2 °C) among the case models and the corresponding thermal comfort is also the worst, probably because the higher layer introduces more solar radiation and leads to a faster heating rate in summer.

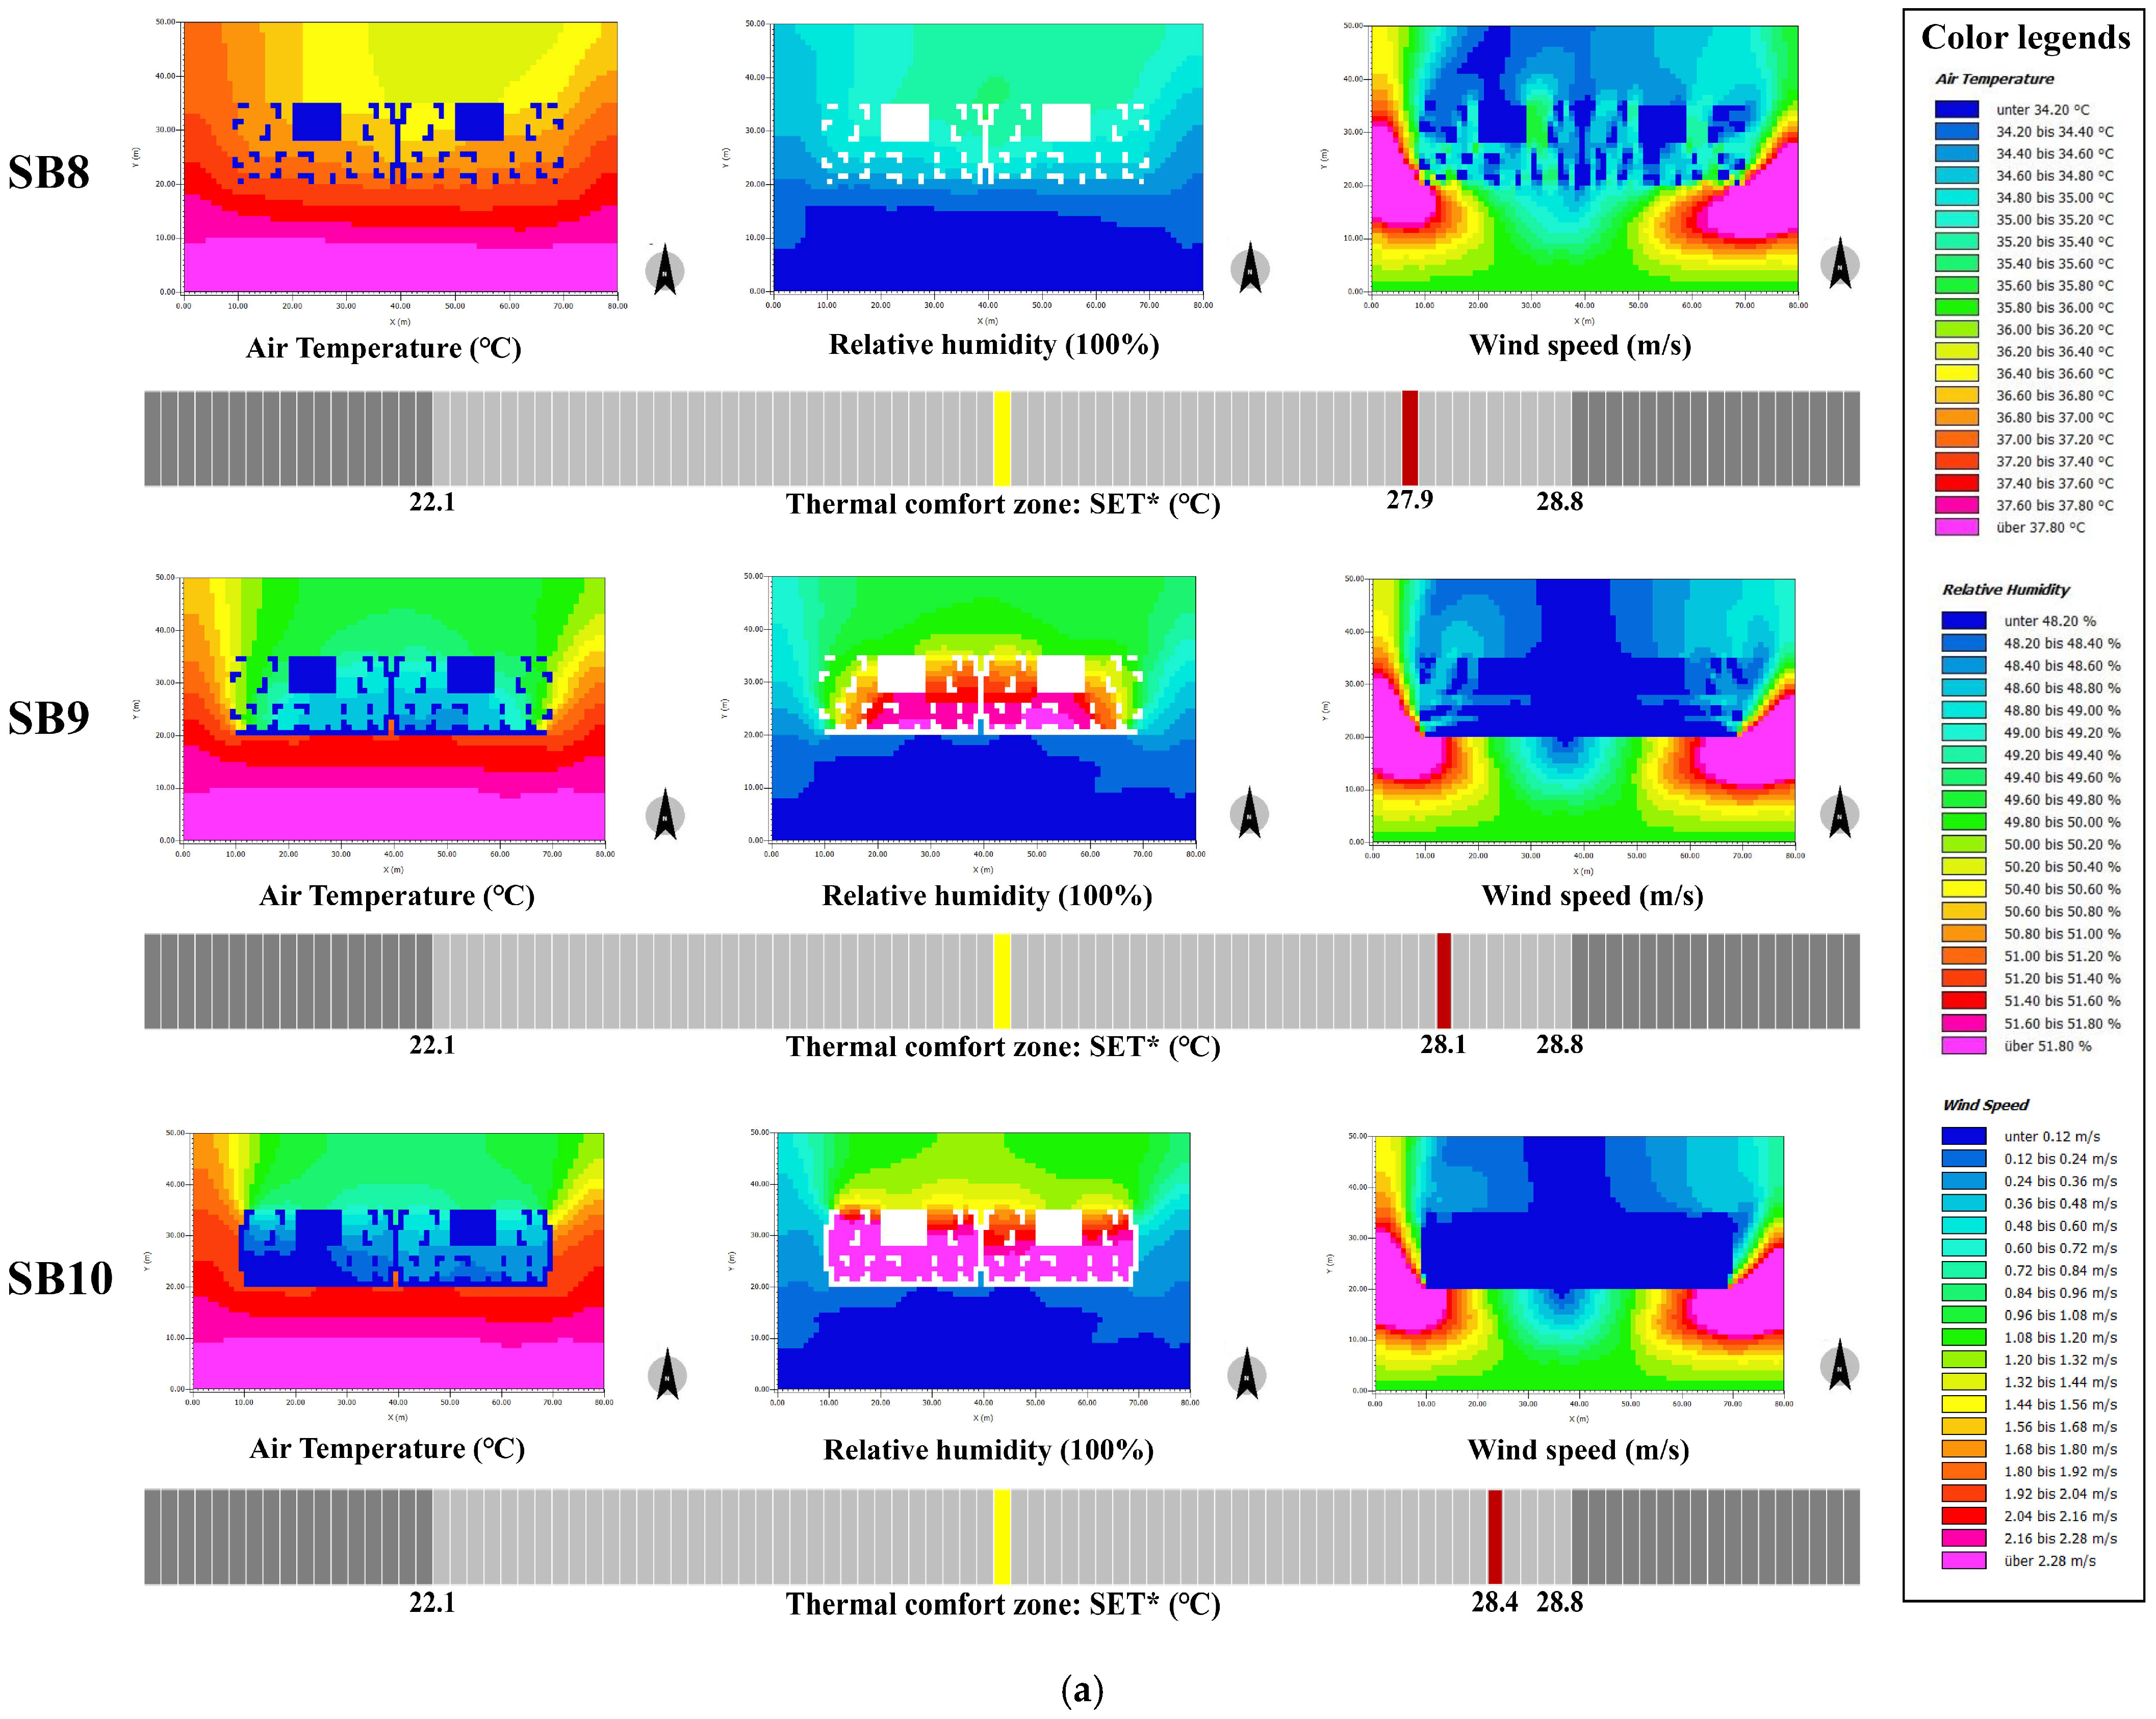
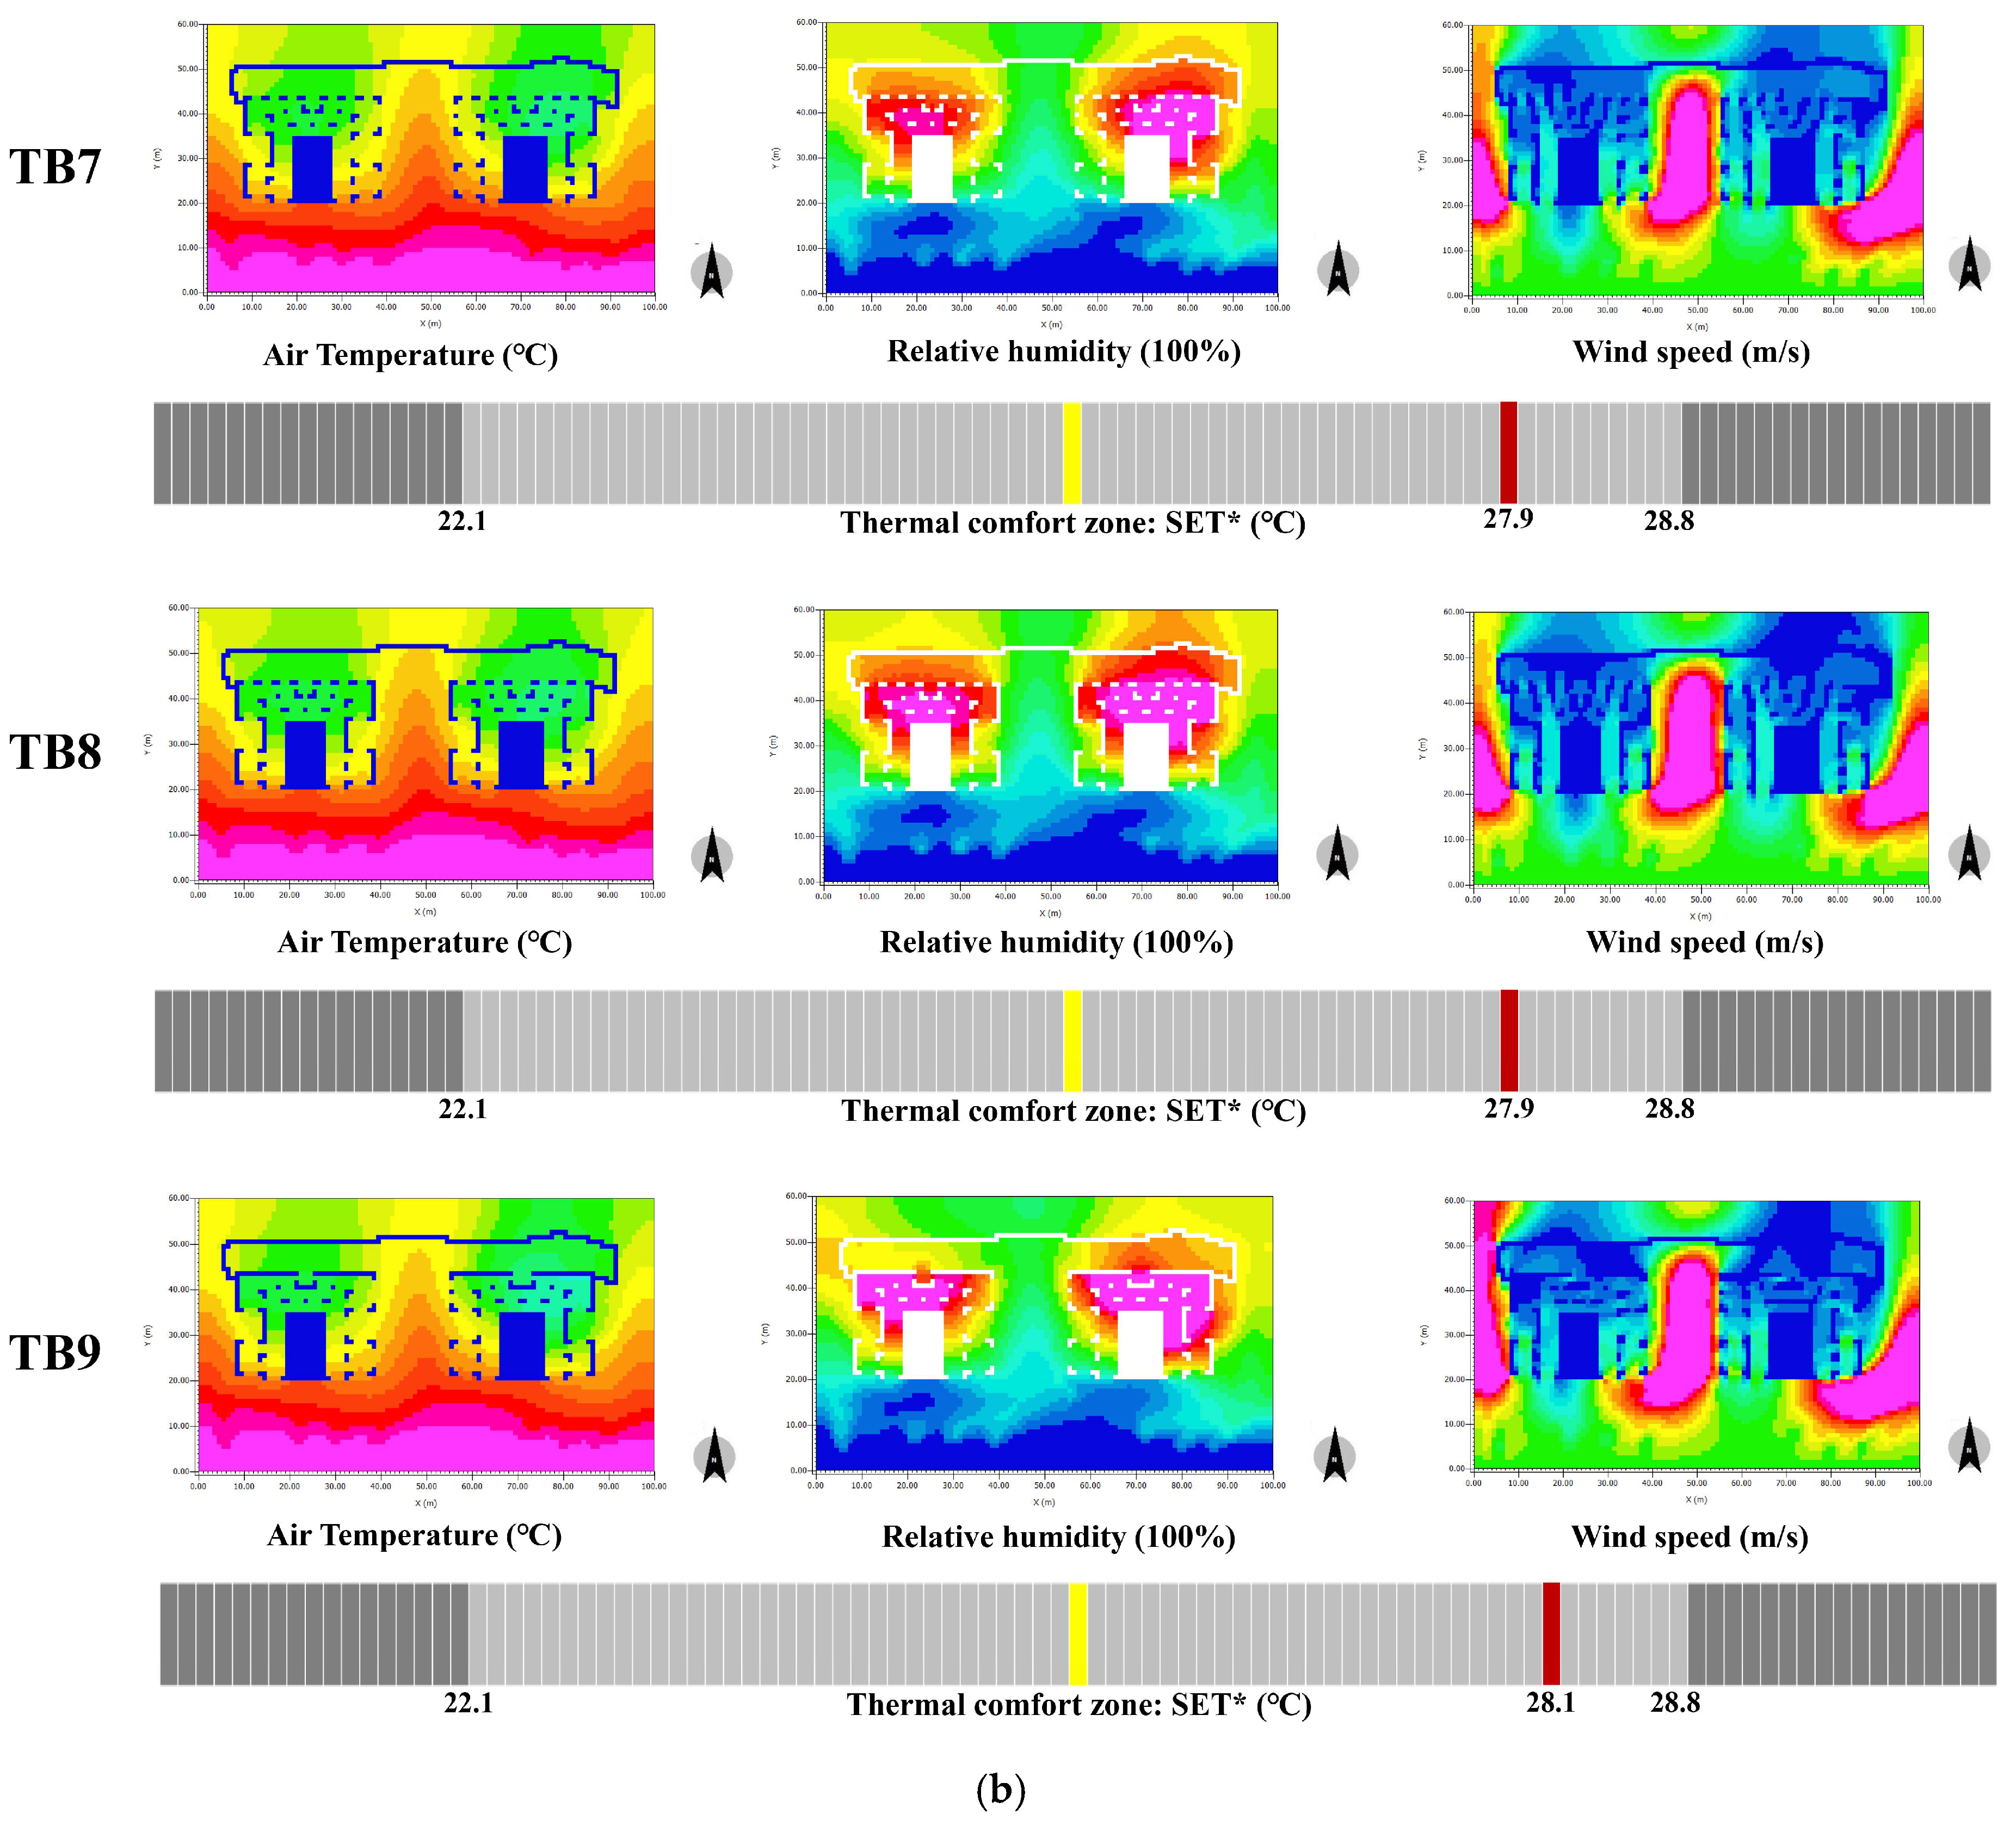
3.2.3. Variation of Enclosure Position

Figure 14a,b show the thermal environment simulation results of SB8, SB9, SB10, and TB7, TB8, TB9, respectively. In actual overhead buildings, the setting and number of enclosure structures also determine the opening of overhead floors, which directly affects heat conduction, radiation, and convection. Compared with SB0, it can be found that the Ta changes greatly under the four enclosure forms for slab-like buildings. The one-sided enclosure position mode (SB8) has the highest representative value of Ta: 36.3 °C, followed by the opposite-two-sided (SB0), and the minimum value appears in the three-sided case (SB10) with 32.2 °C. RH differs as well. Contrary to the situation of Ta, SB8 has the smallest RH value and SB10 has the largest, with a difference of up to 8%. SB0 has the largest wind velocity, followed by SB8 and SB10, where the wind velocity is close to 0. The existence of an enclosure structure directly affects the inlet and outlet and direction of airflow. Moreover, SB0 (opposite-two-sided) has the smallest SET* value, so it is also the most comfortable enclosure position case. The next is SB8 (single sided) and then SB9 (adjacent two sided). The maximum value comes from SB10 (three sided). Although this case reduces the radiant heat in the overhead area, the enclosed space also makes it difficult for heat and moisture to diffuse.
Differently, for the cases of the TB models, the Ta and wind velocity are with no apparent variation in the four enclosure forms. As for RH, TB0 has the smallest representative value, followed by TB8, and TB9 has the largest. Hence, the SET* value is basically the same, indicating that the difference of enclosure position has no significant effect on the thermal comfort of the overhead area in tower building.

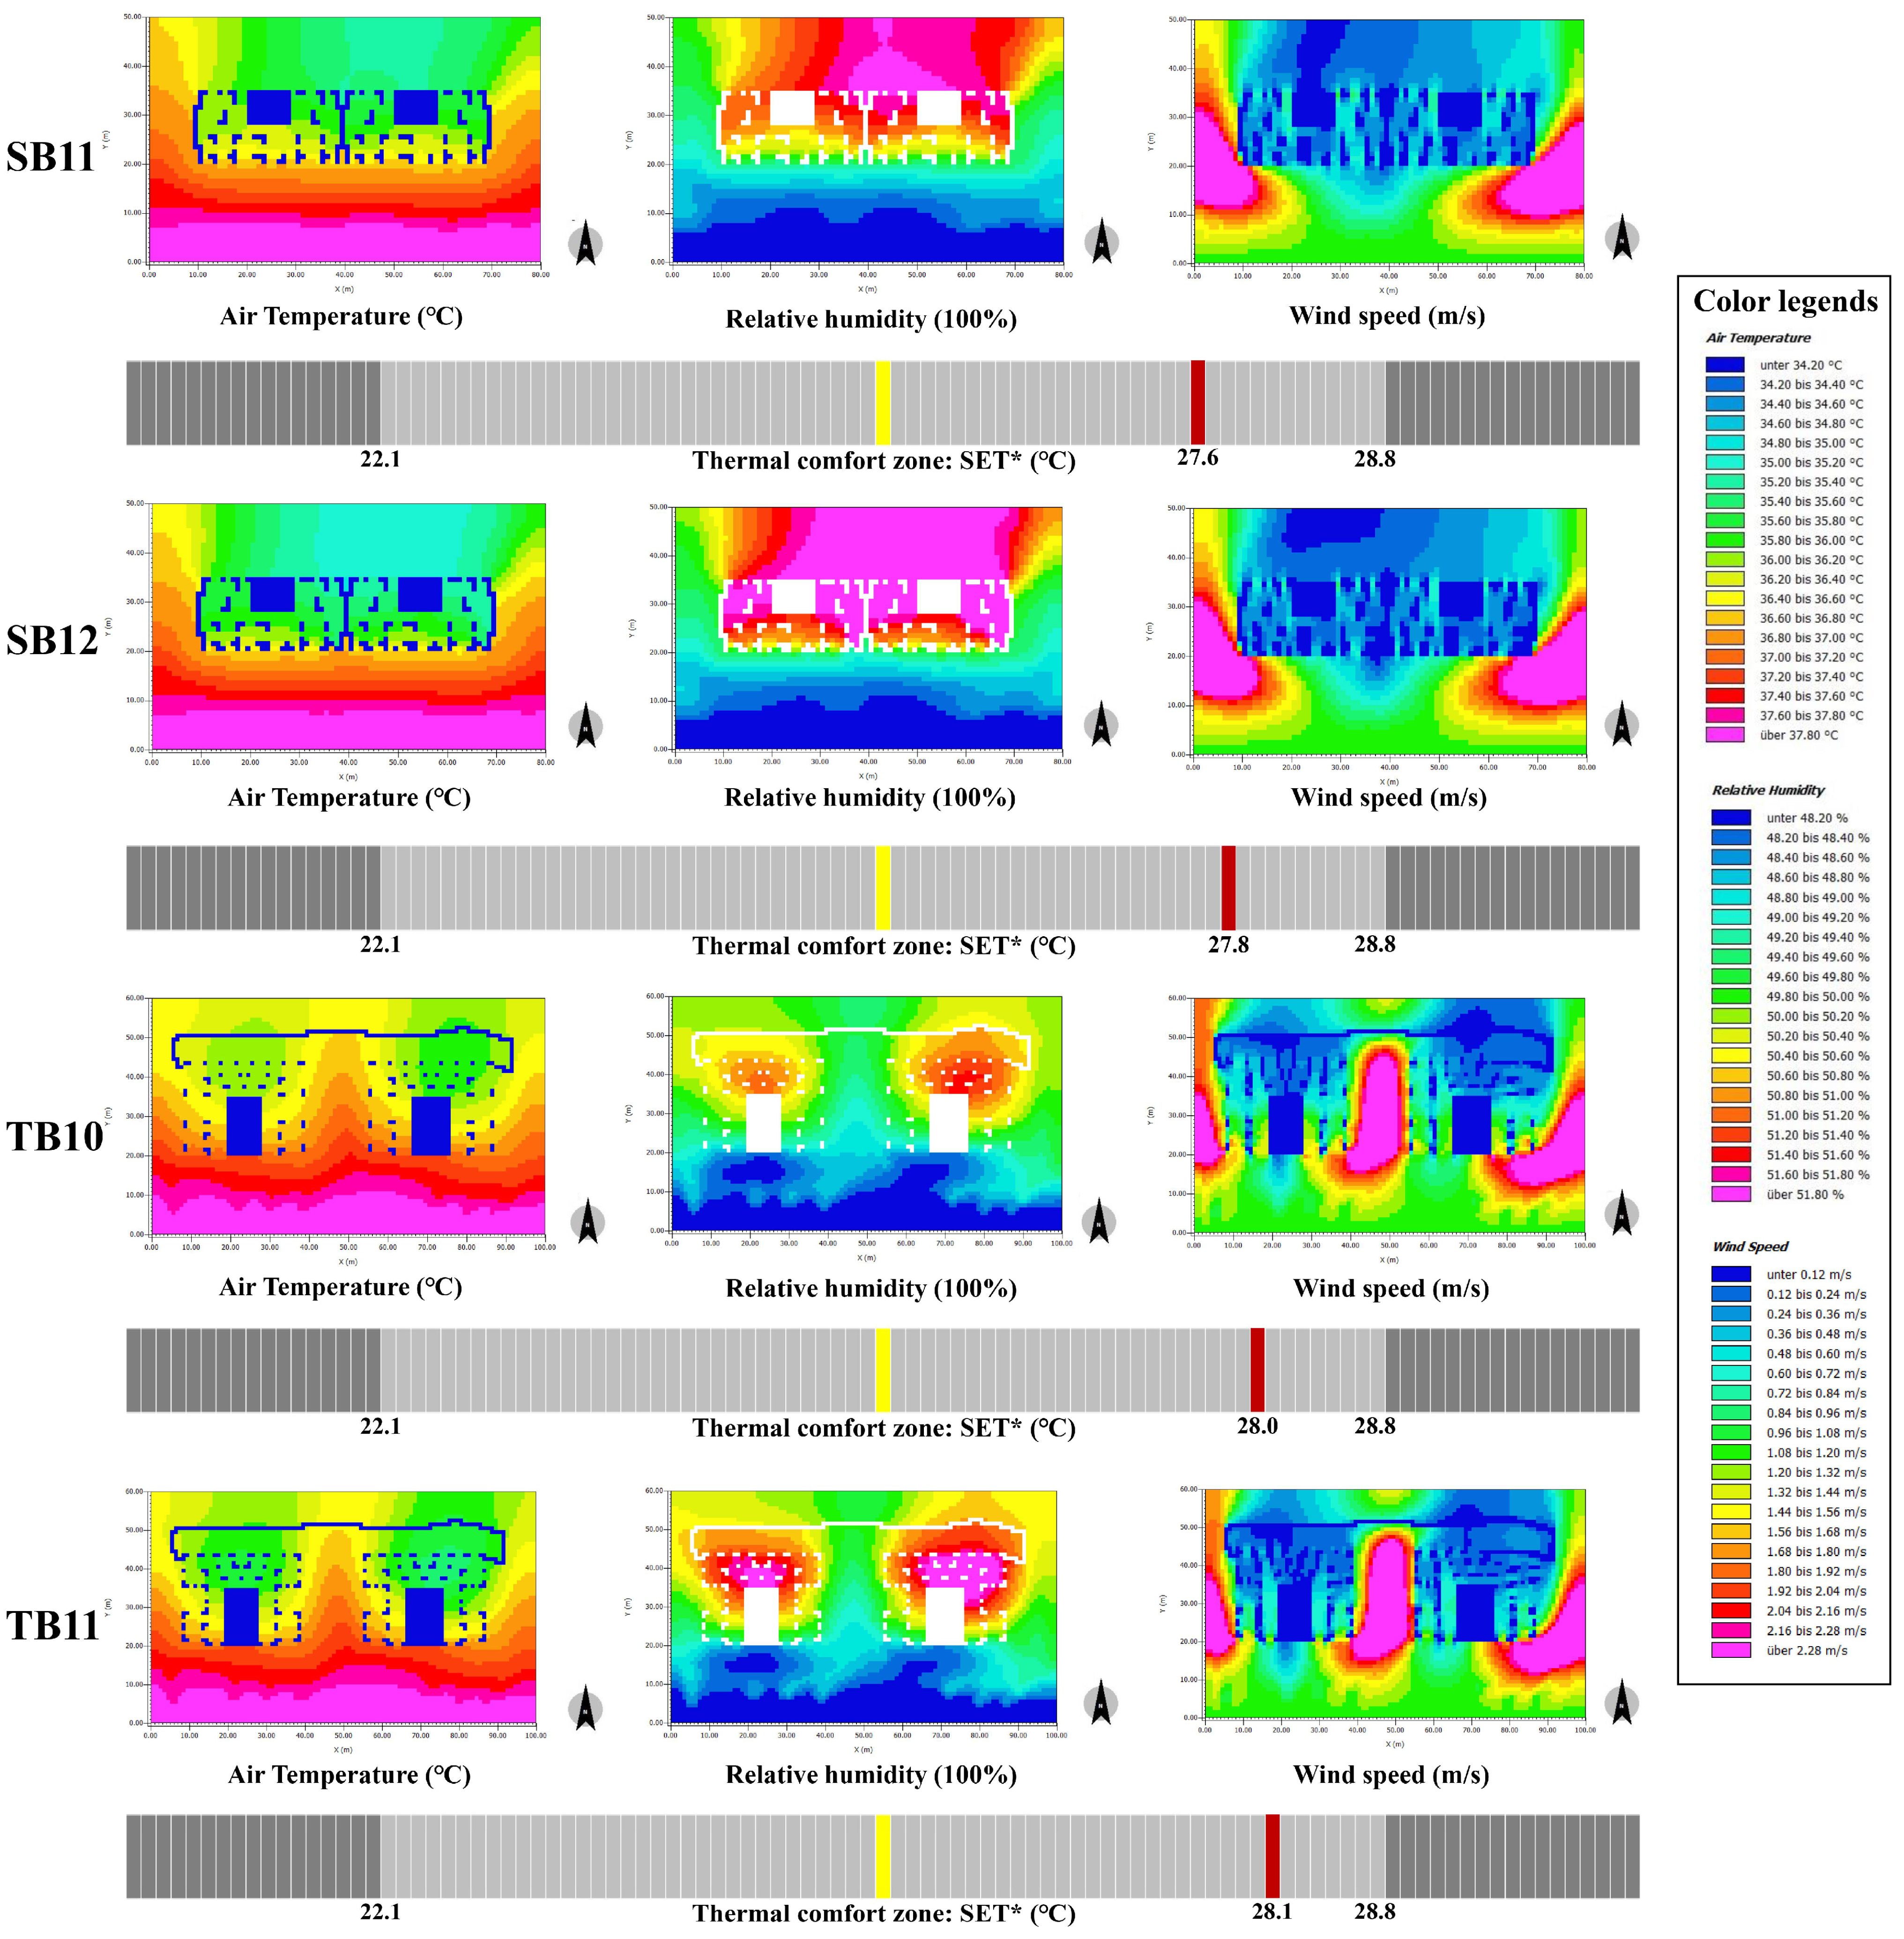
3.2.4. Effects of Openness Degree

Previous studies on overhead buildings mostly assumed the openness degree to be 1.0 (completely wide open). In practice, the open surface of the overhead floor will have different opening degrees due to the existence of structural columns and shear walls. Figure 15 shows the thermal environment simulation results of SB11, SB12, TB10, and TB11. The Ta and wind velocity of all cases present a decreasing trend with the decrease in the openness degree, while the RH increases gradually. Among these, the RH of TB11 reaches 52.5% with an openness degree of 0.5–0.25. Furthermore, the relative optimum thermal comfort is obtained for both cases with an openness degree of 0.75–0.5.

4. Discussion

This study comprehensively analyzed the pedestrian-level thermal environment of high-rise overhead residential buildings with different architectural design variables. The results show that the overhead design can effectively improve pedestrian-level thermal comfort, which is consistent with previous findings. Previous work focused more on the wind environment under and around overhead buildings and they found that the wind speeds are adequate to achieve outdoor thermal comfort on a hot, warm, sunny, summer day [20,69]. However, the simulation results of this study show that the overall air circulation in the overhead area has a relatively low velocity. On the one hand, the geographical location of Chongqing is not like coastal Hong Kong, which belongs to the windless region, especially in high-density blocks; on the other hand, previous tested models mainly consider the overhead building with central cores [8,11,12,14,15,20,23,24,25,26,27,28], which may induce the minimum disturbance to the wind flow in the overhead area, while the simulation models of our study also contain envelope structures such as peripheral columns and shear walls. Therefore, it also indicated that only researching the wind environment was insufficient to improve pedestrian-level thermal comfort.
This study took slab-like and tower buildings as the benchmark models. Differently, the models were derived from the actual residential quarters rather than with the ideal rectangle plan. As for the results of various building variables, we found that the higher the overhead height, the better the thermal comfort of the overhead area. This is in accordance with the results of previous studies. In the experiments of Du et al. [25,28], five models with overhead heights of 4–8 m were set, of which the 8 m model has the greatest wind thermal comfort. We also found that the environment tended to be more comfortable when the aspect ratio increased. The same results appeared in the works of Zhang [24] and Wen [70]. They indicated that a wide arcade layout (lift-up area) was more favorable in improving the air circulation and wind comfort. In addition, the results also indicated that when the number of buildings arranged continuously increases, the thermal comfort will be better. Although there was no such variable in previous studies, the number of cores has been investigated and they found a positive correlation with the comfort of overhead areas [14,25,27]. Other design variables such as overhead form, enclosure position, and openness degrees are the innovation of this paper. Despite achieving many findings, some inevitable limitations exist.
  • The outcome of this study is based on the residential building models and meteorological data measured in Chongqing, so the results may only be applied to other areas owning similar summer climates and architectural forms to Chongqing.
  • In the simulation experiment, other influential factors such as various barriers excluding vegetation in the overhead area (such as installed public facilities, parked transportation tools, and so forth.), complex and irregular construction forms (such as outdoor corridors, curved walls, and so forth.), surrounding buildings and fickle meteorological conditions (such as wind direction and gusts) were eliminated. The application to real environment conditions should be considered in the future.
  • Although a series of design variables of bottom-overhead space was classified and demonstrated the influence law of thermal comfort, further investigation is still required to determine the optimum variables and their combination.

5. Conclusions

This study adopted ENVI-met to simulate and test the effects of architectural design variables of high-rise overhead residential buildings on the thermal comfort of overhead floor area. The simulation experiment selected two common residential building configurations (slab-like and tower) as the benchmarks and divided the design elements into two categories: architectural form and overhead space design variables. The former included three kinds of slab-like building arrangement quantities (one, two, and three units) and four width-depth ratios (W/D = 1, 1.33, 1.66, and 2); the latter included three overhead forms (complete-overhead, partial-overhead, and semi-overhead types), three overhead floor heights (h = 4, 5 and 6 m), five enclosure positions (one-sided, opposite-two-sided, adjacent-two-sided and three-sided) and three openness degrees (OP = 1–0.75, 0.75–0.5, 0.5–0.25). The main findings can be summarized as follows:
  • The architectural form of overhead residential buildings has a significant impact on the thermal comfort of overhead floors. When the number of building units continuously arranged increases, the overhead floor area has a more comfortable environmental state. In addition, the value of the aspect ratio also has a relatively large impact on thermal comfort. With the increase in the single building aspect ratio, the SET* value tends to be closer to the neutral temperature of the comfort zone.
  • The form and height of the overhead floor have a certain impact on the pedestrian-level thermal comfort. In general, the complete-overhead or large-scale overhead of slab-like building can increase the depth of the overhead floor, so as to improve thermal comfort. The partial-overhead form of slab-like building has the most uncomfortable SET* value (30.1 °C), while the semi-overhead form has the most comfortable SET* value (27.5 °C) among all 25 models. For tower buildings, thermal comfort is not significantly influenced by overhead forms. Additionally, heightening the overhead floors can be conducive to ventilation, but brings in more solar radiation too, thus comprehensively worsening the thermal comfort of space. In the respect of enclosure position and openness degree, for slab-like buildings, when the enclosure position is on the opposite sides, the openness degree of the side interface is 0.75–0.5, the overall thermal comfort can be better. However, the enclosure position rules do not necessarily apply to thermal comfort in the tower building.
  • Oriented by improving the pedestrian-level thermal comfort of the bottom-overhead area of high-rise residential buildings in summer, this paper puts forward some design strategies:
    • Give priority to the use of slab-like building configuration with the aspect ratio of more than 2.0 and with several units continuously arrangement layout.
    • Semi-overhead and complete-overhead forms should be selected as the top preferences, and the height of the overhead area shall be controlled at 4–5 m in combination with the actual design.
    • When it comes to the enclosure construction of the overhead area, give priority to the transparent enclosure. Adopting the opposite-two-sided enclosure position can be a better alternative, but also consider the wind direction of the site to guide the enclosure design. Moreover, the openness degree can be controlled between 0.75 and 0.5.
The above findings and suggestions enrich the knowledge of how building variables influence thermal comfort under overhead buildings, which can help and inspire architects to make good use of design in high-density cities, so as to provide more comfortable summer activity environment for urban residents, and contribute to alleviating the heat island effect, energy conservation and carbon reduction.

Author Contributions

Conceptualization, H.X. and J.W.; methodology, B.L., J.W. and H.X.; software, H.X.; validation, H.X.; formal analysis, B.L. and J.W.; investigation, H.X. and B.G.; resources, J.W.; data curation, H.X. and B.G.; writing—original draft preparation, B.L.; writing—review and editing, B.L. and J.W.; visualization, B.L.; supervision, J.W.; project administration, J.W. All authors have read and agreed to the published version of the manuscript.

Funding

This research received no external funding.

Informed Consent Statement

Informed consent was obtained from all subjects involved in the study.

Data Availability Statement

The data presented in this study are available on request from the corresponding author. The data are not publicly available due to privacy restrictions.

Conflicts of Interest

The authors declare no conflict of interest. The funders had no role in the design of the study; in the collection, analyses, or interpretation of data; in the writing of the manuscript, or in the decision to publish the results.

Nomenclature

CFDComputational Fluid Dynamics
cloThermal resistance of clothing
CVRMSECoefficient of Variance in Root mean Square Error
DBuilding depth
DESDetached Eddy Simulation
GAGenetic Algorithm
hOverhead height
HBuilding height
MetMetabolic equivalent
MVRMean Wind Velocity Ratio
NENorth-East
OPOpenness Degree
OUT_SETOutdoor SET
PETPhysiological Equivalent Temperature
PLWPedestrian-level Wind
PMVPredicted Mean Vote
RHRelative Humidity
RSMResponse Surface Method
SBSlab-like Building
SET*Standard Effective Temperature
SWSouth-West
TaAir temperature
TBTower building
Ta, repRepresentative value of Ta in the overhead area
TskSkin temperature
TSVThermal Sensation Vote
UHIUrban Heat Island
UTCIUniversal Thermal Climate Index
WBuilding width
wSkin wetness
W/DAspect ratio

References

  1. Du, Y.; Mak, C.M.; Tang, B.S. Effects of building height and porosity on pedestrian level wind comfort in a high-density urban built environment. Build Simul. 2018, 11, 1215–1228. [Google Scholar] [CrossRef]
  2. Ng, E.; Yuan, C.; Chen, L. Improving the wind environment in high-density cities by understanding urban morphology and surface roughness: A study in Hong Kong. Landsc. Urban Plan. 2011, 101, 59–74. [Google Scholar] [CrossRef] [PubMed]
  3. He, B.; Ding, L.; Prasad, D. Relationships among local-scale urban morphology, urban ventilation, urban heat island and outdoor thermal comfort under sea breeze influence. Sustain. Cities Soc. 2020, 60, 102289. [Google Scholar] [CrossRef]
  4. He, B.; Ding, L.; Prasad, D. Urban ventilation and its potential for local warming mitigation: A field experiment in an open low-rise gridiron precinct. Sustain. Cities Soc. 2020, 55, 102028. [Google Scholar] [CrossRef]
  5. Du, Y.; Mak, C.M. Improving pedestrian level low wind velocity environment in high-density cities: A general framework and case study. Sustain. Cities Soc. 2018, 42, 314–324. [Google Scholar] [CrossRef] [PubMed]
  6. Cheng, V.; Ng, E.; Chan, C. Outdoor thermal comfort study in a subtropical climate: A longitudinal study based in Hong Kong. Int. J. Biometeorol. 2012, 56, 43–56. [Google Scholar] [CrossRef] [PubMed]
  7. Wong, M.S.; Nichol, J.E. A simple method for designation of urban ventilation corridors and its application to urban heat island analysis. Build Environ. 2010, 45, 1880–1889. [Google Scholar] [CrossRef]
  8. Tse, K.T.; Zhang, X.; Weerasuriya, A.U.; Li, S.W.; Kwok, K.C.S.; Mak, C.M.; Niu, J. Adopting ‘lift-up’ building design to improve the surrounding pedestrian-level wind environment. Build Environ. 2017, 117, 154–165. [Google Scholar] [CrossRef]
  9. Chew, L.W.; Norford, L.K. Pedestrian-level wind velocity enhancement in urban street canyons with void decks. Build Environ. 2018, 146, 64–76. [Google Scholar] [CrossRef] [Green Version]
  10. Chew, L.W.; Norford, L.K. Pedestrian-level wind velocity enhancement with void decks in three-dimensional urban street canyons. Build Environ. 2019, 155, 399–407. [Google Scholar] [CrossRef]
  11. Xia, Q.; Liu, X.; Niu, J.; Kwok, K.C.S. Effects of building lift-up design on the wind environment for pedestrians. Indoor Built Environ. 2017, 26, 1214–1231. [Google Scholar] [CrossRef]
  12. Liu, J.; Zhang, X.; Niu, J.; Tse, K.T. Pedestrian-level wind and gust around buildings with a ‘lift-up’ design: Assessment of influence from surrounding buildings by adopting LES. Build Simul. 2019, 12, 1107–1118. [Google Scholar] [CrossRef]
  13. Du, Y.; Mak, C.M.; Liu, J.; Xia, Q.; Kwok, K.C.S. Effects of lift-up design on pedestrian level wind comfort in different building configurations under three wind directions. Build Environ. 2017, 117, 84–99. [Google Scholar] [CrossRef]
  14. Chen, L.; Mak, C.M. Integrated impacts of building height and upstream building on pedestrian comfort around ideal lift-up buildings in a weak wind environment. Build Environ. 2021, 200, 107963. [Google Scholar] [CrossRef]
  15. Sha, C.; Wang, X.; Lin, Y.; Fan, Y.; Chen, X.; Hang, J. The impact of urban open space and ‘lift-up’ building design on building intake fraction and daily pollutant exposure in idealized urban models. Sci. Total Environ. 2018, 633, 1314–1328. [Google Scholar] [CrossRef]
  16. Zhang, K.; Chen, G.; Wang, X.; Liu, S.; Mak, C.M.; Fan, Y.; Hang, J. Numerical evaluations of urban design technique to reduce vehicular personal intake fraction in deep street canyons. Sci. Total Environ. 2019, 653, 968–994. [Google Scholar] [CrossRef] [PubMed]
  17. Zhang, K.; Chen, G.; Zhang, Y.; Liu, S.; Wang, X.; Wang, B.; Hang, J. Integrated impacts of turbulent mixing and NOX-O3 photochemistry on reactive pollutant dispersion and intake fraction in shallow and deep street canyons. Sci. Total Environ. 2020, 712, 135553. [Google Scholar] [CrossRef]
  18. Liu, J.; Niu, J.; Xia, Q. Combining measured thermal parameters and simulated wind velocity to predict outdoor thermal comfort. Build Environ. 2016, 105, 185–197. [Google Scholar] [CrossRef]
  19. Huang, T.; Li, J.; Xie, Y.; Niu, J.; Mak, C.M. Simultaneous environmental parameter monitoring and human subject survey regarding outdoor thermal comfort and its modelling. Build Environ. 2017, 125, 502–514. [Google Scholar] [CrossRef]
  20. Du, Y.; Mak, C.M.; Huang, T.; Niu, J. Towards an integrated method to assess effects of lift-up design on outdoor thermal comfort in Hong Kong. Build Environ. 2017, 125, 261–272. [Google Scholar] [CrossRef]
  21. Yao, R.; Luo, Q.; Luo, Z.; Jiang, L.; Yang, Y. An integrated study of urban microclimates in Chongqing, China: Historical weather data, transverse measurement and numerical simulation. Sustain. Cities Soc. 2015, 14, 187–199. [Google Scholar] [CrossRef] [Green Version]
  22. Tantasavasdi, C.; Srebric, J.; Chen, Q. Natural ventilation design for houses in Thailand. Energy Build. 2001, 33, 815–824. [Google Scholar] [CrossRef] [Green Version]
  23. Zhang, X.; Tse, K.T. Pedestrian-level wind conditions in the space underneath lift-up buildings. J. Wind Eng. Ind. Aerod. 2018, 179, 58–69. [Google Scholar] [CrossRef]
  24. Zhang, X.; Tse, K.T.; Weerasuriya, A.U. Evaluation of pedestrian wind comfort near ‘lift-up’ buildings with different aspect ratios and central core modifications. Build Environ. 2017, 124, 245–257. [Google Scholar] [CrossRef]
  25. Du, Y.; Mak, C.M. Application of a multi-variable optimization method to determine lift-up design for optimum wind comfort. Build Environ. 2018, 131, 242–254. [Google Scholar] [CrossRef]
  26. Chen, L.; Mak, C.M. Numerical evaluation of pedestrian-level wind comfort around ‘lift-up’ buildings with various unconventional configurations. Build Environ. 2021, 188, 107429. [Google Scholar] [CrossRef]
  27. Weerasuriyaa, A.U.; Zhang, X. Optimizing lift-up design to maximize pedestrian wind and thermal comfort in ‘hot-calm’ and ‘cold-windy’ climates. Sustain. Cities Soc. 2020, 58, 102146. [Google Scholar] [CrossRef]
  28. Du, Y.; Mak, C.M.; Li, Y. A multi-stage optimization of pedestrian level wind environment and thermal comfort with lift-up design in ideal urban canyons. Sustain. Cities Soc. 2019, 46, 101424. [Google Scholar] [CrossRef]
  29. Zhang, Y.; Liu, C. Digital simulation for buildings’ outdoor thermal comfort in urban neighborhoods. Buildings 2021, 11, 541. [Google Scholar] [CrossRef]
  30. Zhao, Q.; Lian, Z.; Lai, D. Thermal comfort models and their developments: A review. Energy Built Environ. 2020, 2, 21–33. [Google Scholar] [CrossRef]
  31. Manob, D.; Arijit, D. Exploring the pattern of outdoor thermal comfort (OTC) in a tropical planning region of eastern India during summer. Urban Clim. 2020, 34, 100708. [Google Scholar]
  32. Hong, B. Numerical studies of the outdoor wind environment and thermal comfort at pedestrian level in housing blocks with different building layout patterns and trees arrangement. Renew. Energy 2015, 73, 18–27. [Google Scholar] [CrossRef]
  33. Fang, Z.; Zheng, Z.; Feng, X.; Shi, D.; Lin, Z.; Gao, Y. Investigation of outdoor thermal comfort prediction models in South China: A case study in Guangzhou. Build Environ. 2021, 188, 107424. [Google Scholar] [CrossRef]
  34. Lai, D.; Lian, Z.; Liu, W.; Guo, C.; Liu, W.; Liu, K.; Chen, Q. A comprehensive review of thermal comfort studies in urban open spaces. Sci. Total Environ. 2020, 742, 140092. [Google Scholar] [CrossRef]
  35. He, B.; Ding, L.; Prasad, D. Wind-sensitive urban planning and design: Precinct ventilation performance and its potential for local warming mitigation in an open midrise gridiron precinct. Sustain. Cities Soc. 2020, 29, 101145. [Google Scholar] [CrossRef]
  36. Wu, Z.; Dou, P.; Chen, L. Comparative and combinative cooling effects of different spatial arrangements of buildings and trees on microclimate. Sustain. Cities Soc. 2019, 51, 101711. [Google Scholar] [CrossRef]
  37. Mehrotra, S.; Subramanian, D.; Bardhan, R.; Jana, A. Effect of surface treatment and built form on thermal profile of open spaces: A case of Mumbai, India. Urban Clim. 2021, 35, 100736. [Google Scholar] [CrossRef]
  38. Nasrollahi, N.; Hatami, M.; Khastar, S.R.; Taleghani, M. Numerical evaluation of thermal comfort in traditional courtyards to develop new microclimate design in a hot and dry climate. Sustain. Cities Soc. 2017, 35, 449–467. [Google Scholar] [CrossRef]
  39. Karimimoshaver, M.; Shahrak, M.S. The effect of height and orientation of buildings on thermal comfort. Sustain. Cities Soc. 2022, 79, 103720. [Google Scholar] [CrossRef]
  40. China Meteorological Administration & Department of Building Science and Technology, Tsinghua University. Special Meteorological Data Set for Building Thermal Environment Analysis in China; China Architecture & Building Press: Beijing, China, 2005. [Google Scholar]
  41. Blocken, B.; Stathopoulos, T.; van Beeck, J.P.A.J. Pedestrian-level wind conditions around buildings: Review of wind-tunnel and CFD techniques and their accuracy for wind comfort assessment. Build Environ. 2016, 100, 50–81. [Google Scholar] [CrossRef]
  42. Bruse, M.; Fleer, H. Simulating surface–plant–air interactions inside urban environments with a three dimensional numerical model. Environ. Model. Softw. 1998, 13, 373–384. [Google Scholar] [CrossRef]
  43. Quah, A.K.L.; Roth, M. Diurnal and weekly variation of anthropogenic heat emissions in a tropical city. Atmos. Environ. 2012, 46, 92–103. [Google Scholar] [CrossRef]
  44. Samaali, M.; Courault, D.; Bruse, M.; Olioso, A.; Occelli, R. Analysis of 3D boundary layer model at local scale validation on soybean surface radiative measurements. Atmos Res. 2007, 85, 183–198. [Google Scholar] [CrossRef]
  45. Taleghani, M.; Kleerekoper, L.; Tenpierik, M.; Dobbelsteen, A.v.d. Outdoor thermal comfort within five different urban forms in the Netherlands. Build Environ. 2015, 83, 65–78. [Google Scholar] [CrossRef]
  46. Wania, A.; Bruse, M.; Blond, N.; Weber, C. Analysing the influence of different street vegetation on traffic-induced particle dispersion using microscale simulations. J. Environ. Manag. 2012, 94, 91–101. [Google Scholar] [CrossRef]
  47. Shi, D.; Song, J.; Huang, J.; Zhuang, C.; Guo, R.; Gao, Y. Synergistic cooling effects (SCEs) of urban green-blue spaces on local thermal environment: A case study in Chongqing, China. Sustain. Cities Soc. 2020, 55, 102065. [Google Scholar] [CrossRef]
  48. Yang, X.; Zhao, L.; Bruse, M.; Meng, Q. Evaluation of a microclimate model for predicting the thermal behavior of different ground surfaces. Build Environ. 2013, 60, 93–104. [Google Scholar] [CrossRef]
  49. Zhang, L.; Zhan, Q.; Lan, Y. Effects of the tree distribution and species on outdoor environment conditions in a hot summer and cold winter zone: A case study in Wuhan residential quarters. Build Environ. 2018, 130, 27–39. [Google Scholar] [CrossRef]
  50. Srivanit, M.; Hokao, K. Evaluating the cooling effects of greening for improving the outdoor thermal environment at an institutional campus in the summer. Build Environ. 2013, 66, 158–172. [Google Scholar] [CrossRef]
  51. Wong, N.H.; Kardinal Jusuf, S.; Aung La Win, A.; Kyaw Thu, H.; Syatia Negara, T.; Wu, X. Environmental study of the impact of greenery in an institutional campus in the tropics. Build Environ. 2007, 42, 2949–2970. [Google Scholar] [CrossRef]
  52. Johansson, E. Influence of urban geometry on outdoor thermal comfort in a hot dry climate: A study in Fez, Morocco. Build Environ. 2006, 41, 1326–1338. [Google Scholar] [CrossRef]
  53. Taleb, D.; Abu-Hijleh, B. Urban heat islands: Potential effect of organic and structured urban configurations on temperature variations in Dubai, UAE. Renew. Energy 2013, 50, 747–762. [Google Scholar] [CrossRef]
  54. Tsoka, S.; Tsikaloudaki, A.; Theodosiou, T. Analyzing the ENVI-met microclimate model’s performance and assessing cool materials and urban vegetation applications—A review. Sustain. Cities Soc. 2018, 43, 55–76. [Google Scholar] [CrossRef]
  55. Fanger, P.O. Thermal Comfort; Danish Technical Press: Copenhagen, Denmark, 1970. [Google Scholar]
  56. Pickup, J.; de Dear, R. (Eds.) An outdoor thermal comfort index (OUT_SET*): Part I: The model and its assumptions. In Proceedings of the 15th International Congress of Biometeorology and International Conference on Urban Climatology, Sydney, NSW, Australia, 8–12 November 1999; Macquarie University: Sydney, NSW, Australia, 1999; pp. 279–283. [Google Scholar]
  57. Höppe, P. The physiological equivalent temperature—A universal index for the biometeorological assessment of the thermal environment. Int. J. Biometeorol. 1999, 43, 71–75. [Google Scholar] [CrossRef]
  58. Jendritzky, G.; Maarouf, A.; Fiala, D.; Staiger, H. An update on the development of a Universal Thermal Climate Index. In Proceedings of the Conference on Biometeorology/Aerobiology & International Congress of Biometeorology, Kansas City, MO, USA, 28 October–1 November 2002. [Google Scholar]
  59. Fiala, D.; Havenith, G.; Bröde, P.; Kampmann, B.; Jendritzky, G. UTCI-Fiala multi-node model of human heat transfer and temperature regulation. Int. J. Biometeorol. 2012, 56, 429–441. [Google Scholar] [CrossRef] [PubMed] [Green Version]
  60. Alfano, F.R.D.A.; Palella, B.I.; Riccio, G. On the Transition Thermal Discomfort to Heat Stress as a Function of the PMV Value. Ind. Health 2013, 51, 285–296. [Google Scholar] [CrossRef] [PubMed] [Green Version]
  61. GAGGE, A.P. An effective temperature scale based on a simple model of human physiological regulatory response. ASHRAE Trans. 1971, 77, 247–262. [Google Scholar]
  62. Nikolopoulou, M.; Baker, N.; Steemers, K. Thermal comfort in outdoor urban spaces: Understanding the parameter. Sol. Energy 2001, 70, 227–235. [Google Scholar] [CrossRef]
  63. Cheng, B.; Fu, Y.; Khoshbakht, M.; Duan, L.; Zhang, J.; Rashidian, S. Characteristics of thermal comfort conditions in cold rural areas of China: A case study of stone dwellings in a Tibetan village. Buildings 2018, 8, 49. [Google Scholar] [CrossRef] [Green Version]
  64. Yang, L.; Yan, H.; Xu, Y.; Lam, J.C. Residential thermal environment in cold climates at high altitudes and building energy use implications. Energy Build. 2013, 62, 139–145. [Google Scholar] [CrossRef]
  65. Jin, Z. Thermal Adaptation Behavior and Thermal Comfort Zone for Chinese Resident. Ph.D. Thesis, Chongqing University, Chongqing, China, 2011. [Google Scholar]
  66. de Dear, R.J.; Brager, G.S. Thermal comfort in naturally ventilated buildings revisions to ASHRAE Standard 55. Energy Build. 2002, 34, 549–561. [Google Scholar] [CrossRef] [Green Version]
  67. Nicol, F.; Humphreys, M. Derivation of the adaptive equations for thermal comfort in free-running buildings in European standard EN15251. Build Environ. 2010, 45, 11–17. [Google Scholar] [CrossRef]
  68. ASHRAE Standard 2004; Thermal Environmental Conditions for Human Occupancy. American Society of Heating, Refrigerating and Air-Conditioning Engineers: New York, NY, USA, 2004.
  69. Du, Y.; Mak, C.M.; Kwok, K.; Tse, K.T.; Lee, T.C.; Ai, Z. New criteria for assessing low wind environment at pedestrian level in Hong Kong. Build Environ. 2017, 123, 23–36. [Google Scholar] [CrossRef] [Green Version]
  70. Wen, C.Y.; Juan, Y.H.; Yang, A.S. Enhancement of city breathability with half open spaces in ideal urban street canyon. Build Environ. 2017, 112, 322–336. [Google Scholar] [CrossRef]
Figure 1. The methodological framework of the study.
Buildings 12 00265 g001
Figure 2. (a) Location of the measured area in Chongqing, China; (bd) Zhongyu I-City, Gongyuan Zhishang, and Shangyu Street Park Alley residential quarters with their measuring points.
Buildings 12 00265 g002
Figure 3. A schematic overview of the ENVI-met model layout. Z shows the height of the main 3D model, H is the height of the 1D model, and D is the depth of the model (soil).
Buildings 12 00265 g003
Figure 4. Aerial and plan views of the simulation model.
Buildings 12 00265 g004
Figure 5. Comparison between measured and simulated values of air temperature and relative humidity from 70:00 to 21:00 on 5 and 9 August, where (a) is the Ta value on 5 August; (b) is the Ta value on 9 August; (c) is the RH value on 5 August; and (d) is the RH value on 9 August.
Buildings 12 00265 g005
Figure 6. Benchmark building model: (a) slab-like building;(b) tower building.
Buildings 12 00265 g006
Figure 7. Schematic diagram of relevant design variables of tested building models (including 3D view of the model, three overhead forms, and five enclosure positions.).
Buildings 12 00265 g007
Figure 8. Statistics of simulation results of 25 building models: (a) air temperature, (b) relative humidity, (c) wind velocity, and (d) SET*.
Buildings 12 00265 g008
Figure 9. Thermal environment simulation visualization results and SET* values of SB0 and TB0.
Buildings 12 00265 g009
Figure 10. Thermal environment simulation visualization results and SET* values of SB1 and SB2.
Buildings 12 00265 g010
Figure 11. Thermal environment simulation visualization results and SET* values of SB3, SB4, TB1, and TB2.
Buildings 12 00265 g011
Figure 12. Thermal environment simulation visualization results and SET* values of SB5, SB6, TB3, and TB4.
Buildings 12 00265 g012
Figure 13. Thermal environment simulation visualization results and SET* values of SB7, TB5, and TB6.
Buildings 12 00265 g013
Figure 14. Thermal environment simulation visualization results and SET* values. (a) SB8, SB9, and SB10; (b) TB7, TB8, and TB9.
Buildings 12 00265 g014aBuildings 12 00265 g014b
Figure 15. Thermal environment simulation visualization results and SET* values of SB11, SB12, TB10, and TB11.
Buildings 12 00265 g015
Table 1. Initial parameters values and conditions used in the simulations.
Parameters and ConditionsFirst DaySecond Day
Simulation day5 August 20219 August 2021
Simulation period24 h (00:00–24:00)
Wind velocity, 10 m above ground1 m/s1.5 m/s
Wind directionNESW
Initial air temperature303 K (=29 °C)304 K (=30 °C)
Relative humidity, at 1.5 m62%59%
Domain size240 × 240 × 30
Grid spatial resolutiondx = 1, dy = 1, dz = 6
Albedo0.5 (roofs), 0.3 (walls)
Thermal conductance0.84 (W/m·K) (roofs), 0.81 (W/m·K) (walls)
Lateral boundary conditions (LBC)LBC for temperature and humidityForced
LBC for turbulenceCyclic
time step1 h
Table 2. Details of the 25 building models.
ModelBuilding (m)Bottom-Overhead Space (m)
Width (W)Depth (D)W/DNumber and ContinuityOverhead FormHeight (h)Enclosure PositionOpenness Degree
SB0301522, no distanceComplete5Opposite sides1–0.75
SB1301521Complete5Opposite sides1–0.75
SB2301523, no distanceComplete5Opposite sides1–0.75
SB324151.662, no distanceComplete5Opposite sides1–0.75
SB418151.332, no distanceComplete5Opposite sides1–0.75
SB5301522, no distancePartial5Opposite sides1–0.75
SB6301522, no distanceSemi5Opposite sides1–0.75
SB7301522, no distanceComplete6Opposite sides1–0.75
SB8301522, no distanceComplete5One side1–0.75
SB9301522, no distanceComplete5Adjacent sides1–0.75
SB10301522, no distanceComplete5three sides1–0.75
SB11301522, no distanceComplete5Opposite sides0.75–0.5
SB12301522, no distanceComplete5Opposite sides0.5–0.25
TB032241.332, with distanceComplete4No side0.75–0.5
TB140241.662, with distanceComplete4No side0.75–0.5
TB2242412, with distanceComplete4No side0.75–0.5
TB332241.332, with distancePartial4No side0.75–0.5
TB432241.332, with distanceSemi4No side0.75–0.5
TB532241.332, with distanceComplete5No side0.75–0.5
TB632241.332, with distanceComplete6No side0.75–0.5
TB732241.332, with distanceComplete4One side0.75–0.5
TB832241.332, with distanceComplete4Opposite sides0.75–0.5
TB932241.332, with distanceComplete4Adjacent sides0.75–0.5
TB1032241.332, with distanceComplete4No side1–0.75
TB1132241.332, with distanceComplete4No side0.5–0.25
Publisher’s Note: MDPI stays neutral with regard to jurisdictional claims in published maps and institutional affiliations.

