Abstract
A rise in the number of EVs (electric vehicles) in Europe is putting pressure on power grids. At an urban scale, Positive Energy Districts (PEDs) are devised as archetypes of (small) urban districts managing a set of interconnected buildings and district elements (lighting system, vehicles, smart grid, etc.). This paper offers a comprehensive analysis of the impact of e-mobility in a PED, simulated using MATLAB-Simulink software. The PED, a small district in northern Spain, is assessed in five scenarios representing varying requirements in terms of energy efficiency of buildings, type of street lighting and number of EVs. The results suggest that the energy rating of the buildings (ranging from A for the most efficient to E) conditions the annual energy balance. A PED with six interconnected buildings (3 residential and 3 of public use) and 405 EVs (as a baseline) only achieves positivity when the buildings have a high energy rating (certificate A or B). In the most efficient case (A-rated buildings), simulation results show that the PED can support 695 EVs; in other words, it can provide nearly 9 million green kilometres. This result represents a potential 71% saving in carbon emissions from e-mobility alone (as compared to the use of fossil-fuel vehicles), thus contributing a reduction in the carbon footprint of the district and the city as a whole.
1. Introduction
In the long fight against climate change, one of the most pressing issues that needs to be tackled to make cities more sustainable and eco-friendly is mobility; in 2018, road transport accounted for 15% of total CO2 emissions, at 8.26 Gt [], coming a close third to electricity and heating []. Replacing the highly polluting fossil-fuel transport sector with the new paradigm of electrified transport, with the introduction of EVs (electric vehicles), is now one of the clear strategies of the European Union and offers a satisfactory solution for attaining climate neutrality, since it would significantly reduce the use of fossil fuels []. However, a major increase in the number of EVs would significantly impact the electrical sector, possibly requiring resizing of the utility grid [].
The roll-out of e-mobility is expected to drive a rise in demand for electricity. In California, for example, an increase of about 50% in demand (from 280 TWh to 420 TWh) is forecast by 2045 as a result of the electrification of demand, particularly in e-mobility (EVs). This will be accompanied by increased power production from renewables (photovoltaic, wind, geothermal, biomass, etc.) []. The move to e-mobility has the backing of the International Energy Agency’s Net Zero by 2050 Roadmap for the Global Energy Sector [], which envisages a major increase in uptake in EVs from a current figure of 5% of sales to 60% by 2040. This report is closely in line with other EU proposals.
The introduction of EVs offers greater flexibility, since they can be used to store energy surpluses in order to flatten the surge caused in hours of highest energy demand []. Smart charging hubs are easily integrable in cities []. They function not only as a load, using electricity to recharge batteries, but also as a means of levelling out or reinforcing electricity demand during certain time periods when the capacity of the storage system is exceeded or when power from the grid is more expensive []. Some research also suggests that the use of smart EV-charging hubs would greatly reduce the cost of reinforcing electricity distribution grids [] within the low-carbon transition roadmap.
It is important to get to know the demand pattern of EVs [] and each of the factors that condition the curve of charge, including the voltage level of the charging hubs as well as the number of EVs that are connected to a single charging station. The distribution of the EV demand can be described by probabilistic models [] that consider several spatial-temporal variables to understand not only the travel patterns of a certain population but also social and demographic attributes. In this respect, the usage of charging infrastructure at residential locations (in a very distributed manner) can have a real impact on the entire infrastructure. Other modelling proposals use a Rule-based Energy Management System (REMS) [] to implement an intelligent control strategy that decides whether the energy surpluses are stored in an Energy Storage Unit or sold to the grid depending on the most convenient economic strategy. A recursive challenge for the optimisation of energy storage systems has to do with dynamic management of demand. A demand response (DR) model has been proposed [] to characterise the usage of a set of 9 chargers that represent different characteristics in terms of power and charging speeds. The model reproduces the DR of the charging system to the EVs, keeping track of successful charging events and comparing various scenarios of charging configuration. The study concludes that DR models allow reducing the maximum available charging power.
When a DR approach is implemented, EVs play a key role in increasing the flexibility of microgrids [,], contributing to relieving fluctuations in renewable energy generation []. For example, a Swedish case study [] provides a comparison between distributed and centralised charging approaches to determine optimal EV charging schedules, with the aim of increasing photovoltaic (PV) self-consumption and reducing peak loads. An optimal PV-EV sizing framework [] is presented for solar powered charging stations, considering load matching performances. The study’s findings show that self-consumption is improved when community level strategies are taken into consideration. In this regard, recent contributions [,,] stress the importance of evaluating the impact of EVs at district or city level. It is also recognisable the effect of environmental variables at the charging speed of batteries. In this sense, regression models [] can be used to understand the effect of certain operational variables (daytime, season of the year and peak demand hours) in the charging speed, which can drop by up to 10%. While the power curves generated by EVs’ demand have been largely analysed, their effect in terms of energy balances is still under study.
The precise definition of a Positive Energy District (PED) is still being decided on; [], for example, states that a “PED is seen as a district with annual net zero energy import, and net zero CO2 emission working towards an annual local surplus production of renewable energy”, whereas [] defines PEDs as “energy-efficient and energy-flexible urban areas or groups of connected buildings which produce net zero greenhouse gas emissions and actively manage an annual local or regional surplus production of renewable energy. They require integration of different systems and infrastructures and interaction between buildings, the users and the regional energy, mobility and ICT (Internet and Communications tools) systems, while securing the energy supply and a good life for all in line with social, economic and environmental sustainability”. The concept of the PED introduces options such as energy efficiency and energy balances at a district scale and, therefore, includes district elements such as e-mobility (electric bikes, cars and buses []). In broad terms, a PED is defined as a district that produces more energy than required to meet its own energy demands [].
The concept of PED is directly connected to the analysis of annual (or monthly) energy balances. However, few studies analyse energy balances at the building or district level [,]. In the case of building-level, the energy balance is bounded to the energy performance of the building and this is a consequence of the thermal isolation profile and the efficiency of equipment. An analyses conducted in France [], where three out four quarters of the electricity is provided by nuclear power plants, shows that the heat pump is the most preferable heating solution. The research revealed that new eco-friendly buildings (passive houses) have a higher performance than renovated buildings []. Simulation based analysis would facilitate the evaluation of different options for old or retrofitted buildings (inclusion of PV, geothermal, etc.) and their difference in terms of energy performance with new buildings.
At a districts-level, some analyses are focused on the analysis of primary energy factors, while they neglect the connectivity with the utility grid []. Indeed, the PED concept has a higher economic net present value (NPV) than solely buying electricity from the grid [] and this can be noticed at different geographical distribution of charges (both urban and rural neighbourhoods). A simulation analysis of PV technology shows that NPV can increase from 29% to 31% and from 25% to 27% depending on household characteristics when optimising ESS. Indeed, optimising the ESS performance is clue not only in terms of economic performance [] but also when trying to improve the autonomy of the area []. Improving the distribution rates among buildings generally implies important changes in the topological configuration of the network, but facilitates a shared use of RES and can support the exchange (import/export) of energy outside the PED boundaries []. A study undertaken in European countries [] is clear with respect to energy performance, and after assessing 8 cities they conclude that districts with a population density over 200 in/ha in northern Europe would not achieve energy balance results required by Net Zero Energy Districts (NZED).
Concepts such as a Positive Energy District (PED) or Net Zero Energy District (NZED) are connected to self-sufficiency and, therefore, to the adoption of local generation models []. The insertion of RES is a promising solution, but seasonal patterns should be considered [,] and connected (as much as possible) with the seasonal demand. The mismatch between the local generation and demand is generally overcome by hybridizing the systems [] and alleviated by automatic control systems []. It can also be managed by physical storage systems [] as in a case analysis in Finland where a heat recovery/excess produced during summer is accumulated and used during winter. Analysing district possibilities in terms of self-sufficiency or as energy providers (following a PED concept) is a very new area of research that should be encompassed by in-field analysis [] as well as more theoretical studies or simulation-based exploratory studies.
Energy modelling at a PED scale is a new area of research and only a small number of publications are so far available in the field. Some cutting-edge analysis [] assesses the self-sufficiency of an urban area (district) by examining four test scenarios with varying percentages of PV (ranging from 30% to 50% of the total area), with and without an energy storage system (ESS). This research suggests that ESSs guarantee higher rates of energy distribution among virtually or physically connected buildings, with an impact of nearly 10–15% compared to the production-only scenario (i.e., without ESS). Another model-based analysis [] makes a set of simulations to analyse monthly and annual energy balances at a PED scale, using the energy rating of the buildings as the determining factor. The results appear to confirm that it is feasible to build a PED integrating RES provided that only high-efficiency buildings are included. When moving to the district level, or analysing a set of interconnected buildings, it is important to examine qualitative aspects [] such as a shortage of professionals, lack of public knowledge, or insufficient governmental and institutional support. Other challenges to be overcome include economic and financial feasibility, and other legal, regulatory, environmental and cultural/social aspects []. Holistic studies that combine quantitative and qualitative methods may be of help when it comes to communication with the various stakeholders and can, for example, provide evidence to support the introduction of PEDs as a central concept in urban action plans [].
The literature review shows a clear research gap between the analysis of energy performance at a building or district level and the analysis of EVs’ energy demand and charging infrastructure. We have not found a simulation-based analysis where the district is defined not only as a set of buildings, but also including other urban elements, such as the lighting system or the EVs. The main research gap filled by this article is, therefore, the completion of a quantitative simulation-based analysis assessing the impact of e-mobility in PEDs. This research defines a PED archetype or PED model by assessing the capacity of energy balances to support e-mobility. The case study represents an urban area in northern Spain that shares characteristics with many European cities. This makes the results easy to apply to areas with similar climate conditions. The main limitations of this study include the analysis about the distribution of charges among multiple ESS units. Additionally, the inclusion of the Vehicle2Grid concept is not considered.
The paper is divided into four main sections. Section 2 (Material and Methods) presents the design of the simulation environment, the data, and corresponding references, as well as the methodology used to assess the PED to enable replicability of the experiments. Section 3 sets out the results of the simulation and provides a comparative analysis in terms of energy balances and carbon footprint. Section 4 offers a critical analysis that enables our results to be related to other recent studies. Finally, Section 5 sets out the main conclusions and requirements for future research.
2. Material and Methods
This section presents all the aspects taken into consideration in building the simulation environment. The PED archetype represents an urban district in northern Spain. It therefore uses irradiance values for an oceanic climate and Spanish parameters of building efficiency rates, building usage, energy consumption patterns, number of vehicles, etc.
2.1. Data Used and Case Study
2.1.1. Data Used in the Simulation
The irradiation patterns were collected from the PVGIS database, from which we have extracted the profiles for an oceanic climate in northern Spain []. Figure 1 shows the solar generation capacity of the area in which the district is located. The months of greatest irradiance are April to August (Figure 1), with maximum irradiance values of around 70%, using Standard Test Conditions (STCs) for PV facilities (Air mass = 1.5, Temperature = 25 °C, and Irradiance = 1000 Wh/m2). It is clear from Figure 1 that the month with the greatest irradiance in Bilbao is May, with a peak between 13:00 and 15:00.
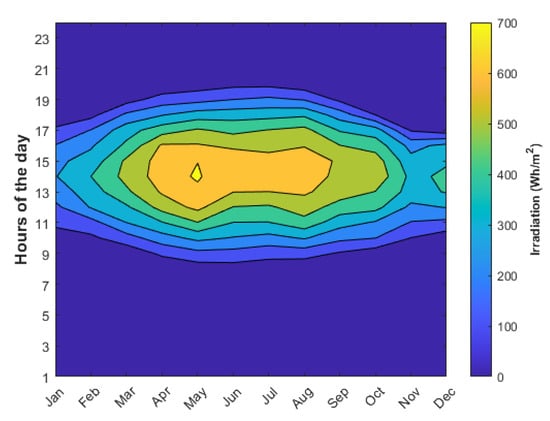
Figure 1.
Heat map of the location of the PED.
2.1.2. Case Study Used for the Experimentation
This study defines a PED archetype that includes: (a) six facilities, three entirely new residential buildings, and three renovated public buildings []; (b) a smart grid handling the energy provided by PV panels (monocrystalline technology); (c) electrochemical (Li-Ion) energy storage systems (ESSs) based on a communitarian (centralised) dispatch; (d) EVs (electric vehicles); and (e) smart lighting systems and other communication and sensing services.
2.1.3. Electricity Consumption Profiles of Buildings
We consider a total of six buildings, three for residential use (RU), and three for public use (PU)—i.e., universities, offices, museums, etc. The buildings are assumed to vary in size and, therefore, have different levels of consumption. In each case, they are designated as B1, B2, B3 (Building 1, Building 2, and Building 3). Daily patterns of electricity consumption were obtained from Red Eléctrica Española (REE), implementing the coefficients for the two types of building [].
2.1.4. Thermal Energy Demand of Buildings
The heating system operates only during the winter months (120 days, from December to March) with fixed hours of 17:00–24:00 for residential buildings and 07:00–16:00 for public-use buildings. The energy efficiency of the buildings is based on the efficiency performance featurisation of the Spanish Public Agency Instituto para la Diversificación y Ahorro de la Energía (IDAE) [], corresponding to Article 7 of the Energy Performance of Buildings Directive (EPBD, Directive 2010/31/EU) [].
2.1.5. Experimental Assumptions for the Case of Use
Electric-mobility consumption is based on the charge curve of the Volkswagen ID3 [], which is considered to be an average European EV. The average trajectory of a car (aged under 4 years) in Spain is about 12,947 km/year [], and average EV energy consumption is 13 kWh per 100 km []. We assume an average of 50–60 households per building and, therefore, a total of 405 EVs in the PED.
Figure 2 shows the electricity demand of residential-use (RU) buildings (at the top), where two peaks can be identified; the electricity demand of public-use (PU) buildings, with a relatively even demand in the central hours of the day; and energy generation from PV technology with a clear peak at around 14:00. There therefore appears to be a match between the combined demand peaks of residential and service buildings and the peak in generation from the PV system. The amount of PV energy available is strongly conditioned by the efficiency of the PV modules. Figure 2 shows the total energy available from the roof of one building (500 m2), which represents the solar profile of the city without taking into account the efficiency of the PV modules. This is input data, to which the simulation tool applies the efficiency rate of the PV technology (16%, see Section 2.2).
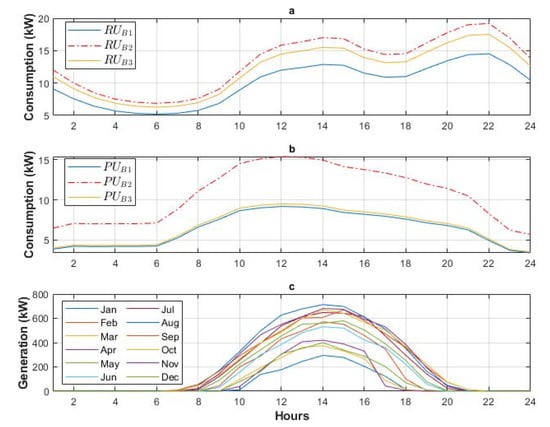
Figure 2.
Daily consumption pattern of the buildings, and pattern of PV generation: (a) Top: consumption pattern of residential-use (RU) buildings; (b) Centre: consumption pattern of service or public-use (PU) buildings; (c) Bottom; daily PV generation pattern (one day per month).
2.2. Simulation Tool
The PED model has been developed in MATLAB-SIMULINK, release 2021a, which mimics generation and consumption energy profiles in the PED, modelled by using daily electricity profiles based on an hourly scheme. Figure 3 shows the elements of the PED, namely: 6 buildings with 6 rooftop solar arrays (PV, 500 m2 each), 1 network of geothermal rings for the PED (heat pump based), 12 EV charging points as baseline and 1 auxiliary system or ESS. All elements of the PED (such as the photovoltaic array, ESS, and EV) are connected via a 240 V/50 Hz bus. The PED model is shown in Figure 3. The different systems considered are as follows:
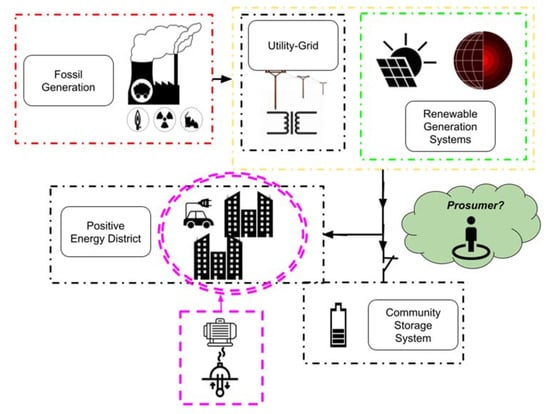
Figure 3.
Main elements considered in PED simulation model.
- The PV arrays cover the rooftops of the buildings, giving a total surface of 3000 m2. The Monocrystalline Silicon technology employed provides an efficiency of 16%.
- The low temperature geothermal network is made up of 3 interconnected rings. The thermal heat is transformed into electricity by means of a set of 2 heat pumps with a COP (coefficient of performance) of 4.7.
- The district is considered to have 20 smart lighting units of 250 W/unit in the case of traditional lamps and 50 W/unit for LEDs.
- The EV charging infrastructure utilises the 2.3 kW rated power charger [] generally used in residential installations. Depending on the number of EVs simulated, we assume charger hubs of 28 kW (12 charging points) or 48 kW (21 charging points). Public transport and public-use chargers are not considered in this analysis.
- The Energy Storage System (ESS) uses an ancillary system with an installed capacity of 252 kW.
2.3. Methodology Applied in the Evaluation
The methodology used to measure the impact of e-mobility on urban areas in a PED approach consists of considering all demand and local RES generation. Based on the district structure and operational conditions (in terms of number of residents, economic activity, services provided, etc.), 405 EVs are assumed to be sufficient to satisfy the district’s mobility requirements. As the energy is produced within the confines of the PED, the charging point is considered to be residential.
The electrical assessment is carried out using Ohm’s law. Demand and generation are then calculated in terms of power (watts), P = V2/R. To evaluate the positivity of the district, the most suitable option is to use Kirchhoff’s Law for the nodes (currents), as in Equation (1) below.
where:
- —the consumption of each of the 6 buildings that compose the PED
- IUG—the current drawn from the utility grid
- IPV—the photovoltaic current generated
- IESS—the current of the ESS
- IEV—the current demanded by the EV charging port
3. Results
The results present monthly and annual energy balances of a PED archetype, where archetype is defined as a PED model that can represent many (small) urban districts in Europe. In this case, the PED archetype comprises a set of six interconnected buildings sharing district infrastructures, such as smart lighting and e-mobility chargers. The energy balances of this PED archetype are assessed in five scenarios. In terms of renewable energy generation, the PED consists of thermal energy produced by a geothermal system and electricity energy produced by PV modules. The geothermal energy generation is considered to be constant and generated from low-temperature geothermal rings using two heat pumps with a COP of 4.7. The PV array covers a total surface area of 3000 m2 on South-oriented roofs with a 30° inclination. While the geothermal energy generation is always available and depends only on the demand pattern, the PV generation follows a clear daily pattern that varies according to the season of the year (see Figure 2).
The energy requirements vary across the five scenarios representing buildings of different energy ratings, the use of conventional or smart lighting systems (20 lamp units) and the addition of different numbers of EVs. In this regard, we use a fleet of 405 EVs as a test-bed simulation; if the PED proves to have a positive energy balance, we use that energy surplus to charge extra EVs, thus exporting energy out of the PED in the form of green kilometres. This analysis allows PEDs to be assessed not only in terms of self-consumption, but also as energy providers to other areas of the city.
Table 1 shows the simulation results. Each column contains information on the principal characteristics of the scenario in question: energy efficiency of buildings; inclusion of RES; number of EVs supported, etc. It also presents the simulation results of energy balances (kWh) and total emissions saved (tonnes CO2eq) on an annual basis. The simulation analysis uses a varying building energy rating (BER), where A represents the best energy performance and E the poorest (the better the performance, the more efficient the building). Annual energy balances are given together with the number of EVs supported by the PED and the carbon emissions saved through the use of e-mobility or the integration of RES. The provision of EVs avoids the use of other fuels (petrol and diesel). Thus, the more EVs in the district, the more the carbon footprint is reduced. Similarly, the integration of RES (geothermal and photovoltaic generation) is compared with the consumption of natural gas for thermal energy and the use of the utility grid for electricity, in order to analyse the potential of the PED to reduce the carbon footprint.

Table 1.
Results of experimental scenarios for the modelled PED.
The results of the simulation highlight the fact that the overall energy balance of the district is conditional on the energy rating of the buildings. As expected, Scenario 1 presents the poorest energy performance, with a negative annual energy balance of −7652 kWh. This scenario represents a building stock that was built more than 50 years ago and was, therefore, not designed with any energy efficiency criteria. In Spain, more than six million buildings (out of a total of twenty-five million) have an energy certification of between D and G []. Scenario 2 (Building Energy Rating D) shows a 13% improvement in overall annual energy balance compared to Scenario 1. In terms of mobility, the number of EVs remains the same and, consequently, the savings in emissions (12,855 tonnes of CO2eq) is also the same (compared to a scenario in which vehicles run on diesel). However, the emissions saved by the use of RES are smaller, since less thermal energy is needed than in Scenario 1 and, therefore, this situation (Scenario 2) represents a district with reduced consumption and a lower potential for emissions reduction than when natural gas is used. Moving to Scenario 3, where the buildings have a better energy rating, the annual energy balance is still negative but there is a 17% improvement on Scenario 2. This is mainly due to the energy rating of the buildings (C), given that the inclusion of LEDs cuts only about 0.53% of total annual energy demand. The effect of energy efficiency in buildings is clear, and only Scenarios 4 and 5 have a positive annual balance. This energy surplus is mainly used to support more EVs and, therefore, to increase the district’s capacity to supply the city with green kilometres. Indeed, improving the BER from B to A (Scenarios 4 and 5) results in a significant increase in the number of EVs (over 20%, from 550 to 695), with a subsequent reduction in carbon emissions from mobility of around 4600 tonnes of CO2eq (a 20% reduction).
The last scenario, Scenario 5 (A-rated buildings) characterises a district where buildings are well oriented and designed, are fully insulated on both facades and roofs, and actively and passively make use of high-performance installations and renewable energies. In this case, the potential for CO2eq savings from the use of RES is very low (349 tonnes of CO2eq /year) since the buildings can be characterised as having near-zero energy consumption—in other words, the PED is a near-passive district. This low potential for carbon reduction through RES use is made up for by a high potential for carbon reduction in mobility. Indeed, the energy savings of 2530 kWh in Scenario 5, as compared to Scenario 4, would increase the district’s capacity to support e-mobility, with a subsequent significant increase in carbon emissions avoided (4594 tonnes CO2eq).
The total emissions saved (last column of Table 1) shows the potential of a PED to reduce the carbon footprint of the district (and thus the city). These values (the sum of the emissions saved through e-mobility and the use of RES) remain quite constant across all the five scenarios. Indeed, the district’s potential for saving CO2eq is proportional to the energy required by the district. In the first three scenarios, total emissions are reduced because the efficiency of the buildings is improved and, therefore, less electrical and thermal energy is required. When the energy generated by the PED exceeds the total energy demand (Scenario 4) we start increasing the e-mobility and computing the potential savings in terms of mobility, and thus the total value of the potential for carbon reduction begins to increase once more. Finally, the total energy generated from RES is used by a combination of demand sources (buildings, lamps, and vehicles), which gives a slightly different potential in terms of carbon emission savings. In other words, the carbon emissions initially saved through the use of renewables in buildings (and the avoidance of using natural gas and the utility grid) is later (in Scenarios 4 and 5) converted into carbon emissions reduced through the introduction of EVs, which avoid the use of fossil fuels.
Figure 4 shows the distribution of monthly energy demand in terms of electricity (top line) and overall net energy balances (bottom line). Due to space limitations, the columns only show Scenarios 1, 4 and 5. Scenario 1 represents a district where the greatest demand is represented by direct electricity consumption in buildings (53.77%). The heating systems present a thermal demand (here represented by the consumption of heat pumps) that only operates during the winter months (120 days/year), in annual terms, representing 41.74% of total thermal demand. Street lighting accounts for very little consumption (2.32%) and e-mobility in the district accounts for 2.17%. Scenario 4 shows a district with a better energy performance of buildings. This is mainly reflected in a reduction in demand for thermal energy. The greatest demand (519 MWh/year, 73.36%) comes from direct electricity consumption in buildings; the second highest (155.49 MWh/year or 21.99%) from heat pumps and the lowest energy demand is from EVs (28.41 MWh/year or 4.02%) and lighting systems (4.48 MWh/year). In the latter case, there is a significant 80% reduction in consumption through the replacement of conventional lighting by LED technology. Finally, Scenario 5 shows the district with the highest performance, where all buildings are A-rated. In this case, the PED could export 3094.13 kWh/year if it only powered 405 vehicles. Expressed in different terms, it is capable of maintaining a positive annual balance (2670.94 kWh/year) and powering a total of 700 EVs, 42% more than in Scenario 4.
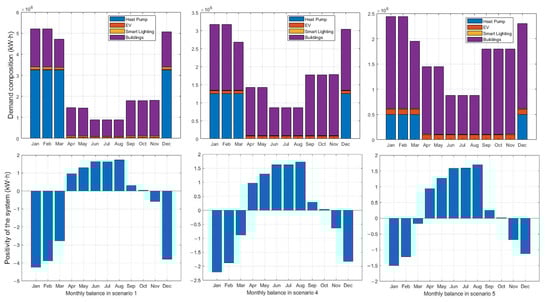
Figure 4.
Monthly energy balances and PED demands for Scenario 1, Scenario 4 and Scenario 5.
In terms of monthly energy balances (Figure 4, bottom line), it is important to note that all scenarios (even those with the poorest energy performance) have a positive balance throughout seven months of the year (April through October). During this ‘extended summer’ the irradiance profile in Spain is capable of enabling the self-consumption of electricity in a small district where all roofs are fitted with PV (3000 m2 installed). As energy insulation improves (from Scenario 1 to Scenario 5), the electricity required by the heat pump decreases and the overall energy balance improves. This is further (though not decisively) helped by the introduction of LED technology for street lighting. Other factors that would help include a reduction in direct electricity consumption in buildings, which could be facilitated by awareness-raising campaigns.
In terms of electricity, we assume that EVs are charged from 07:00 to 10:00. This EV demand is added to the thermal and electricity demand of buildings, as shown in Figure 2. Figure 5 shows the State of Charge (SOC) of the batteries together with the highest electrical power demand from EVs (%kW) in Scenario 1 and Scenario 5. In the first case, EV power demand reaches a maximum value of 28 kW and the ESS supports the district’s energy demands in all cases except in December, January, and February. In winter months the SOC falls to zero at 16:00 and the system is connected to the utility grid. In Scenario 5, EV power demand reaches a maximum value of 48 kW, and the PED proves self-sufficient in all months except January, when the district would be connected to the general grid.
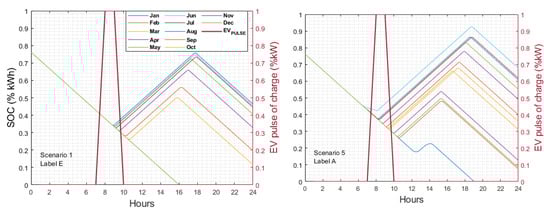
Figure 5.
Monthly SOC variation and highest power demand from e-mobility in Scenario 1 and Scenario 5.
4. Discussion
The impact of e-mobility in a Positive Energy District has been assessed by examining five scenarios illustrating a range of operating conditions. This simulation analysis is based on a PED model that assumes:
- -
- A relatively small rooftop surface is available in relation to the energy demands of a building with 50–60 dwellings.
- -
- With appropriate PV orientation, irradiance values generate a considerable amount of energy (671 MW/year/m2).
- -
- Urban districts are made up of a balanced mixture of residential and public use buildings, with different patterns of energy demand. The most common situation is that electricity is provided by the general grid and thermal energy by natural gas.
- -
- Mobility patterns suggest that an average family uses 1.4 vehicles, and that each vehicle covers 12,947 km/year. The regular vehicle fleet in Spain is made up of fossil fuel vehicles.
The simulation-based analysis examines the circumstances under which the generating capacity (including ESS storage) of the PED can meet the e-mobility requirements of local inhabitants. In this regard:
- It is worth noting that scenarios with buildings with an energy rating of A or B achieve the targeted annual positivity. Only these scenarios can be considered as PEDs. Although the building requirements for an A or B rating are very high, these might be compensated for by other district measures not considered in this analysis, such as the flexibility provided by the use of optimisation tools, trading mechanisms, etc.
- Scenarios 1 to 3 do not achieve positivity; they feature older, low-efficiency buildings. In these cases, the energy deficit ranged from 4191.88 kWh/year to 7652.83 kWh/year, which includes the power demand of 405 EVs as an intrinsic part of the district. In terms of the power signal, the ESS considered (252 kW installed of Li-Ion technology) would not be enough to support demand in winter months. The reduction in carbon emissions due to e-mobility was equivalent to 12,885.44 tonnes of CO2eq as compared to vehicles running on fossil fuels (diesel and petrol). In Scenario 3, a positive annual energy balance would not be achieved even if the demand from the EVs were avoided (−3571.12 kWh annual balance).
- Scenario 4 consists only of B-rated buildings and includes LED street lighting and e-mobility. It can generate an energy surplus of 141.43 kWh. This small quantity of energy exported outside the bounds of the PED means that the district can supports 550 EVs (based on average annual Spanish vehicle usage), equivalent to about 6,907,807 green kilometres. In this regard, about 17,450.76 tonnes of CO2 is saved by replacing 550 fossil cars with their equivalent EVs. Of course, this extra energy could open new opportunities in terms of energy trading or other energy related businesses [].
- Scenario 5, where all buildings have an A rating (highly efficient new constructions), will produce about 2670.94 kWh annual net energy surplus. Alternatively, it can supply the power demand of 695 EVs, equivalent to 8,728,956 green kilometres. It can also be measured as mobile energy storage, to be used inside or outside the PED. Daily demand pattern analysis shows that the ESS would require fine-tuned control (or an updated design) since it does not meet the energy demand in January. In annual terms, this scenario avoids 22,044.45 tonnes of CO2 emissions through the replacement of 695 fossil fuel cars by EV equivalents alone. The energy surpluses in Scenario 5 again open an opportunity to build energy communities that trade in energy, in line with prosumer behaviour (Figure 3).
- Figure 6 shows the relation between emissions saved by e-mobility, the annual balance of the PED in the five scenarios, and the emissions of each one. It can clearly be seen that positivity is achieved in Scenario 4 (B-rated buildings). This scenario features a PED that not only achieves positivity, but also cuts total emissions (by about 71% compared to Scenario 1, E-rated buildings). These profound renovations transform the district into an eco-friendly urban area []. Moreover, for Scenario 4 (Building certification B), we analyse the impact of e-mobility on the total energy balance of the district. When diesel and petrol are used, emissions from cars come to about 17,000 tonnes of CO2 for 550 cars.
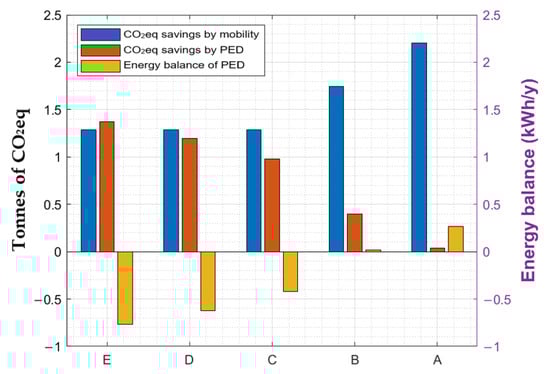 Figure 6. Effect of improved building energy rating on direct emissions saved by e-mobility and by the PED as a whole.
 - Figure 6 also shows that as the building energy (label) rating improves, the overall annual energy balance becomes positive. This translates into a greater reduction in carbon emissions from mobility since more EVs would be supported by the PED. In parallel, as the energy performance in buildings increases (from an E to an A rating), total energy demand decreases, with a subsequent reduction in savings through the use of renewable energy (geothermal and PV) as opposed to traditional sources (natural gas and the electricity grid). Nonetheless, this is still good news, since lower investment is required in renewables, a concept linked to the concept of the a Passive House or Passive District [].
5. Conclusions
This simulation-based analysis examines the monthly and annual net energy balances of five scenarios with different configurations of energy efficiency in buildings (as represented by the Spanish energy rating system), street lighting systems and number of electric vehicles. For an archetype model of an urban district comprising 6 buildings, 20 streetlights and 405 EVs, only those scenarios with a high energy performance in buildings had a net annual positive balance, while all of them enjoyed positive balances during an ‘extended summer’ period of seven months.
The results suggest that it is feasible to attain positivity in the energy performance of the district (i.e., to create a Positive Energy District or PED) in a city in northern Spain if local generation is provided by geothermal and photovoltaic energy and a high energy performance of buildings is ensured. Indeed, for districts made up of A and B-rated buildings (buildings designed using energy efficiency criteria that implement passive and active management strategies), the PED could export energy in the form of e-mobility. These promising scenarios satisfy district demands, provide 6,907,807 to 8,728,956 green kilometres to other areas of the city, and save 17,450–22,044 tonnes of CO2eq through the use of EVs alone (as opposed to fossil fuel-based mobility). While the average Spanish energy rating is low (between classes D and G), advancing to higher standards (between A and B) would be a promising move, since it would lead to important savings in net energy consumption (10,322 kWh/year) and total carbon emissions (13,370 tonnes CO2eq/year).
Possible lines of future research might include continuing the analysis of PEDs and improving the power and energy balance profiles by:
- -
- Analysing different strategies for decreasing direct electricity consumption in buildings. An agent-based simulation capable of tracking human behaviour would facilitate such an assessment.
- -
- Providing a dynamic management of energy storage systems by using automatic control strategies to improve the results for power and better deal with daily and demand patterns.
- -
- Making use of the flexibility that EVs can provide and implementing Vehicle2Grid strategies, which would flatten energy demand peaks.
The energy transition is resulting in a new generation of projects which take the district (‘Positive Energy District’) as their main operational unit. Districts should, therefore, be viewed not only as the sum of their buildings, but should also take into consideration street elements and city fluxes as crucial elements of analysis. This analysis of energy performance in five urban scenarios clearly shows to what extent e-mobility can benefit urban districts and the overall profile of cities.
Author Contributions
Conceptualisation and visualisation, A.A.-V.; data curation, investigation, software, writing and formal analysis, T.C.-C.; analysis of results and validation, C.E.B.; methodology, funding acquisition, research supervision, and writing—review & editing, C.M. All authors have read and agreed to the published version of the manuscript.
Funding
This research has received funding from the European Union’s Horizon 2020 research and innovation programme under the grant agreement No. 891943.
Institutional Review Board Statement
Not applicable.
Informed Consent Statement
Not applicable.
Data Availability Statement
The data used for this simulation based analysis are uploaded for free download at https://zenodo.org/record/6226993#.YhUVMujMK70.
Acknowledgments
University of Deusto thanks ATELIER—Amsterdam-Bilbao citizen driven smart cities Innovation Action funded under H2020 programme (Grant Agreement No. 864374).
Conflicts of Interest
The authors declare no conflict of interest.
References
- IEA. Global CO2 Emissions by Sector, 2018—Charts—Data & Statistics—IEA. 2020. Available online: https://www.iea.org/data-and-statistics/charts/global-co2-emissions-by-sector-2018 (accessed on 14 July 2021).
- C2ES. Global Emissions: Center for Climate and Energy Solutions; Center for Climate and Energy Solutions: Arlington, VA, USA, 2016; Available online: https://www.c2es.org/content/international-emissions/ (accessed on 14 July 2021).
- Seyboth, K.M.; Sverrisson, F. Renewables 2016 Global Status Report; REN21: Paris, France, 2016; ISBN 978-3-9818107-0-7. [Google Scholar]
- SmartGrids SRA 2035 Strategic Research Agenda Update of the SmartGrids SRA 2007 for the Needs by the Year 2035. Available online: https://www.etip-snet.eu/wp-content/uploads/2017/04/sra2035.pdf (accessed on 25 November 2021).
- Purohit, S.; Energy, W.; Purohit, S. Front-Loading Net Zero; Wärtsilä Energy: Paris, France, 2021; Available online: http://www.wartsila.com/brandhub/marketing-material#inpage-anchor-9 (accessed on 21 November 2021).
- Cozzi, L.; Gül, T. Net Zero by 2050: A Roadmap for the Global Energy Sector; International Energy Agency: Paris, France, 2021. [Google Scholar]
- Fichera, A.; Pluchino, A.; Volpe, R. Modelling Energy Distribution in Residential Areas: A Case Study Including Energy Storage Systems in Catania, Southern Italy. Energies 2020, 13, 3715. [Google Scholar] [CrossRef]
- Howell, S.; Rezgui, Y.; Hippolyte, J.-L.; Jayan, B.; Li, H. Towards the next generation of smart grids: Semantic and holonic multi-agent management of distributed energy resources. Renew. Sustain. Energy Rev. 2017, 77, 193–214. [Google Scholar] [CrossRef]
- Capasso, C.; Veneri, O. Experimental study of a DC charging station for full electric and plug in hybrid vehicles. Appl. Energy 2015, 152, 131–142. [Google Scholar] [CrossRef]
- Pearson, P.J.; Foxon, T.J. A low carbon industrial revolution? Insights and challenges from past technological and economic transformations. Energy Policy 2012, 50, 117–127. [Google Scholar] [CrossRef]
- Mies, J.J.; Helmus, J.R.; Hoed, R.V.D. Estimating the Charging Profile of Individual Charge Sessions of Electric Vehicles in The Netherlands. World Electr. Veh. J. 2018, 9, 17. [Google Scholar] [CrossRef]
- Zhang, J.; Yan, J.; Liu, Y.; Zhang, H.; Lv, G. Daily electric vehicle charging load profiles considering demographics of vehicle users. Appl. Energy 2020, 274, 115063. [Google Scholar] [CrossRef]
- Bhatti, A.R.; Salam, Z. A rule-based energy management scheme for uninterrupted electric vehicles charging at constant price using photovoltaic-grid system. Renew. Energy 2018, 125, 384–400. [Google Scholar] [CrossRef]
- Uimonen, S.; Lehtonen, M. Simulation of Electric Vehicle Charging Stations Load Profiles in Office Buildings Based on Occupancy Data. Energies 2020, 13, 5700. [Google Scholar] [CrossRef]
- Rodríguez, L.R. Achieving Energy-Efficient Districts: Contributions through Large-Scale Characterization and Demand Side Management. Ph.D. Thesis, Universidad de Sevilla, Seville, Spain, 2018. [Google Scholar]
- Fachrizal, R.; Munkhammar, J. Improved Photovoltaic Self-Consumption in Residential Buildings with Distributed and Centralized Smart Charging of Electric Vehicles. Energies 2020, 13, 1153. [Google Scholar] [CrossRef]
- Fachrizal, R.; Shepero, M.; Åberg, M.; Munkhammar, J. Optimal PV-EV sizing at solar powered workplace charging stations with smart charging schemes considering self-consumption and self-sufficiency balance. Appl. Energy 2021, 307, 118139. [Google Scholar] [CrossRef]
- Bossi, S.; Gollner, C.; Theierling, S. Towards 100 Positive Energy Districts in Europe: Preliminary Data Analysis of 61 European Cases. Energies 2020, 13, 6083. [Google Scholar] [CrossRef]
- International Energy Agency. Global EV Outlook 2021—Accelerating Ambitions Despite the Pandemic. Paris. 2021. Available online: https://iea.blob.core.windows.net/assets/ed5f4484-f556-4110-8c5c-4ede8bcba637/GlobalEVOutlook2021.pdf (accessed on 20 January 2022).
- Turci, G.; Alpagut, B.; Civiero, P.; Kuzmic, M.; Pagliula, S.; Massa, G.; Albert-Seifried, V.; Seco, O.; Soutullo, S. A Comprehensive PED-Database for Mapping and Comparing Positive Energy Districts Experiences at European Level. Sustainability 2021, 14, 427. [Google Scholar] [CrossRef]
- Hinterberger, R.; Gollner, C.; Noll, M.; Meyer, S.; Schwarz, H.-G. Reference Framework for Positive Energy Districts and Neighbourhoods. 2020. Available online: https://jpi-urbaneurope.eu/ped/ (accessed on 20 January 2022).
- Bottecchia, L.; Gabaldón, A.; Castillo-Calzadilla, T.; Soutullo, S.; Ranjbar, S.; Eicker, U. Fundamentals of Energy Modelling for Positive Energy Districts. In Sustainability in Energy and Buildings 2021; Littlewood, J.R., Howlett, R.J., Jain, L.C., Eds.; Springer: Singapore, 2022; pp. 435–445. [Google Scholar]
- Moreno, A.G.; Vélez, F.; Alpagut, B.; Hernández, P.; Montalvillo, C.S. How to Achieve Positive Energy Districts for Sustainable Cities: A Proposed Calculation Methodology. Sustainability 2021, 13, 710. [Google Scholar] [CrossRef]
- Bruck, A.; Ruano, S.D.; Auer, H. A Critical Perspective on Positive Energy Districts in Climatically Favoured Regions: An Open-Source Modelling Approach Disclosing Implications and Possibilities. Energies 2021, 14, 4864. [Google Scholar] [CrossRef]
- Paiho, S.; Hoang, H.; Hukkalainen, M. Energy and emission analyses of solar assisted local energy solutions with seasonal heat storage in a Finnish case district. Renew. Energy 2017, 107, 147–155. [Google Scholar] [CrossRef]
- Fichera, A.; Pluchino, A.; Volpe, R. Local Production and Storage in Positive Energy Districts: The Energy Sharing Perspective. Front. Sustain. Cities 2021, 3, 57. [Google Scholar] [CrossRef]
- Thiers, S.; Peuportier, B. Energy and environmental assessment of two high energy performance residential buildings. Build. Environ. 2012, 51, 276–284. [Google Scholar] [CrossRef]
- Komninos, N. Net Zero Energy Districts: Connected Intelligence for Carbon-Neutral Cities. Land 2022, 11, 210. [Google Scholar] [CrossRef]
- Tuerk, A.; Frieden, D.; Neumann, C.; Latanis, K.; Tsitsanis, A.; Kousouris, S.; Llorente, J.; Heimonen, I.; Reda, F.; Ala-Juusela, M.; et al. Integrating Plus Energy Buildings and Districts with the EU Energy Community Framework: Regulatory Opportunities, Barriers and Technological Solutions. Buildings 2021, 11, 468. [Google Scholar] [CrossRef]
- Junker, R.G.; Azar, A.G.; Lopes, R.A.; Lindberg, K.B.; Reynders, G.; Relan, R.; Madsen, H. Characterizing the energy flexibility of buildings and districts. Appl. Energy 2018, 225, 175–182. [Google Scholar] [CrossRef]
- Mehrjerdi, H.; Iqbal, A.; Rakhshani, E.; Torres, J.R. Daily-seasonal operation in net-zero energy building powered by hybrid renewable energies and hydrogen storage systems. Energy Convers. Manag. 2019, 201, 112156. [Google Scholar] [CrossRef]
- Florio, P.; Tendon, X.; Fleury, J.; Costantini, C.; Schueler, A.; Scartezzini, J.-L. Performance Assessment of a nZEB Carbon Neutral Living/Office Space and Its Integration into a District Energy-Hub. Energies 2022, 15, 793. [Google Scholar] [CrossRef]
- Castillo-Calzadilla, T.; Fessler, S.; Borges, C.E.; Andonegui, C.M. Urban District Modelling Simulation-Based Analysis: Under Which Scenarios Can We Achieve a Positive Energy District? In Proceedings of the 2021 18th International Multi-Conference on Systems, Signals & Devices (SSD), Monastir, Tunisia, 22–25 March 2021; pp. 1107–1114. [Google Scholar] [CrossRef]
- Makvandia, G. Safiuddin Obstacles to Developing Net-Zero Energy (NZE) Homes in Greater Toronto Area. Buildings 2021, 11, 95. [Google Scholar] [CrossRef]
- Zhang, X.; Penaka, S.; Giriraj, S.; Sánchez, M.; Civiero, P.; Vandevyvere, H. Characterizing Positive Energy District (PED) through a Preliminary Review of 60 Existing Projects in Europe. Buildings 2021, 11, 318. [Google Scholar] [CrossRef]
- European Commission. JRC Photovoltaic Geographical Information System (PVGIS)—European Commission. Available online: https://re.jrc.ec.europa.eu/pvg_tools/en/tools.html#PVP (accessed on 13 July 2021).
- Instituto Para la Diversificación y Ahorro de la Energía (IDAE). Calificación de Efficiencia Energética de Edificios; IDEA: Madrid, India, 2009. [Google Scholar]
- Directive 2010/31/EU of the European Parliament and of the Council of 19 May 2010 on the Energy Performance of Buildings. Available online: https://eur-lex.europa.eu/LexUriServ/LexUriServ.do?uri=OJ:L:2010:153:0013:0035:EN:PDF (accessed on 20 January 2022).
- Forococheselectricos. Así es la Curva de Carga del Volkswagen ID.3 Pro Performance: Se Mantiene a 100 kW Hasta Llegar al 40% de Carga. Available online: https://forococheselectricos.com/2020/10/curva-carga-volkswagen-id-3-pro-performance.html (accessed on 23 October 2020).
- Instituto Nacional de Estadística. Km Medios Recorridos al Año por los Vehículos para uso Personal, por Relación con la Actividad Económica de la Persona de Referencia y Antigüedad del Vehículo. 2008. Available online: https://www.ine.es/jaxi/Datos.htm?path=/t25/p500/2008/p08/l0/&file=08019.px (accessed on 14 July 2021).
- Instituto Para la Diversificación y Ahorro de la Energía (IDAE). Consumo y Emisiones de CO2. Vehículos Nuevos. 2016. Available online: http://coches.idae.es/consumo-de-carburante-y-emisiones (accessed on 19 July 2021).
- Volkswagen España. How Can I upload? Available online: https://www.volkswagen.es/es/electricos-hibridos/carga/como-puedo-cargar.html (accessed on 14 July 2021).
- Make a Good Choice: What Is the Difference between a Home with an a Energy Rating and a g Energy Rating? Available online: https://www.ennaranja.com/hipotecas/elegir-bien/elige-bien-que-diferencia-hay-entre-una-vivienda-con-calificacion-energetica-a-y-g/ (accessed on 13 December 2021).
- Pressmair, G.; Kapassa, E.; Casado-Mansilla, D.; Borges, C.E.; Themistocleous, M. Overcoming barriers for the adoption of Local Energy and Flexibility Markets: A user-centric and hybrid model. J. Clean. Prod. 2021, 317, 128323. [Google Scholar] [CrossRef]
- Baek, S.G. Plan for the Sustainability of Public Buildings through the Energy Efficiency Certification System: Case Study of Public Sports Facilities, Korea. Buildings 2021, 11, 589. [Google Scholar] [CrossRef]
- Wang, R.; Lu, S.; Feng, W. A three-stage optimization methodology for envelope design of passive house considering energy demand, thermal comfort and cost. Energy 2019, 192, 116723. [Google Scholar] [CrossRef]
Publisher’s Note: MDPI stays neutral with regard to jurisdictional claims in published maps and institutional affiliations. |
© 2022 by the authors. Licensee MDPI, Basel, Switzerland. This article is an open access article distributed under the terms and conditions of the Creative Commons Attribution (CC BY) license (https://creativecommons.org/licenses/by/4.0/).