Abstract
In recent years, residents in high-rise residential complexes (HRCs) in China have been placing an increasing demand on the living quality in HRCs. Particularly, the outdoor wind conditions are garnering more attention; however, few studies on the wind conditions within HRCs with densely arranged buildings and high plot ratios have been reported. Therefore, this study investigated the relation between the buildings’ layouts in HRCs and their wind conditions and it proposes optimization strategies to enhance body comfort in their outdoor environments. The research methods in this work involved field surveys, computational fluid dynamics (CFD) simulations, and field monitoring. The field surveys were used to determine the types of activities undertaken by the residents in the selected HRCs and their perceptions of the wind conditions within the HRCs. Field monitoring was primarily conducted to measure the present wind conditions in the HRCs. The CFD simulations were performed to analyze the interactions between individual buildings and the wind as well as the performance of the wind conditions in the HRCs before and after a building layout optimization. The simulation results and monitoring data showed that the present wind conditions in the HRCs were uncomfortable due to high wind speeds (exceeding 5 m/s) and large windless areas. To achieve a comfortable outdoor wind environment, future HRCs should adopt a point-to-point building layout and the buildings should be oriented south. Moreover, the ratios of the height to width (Hb/Wb) for individual buildings should be kept at approximately 1.33. For existing HRCs, landscape walls, trees, and moveable windbreak panels can be used to reduce the wind speeds, especially in open exit/entrance areas and windward areas.
1. Introduction
China has been undergoing rapid urbanization since the economic reform. Recent data showed that China had reached an urbanization rate of 63.89%, and it is expected to reach 65.5% in 2025 [1]. To accommodate the significant increase in the urban population, high-rise residential complexes (HRCs) have gradually become an important choice for urban development in China [2,3,4]. HRCs normally incorporate residential buildings with 11–33 floors (required by China building regulations) and plot ratios (the ratio of the gross floor area to the land area occupied by the HRC) greater than 2.0 to support a large population on limited land. In recent years, the number of HRCs has significantly increased in major cities in China [4,5]. Economic development and the improvement in living conditions have led to increasing demands on the quality of HRCs. In particular, the wind conditions within HRCs are garnering growing attention. For HRC residents, good outdoor wind conditions are instrumental in enhancing their desire to participate in outdoor activities, promoting interpersonal interactions, and relieving them from work- and life-related stress, thereby improving their health and advancing harmonious HRC development [6]. However, HRCs are characterized by high plot ratios and densely arranged buildings, which have an immense impact on their wind conditions [7]. Therefore, an understanding of the relation between the spatial form of an HRC and its wind condition is important for enhancing the outdoor comfort in its outdoor environment.
Some studies on outdoor environments were mostly conducted from the perspective of thermal comfort and they comprehensively considered the effects of various climatic conditions on thermal comfort [8]. For example, Olgyay [9] stressed that the local climatic conditions should be considered in the design of outdoor environments to improve outdoor comfort. Givoni [10] proposed outdoor comfort models and design strategies through an investigation of building layouts in different climatic conditions. By studying the airflow in five spatial forms, Taleghani et al. [11] determined the effects of different building combinations on outdoor comfort. According to Ragheb et al. [12], the road orientation, sidewalk width, building height, and airflow direction are key zoning factors affecting comfort in outdoor environments. Amindeldar et al. [13] found a significant correlation between thermal comfort in outdoor environments and the climatic conditions, with wind speed being an important variable.
Some others have focused more on building–wind interactions. For example, through an analysis of building layouts, Barton [14] summarized building combinations conducive to outdoor airflow. To and Lam [15] examined the effects of different building forms and scales on immediate wind conditions and concluded that a “canyon wind effect” with increased wind speeds would occur at a site where the buildings were perpendicular to the prevailing wind direction. According to Littlefair [16], an excessive small spacing between residential buildings tends to create areas with high wind speeds and causes sudden changes in the airflow direction, whereas through a simulation analysis, Hong and Lin [17] found that the depth (dimensions in a north–south direction), width (dimensions in an east–west direction), and height of a Chinese house were important factors affecting the wind conditions within and around it. Kubota et al. [18] noted that an enclosed building layout was unfavorable to airflow in a residential complex and that measures such as stilt floors could improve the local wind conditions. Hang et al. [19] found that a point-to-point layout was the most effective way to ensure optimum wind conditions in areas with densely arranged buildings, followed by a parallel layout, staggered layout, and an enclosed layout. Huang et al. [20] explored ideal street models and analyzed the effects of the building angle and orientation on the wind conditions within a colonnade space. Barton et al. [21] summarized the impact of different variables on the wind conditions within residential complexes and ranked them based on their level of impact.
Of the abovementioned studies, some focused on enclosed ancient architectural complexes (e.g., Chinese courtyard houses), whereas others examined public building complexes; however, few studies on the wind conditions within HRCs with densely arranged buildings and high plot ratios have been reported, especially in winter, when a coastal city always has robust and complicated outdoor wind conditions. The types of outdoor activities of residents within HRCs and their perceptions on outdoor winter wind conditions are unclear. Therefore, this study firstly investigated the present winter outdoor wind conditions of HRCs and evaluated the relation among the residents’ feelings, the buildings’ layouts, and the outdoor wind performance. Secondly, this research proposes different strategies to enhance the residents’ body comfort during winter outdoor wind conditions. The results of this study will not only inspire the layout design of new HRCs, but also facilitate an improvement of the wind environments of existing HRCs.
2. Evaluation Standards
To date, countries around the world have yet to establish uniform assessment metrics for outdoor wind conditions in residential complexes. The available assessment metrics were determined based on extensive wind-tunnel experiments, simulations, and field surveys with the wind speed and windless area ratio being two commonly used metrics.
2.1. Wind Speed
Wind speed refers to the airflow rate and is a basis for a wind force classification and a high wind speed means a high wind force. Meteorological authorities often use wind speeds at 10 m above the ground as local observation data. Additionally, the wind speed is a core factor involved in a wind condition assessment. The magnitude of the wind speed is a direct perception of a wind condition by the human body. Currently, the Beaufort scale is the commonly used index system for wind speeds [22]. The average wind speed at the height of an average pedestrian (usually 1.5 m above the ground) is used to assess body comfort in outdoor wind conditions. Based on the wind force classification and the subjective perception of pedestrians, researchers have found that the human body is comfortable when the wind speed is below 5 m/s [23]. Compared to pedestrian comfort determined in a simple way based on wind speeds, detailed criteria for assessing the relative comfort based on the Beaufort wind force scale were given by Soligo et al. [24] by further considering the different types of pedestrian activities (Table 1). A person’s outdoor comfort in an outdoor wind condition varies with the type of activity that he or she undertakes. For example, when exposed to wind speeds ranging from 3.4 to 5.4 m/s, a person feels comfortable if he or she remains in a standing or still seated position for a short period of time, whereas he or she feels uncomfortable if staying in each position for an extended period of time. Note that the assessment metrics mentioned above are versatile and applicable to various wind directions and speeds and are not established for specific seasons and locations.

Table 1.
Relative comfort [24].
The relevant Chinese building standards also provide some assessment metrics; however, in contrast to those mentioned above, the Chinese assessment metrics are formulated for summer or winter winds. For example, the Assessment Standard for Green Building of China-GB50189 clearly states that under typical winter wind speeds and wind directions, the wind speed at 1.5 m above the ground should be less than 5 m/s in pedestrian areas and less than 2 m/s in outdoor rest areas and recreational areas for children within a residential complex [25]. The standard does not provide specific wind speed requirements for spring, summer, and fall but instead only requires that vortex or windless areas should be absent in residential complexes. While the Chinese assessment standard differs from those used in other countries, all of these assessment standards have one thing in common—5 m/s is treated as a critical wind speed related to outdoor body comfort. In addition, all the assessment standards mentioned above were mainly based on wind speeds and did not include the effects of temperature. Therefore, those standards were only used to evaluate the relative comfort of wind environments rather than outdoor thermal comfort.
2.2. Windless Area Ratio
Windless areas refer to areas with low or no wind speed formed around buildings [25]. The windless area ratio refers to the ratio of the total size of the windless areas, Awl, to the total size of the study area. Large windless areas mean that the air is renewed slowly and that harmful pollutants within the site are not easily dispersed [26]. Therefore, controlling Awl is an effective measure for improving the immediate wind condition; however, because air is unlikely to be completely still, truly windless areas are rare or even nonexistent. In the assessment process, areas with wind speeds lower than 0.2 m/s can be defined as windless areas based on the Beaufort wind force scale. The relevant assessment standards state that the windless area ratio should be less than 5% [25].
3. Materials and Methods
3.1. Research Methods
In this study, an approach that combines qualitative and quantitative methods was used (Figure 1). Qualitatively, field surveys (10 questions) were conducted in the form of a questionnaire to determine the types of activities undertaken by the residents in the selected HRCs and their perception of the wind conditions within the HRCs, with the goal of understanding the present wind conditions in the HRCs (see questionnaire, Section S4 in the Supplementary Materials). The questions in the questionnaire were selected with reference [27,28] to existing studies, and they were all pertinent to outdoor wind comfort. Second, a small-scale trial had been carried out on campus before the questionnaire was given to the residents of HRCs. Students and teachers participating in the trial were able to easily understand the questions and complete the surveys within 10 min. The results from the small-scale trial demonstrated that the questionnaire had good validity and reproducibility. To ensure that the survey results were a good reflection of the residents’ outdoor environmental preferences, no specific selection criteria (i.e., gender, age, etc.) were set for the survey population, and the respondents were randomly selected from the HRC.
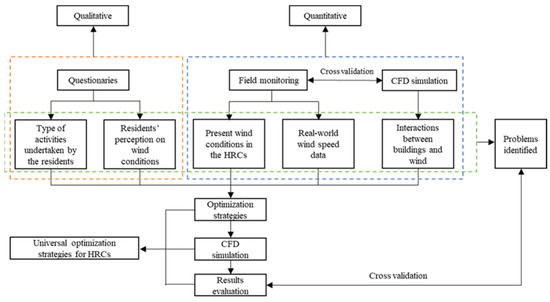
Figure 1.
Research methodology.
The quantitative methods used in this study involved field monitoring and computational fluid dynamics (CFD) simulations. The field monitoring was primarily conducted to measure the present wind conditions in the HRCs and to obtain real-world wind speed data. The CFD simulations were performed to analyze the interactions between individual buildings and wind as well as the performance of the wind conditions in the HRCs before and after a building layout optimization. CFD simulations are a low-cost, efficient method for analyzing wind conditions with an accuracy that has been extensively validated [29,30,31,32].
3.2. The Targeted HRCs
The targeted HRCs were located in Qingdao as depicted in Figure 2. Qingdao is a big coastal city, ranking in the middle among the new first-tier cities in China. It is a major seaport as well as a commercial and financial center. Moreover, Qingdao has abundant wind power resources, particularly in winter, when the wind speeds are high. According to statistics published by the Qingdao Meteorological Data Station [33] (see Section S1 in the Supplementary Materials), in the period 2010–2020, the prevailing wind direction in Qingdao ranged from north-northwest to due north (Figure S1, Section S2 in the Supplementary Materials), and its annual and monthly average wind speeds were on the rise. Specifically, the annual average wind speed increased from 3.9 to 4.3 m/s (Figure S2, Section S2 in the Supplementary Materials). In particular, the wind speeds in winter were generally higher than 4 m/s (Figure S3, Section S2 in the Supplementary Materials); therefore, this study mainly focused on the outdoor wind conditions in winter. Because Qingdao is a typical Chinese megacity (with a population of over 10 million), it can serve as a model for cities with similar residential building styles and climate features.

Figure 2.
The location of Qingdao in China.
With a population of over 10 million people, Qingdao’s residential complexes are predominantly composed of high-rise buildings. A search within two major Chinese databases—the China National Knowledge Infrastructure and Wanfang Data—with “residential complex” and “wind condition” as the keywords returned no relevant studies with Qingdao’s local climatic conditions as the background. Therefore, the wind conditions in the HRCs in Qingdao require an in-depth investigation, and optimal design strategies for wind conditions within HRCs, with Qingdao’s climatic conditions as the background that remains lacking. Hence, an investigation of HRCs in the urban area of Qingdao was performed in this study. In the center areas of Qingdao, approximately a total of 1000 HRCs were constructed in the past decades. According to the empirical principles of a sampling survey, for a subject with a population larger than 1000, the smallest number of viable samples should be at least 10% of the total population [34,35,36]; therefore, 100 HRCs in the center areas of Qingdao were investigated. The investigated parameters included the land areas that the HRCs occupied, the stories of the residential buildings, plot ratios, building forms (butterfly shape, T shape, and slab shape), and the number of households. Table 2 summarizes the average results of the investigated HRCs in the center areas of Qingdao. (Detailed investigation results can be found in Section S3 of the supplementary material). On average, the investigated HRCs had an occupied land area and plot ratios of 125,800 m2 and 2.58, respectively. In addition, most residential buildings were constructed in a slab shape and had 1188 households on average.
Table 2.
HRCs investigated in the center areas of Qingdao.
To perform a detailed and holistic analysis of a wind environment evaluation within the site of HRCs, three HRCs (labeled A, B and C in Figure 3), which had parameters that were closest to the average numbers in Table 2, were selected as the studied samples. These three HRCs can be recognized as typical representatives of all HRCs in the center areas of Qingdao. Note that the field monitoring was conducted in winter in this study. In addition, the CFD simulations were performed based on the daily average wind speed (4.5 m/s) and prevailing wind direction (northwest) in winter. These parameters were selected because winter is associated with generally high wind speeds and more complex wind conditions, which have the most significant impact on pedestrian comfort. Analyzing the conditions in winter can better reflect the actual application value of this study.

Figure 3.
Three selected HRCs.
3.3. Wind Field Measurements and CFD Settings
A XINTEST HT-9829 thermosensitive anemometer with a measurement accuracy of 0.01 m/s and a measurement error within ±5% was used to measure the wind speeds at fixed measuring points in the field (see Figures S4 and S5, Section S5 in the Supplementary Materials). For each HRC, a total of 6 measurement points, numbered 1 to 6, were set up at 1.5 m above ground at its main entrances/exits and activity areas around the buildings (Figure 4). At least 10 data points were collected at each measuring point. The measurement process lasted for two hours. In the post-processing step, the maximum and minimum values were removed to ensure data accuracy and validity, with the goal of accurately reflecting the wind speeds in the HRCs. See Sections S6 and S7 for photographs showing the specific locations of the measuring points and the measurement conditions.

Figure 4.
Measurement points (numbered from 1 to 6) in HRCs.
CFD models can provide detailed flow patterns in the various spaces around buildings by calculating the air temperatures, velocity, and pressure distributions at numerous locations. CFD methods can save time and reduce the costs compared with wind tunnel testing and real-scale field experiments [37,38]. Moreover, CFD simulation results generally exhibit a good agreement with experimental data [39]. In this study, CFD simulations were primarily conducted to analyze the interactions between individual buildings and the wind conditions as well as the change in the wind conditions in the HRCs before and after a building layout optimization. The CFD simulations were performed using PHOENICS, which is the world’s first commercial software program for simulating the fluid performance and has been extensively validated as a tool capable of producing highly accurate simulations [40]. The initial building models were built in AutoCAD, and the model meshes were generated in PHOENICS. The main geometries of the buildings were kept as much as possible to the original; however, doors and windows were removed to simplify the simulation processes. PHOENICS consists of three modules, namely, a preprocessor, a solver, and a postprocessor. The preprocessor is primarily used to establish models, determine the governing equations, set simulation parameters, and generate meshes. The main function of the solver is to yield a solution through iterations and output the calculation result, which is subsequently visualized by the postprocessor. In this study, the Flair module, which uses the turbulence model standard k–ε, was used to simulate the wind conditions in each HRC. The standard k–ε model is a simple turbulence model which only requires the input of boundary conditions. It has been widely used for analysis in a variety of research fields because of its stability and accuracy [41]. The Assessment Standard for Green Building of China-GB50189 also recommends this model for wind environment evaluation [25]. Table 3 summarizes the settings of Solver in PHOENICS.
Table 3.
Setup of Solver in PHOENICS.
The inlet velocity boundary conditions “applicable to bottom-layer incompressible airflow” were set as the wind field boundary conditions. Because the airflow rate and direction were unknown at the outlet boundary, the outlet was set as “free to obtain a fully developed outflow”. The direction and velocity of the wind field were set to the northwest (i.e., the prevailing wind direction in Qingdao in winter) and 4.5 m/s (Qingdao’s daily average wind speed in winter), respectively. An HRC model should be sufficiently large to include all individual buildings within the HRC (Figure 5). The size of the computational domain should be set based on the HRC model. An overly large computational domain leads to an excessive computing time, whereas an insufficiently large computational domain results in an inadequate flow field development and, therefore, reduces the computational accuracy. Based on the empirical values provided by PHOENICS, in this study, the height, width, and length of the computational domain were set to three times the height of the corresponding HRC model, four times its width, and four times its length, respectively [42,43,44] (see Table S1, Section S8). The two sides and top boundaries of a computational domain are specified as “slip boundary conditions”, implying that the airflow will be unaffected by these three shells and that the real outdoor wind flow is reproduced. The ground boundary of a computational domain is set as a “no-slip boundary condition”, and the airflow will be impacted by the rough ground. The Roughness index of the ground boundary is 0.28 for the center areas of megacities based on the recommendation of the Assessment Standard for Green Building of China-GB50189 (2019). Table 4 summarizes all the boundary conditions used in the simulations.
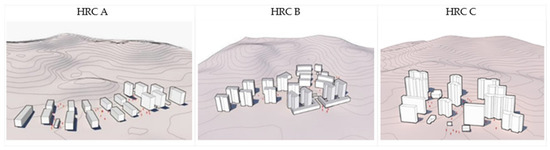
Figure 5.
Models created in PHOENICS (A to C, from left to right).
Table 4.
Boundary conditions.
Topographic changes were considered in the modeling of the HRCs. Specifically, the surrounding mountainous area was included in each model. However, data unavailability and a limited computing performance precluded the consideration of factors that might have affected the simulated wind conditions (e.g., the buildings, trees, and plants surrounding each HRC).
The SPARSOL mesh generation method developed in PHOENICS was used to generate a mesh for the computational domain in such a way that the mesh was dense in areas near the target models and sparse in areas away from the target models (Figure 6) (see Table S1 of Section S8 for the detailed mesh dimensions). To ensure the simulation accuracy, mesh independence tests were performed based on the HRC models (see Table S2 and Figure S10, Section S8). Here, HRC A is taken as an example. A total of six meshes were generated. The simulation accuracy was determined based on the changes in the data at observation point 1 within HRC A. Finally, considering the reasonableness of the simulation time, mesh 4 was selected for simulating the HRC. Note that all of the CFD simulations performed in this study converged with iterations from 3000 to 5000 (see Figures S11–S13, Section S8).
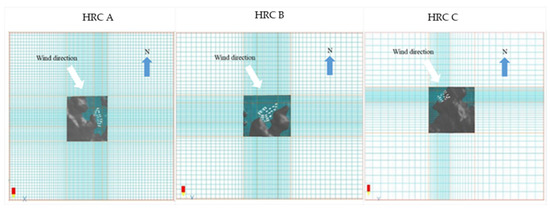
Figure 6.
Meshes created in PHOENICS (A to C, from left to right).
4. Results and Optimization Strategies
4.1. Results of the Questionnaires and Field Measurements
The population of the HRCs in this study was approximately 13,000. A total of 220 questionnaires were returned, of which 192 were valid. The margin of error was approximately 8%, with a confidence level of 95%. Figure 7 shows the survey results for Questions 1, 2, and 3 of the questionnaires. Residents aged 36–50 years were the predominant group partaking in outdoor activities in the HRCs, followed by those aged 18–35 years. People in these two age groups usually have more time at their disposal to spend on outdoor activities. In addition, as shown in Figure 7, 50% of the residents preferred to engage in outdoor activities in the evening. In particular, the number of residents undertaking outdoor activities was the highest between 17:00 and 20:00. Further, a similarly large number of residents preferred to participate in outdoor activities in the morning between 9:00 and 12:00. Of these people, most were senior residents in the HRCs performing morning exercise or children engaging in recreational activities while being accompanied by seniors. In terms of the time spent on outdoor activities, 50% and 36% of the residents generally spent less than one hour and between one and two hours on outdoor activities, respectively, compared to only 6% and 8% who spent between two and three hours and over three hours on outdoor activities, respectively.
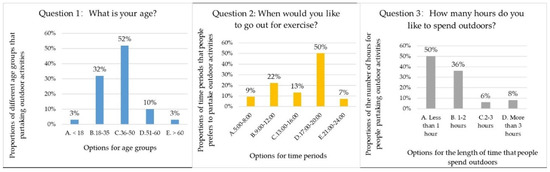
Figure 7.
The survey results for Questions 1, 2 and 3 of the questionnaires.
Figure 8 shows the survey results for Questions 4 and 5. It can be seen that in terms of the type of outdoor activity, over 85% of the residents chose leisurely walking and still sitting as their preferred outdoor activities, while 42% of the residents primarily engaged in meeting and talking with friends. During the assessment of comfort in the outdoor wind conditions, these two groups of residents were categorized based on the activity type as residents “standing or sitting for a long period of time.” In addition, 24% and 26% of the residents preferred running and exercise, respectively, while 12% and 2% of the residents opted for biking and parent–child activities, respectively. Moreover, approximately 60% of the residents engaging in outdoor activities preferred the central green space and central square within their HRCs as their activity venues.

Figure 8.
The survey results for Questions 4 and 5 of the questionnaires.
Figure 9 shows the survey results for Questions 6 and 7. Clearly, of the factors affecting outdoor activities, temperature (67.8%) was generally the primary concern of the residents, followed by the wind speed (18.64%), sunshine (10%), and humidity (4%). In addition, over 65% of the residents considered that conditions with high wind speeds in winter were uncomfortable for outdoor activities, compared to 31% that considered winter wind speeds comfortable. In contrast, only 4% of the residents responded that overly-low wind speeds led to discomfort.
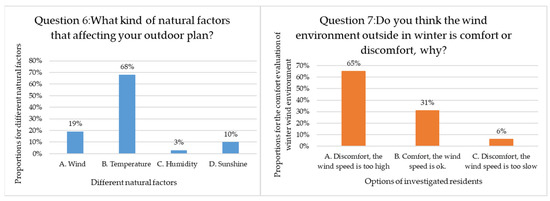
Figure 9.
The survey results for Questions 6 and 7 of the questionnaires.
Figure 10 shows the survey results for Questions 8, 9, and 10. More than 78% of the residents were more concerned with the wind speed and considered wind speed as the principal factor affecting their outdoor comfort. In comparison, only 12% of the residents were concerned with the wind direction, while 10% of the residents considered neither wind speed nor wind direction important. In addition, as seen in Figure 10, the residents generally considered that the layout of the HRC and the height Hb, width Wb (dimension in east–west direction), and orientation of the buildings had a significant impact on the outdoor wind conditions. Only 7% of the residents believed that the building layout and scale had no impact on the wind conditions.
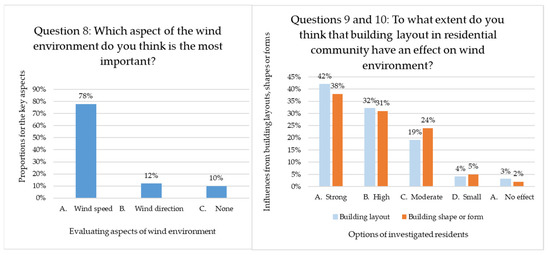
Figure 10.
The survey results for Questions 8, 9, and 10 of the questionnaires.
Figure 11 shows the measured average wind speed at each monitoring point within each HRC (detailed measured results can be found in Section S9 of the Supplementary Material). In HRC A, points 1 and 2 were each located at an entrance/exit area but differed considerably in wind speed. Point 3 was located on the northernmost side of HRC A where few buildings were located, and the west side of HRC A was situated in a depressed mountain area where turbulence tended to form. As a result, the wind speed was the highest (4.6 m/s) at point 3. The wind speeds at points 4, 5, and 6 were lower, ranging from 1.9 to 3.1 m/s, which was a result of the blocking effects of the mountains on the west side and the surrounding buildings.
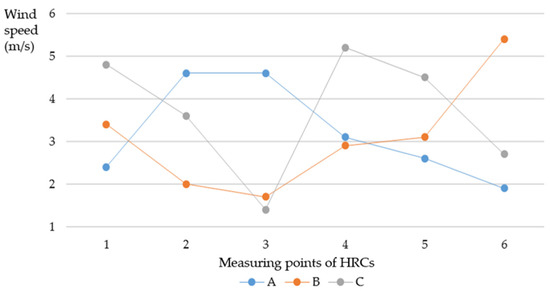
Figure 11.
The measured average wind speed at each monitoring point within each HRC.
In HRC B, the wind speed differed significantly among the measuring points. The wind speeds at points 1 and 2, located in the entrance/exit areas, reached 3.4 and 2 m/s, respectively. The wind speed at point 3 was the lowest at 1.7 m/s. Due to the blocking effect of the surrounding environment, the wind speeds (2.9 and 3.1 m/s, respectively) at points 4 and 5, both of which were close to the mountains, were comparable to those at points 1 and 2. The wind speed at point 6 was the highest at 5.4 m/s.
In HRC C, points 1 and 4 were each located in an open environment where no buildings were present to block the wind. As a result, the wind speeds at these two points were high at 4.8 and 5.2 m/s, respectively. Points 3 and 6 were each located between two residential buildings and the two parallel buildings were sufficiently capable of blocking wind. As a result, the wind speeds at these two points were low at 1.4 and 2.7 m/s, respectively. Despite being close to the mountains on the south side, point 5, similar to points 1 and 4, was located at the central open square surrounded by no blocking objects; consequently, the wind speed at point 5 was high at 4.8 m/s.
The measurement of the average speed at each measuring point showed that the wind conditions in each HRC were very complex and that the wind speed differed from point to point. However, it is certain that the wind speeds exceeded 5 and 2 m/s at 2 and 13 of the 18 monitoring points, respectively. Evidently, these wind speeds exceeded the upper limits set in the Assessment Standard for Green Building of China-GB50189—the wind speed at 1.5 m above the ground should be less than 5 and 2 m/s in pedestrian areas surrounding buildings and outdoor activity areas, respectively.
Based on the assessment standard for relative comfort, the wind conditions in the HRCs were also uncomfortable, because according to the preliminary questionnaire survey results, “leisurely walking or still sitting for a long period of time” was the main type of outdoor activity undertaken by the residents in the three HRCs (Figure 9). According to the assessment standard for relative comfort, wind speeds in the range of 1.6–3.3 m/s are comfortable; however, the measurements showed that within the three HRCs, the wind speeds at eight points exceeded 3.3 m/s, while the wind speed at one point was lower than 1.6 m/s.
Hence, regardless of whether the Assessment Standard for Green Building of China-GB50189 or the recommended wind speed range for relative comfort is used for assessment, the wind conditions within the HRCs were uncomfortable. This conclusion is consistent with the survey results for Question 7 in the questionnaire—high wind speeds in winter cause discomfort in people engaging in outdoor activities. The measurements accurately reflected the present wind conditions within the HRCs.
4.2. Simulation Results before Optimization
4.2.1. Simulation Results for Individual Buildings
According to both the preliminary literature reviews and the field measurements and questionnaire surveys, the building form and layout have a significant impact on the immediate wind condition. Therefore, individual high-rise residential buildings were simulated in this study using the CFD technique to formulate strategies for optimizing the Hb, Wb, and orientation of individual residential buildings under Qingdao’s climatic conditions. Note that because the depth of residential buildings depends heavily on the functional layout of individual buildings, it is difficult to determine their variation pattern; therefore, the effects of building depth on the wind conditions are not discussed in this study. The buildings were simulated based on the actual depths. The typical Hb and Wb values of the individual buildings within the HRCs were approximately 30 and 36 m, respectively; therefore, in terms of the building dimensions, the individual buildings were simulated based on a Hb value of 30 m and a Wb value of 36 m. Two sets of conditions were established for the simulations conducted to examine the effects of building dimensions on the wind conditions. (1) While the Hb was kept unchanged, the Wb was set to 20, 30, 40, 50, 60, and 70 m to assess the effects of Wb on the wind conditions. (2) While the Wb was kept unchanged, the Hb was set to 27, 36, 48, 60, and 72 m to assess the effects of Hb on the wind conditions. These values, determined based on relevant Chinese building design codes, can generally reflect the modulus principle of high-rise buildings. In addition to the Hb and Wb, orientation is another factor that significantly affects wind conditions. The Code of Urban Residential Area Planning and Design stipulates that buildings in Qingdao should be oriented within 45° east or west of due south. Therefore, while the building dimensions were kept the same (i.e., Hb: 30 m; Wb: 36 m), seven orientations spaced at intervals of 15°, namely, 45° east of due south (SE45), 30° east of due south (SE30), 15° east of due south (SE15), due south (S), 45° west of due south (SW45), 30° west of due south (SW30), and 15° west of due south (SW15), were selected for the CFD simulations.
Figure 12 shows the CFD simulations produced with different Hb and Wb values. Changing the Hb or Wb resulted in a small change in the wind speed around a building but a significant change in the Awl in front of and behind it. For example, at a fixed Hb, the windless areas (areas with wind speeds lower than 0.2 m/s) around a building gradually decreased as the Wb increased from 20 to 40 m. As the Wb subsequently increased from 50 to 70 m, the windless areas expanded again. In comparison, at a fixed Wb, the windless areas around a building contracted with an increase in Hb from 27 to 48 m and then gradually expanded with an increase in Hb from 60 to 72 m. In addition, the wind speeds around a building exceeded 5 m/s, evidently exceeding the upper wind speed threshold for outdoor body comfort.

Figure 12.
The CFD simulations produced with different Wb and Hb values.
To more visually reflect the relations between the Hb and Wb and the wind conditions, maps of the wind speeds were imported into AutoCAD to map the areas and calculate their sizes based on contours. Finally, histograms were plotted based on the Hb/Wb ratio (or Wb/Hb ratio) and the Awl, as shown in Figure 13. At a Hb/Wb or Wb/Hb ratio of 1.33, the Awl was the smallest, and the wind speeds surrounding the building were within the limit for outdoor comfort, simultaneously.

Figure 13.
Relationship between a building’s height-to-width (width-to-height) ratio and areas with no wind.
Figure 14 shows the effects of orientation on the wind conditions. The orientation has no significant impact on the wind speed but has a similarly considerable influence on the windless areas. The Awl was small and varied non-significantly as the orientation varied between SE15 and SE45. Moreover, the Awl was the smallest when the building was oriented S. In contrast, the Awl was large when the orientation varied between SW45 and SW15.
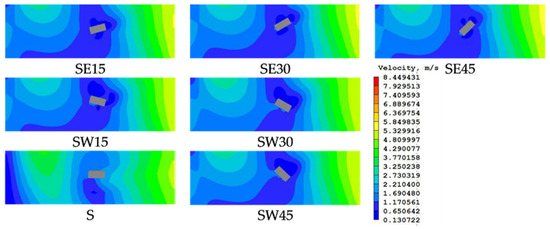
Figure 14.
The effects of orientation on the wind conditions.
4.2.2. Simulation Results for the Present Wind Environment of the Residential Complexes
Figure 15 shows the simulated present wind conditions in HRC A, B, and C. In HRC A, a low wind speed was observed at point 2, because the wind would blow from the northwest and was blocked by the residential buildings; consequently, its speed decreased. In comparison, point 1 was located within the activity area at the southernmost end of the HRC, which is close to the mountains on the west side. The wind would reach point 1 without being blocked by a series of buildings. As a result, the wind speed at point 1 was high at 5–7 m/s, which exceeded the upper wind speed threshold for comfort. Points 3 and 4 were located at the center of the HRC surrounded by buildings that can block the wind; consequently, the wind speeds at points 3 and 4 were within the range for comfort. There exists large windless areas around the buildings on the south side, which are unfavorable to the discharge of polluted air. Points 5 and 6 were located near the mountains where the northwesterly wind can reach without obstruction. As a result, the wind speeds at these two points were high at 5–8 m/s.
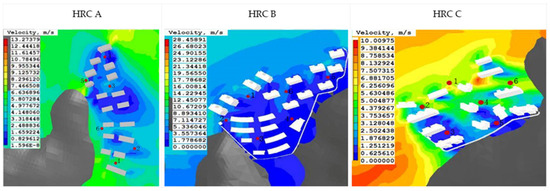
Figure 15.
The simulated present wind conditions in HRC A (left), B (middle), and C (right).
In HRC B, the wind speeds at points 1 and 2 were high at approximately 5.5 m/s, primarily due to the drafts formed by the northwesterly wind that was able to pass between the buildings, where these two points were located, without obstruction. Point 3 was located at a crossroads and, similar to points 1 and 2, between buildings; however, the building to the left of point 3 faced the inflowing wind at an angle and, therefore, blocked it. As a result, the wind speed at point 3 was 3.5 m/s, which was lower than those at points 1 and 2. Points 4 and 5 were located on the side close to the mountains where the northwesterly wind reached with a decreased speed after being obstructed by a series of buildings, resulting in the formation of large windless areas that were adverse to air renewal. Point 6 was located near an entrance square of the HRC. The buildings in this open area are shielded less from the wind. Consequently, the wind speed at point 6 was high at approximately 7 m/s.
In HRC C, Point 1 was located near an open entrance/exit area of the HRC where there are no buildings that can block the wind. As a result, the wind speed at point 1 was high at approximately 5.5 m/s. While point 2 was not located on the northernmost side of the HRC, there is similarly an absence of obstructing buildings in the inflowing wind direction; consequently, the wind speed at point 2 was also high at approximately 4 m/s. Points 3 and 5 were located between buildings. In addition, the mountains on the southeast side obstruct the inflowing northwesterly wind. These two factors led to a low wind speed of approximately 1.5 m/s at each of the points 3 and 5; however, a large number of windless areas were formed near these two points. Point 4 was located at the central activity square in the HRC where obstructing buildings are present, but in the surrounding areas, the buildings are farther apart, which, together with the action of turbulence, led to a high wind speed of approximately 5.5 m/s.
As demonstrated by the wind speed simulations, the wind conditions in each of the three HRC caused outdoor body discomfort. Specifically, some areas were associated with high wind speeds, while some contained large windless areas. Based on the conclusions in Section 4.2.1, both the layout of each building group and the scale and orientation of its individual buildings were the main factors affecting the present wind conditions.
The simulation results were generally in good agreement with the field measurements. It can be seen that, at some measurement points, the simulation results were almost the same as the measurement findings. For instance, at point 4 in HRC A, the wind speed was about 3 m/s for both the simulation results and field measurements, and at point 3 in HRC C, the wind speed was about 1.5 m/s for both. However, due to the complexity of wind speed variations in real conditions, most of the simulated and measured data were kept similar within an average range of ±1 m/s. This reveals that the measurement findings, nevertheless, effectively validated the CFD simulation results despite small discrepancies at some points. More importantly, both the field measurements and the CFD simulations reached a consistent conclusion, i.e., the outdoor winter wind environment in the HRCs was uncomfortable, and the wind speeds surpassed the comfort standards recommended by Chinese building regulations.
4.3. Optimization Strategies
Based on the conclusions in Section 4.2.1 and Section 4.2.2, corresponding optimization strategies are proposed in this study for the studied HRCs (a comparisons of layouts, building dimensions and orientations before and after the optimization can be seen in Figures S14–S19, Section S10 of the Supplementary Materials). The buildings in HRC A are arranged in a parallel layout, which results in too many drafts. Therefore, while keeping the plot ratio of HRC A unchanged and ensuring that the unit dimensions are reasonable and the required sunshine hours are satisfied, the layout of HRC A and the scale and orientation of its buildings were optimized as follows (left in Figure 16 and Figure 17). The No. 3, 5, 7, 9, and 12 buildings on the west side were translated northward by 12 m to form a staggered layout with the buildings on the east side, with the goal of reducing drafts. Based on the conclusions in Section 4.2.1, the Awl around a building is small when the building is oriented S or SE45; therefore, the orientation of the No. 1, 2, 3, and 5 buildings was adjusted from the southwest to SE15. Considering that the inflowing wind in winter blows from the northwest, while ensuring that the sunshine hours required for HRC A were met and that the Hb/Wb ratio was close to 1.33, the Hb value of the No. 3, 5, 7, and 9 buildings on the west side was increased to 27 m. In addition, to reduce the wind speed in the windward area on the west side, several landscape features (the blue squares, generated using the built-in PLANT feature of PHOENICS, in Figure 16 left) were placed between the No. 3, 5, 7, and 9 buildings as wind blockers.

Figure 16.
The optimized layout of HRC A (left), B (middle), and C (right).

Figure 17.
The optimized building dimensions and orientation of HRC A (left), B (middle), and C (right).
The simulation of the present wind conditions in HRC B shows that the wind speeds on the windward side of the buildings on the north side were high and that the wind speed at point 6, which was located at the entrance square, was also high. To address these problems, while ensuring that the sunshine hours required for HRC B are met, the No. 20 building in HRC B was moved northward by 5 m, and the No. 19 and 15 buildings were moved southward by 5 and 3 m, respectively, with the goal of creating a staggered layout (see middle in Figure 16 for the optimized layout). In HRC B, the No. 10 and 12 buildings are 10 m tall, while the No. 7 and 8 buildings are 42 m tall. According to the conclusions in Section 4.2.1, a Hb/Wb ratio of 1.33 would be conducive to improved wind conditions. Thus, the Hb value of the No. 7 and 8 buildings was increased to 51 m, while the Hb value of the No. 10 and 12 buildings was increased to 15 m. All the buildings within HRC B are oriented from S to SE45; therefore, no orientation adjustments were needed. To reduce the wind speeds near points 5 and 6, two areas with landscape plants were added to the open entrance square as wind blockers (the blue squares in the middle of Figure 16).
In HRC C, the length and layout of the residential buildings on the north side needed to be adjusted in such a way that these buildings could, to some extent, obstruct the airflow. Therefore, while the sunshine hours in HRC C were kept unchanged, the No. 7 building was translated westward by 12 m to divide the activity square within HRC C and prevent the airflow from passing without obstruction from north to south (see right in Figure 16). In addition, the Hb value of the No. 6, 9, and 10 buildings was increased from 42 to 63 m to ensure that the Hb/Wb ratio was close to 1.33. Based on the orientation optimization principle for buildings, the orientation of the No. 10 building was adjusted to SE15 such that it was consistent with the orientation of the buildings on its south side.
4.4. Simulation Results after the Optimization
Figure 18 shows the simulated wind conditions in HRC A, B, and C after optimization. In HRC A, the optimization reduced the wind speed at point 1 from approximately 6 to approximately 1.5 m/s and the wind speeds in the area on the west side close to the mountains to within the range for outdoor body comfort. The northward translation of the No. 7 building reduced the wind speed between the No. 8 and 9 buildings from 4 to approximately 2.5 m/s. In addition to improving the wind speeds, the optimization reduced the Awl within the HRC. In particular, the optimization measures considerably reduced the Awl around the buildings south of the monitoring point 3. In HRC B, the increase in the Hb of the buildings on the north side and the placement of landscape plants reduced the wind speed in the area on the north side from 7 to approximately 5 m/s. Importantly, these optimization measures reduced the wind speed at point 6 to approximately 4 m/s. Moreover, the optimization, to some extent, reduced the Awl. In HRC C, the optimization considerably reduced the wind speed on the south side of the No. 10 building; however, the wind speed in the windward area on the north side was reduced non-significantly and remained at approximately 5 m/s. The optimization significantly reduced the wind speeds at points 4 and 6 as well as the Awl within HRC C.
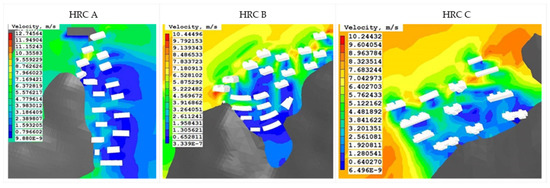
Figure 18.
The simulated wind conditions in HRC A (left), B (middle), and C (right) after optimization.
Based on the analysis of the wind environment before and after optimization in the HRCs, it can be seen that the places with excessive wind speed were all produced in the long and narrow spaces between buildings, whereas the size of a windless area was primarily influenced by the height, orientation, and width of the buildings. This finding is consistent with the results in existing studies, such as To and Lam [15] and Littlefair [16]. Moreover, this research also acquires a similar conclusion as Hang et al. [19], namely, that the buildings in the HRCs should be scattered and arranged with a point-to-point layout as far as possible. A point-to-point layout is conducive to the flow of wind and has less effect on wind speed. However, different from the existing studies, this research recommends integrating the arrangement of green plants, landscape walls, and moveable windbreak panels to limit the wind speed, especially in open playgrounds where obstacles are absent. In HRCs with buildings arranged row-by-row, the wind is easy to be blocked, which reduces the wind speed and significantly widens the windless areas. Therefore, it is especially necessary for a relatively long row of buildings to have overhead spaces that enable the wind to pass through. In addition to the adjustment of the layout and arrangement of buildings, the orientation, height, width, and location of individual buildings also need to be optimized in advance by means of a simulation analysis. Overall, it is possible to improve the outdoor wind conditions in a residential complex through the optimization of the scale and orientation of its buildings, the use of landscape plants, and the adjustment of its building layout.
5. Conclusions
In this research, the relation between the building layout of HRCs and their outdoor wind environment was investigated, and strategies were proposed to optimize the wind conditions in the HRCs for outdoor activities. The HRCs in this research were located in a megacity in northern China. The results of this research are, therefore, informative for both new and existing HRCs in similar climate regions. The key findings are summarized as follows:
- This research found that the main types of winter outdoor activity in HRCs were those long-duration and low-intensity activities such as leisurely walking or still sitting. Moreover, most residents in HRCs considered wind speed as the principal factor affecting their outdoor comfort. Therefore, it is inappropriate to simply use the recommended values of the Chinese building regulations to evaluate the outdoor environment of HRCs. The relative comfort criteria based on the Beaufort wind force scale are more suitable to evaluate the different types of pedestrian activities within a residential complex.
- This study provided several recommendations to improve the outdoor wind environment for the new HRCs’ building forms and layouts. The ratios of the height to width (Hb/Wb or Wb/Hb) for individual buildings should be kept at approximately 1.33 to achieve a comfortable outdoor wind environment. Moreover, when the buildings are oriented to the south, the windless area in a HRC can be minimized.
- For existing HRCs, while it is impractical to convert deterministic and closed layouts into point-to-point layouts, it is still possible to optimize the outdoor wind environment through the use of trees, landscaped walls and removable windbreak panels.
While the outdoor wind conditions in the selected HRCs were analyzed in this study through fielding monitoring and CFD simulations, a number of factors were not considered. For example, the existing landscape plants in the HRCs were not included in the CFD simulations for two reasons; (1) the terrains were too complex, defying the accurate development of plant models consistent with their real-world counterparts, and (2) including the terrains in the simulations would have required a high demand on the computer memory and preventing the computer from properly carrying out the computations. In the future, more accurate research methods may be formulated to address this problem. In addition, in this study, the simulation analysis was conducted only with Qingdao’s prevailing wind direction and wind speed in winter as the basic wind field, while other wind directions and speeds, as well as the wind fields in other seasons, were not considered in the simulation analysis. Future studies should focus on the wind conditions in residential complexes based on more wind data.
Supplementary Materials
The following supporting information can be downloaded at: https://www.mdpi.com/article/10.3390/buildings12112011/s1.
Author Contributions
Conceptualization, Z.P. and G.L.; methodology, G.L., I.Y.F.L. and Z.P.; formal analysis, Z.P.; data curation, G.L., N.J. and Y.C.; writing—Z.P. and T.Z.; writing—review and editing, W.D. and T.Z. All authors have read and agreed to the published version of the manuscript.
Funding
This research was funded by Ningbo Commonweal Funding Programme of Ningbo Science and Technology Bureau, grant numbers: 2021S139 and 2021S141.
Data Availability Statement
Not applicable.
Conflicts of Interest
The authors declare no conflict of interest.
Abbreviations
| HRC | High-rise residential complexes; |
| CFD | Computational fluid dynamics; |
| Awl | Windless areas; |
| Hb | Height of individual buildings; |
| Wb | Width (east–west direction) of individual buildings. |
References
- Jiang, T.B.; Deng, Z.W.; Zhi, Y.P.; Cheng, H.; Gao, Q. The Effect of Urbanization on Population Health: Evidence from China. Front. Public Health 2021, 9, 766. [Google Scholar] [CrossRef] [PubMed]
- Meng, X.; Yan, L.; Liu, F. A New Method to Improve Indoor Environment: Combining the Living Wall with Air-Conditioning. Build. Environ. 2022, 216, 108981. [Google Scholar] [CrossRef]
- Gao, Y.; He, F.; Meng, X.; Wang, Z.; Zhang, M.; Yu, H.; Gao, W. Thermal Behavior Analysis of Hollow Bricks Filled with Phase-Change Material (PCM). J. Build. Eng. 2020, 31, 101447. [Google Scholar] [CrossRef]
- Wang, Y.; Mauree, D.; Sun, Q.; Lin, H.; Scartezzini, J.L.; Wennersten, R. A Review of Approaches to Low-Carbon Transition of High-Rise Residential Buildings in China. Renew. Sustain. Energy Rev. 2020, 131, 109990. [Google Scholar] [CrossRef]
- Wang, J.; Liu, S.; Liu, Z.; Meng, X.; Xu, C.; Gao, W. An Experimental Comparison on Regional Thermal Environment of the High-Density Enclosed Building Groups with Retro-Reflective and High-Reflective Coatings. Energy Build. 2022, 259, 111864. [Google Scholar] [CrossRef]
- Du, S.; Zhang, X.; Jin, X.; Zhou, X.; Shi, X. A Review of Multi-Scale Modelling, Assessment, and Improvement Methods of the Urban Thermal and Wind Environment. Build. Environ. 2022, 213, 108860. [Google Scholar] [CrossRef]
- Ma, T.; Chen, T. Classification and Pedestrian-Level Wind Environment Assessment Among Tianjin’s Residential Area Based on Numerical Simulation. Urban Clim. 2020, 34, 100702. [Google Scholar] [CrossRef]
- Liu, F.; Yan, L.; Meng, X.; Zhang, C. A Review on Indoor Green Plants Employed to Improve Indoor Environment. J. Build. Eng. 2022, 53, 104542. [Google Scholar] [CrossRef]
- Olgyay, V.; Lyndon, D.; Reynokds, J.; Yeang, K. Design with Climate; Princeton University Press: Princeton, NJ, USA, 2015. [Google Scholar]
- Givoni, B. Climate Considerations in Building and Urban Design; John Wiley & Sons: New York, NY, USA, 1998. [Google Scholar]
- Taleghani, M.; Kleerekoper, L.; Tenpierik, M.; Van Den Dobbelsteen, A. Outdoor Thermal Comfort Within Five Different Urban Forms in The Netherlands. Build. Environ. 2015, 83, 65–78. [Google Scholar] [CrossRef]
- Ragheb, A.A.; El-Darwish, I.I.; Ahmed, S. Microclimate and Human Comfort Considerations in Planning a Historic Urban Quarter. Int. J. Sustain. Built Environ. 2016, 5, 156–167. [Google Scholar] [CrossRef]
- Amindeldar, S.; Heidari, S.; Khalili, M. The Effect of Personal and Microclimatic Variables on Outdoor Thermal Comfort: A Field Study in Tehran in Cold Season. Sustain. Cities Soc. 2017, 32, 153–159. [Google Scholar] [CrossRef]
- Barton, H. Sustainable Communities: The Potential for Eco-Neighborhoods; Routledge: Abingdon, UK, 2013. [Google Scholar]
- To, A.P.; Lam, K.M. Evaluation of Pedestrian-Level Wind Environment Around a Row of Tall Buildings Using a Quartile-Level Wind Speed Descriptor. J. Wind Eng. Ind. Aerodyn. 1995, 54–55, 527–541. [Google Scholar] [CrossRef]
- Littlefair, P. Environmental Site Layout Planning: Solar Access, Micro-Climate and Passive Cooling in Urban Areas (BR 380); IHS BRE Press: Bracknell, UK, 2000. [Google Scholar]
- Hong, B.; Lin, B. Numerical Studies of the Outdoor Wind Environment and Thermal Comfort at Pedestrian Level in Housing Blocks with Different Building Layout Patterns and Trees Arrangement. Renew. Energy 2015, 73, 18–27. [Google Scholar] [CrossRef]
- Kubota, T.; Miura, M.; Tominaga, Y.; Mochida, A. Wind Tunnel Tests on the Relationship Between Building Density and Pedestrian-Level Wind Velocity: Development of Guidelines for Realizing Acceptable Wind Environment in Residential Neighborhoods. Build. Environ. 2008, 43, 1699–1708. [Google Scholar] [CrossRef]
- Hang, J.; Sandberg, M.; Li, Y. Age of Air and Air Exchange Efficiency in Idealized City Models. Build. Environ. 2009, 44, 1714–1723. [Google Scholar] [CrossRef]
- Huang, X.; Lu, Z.; Zhuang, Z. Analysis of The Wind Environment to Improve the Thermal Comfort in The Colonnade Space of a Qilou Street Based on the Relative Warmth Index. Sustainability 2019, 11, 4402. [Google Scholar] [CrossRef]
- Barton, H.; Davis, G.; Guise, R. Sustainable Settlements: A Guide to Planners, Designers, and Developers; The University of the West of England and the Local Government Management Board: Bristol, UK, 1995. [Google Scholar]
- Simiu, E.; Scanlan, R. Winds Effects on Structures: Fundamentals and Applications to Design, 3rd ed.; John Wiley & Sons: New York, NY, USA, 1996. [Google Scholar]
- Simiu, E.; Scanlan, R. Wind Effects on Structures: An Introduction to Wind Engineering; John Wiley & Sons: New York, NY, USA, 1986. [Google Scholar]
- Soligo, M.J.; Irwin, P.A.; Williams, C.J.; Schuyler, G.D. A Comprehensive Assessment of Pedestrian Comfort Including Thermal Effects. J. Wind Eng. Ind. Aerodyn. 1998, 77–78, 753–766. [Google Scholar] [CrossRef]
- China Academy of Building Research (CABR). Assessment Standard for Green Building-GB50189; China Architecture & Building Press: Beijing, China, 2019. [Google Scholar]
- Yang, J.; Shi, B.; Shi, Y.; Marvin, S.; Zheng, Y.; Xia, G. Air Pollution Dispersal in High-Density Urban Areas: Research on the Triadic Relation of Wind, Air Pollution, and Urban Form. Sustain. Cities Soc. 2020, 54, 101941. [Google Scholar] [CrossRef]
- Zhen, M.; Chen, Z.; Zheng, R. Outdoor Wind Comfort and Adaptation in a Cold Region. Buildings 2022, 12, 476. [Google Scholar] [CrossRef]
- Shooshtarian, S.; Lam, C.K.C.; Kenawy, I. Outdoor thermal comfort assessment: A review on thermal comfort research in Australia. Build. Environ. 2020, 177, 106917. [Google Scholar] [CrossRef]
- Mochida, A.; Lun, I.Y. Prediction of Wind Environment and Thermal Comfort at Pedestrian Level in Urban Area. J. Wind Eng. Ind. Aerodyn. 2008, 96, 1498–1527. [Google Scholar] [CrossRef]
- Ramponi, R.; Blocken, B. CFD Simulation of Cross-Ventilation for A Generic Isolated Building: Impact of Computational Parameters. Build. Environ. 2012, 53, 34–48. [Google Scholar] [CrossRef]
- Zheng, S.; Wang, Y.; Zhai, Z.J.; Xue, Y.; Duanmu, L. Characteristics of Wind Flow around a Target Building with Different Surrounding Building Layers Predicted by CFD Simulation. Build. Environ. 2021, 201, 107962. [Google Scholar] [CrossRef]
- Villi, G.; De Carli, M. Detailing The Effects of Geometry Approximation and Grid Simplification on The Capability of A CFD Model to Address the Benchmark Test Case for Flow Around a Computer-Simulated Person. Build. Simul. 2013, 7, 35–55. [Google Scholar] [CrossRef]
- China Meteorological Administration. Special Meteorological Data Set for building Thermal Environment Analysis in China; China Construction Industry Press: Beijing, China, 2005.
- Shi, S. Principles of Statistics, 2nd ed.; Tsinghua University Press and Beijing Jiaotong University Press: Beijing, China, 2007. [Google Scholar]
- Shao, Z. The Method of Determining the Number of Samples in Sampling Survey. Stat. Decis.-Mak. 2012, 22, 12–14. [Google Scholar]
- Neuman, W. Social Research Methods: Qualitative and Quantitative Approaches, 7th ed.; Pearson: London, UK, 2011. [Google Scholar]
- Douglas, J.F. Fluid Mechanics; Pearson Education: London, UK, 2011. [Google Scholar]
- Montazeri, H.; Blocken, B.; Janssen, W.D.; van Hooff, T. CFD Evaluation of New Second-Skin Facade Concept for Wind Comfort on Building Balconies: Case Study for The Park Tower in Antwerp. Build. Environ. 2013, 68, 179–192. [Google Scholar] [CrossRef]
- Cook, M.J.; Ji, Y.; Hunt, G.R. CFD Modelling of Natural Ventilation: Combined Wind and Buoyancy Forces. Int. J. Vent. 2003, 1, 169–179. [Google Scholar] [CrossRef]
- Guo, P.; Ding, C.; Guo, Z.; Liu, T.; Lyu, T. Coupling CFD Simulation and Field Experiments in Summer to Prove Feng Shui Optimizes Courtyard Wind Environments: A Case Study of Prince Kung’S Mansion in Beijing. Buildings 2022, 12, 629. [Google Scholar] [CrossRef]
- Ramdlan, G.G.G.; Siswantara, A.I.; Daryus, A.; Pujowidodo, H. Turbulence Model and Validation of Air Flow in Wind Tunnel. Int. J. Technol. 2016, 7, 1362. [Google Scholar] [CrossRef]
- Shirzadi, M.; Tominaga, Y. Multi-Fidelity Shape Optimization Methodology for Pedestrian-Level Wind Environment. Build. Environ. 2021, 204, 108076. [Google Scholar] [CrossRef]
- Guo, F.; Zhu, P.; Wang, S.; Duan, D.; Jin, Y. Improving Natural Ventilation Performance in A High-Density Urban District: A Building Morphology Method. Procedia Eng. 2017, 205, 952–958. [Google Scholar] [CrossRef]
- CHAM. PHOENICS Overview; TR 001. Available online: http://www.cham.co.uk/phoenics/d_polis/d_docs/tr001/tr001.htm (accessed on 6 June 2022).
Publisher’s Note: MDPI stays neutral with regard to jurisdictional claims in published maps and institutional affiliations. |
© 2022 by the authors. Licensee MDPI, Basel, Switzerland. This article is an open access article distributed under the terms and conditions of the Creative Commons Attribution (CC BY) license (https://creativecommons.org/licenses/by/4.0/).