Abstract
An experimental investigation was carried out to study the effect of thermoplastics’ addition to reinforcement corrosion and the durability of concrete. A long-term study is necessary for the final decision on the possibility of the utilization of materials, and this study is contributing to this direction. Two types of thermoplastics were used, high-density polyethylene and polypropylene. The percentage of replacement of conventional aggregates was 0% and 12% by volume. After being demolded and cured for 7 days, the specimens were immersed in 3.5 wt% NaCl solution for 240 days. Afterwards, they were left in laboratory ambient air up to 11 years. Carbonation depth and the volume of permeable voids were determined. Optical microscopy, stereoscopy, and electrochemical impedance spectroscopy measurements were performed. Results showed that replacing conventional limestone aggregates with the particular two thermoplastics does not have a negative impact on rebars’ corrosion behavior. Optical microscopy and stereoscopy of rebars’ surface revealed that the corrosion process has initiated and carbonation is observed in all mixes, but corrosion rates are negligible for all the mixes studied.
1. Introduction
A lot of research has been made on the partial substitution of conventional limestone aggregates in concrete and mortar [1,2,3,4,5,6,7,8,9,10,11,12,13,14,15,16,17,18,19,20,21,22,23]. Authors agree that concrete containing thermoplastic waste as a substitution of conventional aggregates has lower strength than concrete that contains only conventional aggregates. This depends on the percentage of replacement and is attributed to the lower strength of thermoplastics and to the lower bond strength between thermoplastics and mortar. The profit gain from the use of thermoplastic waste as concrete or mortar constituents is a matter of assessment against the risk of nonfulfillment of the mechanical properties specifications, so an accurate mix design is necessary. All those have been previously extensively reported in review papers. Different reporting on the experimental procedure of each study raises difficulties in composing results coming from different laboratories. For this reason, Gavela et al. [24] proposed a standardized protocol for the experimental design to facilitate comparability and compatibility of future results of studies on mechanical properties.
Except from the physical and mechanical properties of concrete, another very important factor for construction is durability. According to Bhagat and Savoikar [25] there is insufficient research to confirm the effect of the type of thermoplastic aggregates on the carbonation of concrete. Babafemi et al. [26] also studied the oxygen permeability index of concrete containing plastics, which refers to concrete’s ability to transport gas by permeation, thus to concrete’s durability. This paper also concludes that the corrosion resistance of concrete containing plastics requires investigation.
In a previous work [27], the corrosion behavior of steel rebars in concrete containing thermoplastic waste as aggregates was studied. Electrochemical measurements were conducted to investigate the influence of that waste on reinforced concrete, up to 240 days of immersion of concrete specimens in 3.5 wt% sodium chloride solution. According to the results, the partial substitution of conventional limestone aggregates by thermoplastic waste has no practical impact on the corrosion behavior of reinforced concrete. While the by volume replacement of conventional aggregates had a negative impact on compressive and flexural strength, it was concluded that this impact could be compensated by selecting the proper mix proportions.
The present study is an 11-year follow-up on the effect of the addition of thermoplastic waste in reinforced concrete on the corrosion behavior of steel rebars. A long-term study is necessary for the final decision on the possibility of the utilization of materials, and this study is contributing to this direction. Corrosion of rebars in concrete constitutes the largest threat to the durability of concrete structures. Thus, for applications of concrete that include the use of reinforcement, the effect of the addition of thermoplastic on the corrosion of rebars should be studied. To compensate for the decrease in the compressive strength of concrete containing thermoplastics, a proper mix design is needed in order to use this concrete in reinforced load bearing applications.
2. Materials and Methods
2.1. Materials
The materials and the procedure for the production of the concrete specimens of this study were described analytically previously [27]. Three different mixes were used. The percentage of replacement of conventional fine aggregates was 0% and 12% by volume. Mix proportions are shown in Table 1. Two types of thermoplastics were used, polypropylene (PP) and high-density polyethylene (HDPE), which are shown in Figure 1. Cylindrical steel bars of the type S500s/ELOT 971 with dimensions of 12 mm in diameter and 100 mm were placed axially in cylindrical molds where the concrete was cast. A schematic representation of the cylindrical concrete specimen is shown in Figure 2. After 24 h, specimens were demolded, and then they were placed in water at a temperature of 20 °C ± 2 °C according to the European Standard EN 12390-2 for 7 days, and then they were immersed in 3.5 wt% sodium chloride solution for 240 days. Afterwards, they were left in laboratory ambient air up to the age of 11 years. The temperature range was from 16 to 28 °C, and the relative humidity range was from 35% to 65%.

Table 1.
Proportions for concrete mixes.
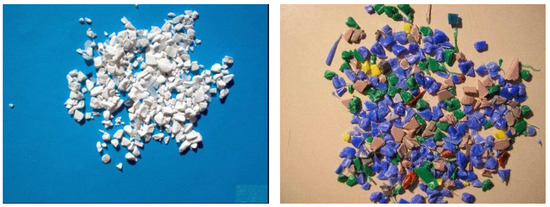
Figure 1.
Industrial wastes from PP (left) and HDPE (right).
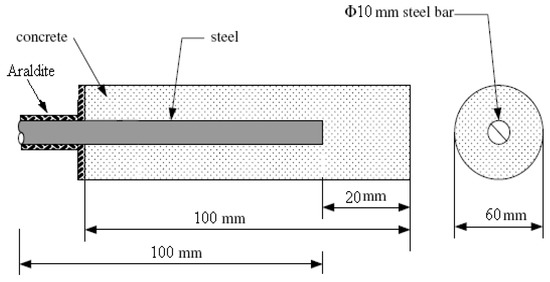
Figure 2.
Schematic representation of the cylindrical concrete specimen.
2.2. Methods
Carbonation depth was measured according to the European Standard EN 14630 [28]. Three specimens from each mix were measured in several points.
The volume of permeable pore space was calculated both for samples being taken from the noncarbonation area (near to rebars) and for samples taken from the carbonation area (near the specimen surface). Four samples were taken from near the surface area, and seven samples were taken from near the rebars area. The volume of permeable pore space was calculated according to ASTM C642 [29] slightly modified due to the thermal properties of polymers. The dry mass (A) was not determined by drying in an oven at a temperature of 100 °C. Samples were immersed in acetone and dimethyl ether and then left in vacuum for 24 h. Then the “saturated after immersion mass” (B) was determined by the immersion of the samples in water for 4 days and surface-drying of the samples with a towel. The “immersed apparent mass” (C) was determined by suspending the samples in water (Figure 3). Thus, the volume of permeable pore space (voids) (%) is calculated by Equation (1):
Volume of permeable pore space, % = [A/(A − C) − A(B − C)]/[A/(A − C)]·100
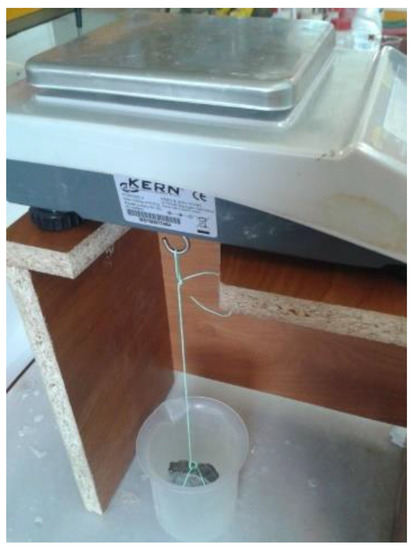
Figure 3.
Apparatus for the immersed apparent mass determination.
Optical microscopy was performed with a Moritex i-Scope at ×50 magnification.
Electrochemical impedance spectroscopy (EIS) was performed on three reinforced concrete specimens of each mix, at the age of 11 years, in order to study the corrosion in a chloride environment and the effect of the partial substitution of conventional limestone aggregates with high-density polyethylene and polypropylene. Electrochemical impedance spectroscopy (EIS, or AC impedance) can determine a number of fundamental parameters related to corrosion progress, and it has been extensively used in corrosion research. The method analyzes the response of corroding electrodes to small-amplitude alternating signals (AC), which vary in a wide range of frequencies [30]. EIS was carried out with a three-electrode system using a 1286 Solatron Electrochemical Interface in the frequency range between 10 kHz and 10 mHz. A sinusoidal voltage of 15 mV was applied. For all specimens, the same setups were used for the purpose of minimizing errors caused by geometry and, thus, to obtain comparative results. The “Zplot” software (Version 3.5i) was used for running experiments and data acquisition. Equivalent electrical circuit fitting was performed with the “Zview” software.
3. Results
After splitting the specimen, it was observed that part from the rebars obtained corrosion areas (Figure 4).
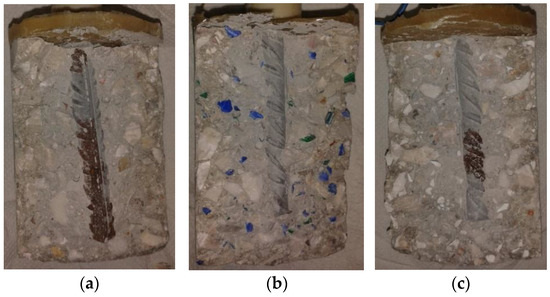
Figure 4.
Specimen photos after splitting: (a) reference mix, (b) HDPE, (c) PP.
3.1. Carbonation Depth
Steel rebars in reinforced concrete are protected from corrosion by a passive film (oxide layer) that is formed on their surface in the alkaline environment of concrete. When carbon dioxide from the atmosphere diffuses through the pores of concrete and dissolves in the cement pore solution, it forms carbonic acid (H2CO3). The calcium hydroxide present in pore water is neutralized by the carbonic acid formed, causing a decreasing of the pH of the concrete pore solution [31]. When the pH decreases to values below 9, the steel passive film starts destroying. The corrosion of steel rebars initiates when the protective oxide layer is destroyed.
Carbonation depth results are shown in Table 2 and Figure 5. The inner surfaces of specimens that were sprayed with phenolphthalein indicator solution are shown in Figure 6.
Table 2.
Carbonation depth results per specimen and their weighted mean for each type of specimen.

Figure 5.
Histogram of the carbonation measurement results.
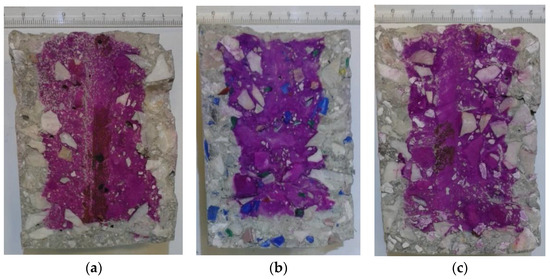
Figure 6.
Inner surface of concrete specimens: (a) RM, (b) HDPE, and (c) PP concrete specimens.
Multiple measurements were performed in each specimen. All measurement results within specimens are drawn from a normal distribution (according to a Shapiro–Wilk test [32]). Additionally, no outliers were found in each of these measurement datasets (according to a box-plot analysis). The uncertainty on the mean carbonation depth for each specimen, shown in the next table, is a type A, expanded uncertainty (k = 2), estimated based on the standard error of more than 10 measurements per specimen. For each of the three types of specimens (reference and with PP or HDPE addition), a weighted mean was estimated using the inverse variance as a weighing factor. The presented uncertainty for these estimations is the combined uncertainty from three individual mean values coming from each specimen type. By performing a Kruskal–Wallis test [33] on the 3 × 3 = 9 means of carbonation depth, it was concluded that none of the specimen types dominate over any other. Therefore, according to this measurement dataset, the factor of thermoplastic addition cannot be characterized significantly as a modifier of the mean carbonation depth for the tested specimens.
3.2. Volume of Permeable Pore Space
As it is shown in Figure 6 that all specimens from the three mixes present the same image. Near the rebar, there is no carbonation, and near the specimen surface, carbonation is observed. Therefore, samples were taken from those two different areas. Four samples were taken from near the surface area, and seven samples were taken from near the rebars area. The volume of permeable pore space was found to decrease when carbonation has taken place (Table 3). This is attributed to the fact that during carbonation, secondary formed calcite is deposited on the inside of pores but also at their entrance, thus making some of those impermeable [34]. In all cases (reference and specimens containing thermoplastic waste—PP or HDPE), this decrease was found equal to approximately 4%. These differences were tested and found significant at a 95% significance level, according to a two-sample t-test.
Table 3.
Volume of permeable pore space and testing on the effect of carbonation on its value.
The addition of thermoplastic waste was not found to have an effect on the volume of permeable pore space. Compressive strength and durability of concrete are two of the most important factors for concrete quality and structure design. Concrete durability is highly dependent on its ability to prevent the ingress and diffusion of moisture and aggressive ions into the concrete. Furthermore, compressive strength and permeability are related to the porosity and the pore structure of concrete. The bond between conventional aggregates and mortar is stronger than the one between polymer aggregates and mortar, and this is a fact that results in a lower strength of concrete containing thermoplastic aggregates. This lower bond does not seem to lead to a significant increase in the volume of pores, in such a way that it could lead in turn to a significant corrosion effect of rebars.
3.3. Optical Microscopy and Stereoscopy
Figure 7 shows optical microscopy images (×50), and Figure 8 shows stereoscopy images of rebars of the three mixes. Only the pitting corrosion of rebars’ surface was revealed, while on the most part of each rebar, corrosion was not observed. A brief examination of the steel surface indicated that pits were formed under the rusted surface. It should be also noticed that iron oxides seem to be placed among neurons of their surface, and the iron oxide layer microstructure seems to be porous. This pitting corrosion is attributed mainly to chloride diffusion since, as mentioned before, carbonation was not observed near the rebars. Chlorides existed in the specimen since they were immersed in 3.5 wt% sodium chloride solution for 240 days, and after their primary testing [27], they were left in laboratory ambient air up to the age of 11 years for the second testing described in the present study. The chloride ions attack the passive layer, but unlike carbonation, there is no overall drop in the alkalinity of concrete. Chloride acts as catalysts to corrosion. They are not consumed in the process but help to breakdown the passive layer of oxide on the rebars’ surface and allow the corrosion process to proceed. The case of chloride ions transporting into the concrete mass is a complex phenomenon involving multiple mechanisms, such as diffusion, permeation, and capillary absorption. The initial mechanism seems to be suction, especially when the surface is dry due to the rapid absorption of salt water. The capillary movement of salt-laden water through the pores is followed by diffusion and is driven by moisture gradient. All these mechanisms involve the transport of chloride ions through macropores of a few millimeters in size, micropores, and continuous capillary pores down to nanometer size.
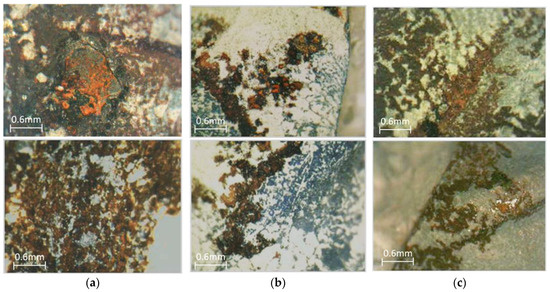
Figure 7.
Optical microscopy (×50): (a) RM, (b) HDPE, (c) PP.
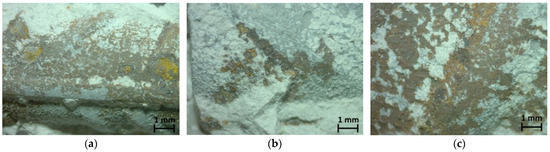
Figure 8.
Stereoscopy images: (a) RM, (b) HDPE, (c) PP.
From an optical microscopy and stereoscopy study of specimens, it seemed that the addition of thermoplastics did not seem to affect the extent of corrosion.
3.4. EIS Measurements
The electrochemical process of the corrosion of reinforced concrete is represented in terms of its electrical analogue of resistance, capacitance, or inductance in various arrangements corresponding to the possibilities of the physical model. Figure 9 illustrates the equivalent circuit found after fitting. In the equivalent circuit, Rs is the electrolyte resistance (concrete pore solution). A circuit with two parallel elements was connected in series with the resistance Rs to simulate the high-frequency loop that may be attributed to the dielectric properties of the concrete cover. It consists of two parallel elements, a resistance Rc and a constant phase element CPE1. They are related to the concrete pore solution and the porosity of hydrated concrete. The impedance of a constant phase element is defined as [30]: Z(ω) = Y0−1(jω)n, where Y0 is a parameter used in nonlinear least squares fitting, ω is the angular frequency, and n is a measure of arc depression defined as constant phase element power. For n = 0, the impedance simplifies an ideal resistor. For n = 1, a CPE simplifies as a pure capacitor, and as a result, the resistance obtained from fitting is very high (>108 Ohm.cm2). When n approaches 1, it is common practice to use the Y0 value as an approximation for capacitive behavior [35]. Another circuit with parallel elements, a resistance Rct and a constant phase element CPE2, was connected in series to the previous circuit with the two parallel elements. Rct is the electrode resistance (in this case, the rebar). The smaller this resistance, the greater the corrosion.
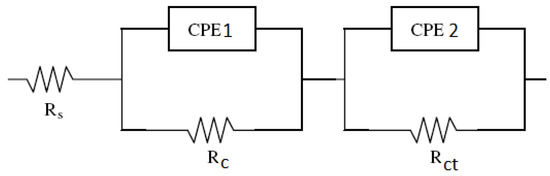
Figure 9.
The equivalent electrical circuit.
The Nyquist plots obtained are given in Figure 10.
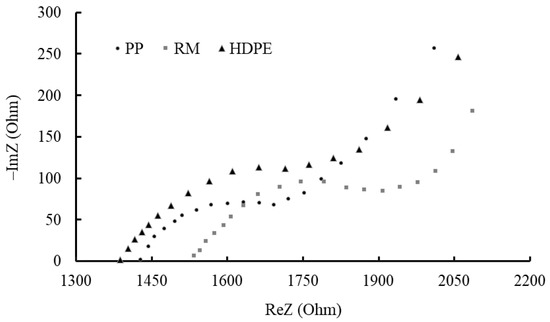
Figure 10.
Nyquist plots of each category of reinforced concrete specimens.
At high frequencies, a semicircle is observed, whose center is depressed below the real axis. This arc corresponds to the concrete cover barrier effect. At low frequencies, a semicapacitive behavior was observed for all the specimens, indicating a situation of the development of macrocells, which combine different areas of active pits in a passive surface on the same rebar.
In Table 4, the parameters of an equivalent circuit model are shown. As can be seen, the n parameter for CPE1 remains at 0.43 and 0.47 values, lower than the value 1 that it was approached up to 240 days of immersion in a previous paper for the same specimen. This reduction is attributed to the carbonation of concrete. To the same fact is attributed the reduction of Rs. Rct presents very high values for all the concrete types studied, showing the absence of high rates of corrosion.
Table 4.
Parameters obtained by equivalent circuit fitting (average of three measurements).
Optical microscopy and stereoscopy of rebars’ surface revealed pitting corrosion. This pitting corrosion is mainly due to chloride diffusion. Specimens were immersed in sodium chloride solution up to the age of 240 days, and then they were left in laboratory ambient air. The diffusion of those chloride ions resulted in the pitting corrosion of rebars at the age of 11 years. The existence of both active pits and passive areas on a rebar results in macrogalvanic elements. The reduction of the n parameter for CPE2 from a value of approximately 1 (age of 240 days) to values of 0.44 to 0.59 (age of 11 years) is attributed to the existence of those macrogalvanic elements. As mentioned before, for n = 0, the impedance corresponds to a resistor (showing the complete depassivation of steel), and for n = 1, the impedance corresponds to a capacitor (showing the passivation of steel formed by the alkaline condition of concrete, which maximizes inherent corrosion resistance of steel).
Results of EIS measurements showed that corrosion rates do not seem to be influenced by the partial substitution of conventional limestone aggregates by high-density polyethylene and polypropylene aggregates.
4. Conclusions
In this study, the effect of incorporating two thermoplastics as partial replacement of fine aggregates on the corrosion behavior of reinforced concrete was evaluated, and the following is concluded:
- Carbonation is observed in all mixes to a depth of 9.5 to 13.0 mm from the specimen surface. This carbonation is assumed to be expected at the age of 11 years. The addition of thermoplastics cannot be characterized significantly as a modifier of the mean carbonation depth for the tested specimens.
- Optical microscopy and stereoscopy of rebars’ surface revealed that the corrosion process has initiated. The pitting corrosion observed is mainly due to chloride diffusion since carbonation was not observed near the rebars. Chlorides existed in the specimens since they were immersed in 3.5 wt% sodium chloride solution for 240 days, and after their primary testing, they were left in laboratory ambient air up to the age of 11 years for the second testing described in the present study. The addition of thermoplastics did not seem to practically influence the extent of corrosion.
- EIS measurements reveal the absence of high rates of corrosion in all mixes. In all cases, the rebar resistance Rct was found to be very high (>108). This means that 12% by volume may be a good percentage for the replacement of conventional aggregates. The results were satisfactory and promising compared with the reference mix.
- Values of the parameters obtained from equivalent circuit fitting showed the existence of carbonation and macrogalvanic elements due to pitting corrosion. At the age of 11 years, Rs, which is the electrolyte resistance (concrete pore solution), was found to be approximately 10 times lower as compared with the values retrieved at the age of 240 days of the previous paper. The reduction of the n parameter for CPE2 from a value of approximately 1 (age of 240 days) to values of 0.44 to 0.59 (age of 11 years) is attributed to the existence of those macrogalvanic elements.
The findings of the current study contribute to the conclusion that reinforced concrete containing thermoplastic waste as aggregates can be used with reference to its impact on the corrosion behavior of rebars.
Furthermore, recommendations for future research on concrete containing thermoplastic aggregates are as follows: since a lot of laboratory research has been conducted on this material, including mix design, specimen construction, and mechanical and physical properties, a plant concrete production and a full-scale construction are now needed in order to assess the feasibility of this production and the behavior of this construction in real conditions.
Author Contributions
Conceptualization, V.K.-R. and S.G.; methodology, V.K.-R.; investigation, S.G., A.N. and E.R.; resources, V.K.-R. and E.R.; writing—original draft preparation, S.G.; writing—review and editing, S.G., E.R. and V.K.-R.; supervision, V.K.-R.; project administration, V.K.-R. All authors have read and agreed to the published version of the manuscript.
Funding
This research received no external funding.
Data Availability Statement
Not applicable.
Conflicts of Interest
The authors declare no conflict of interest.
References
- Gavela, S.; Kolias, S.; Kordatos, K.; Kasselouri-Rigopoulou, V. A new approach to utilization of thermoplastic waste. Fresenius Environ. Bull. 2009, 18, 224–228. [Google Scholar]
- Gavela, S.; Kolias, S.; Avramopoulou, M.; Kasselouri-Rigopoulou, V. Investigation on the possibility of using concrete containing plastic waste as aggregates for pavement construction. In Proceedings of the 10th International Symposium on Concrete Roads, Brussels, Belgium, 18–22 September 2006. [Google Scholar]
- Gavela, S.; Hatzifoti, C.; Hatzifotis, N.; Kolias, S.; Kasselouri-Rigopoulou, V. Physiko—Mechanical properties of concrete containing thermoplastic wastes as aggregates. In Proceedings of the 1st Hellenic Conference for the Utilization of By-products in Construction, Thessaloniki, Greece, 24–26 November 2005. [Google Scholar]
- Gu, L.; Ozbakkaloglu, T. Use of recycled plastics in concrete: A critical review. Waste Manag. 2016, 51, 19–42. [Google Scholar] [CrossRef] [PubMed]
- Albano, C.; Camacho, N.; Hernandez, M.; Matheus, A.; Gutierrez, A. Influence of content and particle size of waste pet bottles on concrete behavior at different w/c ratios. Waste Manag. 2009, 29, 2707–2716. [Google Scholar] [CrossRef] [PubMed]
- Galvao, J.C.A.; Portella, K.F.; Joukoski, A.; Mendes, R.; Ferreira, E.S. Use of waste polymers in concrete for repair of dam hydraulic surfaces. Constr. Build. Mater. 2011, 25, 1049–1055. [Google Scholar] [CrossRef]
- Batayneh, M.; Marie, I.; Asi, I. Use of selected waste materials in concrete mixes. Waste Manag. 2007, 27, 1870–1876. [Google Scholar] [CrossRef]
- Rahmani, E.; Dehestani, M.; Beygi, M.H.A.; Allahyari, H.; Nikbin, I.M. On the mechanical properties of concrete containing waste PET particles. Constr. Build. Mater. 2013, 47, 1302–1308. [Google Scholar] [CrossRef]
- Sadrmomtazi, A.; Milehsara, S.D.; Omran, O.L.; Nik, A.S. The combined effects of waste Polyethylene Terephthalate (PET) particles and pozzolanic materials on the properties of self-compacting concrete. J. Clean. Prod. 2016, 112, 2363–2373. [Google Scholar] [CrossRef]
- Akcaozoglu, S.; Atis, C.D.; Akcaozoglu, K. An Investigation on the use of shredded waste PET bottles as aggregate in lightweight concrete. Waste Manag. 2010, 30, 285–290. [Google Scholar] [CrossRef]
- Hannawi, K.; Kemali-Bernand, K.; Prince, W. Physical and mechanical properties of mortars containing PET and PC waste aggregates. Waste Manag. 2010, 30, 2312–2320. [Google Scholar] [CrossRef]
- Siddique, R.; Khatib, J.; Kaur, I. Use of recycled plastic in concrete: A review. Waste Manag. 2008, 28, 1835–1852. [Google Scholar] [CrossRef]
- Frigione, M. Recycling of PET bottles as fine aggregates in concrete. Waste Manag. 2010, 30, 1101–1106. [Google Scholar] [CrossRef] [PubMed]
- Reis, J.M.L.; Carneiro, E.P. Evaluation of PET waste aggregates in polymer mortars. Constr. Build. Mater. 2012, 27, 107–111. [Google Scholar] [CrossRef]
- Soroushian, P.; Alhozaimy, A.; Eldarwish, A.I. Recycling of plastics in concrete to enhance toughness characteristics and resistance to shrinkage cracking. In Proceedings of the Symposium on Recovery and Effective Reuse of Discarded Materials and By-Products for Construction of Highway Facilities, Denver, CO, USA, 19–22 October 1993. [Google Scholar]
- Evangelista, A.C.J.; Almeida, V.C.; Cordeiro, A.C.; Alves, L.S.; Rodrigues, R.A. Alternative aggregate study for production of concrete and mortar. In Proceedings of the 17th ASCE Engineering Mechanics Conference, Newark, NJ, USA, 13–16 June 2004. [Google Scholar]
- Koide, H.; Tomon, M.; Sasaki, T. Investigation of the use of waste plastic as an aggregate for lightweight concrete. In Proceedings of the International Conference Held at Dundee—Sustainable Concrete Construction, Scotland, UK, 9–11 September 2002. [Google Scholar]
- Pezzi, L.; De Luca, P.; Vuono, D.; Chiappeta, F.; Nastro, A. Concrete products with waste’s plastic material (bottle, glass, plate). Mater. Sci. Forum 2006, 514–516, 1753–1757. [Google Scholar] [CrossRef]
- Ghaly, A.M.; Gill, M.S. Compression and deformation performance of concrete containing postconsumer plastics. J. Mater. Civil. Eng. 2004, 16, 289–296. [Google Scholar] [CrossRef]
- Al-Manaseer, A.A.; Dalal, T.R. Concrete containing plastic aggregates. Concr. Int. 1997, 19, 47–52. [Google Scholar]
- Choi, Y.W.; Moon, D.J.; Chung, J.S.; Cho, S.K. Effects of waste bottles aggregate on the properties of concrete. Cem. Concr. Res. 2005, 35, 776–781. [Google Scholar] [CrossRef]
- Ismail, Z.Z.; Al-Hashmi, E.A. Use of waste plastic in concrete mixture as aggregate replacement. Waste Manag. 2008, 28, 2041–2047. [Google Scholar] [CrossRef]
- Marzouk, O.Y.; Dheilly, R.M.; Queneudec, M. Valorization of post-consumer waste plastic in cementitious concrete composites. Waste Manag. 2007, 27, 310–318. [Google Scholar] [CrossRef] [PubMed]
- Gavela, S.; Papadakos, G.; Kasselouri-Rigopoulou, V. A Suggestion for Standardizing a Traceable Process for the Determination of the Mechanical Properties of Concrete Containing Thermoplastic Polymers as Aggregates. In Thermoplastic Composites: Emerging Technology, Uses and Prospects, 1st ed.; Ritter, E., Ed.; Nova Publications: New York, NY, USA, 2017; pp. 143–164. [Google Scholar]
- Bhagat, G.V.; Savoikar, P.P. Durability related properties of cement composites containing thermoplastic aggregates—A review. J. Build. Eng. 2022, 53, 104565. [Google Scholar] [CrossRef]
- Babafemi, A.J.; Sirba, N.; Paul, S.C.; Miah, M.J. Mechanical and Durability Assessment of Recycled Waste Plastic (Resin8 & PET) Eco-Aggregate Concrete. Sustainability 2022, 14, 5725. [Google Scholar]
- Gavela, S.; Ntziouni, A.; Rakanta, E.; Kouloumbi, N.; Kasselouri-Rigopoulou, V. Corrosion behavior of steel rebars in reinforced concrete containing thermoplastic wastes as aggregates. Constr. Build. Mater. 2013, 41, 419–426. [Google Scholar] [CrossRef]
- EN 14630:2006; Products and Systems for the Protection and Repair of Concrete Structures—Test methods—Determination of Carbonation Depth in Hardened Concrete by the Phenolphthalein Method. European Committee for Standardisation: Brussels, Belgium, 2007.
- ASTM C642-21; Standard Test Method for Density, Absorption, and Voids in Hardened Concrete. ASTM International: West Conshohocken, PA, USA, 2021.
- Jafar, M.I.; Dawson, J.L.; John, D.G. Electrochemical Impedance and harmonic analysis measurements on steel in concrete. In Electrochemical Impedance: Analysis and Interpretation; Scully, J.R., Silverman, D.C., Kendding, M.W., Eds.; ASTM: Philadelphia, PA, USA, 1993. [Google Scholar]
- Broomfield, J.P. Corrosion of Steel in Concrete Understanding, Investigation and Repair, 2nd ed.; Taylor & Francis e-Library: London, UK, 2006; pp. 16–17. [Google Scholar]
- Shapiro, S.S.; Wilk, M.B. An analysis of variance test for normality (complete samples). Biometrika 1965, 52, 591–611. [Google Scholar] [CrossRef]
- Kruskal, W.H.; Wallis, W.A. Use of ranks in one-criterion variance analysis. J. Am. Stat. Assoc. 1952, 47, 583–621. [Google Scholar] [CrossRef]
- Van Gerven, T.; Cornelis, G.; Vandoren, E.; Vandecasteele, C. Effects of carbonation and leaching on porosity in cement-bound waste. Waste Manag. 2007, 27, 977–985. [Google Scholar] [CrossRef]
- Choi, Y.S.; Kim, J.G.; Lee, K.M. Corrosion behavior of steel bar embedded in fly ash concrete. Corros. Sci. 2006, 48, 1733–1745. [Google Scholar] [CrossRef]
Publisher’s Note: MDPI stays neutral with regard to jurisdictional claims in published maps and institutional affiliations. |
© 2022 by the authors. Licensee MDPI, Basel, Switzerland. This article is an open access article distributed under the terms and conditions of the Creative Commons Attribution (CC BY) license (https://creativecommons.org/licenses/by/4.0/).