Abstract
The global energy demand has been increasing and posing multiple challenges across the globe, including global warming, environmental pollution, and energy-sustainability issues. Thus, multiple countries have been adopting renewable-energy (RE) sources to provide clean, reliable, affordable, and sustainable energy. Previously, a number of renewable energy projects has been delivered in the form of a public–private partnership (PPP) to take advantage of the private sector’s investment, technology advancements, and expertise. In general, renewable-energy projects are considered large-scale universal projects that involve expertise from different countries and require a clear understanding of the barriers and key success factors (KSFs) across the globe. Thus, this paper focuses on providing a comprehensive understanding of the main barriers and success factors of renewable-energy projects across the globe. For that aim, a comprehensive literature review was first carried out to identify and report on the barriers and KSFs of renewable-energy projects. This was followed by a questionnaire survey wherein the opinions of 60 experts with wide experience in RE PPPs in multiple countries were collected and analyzed. The analysis shows that political and regulatory barriers are the main risks globally. Additionally, well-prepared contract documentations and skilled and efficient parties are the KSFs. However, these factors change from one continent to another. Additionally, this paper sheds light on the difference between the public and private sectors’ perceptions on the severity of the risks and the importance of the KSFs to each sector.
1. Introduction
Over the past few years, statistics have shown that the reliance and rate of consumption on the use of the limited reserve of fossil fuels as the main source for energy production should be reduced. The BP Statistical Review of World Energy has shown that the global oil and coal reserves can serve the demand for 150 years [1]. Additionally, the use of fossil fuels for energy production is associated with pollution issues, as it is commonly known that they are the main source of carbon and greenhouse gas emissions, which lead to global warming and climate change [2]. Thus, renewable-energy sources have been witnessing growing attention from both industry and academia with the objective of offering clean, reliable, affordable, and sustainable energy. In 2000, the global solar PVs installed were able to generate 1.5 GW, whereas in 2011 the PVs installed were able to generate 71.1 GW with an average annual growth rate of 44%. In 2013, the global solar PVs installed were able to generate 106 GW [3]. Figure A1 shows the total energy produced from the different sources of renewable energy by year. It clearly shows a significant increase in the energy produced over the last two decades. Although there is a linear increase in the energy produced from hydropower, the increase in the energy produced from solar and wind powers has grown exponentially.
On the other hand, the main issue associated with the adoption of renewable energy is the associated high upfront costs, which create a huge obstacle to governments in conducting such projects. Thus, over the last few years, governments across the globe have been trying to attract the private sector into investing in renewable-energy projects. As a result, the majority of renewable-energy projects involve at least one private sector that is responsible for supporting the project throughout the different phases of construction and operation [4]. Traditionally, public–private partnerships (PPPs) have become the most common delivery method used for renewable-energy projects. The involvement of the private sector is beneficial because it supports the public sector in three critical areas. Firstly, PPPs help the public sector in securing the required investment from the private sector. Secondly, PPPs reduce or transfer risks that governments traditionally face to the private sector, which reduces the overall costs to governments. These risks include ownership, implementation, and operation risks. Finally, PPPs allow the public sector to utilize the technology and innovation provided by the private sector, which can minimize the cost and duration needed for the construction and operation processes [5]. Thus, proper conditions and an environment that support PPPs in renewable-energy projects can be beneficial for society and all parties involved. Although there is a large number of papers in the literature that discusses the main obstacles and key success factors (KSFs) for infrastructure PPP projects, the barriers to and KSFs for renewable-energy PPPs are sparse in the literature. Thus, this paper focuses on identifying the main barriers, risks, and KSFs for renewable-energy PPPs across continents, with the aim of developing a clear understanding of such projects across the globe.
According to Zhao et al. (2014) [6], renewable-energy projects involve multiple industries and, in turn, are affected by a large number of factors. Wu et al. (2016) [7] studied the status, constraints, and reforms of renewable-energy projects in China. The results show that technological (poor research and innovation) and technical barriers (imperfect technical standards) are the main risks facing renewable-energy projects in China. Dong et al. (2016) [8] investigated the main barriers to renewable-energy projects in China as well and showed that market demand is the main factor affecting them. A study by Goh et al. (2014) [9] that focused on understanding the main challenges and risks for renewable-energy projects in Malaysia revealed that governmental support, level of investment or financial support, geographical location, and risk allocation are the main factors. In the UK, Pantaleo et al. (2014) [10] studied the main obstacles for using biomass as a source of energy. The analysis showed that social acceptance is the main barrier to biomass projects. In the United States, Carlisle et al. (2015) [11] studied the barriers to solar-energy projects and reported that the low level of social and political support are the main barriers to solar PV power generation. Similarly, other factors have been identified in other research, such as the construction costs, environmental barriers, and financial barriers [12,13,14,15].
Although a few of the previous studies analyzed the barriers to the success of renewable-energy projects, they have mainly focused on a specific country and/or a specific type of project, such as solar energy or biomass projects. Thus, these studies lack generalization and cannot be used to understand renewable-energy projects across the globe. RE projects are considered global because of the similarities in project types, lack of experts in this area, and the urgency to enter the market [9], which forces multiple countries to rely on the expertise of other countries to aid and provide advice during the project lifetime [12,14,16,17,18,19,20,21]. However, this poses complex issues regarding the communication and understanding of the conditions and environment across countries, which necessitates the need for a comprehensive study that analyzes the main barriers and KSFs across the globe. Freedman and Katz (2007) [22] stated that accomplishing universal projects is complicated when compared to domestic projects because of the diversity of the legal, political, cultural, social, and infrastructural settings. As a result, there is still a lack of research that offers a comprehensive understanding of the main barriers and success factors of renewable-energy projects. Thus, this paper focuses on these two issues across the globe and different types of projects. In other words, whereas previous studies focused on the micro level, this paper focuses on the macro level in order to offer a better understanding of renewable-energy PPPs across the different continents and to provide a benchmark for future studies. Additionally, as PPPs involve both the private and the public sectors, it is essential to understand both sectors’ perceptions and priorities in order to measure the level of success of a project. Furthermore, whereas previous papers in the literature focused on either the barriers or KSFs, none of these papers studied the key indicators that should be used for evaluating the success of PPPs. Thus, this study analyzes and investigates the main barriers, KSFs, and key performance indicators for renewable-energy PPPs from the perspective of the different sectors (public, private, and academia).
2. Methodology
In this study, a systematic process was adopted to understand the main barriers, KSFs, and key performance indicators used to evaluate the success of renewable-energy projects globally. This process started with a literature review to identify the barriers and KSFs for PPP projects in general, including infrastructure projects, construction projects, and renewable-energy projects. Secondly, a semi-structured questionnaire survey was created based on the factors identified from the literature-review process. Then, the survey was sent to eight experts with more than 10 years of experience in PPPs in general and more than five years of experience in renewable-energy PPPs in particular. The survey was then updated based on their recommendations. Thirdly, the questionnaire survey was sent to experts who were involved in renewable-energy PPPs to collect their responses and rank the main barriers to and KSFs for renewable energy projects. Finally, the results were analyzed to reveal the barriers and KSFs across different continents. Additionally, the analysis shed light on the differences between the sectors’ perceptions of the barriers and their evaluation of the success of projects.
2.1. Literature Review
The literature-review process carried out in this paper consists of five main tasks. The first task is planning, which involves identifying the keywords that can be used for the search. It also involves the identification of databases that can be used to find papers in a specific area or field. The keywords used in this paper are “renewable energy” and “public–private partnership,” as well as one of the following: “barriers”, or “KSFs”, or “critical success factors”. The databases and search engines identified in this task were “Scopus” and “Web of Science”, with a secondary search in “ScienceDirect”, “Springer”, “IEEE Xplore”, and “ASCE Library” to ensure comprehensiveness of the search and that all papers had been identified. The second task involves searching the identified keywords in the databases and search engines. The third task involves the identification of the inclusion and exclusion criteria in order to filter through the papers using the pre-specified criteria. In this paper, only studies in English that were published from 2010 onwards were selected to proceed to the next review stage. The fourth task is called the “screening for relevance” task, which focuses on reviewing the keywords, abstract, and conclusion of the identified papers in order to ensure that they are relevant to the research. Finally, the reporting is conducted and the main barriers and KSFs are identified in order to build the survey and send it to experts. The literature review tasks are outlined in Figure A2.
2.2. Questionnaire Survey
The questionnaire survey was developed based on the identified factors from the literature review. The survey consists of five sections. Section 1 gives the respondents a brief explanation of the objectives of the survey. Section 2 focuses on the basic information of the respondents, such as the level of experience with renewable-energy PPPs, the countries in which the respondent was involved in renewable-energy projects, their position, and the type of organization (public, private, or academia). Section 3 focuses on identifying the main reasons that make the public sector opt for PPPs for renewable-energy projects. Section 4 focuses on revealing the main barriers to efficient renewable-energy PPPs. The respondents were asked which barriers they had faced in the projects they were involved in. Additionally, the respondents were asked to rank every barrier on a Likert scale from 1 to 5 according to the probability of occurrence and their impact on renewable-energy PPPs. The respondents were then asked to highlight the party that should be responsible for each barrier in order to guarantee the appropriate allocation of risks. Finally, Section 5 focuses on identifying the KSFs and key indicators that are used to evaluate the success of renewable-energy projects. The respondents were asked to rank them according to the level of importance on a Likert scale from 1 to 5.
Before the distribution of the survey, it was pre-tested and sent to eight experts with more than 10 years of experience with PPPs in general and more than five years of experience with renewable energy PPPs. The survey questions were then modified based on the recommendations of the sample experts. From January to April 2022, the questionnaire survey was sent to experts from across the globe. The selection of experts was conducted using the purposive-sampling technique, which was adopted because it provides the ability to send the survey to respondents who meet the goals and aims of the survey [23]. More importantly, purposive sampling provides the ability to reduce the variations amongst the respondents [24]. Thus, the majority of the targeted respondents highlighted that they had experience in a large number of countries and across different continents. In total, the survey was sent to 134 experts and a total of 60 valid and complete responses were received, with a response rate of 45%. Table A1 (in the Appendix A) summarizes the selected studies that focus on the barriers and KSFs of PPP projects and shows the response rate in similar studies, which can be as low as 17%, as highlighted by Xu et al. (2010) [25]. It can be observed that these studies had similar or lower response rates, as highlighted in Table A1. According to Luthra et al. (2016) [26], a response rate of 20% is considered acceptable in similar studies. Additionally, Table A1 shows that the total number of respondents who have completed similar surveys is usually under 50 responses and might be as low as 10 responses, as highlighted by Kavishe and Chileshe (2019) [27].
2.3. Analysis
The questions in the survey can be categorized into two types of questions: “yes or no” questions and ranking questions based on a Likert scale from 1 to 5. For the “yes or no” questions, frequency analysis was used to understand and evaluate the responses. For the second type, the ranking is calculated based on the average value of the responses, called the relative importance index (RII), as suggested by Zhao and Chen (2018). The RII is calculated using Equation (1).
where is the relative importance index for factor n, is the rating given to each factor (ranging from 1 to 5), is the number of respondents giving a rating for factor n, and 60 is the total number of respondents.
Additionally, the analysis was conducted for every continent to understand how the barriers and KSFs vary across the different continents. Furthermore, as PPP projects require cooperation between the public and private sectors, it is essential to understand how the different parties perceive the severity of the different barriers and the importance of the KSFs. Thus, a detailed analysis for every sector was conducted separately and the results were compared.
3. Identification of the Barriers and Success Factors
The literature review conducted resulted in the identification of multiple barriers and KSFs. Table A2 (in the Appendix A) summarizes previous studies that focus on the barriers, whereas Table A3 (in the Appendix A) summarizes those that discuss the KSFs of PPPs. In general, the barriers could be classified into 10 topics and the KSFs could be classified into eight. For the KSFs, it was observed that the geographical location is rarely discussed in the literature. However, the studies that did analyze the impact of geographical location show that it is a critical factor. For example, Kamel et al. (2017) [28] analyzed two transportation PPP case studies (Marsa Alam Airport and El-Alamain Airport) that are similar, as both are coastal-airport projects announced on the same date, with the same conditions of bidding, and having gone through the same difficulties with the same governmental authorities. However, one of these projects is achieving ascending profits, whereas the other is achieving cumulative losses. A detailed analysis of the two cases shows that the geographical location is the main reason for this difference. Similarly, for renewable-energy projects, the geographical location is expected to have a great influence on the success of the project. Finally, Table A4 (in Appendix A) shows the previous studies that discuss the KPIs of PPPs and shows that the KPIs are rarely discussed, especially in the context of renewable-energy PPPs. Most of the previous studies discussed the KPIs for PPPs in terms of the traditional KPIs, which are cost, time, and money. However, in the context of renewable-energy PPPs, other KPIs are expected to be more valuable, such as the impact on emissions and the produced capacity. Thus, six KPIs were tested in order to understand and reveal the most valuable ones for evaluating renewable-energy projects.
4. Analysis
A total of 60 responses was collected in the questionnaire survey from experts who had experience in renewable energy projects across the globe. Some of the respondents work for multiple sectors between public, private, and academia. Specifically, 41 respondents worked for two sectors, whereas 19 worked for one single sector. Thirty experts highlighted that they worked for the public sector, 26 worked for the private sector, and 45 worked in academia. Most of the respondents had extensive experience with PPP projects in general, as shown in Table 1, which displays the frequency of the years of experience in PPPs in general and RE PPPs in particular. Table 1b shows the respondents’ experience in terms of the number of PPPs in general and renewable-energy PPPs that they were involved in. Furthermore, most of the respondents highlighted that they had been involved in renewable-energy projects in multiple countries, as shown in Table 1c, which shows the number of experts who were involved in renewable-energy PPPs on different continents, with the lowest number of experts observed in Australia.

Table 1.
Basic information of the respondents.
4.1. Factors Motivating the Public Sector to Opt for PPPs in Renewable-Energy Projects
In this part, the respondents were asked to rank the main factors that motivate the public sector to seek the support of the private sector. The focus is on understanding the importance of five main factors that motivate the public sector to cooperate with the private sector in PPPs, which are transfer of risks, efficiency of the private sector, expertise of the private sector, utilization of technology, and financial support. A Likert scale from 1 (not important) to 5 (extremely important) was used and the overall averages were calculated for every factor. Additionally, in order to understand the perspective of the different parties, the average value for each factor was calculated separately for the respondents in the public, private, and academia sectors. Figure 1 summarizes the results and shows the perspectives of these different parties. It shows that the five factors tested are critical for renewable-energy projects from the perspective of the three sectors, as the average importance of every factor across the three sectors was high. For the total average, financial support, utilization of technology, and expertise of the private sector were indicated as the main factors that motivate the public sector to opt for renewable-energy PPPs. However, this rank changed depending on the sector. For the public sector, the efficiency of the private sector, utilization of the technology, and financial support were indicated as the main factors that motivate the public towards PPPs in renewable energy. On the other hand, financial support, expertise of the private sector, and efficiency of the private sector (in order) were highlighted as the top factors by the private sector. Finally, respondents from academia highlighted that financial support, expertise of the private sector, and utilization of technology consecutively are the main motivating factors.

Figure 1.
Average level of importance for every factor motivating the adoption of PPPs for renewable-energy projects (a) by sector, (b) by continent.
4.2. Barriers Facing Renewable-Energy PPPs
In this section, the experts were asked to highlight the barriers faced in the renewable-energy PPPs they were involved in. They were then asked to rank the barriers according to their probability of occurrence and impact on a scale of 1 to 5. Finally, the respondents were asked to highlight the party that should be responsible for each barrier to achieve efficient renewable-energy PPPs. This section focuses mainly on studying the impact of 10 barriers (identified through the literature review) to renewable-energy PPPs as follows:
- Regulatory barrier (complex bureaucratic procedures, unstable national regulations);
- Political barrier (lack of governmental support, low political stability);
- Revenue barrier (fraud/non-payment by users, change in the market demand, foreign-exchange risk, inflation);
- Technical barrier (poor contract documentation, deficiency of design, poor quality assurance and quality control, lack of supporting infrastructure);
- Force majeure barrier (certain events of a political nature with low likelihood but non-measurable effects such as wars, terrorism, and so on);
- Financial barrier (foreign-exchange fluctuation, interest-rate fluctuation, inflation);
- Construction barrier (coordination of risks, land acquisition, unforeseen geotechnical conditions, physical obstacles that cannot be avoided, access to the site);
- Operational barrier (project/operation changes, organizational risk or changes, maintenance risks);
- Market risks (market competition, unskilled parties, poor coordination, poor risk allocation);
- Technological barrier (non-availability of the technology and or machines needed, non-trained laborers).
Figure 2a shows the results of the question asking respondents which barriers they had observed in renewable-energy PPPs. It shows that regulatory, political, and technical barriers were the main ones observed, with different barriers being highlighted by each party. Respondents from the public sector highlighted regulatory and political barriers as the main ones facing renewable-energy PPPs, followed by technical and revenue. On the other hand, for the private sector, regulatory barriers came first, followed by political, technical, and financial barriers. Finally, respondents from academia highlighted that regulatory, political, and technical barriers are the main ones facing renewable-energy PPPs from their point of view. It must be noted that the responses of the public, private, and academia sectors were close in some cases except for force majeure, market, financial, and technical barriers. For force majeure, the public sector put more emphasis on it as a barrier, with 33% of the responses as opposed to only 23% for the private sector. For the market risks, respondents from the private sector were exposed to market risks more, as 46% indicated that they had faced this barrier in previous projects, whereas this percentage dropped to 28% for the public sector. For both financial and technical barriers, the private sector was observed to have been more exposed to them compared to the public sector.

Figure 2.
(a) Observed frequency; (b) impact; (c) probability of energy barrier for renewable-energy PPPs.
After identifying the barriers that each party faced, the respondents were asked to quantify the probability of occurrence and impact for each one on a scale of 1 to 5. Figure 2b shows the resulting impact of each barrier to renewable-energy PPPs. In general, regulatory, political, financial, and revenue barriers were the most impactful barriers on renewable-energy PPPs. Additionally, it was observed that each party perceived the barriers with different impacts. For the public sector, regulatory, revenue, political, and financial barriers were the main ones. However, the main barriers for the private sector were regulatory, political, revenue, and financial. Finally, for the respondents from academia, regulatory, political, financial, and revenue were the main barriers. Although force majeure had the lowest impact across all respondents, the public and private sectors ranked it as the sixth and fifth factor affecting renewable-energy PPPs, respectively. However, since respondents from academia perceived force majeure as the barrier with the lowest impact, it affected the overall average, making it the factor with the lowest impact when all the responses were considered in the calculation of the overall average.
As previously mentioned, risks have two dimensions, which are the probability of occurrence and the impact. Figure 2c shows the probability of occurrence of each barrier in renewable-energy PPPs. The barriers with the highest probability of occurrence were, in order of importance, regulatory, political, financial, and revenue. It must be noted that these barriers had the highest impact as well, as shown in Figure 2. Additionally, they were found to have the highest average probability of occurrence for the public, private, and academia sectors. For force majeure, it is shown that it had the lowest probability of occurrence for respondents from both the private sector and academia.
The risk severity is a value that is usually calculated in order to understand the combined effect of both the probability of occurrence and the impact in one parameter. It is calculated using Equation (2).
The risk severity of each barrier was calculated and is summarized in Table 2. It shows the barriers ranked in descending order for the overall average, and the cells are highlighted based on their severity value, from red for high-risk severity barriers to green for those with low-risk severity. Table 2 shows that regulatory, political, financial, and revenue barriers were considered the main risks facing renewable-energy PPPs, in order of importance.
Table 2.
Risk severity for every barrier.
Finally, it was essential to assign the right risks to the right party. Thus, the respondents were asked to specify which party should be responsible for each barrier in order to guarantee efficient cooperation. Table 3 summarizes the responses and shows the percentage of respondents who assigned each barrier to each sector. The cells are highlighted from green, which indicates that a high percentage of respondents assigned a specific barrier to this part, to red, which indicates the opposite. The table also summarizes the perception of respondents from every sector and how the different parties assigned these barriers. The results show that the public sector should be responsible for regulatory and political barriers, whereas the private sector should be responsible for technical, construction, operational, and technological barriers. On the other hand, revenue, force majeure, financial, and market risks should be assigned to both parties. It can also be seen that respondents from different parties assigned most barriers to the same party except for the construction and market-risk barriers. Respondents from the public sector believed that construction barriers should be assigned to both parties, whereas the public sector should be responsible for market risks.
Table 3.
Percentage of respondents assigning every barrier to the public sector, private sector or both.
4.3. KSFs and Key Success Indicators for Renewable-Energy PPPs
In this section, the experts were asked to rank the factors that lead to successful renewable-energy PPPs on a Likert scale from 1 to 5 according to their importance. Similarly, the experts were asked to rank the parameters that indicate the success of the projects in terms of their importance in evaluating renewable-energy PPPs. Figure 3a shows the average level of importance of the factors and their level of importance. In general, skilled and efficient parties, well-prepared contract documents, technological development, and effective negotiations were the main factors for the success of renewable-energy projects, in order of importance. However, Figure 3a shows that each party perceived the importance of each factor differently. For the public sector, well-prepared contract documents, skilled parties, technological development, and desirable conditions were the most important factors for the success of renewable-energy PPPs. For the private sector, well-prepared documents, skilled parties, desirable conditions, and effective negotiations between the parties were the main factors for the success of renewable-energy PPPs, in order of importance. For respondents from the academic sector, skilled parties, technological development, well-prepared contract documents, and effective negotiations between different parties were the main factors for the success of the projects.
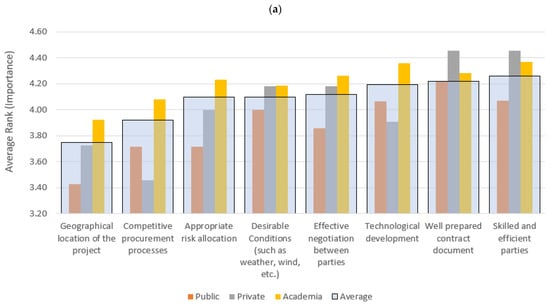

Figure 3.
(a) Key success factors and (b) key success indicators of renewable-energy PPPs as perceived by the different sectors.
Although the previous discussion focused mainly on understanding the factors for the success of renewable-energy projects, it is also crucial to choose the right parameters and tools for quantifying or evaluating the level of success of these projects. Thus, the experts were asked to rank the key performance indicators (KPIs) in terms of their importance in evaluating renewable-energy PPPs on a Likert scale from 1 to 5, as shown in Figure 3b. In general, the produced energy capacity and reduction in the level of emissions were considered the main KPIs for evaluating the success of renewable-energy PPPs. Additionally, the results show that each party preferred different KPIs for evaluating their projects. The public sector reported that the resources saved and traditional KPIs (cost, time, and money) should be used for the evaluation, whereas the private sector indicated that value for money achieved and resources saved are the main KPIs. Finally, respondents from academia preferred using the produced energy capacity and reduction in emissions for their evaluation.
5. Continental Analysis
Renewable-energy projects are considered global because of the lack of experts in this area and the urgency to enter the market [9], which forces multiple countries to rely on the expertise of other countries to aid and offer advice during the project lifetime [12,14,16,17,18,19,20,21]. However, this poses complex issues regarding the communication and understanding of the conditions and environment across countries, which necessitates the need for a comprehensive study that analyzes the main barriers and KSFs across the globe. Previous studies focus on analyzing the barriers for a specific country and thus lack generalization and cannot be used to understand the main barriers for different renewable-energy projects across the globe. Nevertheless, delivering global projects is complicated when compared to domestic projects because of the diversity of the legal, political, cultural, social, and infrastructural settings [22]. As a result, there still is a lack of studies that focus on a comprehensive understanding of the main barriers and success factors of renewable-energy projects. To address this gap, this section of the paper focuses on understanding these factors across the globe based on a continent-by-continent analysis. Hence, whereas previous studies focus on the micro level, this section of the paper focuses on the macro level in order to offer a better understanding across the different continents and provide a benchmark for future studies across the globe.
5.1. Factors to Consider for PPPs
Although the previous section discusses the main factors that motivate the public sector to adopt PPPs for renewable-energy projects in general, it is also critical to understand the main factors that motivate their adoption on each continent. Thus, Figure 1b summarizes the average level of importance of each factor for adopting PPPs for renewable-energy projects on every continent. It shows that the five factors are important and have a high impact on motivating the adoption of PPPs for renewable-energy projects across the six continents. However, it also shows that the rank of these factors changes from one continent to another. For Africa, the financial support provided by the private sector was the main factor, followed by the expertise of the private sector. For Asia, the utilization of the technology followed by the efficiency of the private sector were the main factors. For Europe, the utilization of technology followed by the transfer of risks were the main factors observed, whereas for North America it was the transfer of risks followed by the utilization of technology and expertise of the private sector. For South America and Australia, the main factors were the transfer of risks followed by financial support.
5.2. Barriers Facing Renewable-Energy PPPs in Every Continent
This section investigates the probability of occurrence and impact of every barrier based on a continental analysis in order to understand their severity on the efficiency of renewable-energy projects. Figure 4 shows the average probability of occurrence and impact across the continents.

Figure 4.
Average (a) impact and (b) probability of occurrence of every barrier on renewable-energy PPPs across the continents.
Figure 4a shows the average impact for every continent. In Africa, the top two barriers were regulatory and financial barriers. These results are consistent with previous published studies conducted in different African countries across the years. These studies show that regulatory and financial barriers are among the top three for PPP projects, as evidenced by Khodeir (2019) [29] in Egypt, Komendantova (2012) [30] in North African counties, and Ezeldin and Badran (2013) [31] and Fitzpatrick et al. (2014) [32] in Egypt, Morocco, and Tunisia. In Asia, Europe, and North America, the top two barriers were regulatory barriers followed by political ones. These results are consistent with the results of previous studies that concluded that regulatory and political barriers are among the top three barriers for PPP projects in Asian, European, and North American countries across the different years, as indicated by Khahro et al. (2021) [33] in Pakistan, Xu et al. (2010) [25] in China, Gupta et al. (2013) [34] in India, Fitzpatrick et al. (2014) [32] in Jordan, Smith et al. (2018) [35] in Sweden, Mamine and Farès (2020) [36] in Europe, Thum-Thysen et al. (2019) [37] in multiple European countries, Cui et al. (2018) [38] in the United States and Europe, Abdel Aziz (2007) [39] In the USA, and Liu et al. (2016) [40] in Canada. In South America, political and regulatory barriers were found to be the main barriers. These results comply with results observed by Furumo and Lambin (2020) [41] in Colombia and Leigland (2018) [42] in multiple countries in South America. In Australia, financial barriers followed by political, regulatory, and technological barriers were the main risks, which is consistent with the results by Liu and Wilkinson (2011) [43] and Liu et al. (2016) [40]. Thus, it can be concluded that the main barriers across the globe are regulatory, political, and financial. However, the specific ranking changes from one continent to another. Secondly, for the probability of occurrence of each barrier, Figure 4b provides a summary across the six continents. Regulatory and political barriers are most likely to occur in renewable-energy PPPs in Africa, Asia, Europe, North America, and South America. On the other hand, in Australia, political barriers followed by financial ones are the main barriers facing renewable-energy PPPs.
Finally, the risk-severity value was calculated for each barrier across the six continents, as shown in Table 4. In the table, the cells are highlighted from red (which indicates that the barrier has a high level of severity) to green (which indicates that the barrier has a low level of severity). Regulatory and political barriers had the highest level of severity in Asia, Europe, North America, and South America. In Africa, regulatory and financial barriers had the highest level of severity, whereas in Australia, political and financial barriers were the most severe. Finally, Figure 5 shows the rank of the barriers in every continent based on their level of severity. The results are consistent with previous studies that focused on specific countries within every continent, such as the study by Khodeir (2019) [29] in Egypt; Komendantova (2012) [30] in North African counties; Ezeldin and Badran (2013) [31] and Fitzpatrick et al. (2014) [32] in Egypt, Morocco, and Tunisia; Khahro et al. (2021) [33] in Pakistan; Xu et al. (2010) in China [25]; Gupta et al. (2013) [34] in India; Fitzpatrick et al. (2014) [32] in Jordan; Smith et al. (2018) [35] in Sweden; Mamine and Farès (2020) [36] in Europe; Thum-Thysen et al. (2019) [37] in multiple European countries; Cui et al. (2018) [38] in the USA and Europe; Abdel Aziz (2007) [39] in the USA; Liu et al. (2016) [40] in Canada; Furumo and Lambin (2020) [41] in Colombia; Leigland (2018) [42] in multiple countries in South America; Liu and Wilkinson (2011) [43]; and Liu et al. (2016) [40]. As a result, it can be concluded that the results of the current paper can support the private sector in the decision-making process in the future and in understanding the nature of renewable-energy PPPs in every country and continent.
Table 4.
Risk severity of every barrier across the six continents.

Figure 5.
Rank of the different barriers on every continent according to the risk-severity value.
Assigning the responsibility of each barrier to a specific party was also investigated to understand the differences across the continents, as shown in Table 5. The cells are highlighted from red (for high percentages) to green (for low percentages). Additionally, based on these percentages, the table shows which party should be responsible for each barrier across the six continents according to the responses received. For the regulatory and political barriers, there was agreement that the public sector should be responsible for it. For the revenue barrier, there was agreement that both the public and private sector should be responsible for it, except for South America, as the respondents from this continent highlighted that it should be the responsibility of the private sector only. For the technical barriers, it should be assigned to the private sector, as highlighted by respondents from Africa, Asia, North America, and South America. However, respondents from Europe and Australia preferred to have both the public and private sectors responsible for it. For the force majeure, it was indicated that it should be assigned to both parties, as highlighted by respondents from Africa, Asia, Europe, and North America. However, respondents from South America preferred to assign it to the private sector, whereas respondents from Australia preferred to assign it to the public sector. For the financial and market risks, there was agreement across the six continents that these barriers should be assigned to both parties. For the construction, operational, and technological barriers, there was agreement that these barriers should be assigned to the private sector, except for in Europe and South America, as the respondents assigned these three risks to both parties. Finally, it can be observed that respondents from Asia, Africa, and North America assigned the different barriers to the same parties. On the other hand, respondents from Europe did not assign any barrier to the private sector alone and instead assigned the barriers either to the public sector or to be shared amongst both parties.
Table 5.
Percentage of respondents assigning every barrier to the public sector, private sector, or both across the six continents.
5.3. Continental Analysis of the KSFs and Key Success Indicators for Renewable-Energy PPPs
Although the previous section shed light on the KSFs and key success indicators for renewable-energy projects from the perspective of multiple sectors, this section provides a continental approach. Figure 6a summarizes the importance of every key success factor on the efficiency of renewable-energy PPPs across the six continents. It shows that although the parameters were of high importance for the success of renewable energy projects across all continents, respondents from different continents perceived the importance of each factor differently. For Africa, technological development followed by well-prepared contract documents were the main KSFs for renewable-energy PPPs. Similar results can be found in multiple studies that investigated African countries and found lack of technology and poor documentation to be the main barriers, as evidenced by Sanni (2016) [44] in Nigeria, Osei-Kyei and Chan (2016) [45] in Ghana, and Sehgal and Dubey (2019) [46]. For Asia, skilled and efficient parties followed by appropriate risk allocation, desirable conditions, and well-prepared contract documents were the main factors for efficient renewable-energy PPPs. Similar results can be found in previous studies that investigated different Asian countries, such as Hsueh and Chang (2017) [47] in Taiwan, Osei-Kyei and Chan (2017) [48] in multiple Asian countries, Ismail (2013) [49] in Malaysia, and Zou et al. (2014) [50] in China. For Europe, skilled and efficient parties followed by technological development were the main factors for the success of renewable-energy projects, which is consistent with the results of Li et al. (2005) [51] in the UK, Osei-Kyei and Chan (2015) [45] in multiple European countries, Sehgal and Dubey (2019) [46], and Chou and Pramudawardhani (2015) [52] in the UK. For North America, effective negotiation between parties, skilled and efficient parties, and appropriate risk allocation were the main success factors for renewable-energy projects. Other studies in North American countries presented similar results, such as Wibowo and Alfen (2015) [53] in the United States. For South America, skilled and efficient parties followed by well-prepared contract documents, technological development, and efficient negotiations between parties were the main factors for the success of renewable-energy PPPs, which agrees with results of previous studies in South American countries by Araujo et al. (2019) [54] and Menezes et al. (2019) [55] in Brazil and Sastoque et al. (2016) [56] in Columbia. For Australia, technological development followed by well-prepared contract documents were the main factors for the success of renewable-energy PPPs, which is consistent with the results of the study by Cheung et al. (2012) [57] in Australia.
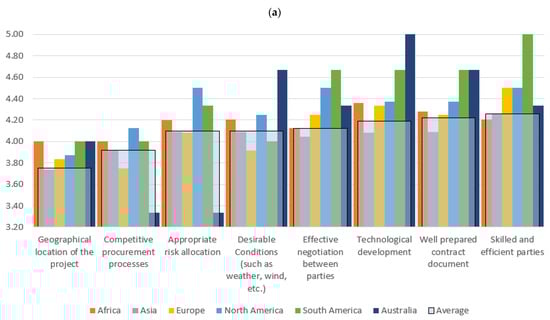

Figure 6.
(a) Key success factors and (b) key success indicators for the success of renewable-energy PPPs across the six continents.
Finally, Figure 6b shows the average rank of each key success indicator in evaluating renewable-energy PPPs across the six continents. It shows that respondents from the various continents preferred using different parameters for evaluating the success of renewable-energy PPPs. For Africa, Europe, and South America, the produced energy capacity followed by the resources saved were the preferred KPIs for evaluation. For Asia and North America, the choices were reduction of emissions and resources saved, whereas for Australia, they were produced energy capacity and reduction of emissions.
6. Discussion
This paper presents a holistic review and analysis of renewable-energy PPPs around the world. A questionnaire survey was used to elicit experts’ opinions, and the responses of 60 experts were collected and analyzed in order to understand the barriers and KSFs involved. A detailed analysis of the differences in the perspectives between the public, private, and academia sectors was conducted, along with an analysis of how the main barriers and KSFs change from one continent to the other. Results of the risk severity reveal that respondents from academia always evaluated barriers with a higher risk severity than other respondents. One exception is force majeure, where the opposite was observed. The main factor that contributed to this difference was the level of responsibility of every party for the barriers. Traditionally, the private sector is responsible for the operational, construction, and the majority of the market risks, whereas both the public and private sectors are responsible for force-majeure risks. Thus, the level of severity of the force-majeure barrier should be lower than the other risks for the private sector, whereas it would be the opposite for the public sector, since the first three barriers are outside of its responsibility. For the KSFs, the level of importance of all the factors for the success of renewable-energy PPPs was much higher for the private sector than the public sector. Two exceptions were for the competitive procurement process and the technological development, as the public-sector respondents gave them a higher level of importance than the private-sector respondents. For the competitive procurement process, the public sector is traditionally the party responsible for controlling the procurement process and evaluating the private sectors’ bidding. Hence, the public sector needs to have a competitive process in order to select the optimum private sector that can provide the services needed with the minimum costs and best quality. For the technological development, it has already been found that one of the main factors that motivate the public sector to opt for PPPs in renewable-energy projects is the utilization of the private sector’s technology. Thus, the public-sector respondents perceived the technological development with a higher level of importance for the success of renewable-energy PPPs than respondents from the private sector. For the key success indicators, each sector had different preferences for the best indicator for evaluating projects. Respondents from academia mainly focused on the environmental impact, reduction of emissions, and the level of energy produced or project size as the main indicators for evaluating the success of renewable-energy PPPs. On the other side, the public and private sectors give much lower importance to the environmental impact and preferred the use of traditional metrics. The resources saved and value for money achieved were the main indicators preferred by the private sector, whereas the resources saved and traditional KPIs (time, cost, money) were the main indicators preferred by the public sector. However, the level of importance of these traditional factors (value for money and traditional KPIs) was much lower for the respondents from academia. This difference in the preference shows the gap between respondents from the different sectors. Whereas respondents from academia focused on the use of environmental factors, respondents from both the public and private sector focused more on the practical side and the savings in terms of cost and time. However, the nature of renewable-energy projects is environment oriented, and all parties should be aware of that. These results shed light on the need to educate the public and private sectors about the nature of renewable-energy projects, the vision, and the importance of such projects in order to promote alignment.
For the continental analysis, the results reveal that every continent had its own barriers, and the level of severity of every barrier changed significantly across the continents. Additionally, the KSFs and the preferred key success indicators changed from one continent to another. For Australia, the severity of all risks was perceived as significantly higher than the other five continents, except for force majeure, which they perceived as much lower than other continents. For South America, the respondents perceived the level of severity of the risks as much lower than other continents, except for regulatory and political risks, which were perceived with a higher level of severity. For the remaining four continents, the level of severity of the different barriers was perceived in a similar way, with minor changes in the risk-severity value of the barriers across the four continents. Thus, for Africa, Asia, Europe, and North America, it can be concluded that although there are significant variabilities between the markets and conditions, the projects face similar barriers and with similar levels of severity. In other words, the renewable-energy market faces similar challenges across these four continents. Finally, regulatory, political, and financial barriers were the most common barriers facing renewable-energy projects on the six continents but with different orders. Additionally, analyzing the responses on which party should be responsible for each barrier confirmed the premise that the renewable-energy market has similarities across the continents. Respondents from Africa, Asia, and North America provided similar responses and assigned each barrier to the same party, which confirmed the similarity of the market conditions across these three continents. On the other hand, respondents from Europe assigned most of the barriers to both sectors, whereas only regulatory and political barriers were assigned to the public sector, as they are out of the private sector’s control. Finally, the results of this survey were compared with those of previous studies that were conducted in different years and regions/countries in order to understand the generalizability of the survey. Since the results were consistent with those of previous surveys, it can be concluded that the survey can support all sectors in understanding the nature of renewable-energy PPPs in different countries and on different continents for the decision-making process. Hence, this survey can aid the public sector in understanding the main barriers facing the private sector and the factors that attract them to invest. Additionally, the results can help the private sector in understanding the barriers and conditions associated with renewable-energy projects at a global scale so that they can choose to invest in areas with their preferred conditions.
7. Conclusions
This paper presents an analysis of the barriers and KSFs for renewable-energy projects across the globe. A questionnaire survey was first conducted in order to understand the perspectives of the public, private, and academia sectors on these factors. The results of this study pave the way towards building a framework between the different parties involved in renewable-energy PPPs to help them understand the environment and how other market players or parties are affected by the barriers and KSFs, which can further contribute to added efficiency and the success of these projects. Additionally, the results can help the public sector in understanding the main barriers that discourage the private sector from investing in renewable-energy PPPs, which include regulatory and political barriers, in order to take action and minimize these barriers in the future. Similarly, these results can help the private sector in understanding the surrounding environment, the experience of the sectors in prior renewable-energy PPP projects in an area, and how the public sector perceives the barriers and success factors. This can aid them in the proper selection and planning of a project. Secondly, a continental analysis was conducted in order to understand renewable-energy PPPs across the globe. The results show that the main barriers and KSFs change from one continent to another, although there are some similarities. These results can help the sectors in understanding the nature of the renewable-energy market on every continent, which can help them in the selection of projects to undertake. Additionally, the results help the public sector in understanding the main barriers and KSFs in their market in order to take the appropriate corrective actions in the direction that attracts the investment of the private sector.
8. Limitations and Future Research Directions
Although this study provides multiple insights about renewable-energy projects across the globe, further studies are needed to analyze the barriers and KSFs for renewable-energy projects in every continent separately to validate the results of the current survey and capture the differences across the different countries on one continent. Additionally, although a questionnaire survey was adopted in this study, in-person interviews are encouraged in order to give the experts the flexibility to mention their experience in the different projects and collect further information that cannot be done through traditional surveys. Finally, as the focus on renewable-energy projects is increasing with time and governments are working on attracting private-sector capital in these projects, it is expected that the barriers and KSFs will change in the future. Thus, this survey should be conducted periodically in order to capture the dynamics of barriers and KSFs over time across the different continents.
Author Contributions
Conceptualization, K.O. and R.K.; methodology, K.O. and R.K.; formal analysis: K.O. and R.K.; writing—original draft preparation, K.O.; writing—review and editing, K.O. and R.K.; visualization, K.O.; supervision, R.K.; project administration, R.K.; funding acquisition, R.K. All authors have read and agreed to the published version of the manuscript.
Funding
This research was funded by the Science, Technology and Innovation Funding Authority (STDF), Reintegration Grant, project ID: 43296.
Informed Consent Statement
Informed consent was obtained from all subjects involved in the study.
Data Availability Statement
The data presented in this study are available upon request from the corresponding author.
Conflicts of Interest
The authors declare no conflict of interest.
Appendix A
Table A1.
Summary of the selected studies that focus on understanding the barriers and key success factors of PPP projects.
Table A1.
Summary of the selected studies that focus on understanding the barriers and key success factors of PPP projects.
| Study | Scope | Country | Number of Respondents | Methodology | Results |
|---|---|---|---|---|---|
| Ahmadabadi and Heravi (2019) [58] | Evaluate the impact of the risks on the success of PPP projects. | Iran | The survey was sent to 51 experts and 48 responses were received (94% response rate). | This study starts with a review of the literature to identify the risks. Then, the survey was built and sent to experts to collect responses. Finally, the responses were analyzed using factor analysis (FA) and partial least squares techniques. | The analysis revealed that governmental support, constructional barriers, competitive bidding, and appropriate risk allocations are the main factors affecting PPPs in Iran. |
| Babonea and Gherman (2014) [59] | Analyze the main risks for PPPs in renewable-energy projects. | Romania | - | Discussion and review of the literature. | The results showed that regulatory and financial barriers are the main risks facing PPPs for renewable-energy projects. |
| Debela (2019) [60] | Investigate the impact of the barriers on the success of road PPP projects. | Ethiopia | The survey was sent to 85 experts and 52 responses were responded (61% response rate). | A review of the literature was conducted to identify the barriers. Then, a questionnaire survey was built and sent to experts. Finally, the mean score ranking technique, t-Test, reliability rest, Kendall’s Concordance analysis, and the Relative Importance Index were conducted to analyze the data. | The results revealed that political, regulatory, and market risks are the main barriers for PPP projects in Pakistan. |
| Donastorg et al. (2020) [61] | Investigate the impact of the key success factors on renewable energy projects. | Dominican Republic | A total of 25 experts responded to the survey. | The study started with a review of the literature to identify the key success factors of renewable-energy projects. Then, a questionnaire survey was built and sent to the experts to collect response for the analysis process. | The results revealed that financial, technical, and regulatory barriers are the main risks affecting renewable-energy projects. |
| Ezeldin and Badran (2013) [31]; Badran (2013) [62] | Identify the impact and probability of different barriers for PPPs. | Egypt | A total of 25 experts responded to the survey. | Firstly, a literature review was carried out to identify the barriers. Then, a questionnaire survey was built and sent to experts in the area of PPPs in Egypt. The survey adopted a Likert scale to allow the respondents to rank the barriers from 1 to 5. | The results showed that financial, political, and regulatory barriers are the main barriers facing PPPs in Egypt. |
| Fitzpatrick et al. (2014) [32] | This study was conducted by the OECD to identify the barriers to PPPs in the MENA region. The study focuses on transportation and renewable-energy PPPs. | MENA (Egypt, Jordan, Morocco, and Tunisia) | A total of 125 experts responded to the survey: 50 experts from Egypt, 19 from Jordan, 36 from Morocco, and 20 from Tunisia. | The study started with a workshop for experts in the area of PPPs in the MENA region to identify the barriers to the success of PPPs. The OECD identified the main PPP projects in the countries involved in this study in the last decade, with a total of 69 projects identified. Then, the authors of this study sent the survey to the experts involved in the identified projects. | The analysis showed that regulatory, and operational risks are the main barriers to PPPs in the MENA region. However, the analysis by country showed that the ranking of the barriers changes from one country to another. |
| Gupta et al. (2013) [34] | Assess the impact of risks on highway PPP-project life span. | India | The survey was sent to 30 experts and only 8 responded to it, with a response rate of 27%. | This research included three main phases. Firstly, a literature review was conducted to identify the risks. Secondly, a questionnaire survey was conducted to collect expert responses. Finally, data analysis was conducted to plot the changes in the impact of risks over the life span of the projects. | The results revealed that financial, regulatory, and political risks are the main risks for PPPs. Additionally, the analysis showed that the project duration is a major risk, and risks rise as a project progresses, reaching the highest level during the construction phase. Finally, risks drop to less than half after the construction phase. |
| Helmy et al. (2020) [63] | Assess the key success factors for the success of PPP projects in the educational sector. | Egypt | A total of 13 experts completed the survey. | This was a three-stage study. Stage one was a literature review for the identification of the factors. Then, a semi structured survey was conducted to collect responses for analysis. Finally, hypothesis testing was used to test the impact of the tested factors on the success of PPPs. | The results showed that operational factors are the most significant factors, followed by regulatory, political, and financial factors. |
| Ika et al. (2012) [64] | Explore the key success factors for World Bank projects around the world. | Worldwide | The survey was sent to 1421 experts and 178 responded to the survey, with a response rate of 12.5%. | This study involved three stages of research. Firstly, a literate review was conducted to identify the factors. Secondly, a questionnaire survey was built and sent to experts to collect responses. Finally, regression analysis was used to test the impact of every factor on the success of the projects. | The results showed that operational, constructional, and technical factors are the main factors affecting renewable-energy projects. |
| Kavishe and Chileshe (2019) [27] | Identify the impact of the risks on the success of PPPs in housing projects. | Tanzania | 10 experts | The study started with a literature review to identify the risks. Then, interviews were conducted with experts from the public and private sectors. Finally, the data were analyzed using the standard qualitative-analysis technique. | The results revealed that operational, technical, and political factors are the main risks affecting PPPs in Tanzania. |
| Ke et al. (2010) [65] | Understand the appropriate risk allocation for PPPs in China. | China | The survey was sent to 203 experts and a total of 47 responses were collected, with a response rate of 23%. | This was a two-stage study that started with a literature review for the identification of the risks. Then, a questionnaire survey was conducted between December 2008 and February 2009 to collect information for the analysis. | The results highlighted that public sector should be responsible for government-related risk, whereas the private sector should be responsible for project-level risks. |
| Khahro et al. (2021) [33] | Understand the main barriers facing PPPs in developing countries. | Pakistan, India, China, and Egypt | A total of 42 experts responded to the survey. | This study adopted two research phases. The first phase was a literature review that was conducted to identify the barriers facing PPPs. The second phase was the survey, and during the survey the respondents were asked to rank the barriers in a Likert scale from 1 to 5 according to their impact and probability. | The results revealed that finical, political, and regulatory barriers are the main barriers to PPPs in developing countries. |
| Khodier (2019) [29] | Identify the barriers to PPPs in Egypt. | Egypt | The survey was sent to 80 experts and 55 full responses were received, with a response rate of 69%. | The paper started with a literature review for identifying the main barriers to PPPs. Then, a detailed analysis of PPPs in India, China, Nigeria, and Egypt was carried out to help identify the main barriers in other developing countries. Then, the survey was built using a Likert scale to rank the barriers from 1 to 5. | The analysis showed that political, regulatory, and financial barriers are the main risks facing PPPs in Egypt. |
| Komendantova et al. (2012) [30] | Understand the barriers for solar-power renewable-energy projects. | North Africa | A total of 18 experts responded to the survey. | This study involved three-stages of interviews. Firstly, unstructured interviews were conducted with experts (23 experts) to identify the main barriers for renewable-energy PPPs. Secondly, semi-structured interviews were conducted to allow the experts to rank the impact and probability of occurrence of each barrier, and a total of 18 experts responded to the survey. Finally, a case study from a single country was analyzed in depth in order to confirm the results. For the case study, Morocco was selected, and experts were interviewed to acquire their responses. | The analysis shows that regulatory, political, and force-majeure barriers are the main risks facing renewable-energy PPPs in North Africa. Additionally, regulatory risks are the most likely to occur. Thus, the development of sound regulations in a transparent manner is essential to promoting renewable energy. |
| Korayem and Ogunlana (2019) [66] | Develop a risk model for water-specific PPPs. | Egypt | A total of 53 experts completed the survey. | This study started with a literature review for the identification of risks. Then, the questionnaire survey was built and sent to experts to collect responses for analysis. Finally, an Analytical Network Process (ANP) structure was constructed comprising the project objective, risk categories, and elements. | The analysis showed that operational and maintenance risks are the main risks for wastewater PPPs. |
| Maqbool (2018) [67] | Identify the key success factors and their influence on renewable-energy projects. | Pakistan | A total of 273 employees who were involved in renewable-energy projects completed the survey. | Firstly, a literature review was conducted to identify the key success factors for renewable-energy projects. Then, a questionnaire survey was built and sent to experts in the area. Finally, hypothesis testing was used to understand the Impact of each factor on the success of renewable-energy projects. | The results showed that political, regulatory, financial, and force majeure factors are the main factors affecting renewable-energy projects. |
| Maqbool and Sudong (2018) [68] | Study the impact of the key success factors on renewable-energy projects. | Pakistan | The survey was sent to a total of 450 experts and a total of 272 responses was received (60% response rate). | Firstly, a literature review was conducted to identify the factors affecting renewable-energy projects. Secondly, a questionnaire survey was carried out and sent to experts to collect responses for the analysis phase. Finally, regression analysis was used to test the impact of each factor on the success of renewable-energy projects. | The results revealed that political, regulatory, financial, and force majeure factors are the main factors affecting renewable-energy projects in Pakistan. |
| Odhiambo et al. (2020) [4] | Identify the barriers to geothermal renewable-energy projects. | Kenya | The survey was sent to 769 employees and 263 responded to the survey, with a response rate of 34%. | In this study, the authors investigated the barriers to the success of geothermal renewable-energy projects using a survey that was sent to the employees of one project (KenGen project) in Kenya. Finally, hypothesis testing was used to understand the impact of each barrier on the success renewable-energy projects. | The results showed that market risks are the main factors affecting geothermal renewable-energy projects. |
| Osei-Kyei and Chan (2015) [45] | Assess the main barriers to PPPs between 1990 and 2013. | Worldwide | - | This is a literature-review paper that focused on identifying the main barriers and key success factors for PPPs across the globe. | The analysis showed that appropriate risk allocation and political support are the most-identified barriers in the literature. Additionally, the analysis showed that China and UK are the countries of focus of most papers in the period studied. |
| Othman and Khallaf (2022) [69] | Develop a detailed understanding of renewable-energy PPPs with the objective of revealing the key success factors of previous projects in developing countries. | South Africa, India, Kenya, Morocco, and Jordan | - | Previous studies and reports published between 2010 and 2021 were reviewed. The paper identified the lessons learned from previous studies and set a group factor for the success of PPPs in renewable energy. | The results showed that governmental support, efficient and competitive bidding, political stability, and supportive regulations are the main factors that contribute to the success of PPPs. |
| Rady (2012) [70] | Assess the barriers to PPPs. | Egypt | A total of 23 experts responded to the survey. | This study followed two-stage research starting with a literature review. Then, a questionnaire survey using a Likert scale from 1 to 5 was conducted to rank the barriers. | The analysis showed that financial, political, and regulatory barriers are the main risks for PPPs in Egypt. |
| Smirnova et al. (2021) [71] | Study the factors that influence the governmental support of renewable-energy projects in China, India, and Russia. | China, India, and Russia | A total of 57 experts responded to the survey, with 19 experts from every country. | This paper followed a three-phase research plan. Firstly, a literature review was conducted to identify the main barriers to PPPs. Secondly, a questionnaire survey was conducted and sent to experts to collect responses. Finally, regression analysis was used to understand the impact of each factor on the success of renewable-energy projects. | The results showed that regulatory, financial, risk allocation, and political support are the main factors affecting the success of renewable-energy projects. |
| Somma, and Rubino (2016) [72] | Analyze and evaluate PPPs for renewable-energy projects in the MENA region. | Worldwide with more focus on Morocco, Jordan, Algeria, Egypt, and Tunisia | - | The World Bank database from between 2013 and 2015 was analyzed. | Political stability and supporting regulations are the main factors attracting the investment of the private sector in renewable-energy projects. |
| Wang et al. (2022) [73] | Investigate the impact of the risks of the success of renewable-energy projects. | Pakistan | The survey was sent to 750 experts and a total of 516 responses was received (69%). | A literature review was conducted to identify the risks. Then, a questionnaire survey was conducted and sent to experts to collect responses for the analysis phase. Finally, the partial-least-squares structural-equation-modeling technique was used to analyze the responses. | The analysis revealed that technical and operation factors are the main risks facing renewable-energy projects in Pakistan. |
| Xu et al. (2010) [25] | Develop a risk-assessment model for highway PPPs. | China | The survey was sent to 580 experts and 98 responded to the survey, with a response rate of 17%. | Three phases of research were adopted in this study. Firstly, a literature review was carried out to identify the main risks facing PPPs. Secondly, a questionnaire survey was distributed to experts involved in PPP. Finally, A fuzzy synthetic-evaluation technique was adopted in order to model PPP risks. | The results revealed that governmental support, financial support, market risks, and construction and operational barriers are the main risks for highway PPPs in China. |
| Zaman et al. (2022) [74] | Understand the impact of the key success factor on the efficiency of renewable-energy projects. | Pakistan | The survey was sent to 408 experts and a total of 376 responses were received (92% response rate). | The study started with a literature review to identify the key success factors of renewable-energy projects. Then, a questionnaire survey was built and sent to experts. Finally, the partial-least-square structural-equation-modeling technique was used to analyze the responses. | The results showed that operational and technical are the main factors affecting the success of renewable-energy projects. |
| Zhao and Chen (2018) [75] | Investigate the impact of the risks on the success of renewable-energy projects. | China | The survey was sent to 369 experts and 216 responses were received (59% response rate). | Firstly, a literature review was conducted to identify the barriers to the success of renewable-energy projects. Secondly, a questionnaire survey was distributed to collect responses. Finally, a driving-force model illustrating the influence mechanisms of renewable-energy development was established. | The analysis revealed that market, technological, and financial barriers are the main factors affecting renewable-energy projects. |
| Zhao et al. (2010) [16] | Analyze the factors affecting BOT renewable-energy (electric power) projects. | China | The survey was sent to 105 experts and 73 responses were received (70% response rate). | A literature review was conducted to identify the factors affecting renewable-energy projects. Then, a questionnaire survey was sent to experts to test the relative importance of each factor. | The analysis revealed that financial, operational, and political factors are the main parameters affecting renewable-energy projects. |
Table A2.
Main barriers investigated in the different studies in the literature.
Table A2.
Main barriers investigated in the different studies in the literature.
| Study | Regulatory | Political | Revenue | Technical | Force Majeure | Financial | Construction | Operational | Market Risks | Technological |
|---|---|---|---|---|---|---|---|---|---|---|
| Almarri and Boussabaine (2017) [76] | ✓ | ✓ | ✓ | ✓ | ||||||
| Badran (2013) [62] | ✓ | ✓ | ✓ | ✓ | ✓ | ✓ | ✓ | ✓ | ✓ | ✓ |
| Baxter (2017) [77] | ✓ | |||||||||
| Carpintero and Siemiatycki (2016) [78] | ✓ | ✓ | ||||||||
| Chen et al. (2017) [79] | ✓ | ✓ | ✓ | |||||||
| Debela (2019) [60] | ✓ | ✓ | ✓ | ✓ | ✓ | ✓ | ✓ | |||
| Diba (2012) [80] | ✓ | ✓ | ✓ | ✓ | ✓ | ✓ | ||||
| Donastorg et al. (2020) [61] | ✓ | ✓ | ✓ | |||||||
| Estache et al. (2007) [81] | ✓ | ✓ | ✓ | ✓ | ✓ | ✓ | ||||
| Ezeldin and Badran (2013) [31] | ✓ | ✓ | ✓ | ✓ | ✓ | ✓ | ✓ | ✓ | ✓ | ✓ |
| Fitzpatrick et al. (2014) [32] | ✓ | ✓ | ✓ | ✓ | ✓ | ✓ | ||||
| Grimsey and Lewis (2002) [82] | ✓ | ✓ | ✓ | ✓ | ✓ | ✓ | ✓ | ✓ | ||
| Ismail (2013) [49] | ✓ | ✓ | ✓ | ✓ | ✓ | |||||
| Kang et al. (2018) [83] | ✓ | ✓ | ✓ | |||||||
| Kavishe and Chileshe (2018) [27] | ✓ | ✓ | ✓ | ✓ | ||||||
| Ke et al. (2010) [65] | ✓ | ✓ | ✓ | ✓ | ✓ | ✓ | ✓ | ✓ | ||
| Khahro et al. (2021) [33] | ✓ | ✓ | ✓ | ✓ | ✓ | ✓ | ✓ | ✓ | ✓ | ✓ |
| Khodier (2019) [29] | ✓ | ✓ | ✓ | ✓ | ✓ | ✓ | ✓ | |||
| Komendantova et al. (2010) [30] | ✓ | ✓ | ✓ | ✓ | ✓ | ✓ | ✓ | ✓ | ||
| Kumaraswamy and Zhang (2001) [84] | ✓ | ✓ | ✓ | ✓ | ✓ | ✓ | ||||
| Kwofie et al. (2016) [85] | ✓ | ✓ | ✓ | ✓ | ✓ | |||||
| Lam et al. (2007) [86] | ✓ | ✓ | ✓ | |||||||
| Li et al. (2005) [51] | ✓ | ✓ | ✓ | ✓ | ✓ | ✓ | ✓ | ✓ | ✓ | |
| Maqbool and Sudong (2018) [68] | ✓ | ✓ | ✓ | ✓ | ✓ | ✓ | ✓ | ✓ | ||
| Maslyukivska and Sohail (2007) [87] | ✓ | ✓ | ✓ | |||||||
| Medda (2007) [88] | ✓ | ✓ | ✓ | |||||||
| Muhammad and Johar (2019) [24] | ✓ | ✓ | ✓ | ✓ | ||||||
| Ng and Loosemore (2007) [89] | ✓ | ✓ | ✓ | ✓ | ✓ | ✓ | ✓ | ✓ | ||
| NTSA (2004) [90] | ✓ | ✓ | ✓ | ✓ | ✓ | ✓ | ✓ | |||
| Odhiambo et al. (2020) [4] | ✓ | ✓ | ✓ | ✓ | ✓ | |||||
| Osei-Kyei and Chan (2015) [45] | ✓ | ✓ | ||||||||
| Osei-Kyei and Chan (2017) [48] | ✓ | ✓ | ✓ | ✓ | ✓ | |||||
| Rady (2012) [70] | ✓ | ✓ | ✓ | ✓ | ||||||
| Shen et al. (2006) [91] | ✓ | ✓ | ✓ | ✓ | ✓ | ✓ | ✓ | ✓ | ||
| Smirnova et al. (2021) [71] | ✓ | ✓ | ✓ | |||||||
| Somma, and Rubino (2016) [72] | ✓ | ✓ | ||||||||
| VDTF (2001) [92] | ✓ | ✓ | ✓ | ✓ | ||||||
| Verhoest et al. (2015) [93] | ✓ | ✓ | ||||||||
| Wang and Tiong (2000) [94] | ✓ | ✓ | ✓ | ✓ | ✓ | ✓ | ✓ | ✓ | ||
| Warburton and Baker (2005) [95] | ✓ | ✓ | ✓ | |||||||
| Xu et al. (2010) [25] | ✓ | ✓ | ✓ | ✓ | ✓ | ✓ | ✓ | ✓ | ||
| Yang et al. (2013) [96] | ✓ | ✓ | ✓ | ✓ | ||||||
| Yun et al. (2015) [97] | ✓ | ✓ | ✓ | ✓ | ✓ | |||||
| Zhao and Chen (2018) [75] | ✓ | ✓ | ✓ | ✓ | ✓ | ✓ | ✓ | ✓ | ||
| Zhao et al. (2010) [16] | ✓ | ✓ | ✓ | ✓ | ✓ | |||||
| Zou et al. (2008) [98] | ✓ | ✓ | ✓ | ✓ |
Table A3.
Key success factors investigated in the different studies in the literature.
Table A3.
Key success factors investigated in the different studies in the literature.
| Study | Technological Development | Geographic Location | Desirable Conditions | Appropriate Risk Allocation | Effective Negotiation between Parties | Skilled and Efficient Parties | Competitive Procurement Processes | Well-Prepared Contract Document |
|---|---|---|---|---|---|---|---|---|
| Almarri and Boussabaine (2017) [76] | ✓ | ✓ | ✓ | ✓ | ||||
| Debela (2019) [60] | ✓ | ✓ | ✓ | ✓ | ✓ | |||
| Diba (2012) [80] | ✓ | ✓ | ||||||
| Donastorg et al. (2020) [61] | ✓ | ✓ | ||||||
| Fitzpatrick et al. (2014) [32] | ✓ | ✓ | ✓ | |||||
| Gordon et al. (2013) [99] | ✓ | ✓ | ||||||
| Ismail (2013) [49] | ✓ | ✓ | ✓ | ✓ | ✓ | |||
| Kamel et al. (2017) [28] | ✓ | ✓ | ||||||
| Kavishe and Chileshe (2018) [27] | ✓ | ✓ | ✓ | |||||
| Khodier (2019) [29] | ✓ | ✓ | ✓ | ✓ | ✓ | ✓ | ||
| Kwofie et al. (2016) | ✓ | ✓ | ✓ | ✓ | ✓ | |||
| Lam et al. (2007) [85] | ✓ | |||||||
| Muhammad and Johar (2019) [24] | ✓ | ✓ | ✓ | |||||
| Osei-Kyei and Chan (2017) [48] | ✓ | ✓ | ✓ | ✓ | ||||
| Smirnova et al. (2021) [71] | ✓ | ✓ | ✓ | ✓ | ||||
| Yun et al. (2015) [97] | ✓ | ✓ | ✓ | ✓ | ||||
| Zhao et al. (2010) [16] | ✓ |
Table A4.
Key performance indicators investigated in the different studies in the literature.
Table A4.
Key performance indicators investigated in the different studies in the literature.
| Study | Reduction of Emissions | Produced Energy Capacity | Resources Saved | Traditional KPIs: Cost, Time, Money | Value for Money Achieved | Risk-Sharing Allocation |
|---|---|---|---|---|---|---|
| Debela (2019) [60] | ✓ | |||||
| Maqbool and Sudong (2018) [68] | ✓ | ✓ | ||||
| Maqbool et al. (2017) [100] | ✓ | ✓ | ||||
| Muller and Turner (2010) [101] | ✓ | ✓ | ||||
| Osei-Kyei et al. (2017) [48] | ✓ | ✓ | ||||
| Zhao and Chen (2018) [75] | ✓ | ✓ | ✓ |

Figure A1.
Total renewable-energy generation by source across the years.

Figure A2.
Literature review process followed in the current study.
References
- BP, BP Statistical Review of World Energy, June 2014. Available online: http://large.stanford.edu/courses/2014/ph240/milic1/docs/bpreview.pdf (accessed on 14 October 2021).
- Rajpurkar, N. Identifying Best Practices in Public-Private Partnerships in Renewable Energy. Master’s Thesis, MIT Sloan School of Management, Cambridge, MA, USA, 2015. [Google Scholar]
- Anwar, B.; Ashraf, M.I.; Alam, A. Opportunities and risk factors in public-private partnership on energy: A critical analysis of solar photovoltaic Plant at Bahawalpur. Glob. Political Rev. 2018, 3, 61–74. [Google Scholar] [CrossRef]
- Odhiambo, K.O.; Rambo, C.; Okelo, S.L. Market risk factors and performance of public private partnership renewable energy projects: The case of geothermal renewable energy projects in Kenya. Int. J. Res. Bus. Soc. Sci. 2020, 9, 366–376. [Google Scholar] [CrossRef]
- Mohsen, M.; Bagher, A.M.; Reza, B.M.; Vahid, M.M.A.; Mahdi, T. Comparing the generation of electricity from renewable and non-renewable energy sources in Iran and the world: Now and future. World J. Eng. 2015, 12, 627–638. [Google Scholar] [CrossRef]
- Zhao, Z.Y.; Tian, Y.X.; Zillante, G. Modeling and evaluation of the wind power industry chain: A China study. Renew. Sustain. Energy Rev. 2014, 31, 397–406. [Google Scholar] [CrossRef]
- Wu, G.; Zeng, M.; Peng, L.L.; Liu, X.M.; Li, B.; Duan, J.H. China’s new energy development: Status, constraints and reforms. Renew. Sustain. Energy Rev. 2016, 53, 885–896. [Google Scholar]
- Dong, L.; Liang, H.W.; Gao, Z.Q.; Luo, X.; Ren, J.Z. Spatial distribution of China’s renewable energy industry: Regional features and implications for a harmonious development future. Renew. Sustain. Energy Rev. 2016, 58, 1521–1531. [Google Scholar] [CrossRef]
- Goh, H.H.; Lee, S.W.; Chua, Q.S.; Goh, K.C.; Kok, B.C.; Teo, K.T.K. Renewable energy project: Project management, challenges and risk. Renew. Sustain. Energy Rev. 2014, 38, 917–932. [Google Scholar] [CrossRef]
- Pantaleo, A.M.; Giarola, S.; Bauen, A.; Shah, N. Integration of biomass into urban energy systems for heat and power. Part II: Sensitivity assessment of main techno-economic factors. Energy Convers. Manag. 2014, 83, 362–376. [Google Scholar] [CrossRef]
- Carlisle, J.E.; Kane, S.L.; Solan, D.; Bowman, M.; Joe, J.C. Public attitudes regarding large-scale solar energy development in the U.S. Renew. Sustain. Energy Rev. 2015, 48, 835–847. [Google Scholar] [CrossRef]
- Ansari, M.F.; Kharb, R.K.; Luthra, S.; Shimmi, S.L.; Chatterji, S. Analysis of barriers to implement solar power installations in India using interpretive structural modeling technique. Renew. Sustain. Energy Rev. 2013, 27, 163–174. [Google Scholar] [CrossRef]
- Bao, C.; Fang, C.L. Geographical and environmental perspectives for the sustainable development of renewable energy in urbanizing China. Renew. Sustain. Energy Rev. 2013, 27, 464–474. [Google Scholar] [CrossRef]
- Lin, B.Q.; Moubarak, M. Renewable energy consumption-Economic growth nexus for China. Renew. Sustain. Energy Rev. 2014, 40, 111–117. [Google Scholar] [CrossRef]
- Zeng, M.; Xue, S.; Ma, M.J.; Zhu, X.L. New energy bases and sustainable development in China: A review. Renew. Sustain. Energy Rev. 2013, 20, 169–185. [Google Scholar]
- Zhao, Z.Y.; Zuo, J.; Zillante, G.; Wang, X.W. Critical success factors for BOT electric power projects in China: Thermal power versus wind power. Renew. Energy 2010, 35, 1283–1291. [Google Scholar] [CrossRef]
- Liang, H.; Ren, J.; Gao, Z.; Gao, S.; Luo, X.; Dong, L.; Scipioni, A. Identification of critical success factors for sustainable development of biofuel industry in China based on grey decision-making trial and evaluation laboratory (DEMATEL). J. Clean. Prod. 2016, 131, 500–508. [Google Scholar] [CrossRef]
- Xu, P.; Chan, E.H.W.; Qian, Q.K. Success factors of energy performance contracting (EPC) for sustainable building energy efficiency retrofit (BEER) of hotel buildings in China. Energy Pol. 2011, 39, 7389–7398. [Google Scholar] [CrossRef]
- Young, J.; Brans, M. Analysis of factors affecting a shift in a local energy system towards 100% renewable energy community. J. Clean. Prod. 2017, 169, 117–124. [Google Scholar] [CrossRef]
- Zhao, Z.Y.; Zuo, J.; Feng, T.T.; Zillante, G. International cooperation on renewable energy development in China—A critical analysis. Renew. Energy 2011, 36, 1105–1110. [Google Scholar] [CrossRef]
- Zhao, Z.Y.; Chen, Y.L.; Chang, R.D. How to stimulate renewable energy power generation effectively?-China’s incentive approaches and lessons. Renew. Energy 2016, 92, 147–156. [Google Scholar] [CrossRef]
- Freedman, S.; Katz, L. Critical success factors for international projects. PM World Today 2007, 9, 1–8. [Google Scholar]
- Bazeley, P. Qualitative Data Analysis with NVivo; Sage: London, UK, 2013. [Google Scholar]
- Muhammad, Z.; Johar, F. Critical success factors of public–private partnership projects: A comparative analysis of the housing sector between Malaysia and Nigeria. Int. J. Constr. Manag. 2019, 19, 257–269. [Google Scholar] [CrossRef]
- Xu, Y.; Yeung, J.F.; Chan, A.P.; Chan, D.W.; Wang, S.Q.; Ke, Y. Developing a risk assessment model for PPP projects in China—A fuzzy synthetic evaluation approach. Autom. Constr. 2010, 19, 929–943. [Google Scholar] [CrossRef]
- Luthra, S.; Garg, D.; Haleem, A. The impacts of critical success factors for implementing green supply chain management towards sustainability: An empirical investigation of Indian automobile industry. J. Clean. Prod. 2016, 121, 142–158. [Google Scholar] [CrossRef]
- Kavishe, N.; Chileshe, N. Critical success factors in public-private partnerships (PPPs) on affordable housing schemes delivery in Tanzania: A qualitative study. J. Facil. Manag. 2018, 17, 188–207. [Google Scholar] [CrossRef]
- Kamel, M.; Montaser, A.; Abd El-Rashid, I. Public private partnership in Egypt. In Proceedings of the Canadian Society for Civil Engineering Annual Conference (CSCE 2017), 6th CSCE/CRC International Construction Specialty Conference, Vancouver, BC, Canada, 31 May–3 June 2017; Volume 9. [Google Scholar]
- Khodeir, L. Evaluating the role of project management education towards enhancing architecture students competency skills. JES J. Eng. Sci. 2019, 46, 754–766. [Google Scholar] [CrossRef]
- Komendantova, N.; Patt, A.; Barras, L.; Battaglini, A. Perception of risks in renewable energy projects: The case of concentrated solar power in North Africa. Energy Policy 2012, 40, 103–109. [Google Scholar] [CrossRef]
- Ezeldin, A.S.; Badran, Y. Risk decision support system for public private partnership projects in Egypt. Int. J. Eng. Innov. Technol. 2013, 3, 479–486. [Google Scholar]
- Fitzpatrick, A.; Zovaro, V.; Draia, S. Public-private partnerships in the middle East and North Africa. In A Handbook for Policy Makers; Organization for Economic Cooperation and Development: Paris, France, 2014. [Google Scholar]
- Khahro, S.H.; Ali, T.H.; Hassan, S.; Zainun, N.Y.; Javed, Y.; Memon, S.A. Risk Severity Matrix for Sustainable Public-Private Partnership Projects in Developing Countries. Sustainability 2021, 13, 3292. [Google Scholar] [CrossRef]
- Gupta, A.K.; Trivedi, M.K.; Kansal, R. Risk variation assessment of Indian road PPP projects. Int. J. Sci. Environ. Technol. 2013, 2, 1017–1026. [Google Scholar]
- Smith, G.; Sochor, J.; Karlsson, I.M. Public–private innovation: Barriers in the case of mobility as a service in West Sweden. Public Manag. Rev. 2019, 21, 116–137. [Google Scholar] [CrossRef]
- Mamine, F.; Farès, M.H. Barriers and levers to developing wheat–pea intercropping in Europe: A review. Sustainability 2020, 12, 6962. [Google Scholar] [CrossRef]
- Thum-Thysen, A.; Voigt, P.; Bilbao-Osorio, B.; Maier, C.; Ognyanova, D. Investment dynamics in Europe: Distinct drivers and barriers for investing in intangible versus tangible assets? Struct. Chang. Econ. Dyn. 2019, 51, 77–88. [Google Scholar] [CrossRef]
- Cui, C.; Liu, Y.; Hope, A.; Wang, J. Review of studies on the public–private partnerships (PPP) for infrastructure projects. Int. J. Proj. Manag. 2018, 36, 773–794. [Google Scholar] [CrossRef]
- Abdel Aziz, A.M. Successful delivery of public-private partnerships for infrastructure development. J. Constr. Eng. Manag. 2007, 133, 918–931. [Google Scholar] [CrossRef]
- Liu, T.; Wang, Y.; Wilkinson, S. Identifying critical factors affecting the effectiveness and efficiency of tendering processes in Public–Private Partnerships (PPPs): A comparative analysis of Australia and China. Int. J. Proj. Manag. 2016, 34, 701–716. [Google Scholar] [CrossRef]
- Furumo, P.R.; Lambin, E.F. Scaling up zero-deforestation initiatives through public-private partnerships: A look inside post-conflict Colombia. Glob. Environ. Chang. 2020, 62, 102055. [Google Scholar] [CrossRef]
- Leigland, J. Public-private partnerships in developing countries: The emerging evidence-based critique. World Bank Res. Obs. 2018, 33, 103–134. [Google Scholar] [CrossRef]
- Liu, T.; Wilkinson, S. Adopting innovative procurement techniques: Obstacles and drivers for adopting public private partnerships in New Zealand. Constr. Innov. 2011, 11, 452–469. [Google Scholar] [CrossRef]
- Sanni, A.O. Factors determining the success of public private partnership projects in Nigeria. Constr. Econ. Build. 2016, 16, 42–55. [Google Scholar] [CrossRef]
- Osei-Kyei, R.; Chan, A.P. Review of studies on the Critical Success Factors for Public–Private Partnership (PPP) projects from 1990 to 2013. Int. J. Proj. Manag. 2015, 33, 1335–1346. [Google Scholar] [CrossRef]
- Sehgal, R.; Dubey, A.M. Identification of critical success factors for public–private partnership projects. J. Public Aff. 2019, 19, e1956. [Google Scholar] [CrossRef]
- Hsueh, C.M.; Chang, L.M. Critical success factors for PPP infrastructure: Perspective from Taiwan. J. Chin. Inst. Eng. 2017, 40, 370–377. [Google Scholar] [CrossRef]
- Osei-Kyei, R.; Chan, A.P. Implementing public–private partnership (PPP) policy for public construction projects in Ghana: Critical success factors and policy implications. Int. J. Constr. Manag. 2017, 17, 113–123. [Google Scholar] [CrossRef]
- Ismail, S. Critical success factors of public private partnership (PPP) implementation in Malaysia. Asia-Pac. J. Bus. Adm. 2013, 5, 6–19. [Google Scholar] [CrossRef]
- Zou, W.; Kumaraswamy, M.; Chung, J.; Wong, J. Identifying the critical success factors for relationship management in PPP projects. Int. J. Proj. Manag. 2014, 32, 265–274. [Google Scholar] [CrossRef]
- Li, B.; Akintoye, A.; Edwards, P.J.; Hardcastle, C. The allocation of risk in PPP/PFI construction projects in the UK. Int. J. Proj. Manag. 2005, 23, 25–35. [Google Scholar]
- Chou, J.S.; Pramudawardhani, D. Cross-country comparisons of key drivers, critical success factors and risk allocation for public-private partnership projects. Int. J. Proj. Manag. 2015, 33, 1136–1150. [Google Scholar] [CrossRef]
- Wibowo, A.; Alfen, H.W. Government-led critical success factors in PPP infrastructure development. Built Environ. Proj. Asset Manag. 2015, 5, 121–134. [Google Scholar] [CrossRef]
- Araujo, L.G.; Piña, A.B.S.; Aidar, L.A.G.; Coelho, G.O.; Carvalho, M.T.M. Recommendations and guidelines for implementing PPP projects: Case of the electricity sector in Brazil. Built Environ. Proj. Asset Manag. 2019, 9, 262–276. [Google Scholar] [CrossRef]
- Menezes, D.C.; Hoffmann, V.E.; Zanquetto Filho, H. Stakeholders and Critical Factors in the Brazilian Government’s Public Private Partnerships. Rev. Serviço Público 2019, 70, 371–401. [Google Scholar] [CrossRef]
- Sastoque, L.M.; Arboleda, C.A.; Ponz, J.L. A proposal for risk allocation in social infrastructure projects applying PPP in Colombia. Procedia Eng. 2016, 145, 1354–1361. [Google Scholar] [CrossRef]
- Cheung, E.; Chan, A.P.; Kajewski, S. Factors contributing to successful public private partnership projects: Comparing Hong Kong with Australia and the United Kingdom. J. Facil. Manag. 2012, 10, 45–58. [Google Scholar] [CrossRef]
- Ahmadabadi, A.A.; Heravi, G. The effect of critical success factors on project success in Public-Private Partnership projects: A case study of highway projects in Iran. Transp. Policy 2019, 73, 152–161. [Google Scholar] [CrossRef]
- Babonea, A.M.; Gherman, M.G. Public-private partnership in the context of regional development-a solution for renewable energy projects? Theor. Appl. Econ. 2014, 21, 77–88. [Google Scholar]
- Debela, G.Y. Critical success factors (CSFs) of public–private partnership (PPP) road projects in Ethiopia. Int. J. Constr. Manag. 2022, 22, 489–500. [Google Scholar] [CrossRef]
- Donastorg, A.; Renukappa, S.; Suresh, S. Evaluating critical success factors for implementing renewable energy strategies in the Dominican Republic. Renew. Energy 2020, 149, 329–335. [Google Scholar] [CrossRef]
- Badran, Y. Risk Analysis and Contract Management for Public Private Partnership Projects in Egypt. Master’s Thesis, American University in Cairo, New Cairo, Egypt, 2013. [Google Scholar]
- Helmy, R.; Khourshed, N.; Wahba, M.; Bary, A.A.E. Exploring critical success factors for public private partnership case study: The educational sector in Egypt. J. Open Innov. Technol. Mark. Complex. 2020, 6, 142. [Google Scholar] [CrossRef]
- Ika, L.A.; Diallo, A.; Thuillier, D. Critical success factors for World Bank projects: An empirical investigation. Int. J. Proj. Manag. 2012, 30, 105–116. [Google Scholar] [CrossRef]
- Ke, Y.; Wang, S.; Chan, A.P.; Lam, P.T. Preferred risk allocation in China’s public–private partnership (PPP) projects. Int. J. Proj. Manag. 2010, 28, 482–492. [Google Scholar] [CrossRef]
- Korayem, I.M.; Ogunlana, S.O. The “Water-Specific PPP Risk Model”: A Case Study in Egypt. In Public Private Partnerships; Springer: Cham, Switzerland, 2019; pp. 233–260. [Google Scholar]
- Maqbool, R. Efficiency and effectiveness of factors affecting renewable energy projects: An empirical perspective. Energy 2018, 158, 944–956. [Google Scholar] [CrossRef]
- Maqbool, R.; Sudong, Y. Critical success factors for renewable energy projects; empirical evidence from Pakistan. J. Clean. Prod. 2018, 195, 991–1002. [Google Scholar] [CrossRef]
- Othman, K.; Khallaf, R. A review of public-private partnership for renewable energy projects in developing countries. In Proceedings of International Structural Engineering and Construction; State-of-the-Art Materials and Techniques in Structural Engineering and Construction; ISEC Press: Fargo, ND, USA, 2022; Volume 9. [Google Scholar]
- Rady, A.M.A. The Assessment of Public Private Partnership Program in Egypt. Ph.D. Dissertation, KDI School, Sejong City, Korea, 2012. [Google Scholar]
- Smirnova, E.; Kot, S.; Kolpak, E.; Shestak, V. Governmental support and renewable energy production: A cross-country review. Energy 2021, 230, 120903. [Google Scholar] [CrossRef]
- Somma, E.; Rubino, A. Public-private participation in energy infrastructure in middle East and North African countries: The role of institutions for renewable energy sources diffusion. Int. J. Energy Econ. Policy 2016, 6, 621–629. [Google Scholar]
- Wang, B.; Rasool, S.F.; Zhao, Y.; Samma, M.; Iqbal, J. Investigating the nexus between critical success factors, despotic leadership, and success of renewable energy projects. Environ. Sci. Pollut. Res. 2022, 29, 10388–10398. [Google Scholar] [CrossRef]
- Zaman, S.; Wang, Z.; Rasool, S.F.; uz Zaman, Q.; Raza, H. Impact of critical success factors and supportive leadership on sustainable success of renewable energy projects: Empirical evidence from Pakistan. Energy Policy 2022, 162, 112793. [Google Scholar] [CrossRef]
- Zhao, Z.Y.; Chen, Y.L. Critical factors affecting the development of renewable energy power generation: Evidence from China. J. Clean. Prod. 2018, 184, 466–480. [Google Scholar] [CrossRef]
- Almarri, K.; Boussabaine, H. Interdependency of the critical success factors and ex-post performance indicators of PPP projects. Built Environ. Proj. Asset Manag. 2017, 7, 546–556. [Google Scholar] [CrossRef]
- Baxter, D. 10 Important Questions to Ask The Public Sector When Pursuing a PPP Procurment. Published on Infrastructure and Public Private Partnerships. 2017. Available online: https://blogs.worldbank.org/ppps/10-important-questions-ask-public-sector-when-pursuing-ppp-procurement (accessed on 23 February 2022).
- Carpintero, S.; Siemiatycki, M. The politics of delivering light rail transit projects through public-private partnerships in Spain: A case study approach. Transp. Pol. 2016, 49, 159–167. [Google Scholar] [CrossRef]
- Chen, Z.; Daito, N.; Gifford, J.L. Socioeconomic impacts of transportation public-private partnerships: A dynamic CGE assessment. Transp. Pol. 2017, 58, 80–87. [Google Scholar] [CrossRef]
- Diba, H. Critical Success Factors for Public Private Partnership Projects in the Kenyan Road Sub-Sector. Master’s Thesis, University of Nairobi, Nairobi, Kenya, 2012. [Google Scholar]
- Estache, A.; Juan, E.; Trujillo, L. Public–Private Partnerships in Transport; Policy Research Working Paper 4436; Sustainable Development Vice-Presidency, The World Bank: Washington, DC, USA, 2007. [Google Scholar]
- Grimsey, D.; Lewis, M. Evaluating the risks of public private partnerships for infrastructure projects. Int. J. Proj. Manag. 2002, 20, 107–118. [Google Scholar] [CrossRef]
- Kang, S.; Mulaphong, D.; Hwang, E.; Chang, C. Public-private partnerships in developing countries: Factors for successful adoption and implementation. Int. J. Public Sect. Manag. 2018, 32, 334–351. [Google Scholar] [CrossRef]
- Kumaraswamy, M.M.; Zhang, X.Q. Governmental role in BOT-led infrastructure development. Int. J. Proj. Manag. 2001, 19, 195–205. [Google Scholar] [CrossRef]
- Kwofie, T.E.; Afram, S.; Botchway, E. A critical success model for PPP public housing delivery in Ghana. Built Environ. Proj. Asset Manag. 2016, 6, 58–73. [Google Scholar] [CrossRef]
- Lam, K.C.; Wang, D.; Lee, P.T.K.; Tsang, Y.T. Modeling risk allocation decision in construction contracts. Int. J. Proj. Manag. 2007, 25, 485–493. [Google Scholar] [CrossRef]
- Maslyukivska, O.; Sohail, M. European infrastructure procurement through PPP. Proc. Inst. Civ. Eng. Manag. Procure. Law 2007, 160, 159–167. [Google Scholar] [CrossRef]
- Medda, F. A game theory approach for the allocation of risks in transport public private partnerships. Int. J. Proj. Manag. 2007, 25, 213–218. [Google Scholar] [CrossRef]
- Ng, A.; Loosemore, M. Risk allocation in the private provision of public infrastructure. Int. J. Proj. Manag. 2007, 25, 66–76. [Google Scholar] [CrossRef]
- National Treasury of South Africa (NTSA). Public–Private Partnership Manual—Module 4: PPP Feasibility Study; National Treasury of South Africa (NTSA): Pretoria, South Africa, 2004; pp. 63–66.
- Shen, L.Y.; Platten, A.; Deng, X.P. Role of public private partnerships to manage risks in public sector projects in Hong Kong. Int. J. Proj. Manag. 2006, 24, 587–594. [Google Scholar] [CrossRef]
- Victorian Department of Treasury and Finance (VDTF). Partnerships Victoria: Risk Allocation and Contractual Issues; Victorian Department of Treasury and Finance (VDTF): Victoria, Australia, 2001; pp. 178–191.
- Verhoest, K.; Petersen, O.H.; Scherrer, W.; Soecipto, M.R. How Do Governments Support the Development of Public Private Partnerships? Measuring and Comparing PPP Governmental Support in 20 European Countries. Transp. Rev. 2015, 35, 118–139. [Google Scholar] [CrossRef]
- Wang, S.Q.; Tiong, R.L.K. Case study of government initiatives for PRC’s BOT power plant projects. Int. J. Proj. Manag. 2000, 18, 69–78. [Google Scholar] [CrossRef]
- Warburton, W.; Baker, B. Integrity Systems and Local Government; National Council of the Institute of Public Administration: Canberra, Australia, 2004; pp. 63–68. [Google Scholar]
- Yang, Y.; Wang, Y.; Hou, Y. On the Development of Public–Private Partnerships in Transitional Economies: An Explanatory Framework. Public Adm. Rev. 2013, 73, 301–310. [Google Scholar] [CrossRef]
- Yun, S.; Jung, W.; Han, S.H.; Park, H. Critical organizational success factors for public private partnership projects–a comparison of solicited and unsolicited proposals. J. Civ. Eng. Manag. 2015, 21, 131–143. [Google Scholar] [CrossRef]
- Zou, X.W.; Wang, S.Q.; Fang, D.P. A life-cycle risk management framework for PPP infrastructure projects. J. Financ. Manag. Prop. Constr. 2008, 13, 123–142. [Google Scholar] [CrossRef]
- Gordon, C.; Mulley, C.; Stevens, N.; Daniels, R. Public–private contracting and incentives for public transport: Can anything be learned from the Sydney Metro experience? Transp. Pol. 2013, 27, 73–84. [Google Scholar] [CrossRef]
- Maqbool, R.; Sudong, Y.; Manzoor, N.; Rashid, Y. The impact of emotional intelligence, project managers’ competencies, and transformational leadership on project success. Proj. Manag. J. 2017, 48, 58–75. [Google Scholar] [CrossRef]
- Muller, R.; Turner, R. Leadership competency profile of successful project managers. Int. J. Proj. Manag. 2010, 28, 437–448. [Google Scholar] [CrossRef]
Publisher’s Note: MDPI stays neutral with regard to jurisdictional claims in published maps and institutional affiliations. |
© 2022 by the authors. Licensee MDPI, Basel, Switzerland. This article is an open access article distributed under the terms and conditions of the Creative Commons Attribution (CC BY) license (https://creativecommons.org/licenses/by/4.0/).