Abstract
(1) Background: China is beginning to see increasingly complex real estate development dynamics as urbanization, industrialization and globalization advance. As a key driver of economic and social development in China’s cities, real estate has created prosperity while facing the risk of capitalization and a “hard landing”, making it increasingly difficult to bring it under control. (2) Methods: a new approach that integrates “evolution dynamics–driving mechanism–policy design” is constructed based on the Boston Consulting Group matrix, exploratory spatial data analysis, GIS and Geodetector, and this paper empirically studies the dynamics and driving mechanism of real estate development based on the case study of small county-level cities in Gansu, China. (3) Results: Firstly, real estate development in Gansu is characterized by significant spatial differentiation, heterogeneity and autocorrelation, and its distribution pattern comes into being from unsynchronized macroeconomic, population, social, industrial, institutional and policy development interweaved with the real estate control. Secondly, the real estate is diversified in spatiotemporal evolution models, and the cold and hot cities of different models are in quite different geographical patterns with high spatial agglomeration. Thirdly, there are many driving factors affecting the distribution patterns in real estate. These factors are in complex relationships and they are classified into three categories of “Scale–Contribution–Comprehensive”-oriented driving factor and three sub-categories of “Key–Important–Auxiliary” factors. Fourthly, the factors show large differences in the interaction effects, with the real estate industry scale influencing factors being dominated by bifactor enhancement and the economic contribution influencing factors being dominated by non-linear enhancement. Notably, factors such as permanent resident population, urbanization and government revenue have a strong direct influence on the industry scale and economic contribution of real estate, and factors such as expenditure, output value of industry, urbanization rate and number of secondary schools all have a strong interactive influence. (4) Conclusions: The cities are divided into four policy areas of comprehensive development, contribution improvement, scale growth and free decision. Furthermore, differentiated and adaptive measures are proposed for each zoning, which significantly improves the accuracy and synergy of urban real estate management.
1. Introduction
Characterized by a long industrial chain, extensive correlation and great synthesis, real estate plays a basic and pioneering industrial role in the national economy. Real estate is a high-investment and high-risk industry with long construction cycles, poor realizability and high uncertainty, which makes it a key area for economic development decisions and risk management [1,2]. Therefore, it is of great practical value and theoretical significance for both the management practice and academic research to analyze the spatiotemporal evolution dynamics of real estate economy development and its influencing factors and to reveal its driving mechanism and interactive relationship.
China’s real estate economy is developing rapidly and on a huge scale as a matter of the overall situation of Chinese residents’ contentment as well as economic and social development, and its importance, complexity and sensitivity are increasingly highlighted with the development of national economy and social transformation. It is a typical representative in the world. Since the reform and open-up policy was adopted, especially since the housing monetization reform was implemented in 1998, China’s real estate has gained rapid development with continuous expansion of the market. According to the China Statistical Yearbook 2020, the added value of China’s real estate industry grew from CNY 7.97 billion to CNY 6963.15 billion from 1978 to 2019, an increase of more than 870 times, much higher than the growth rate of China’s GDP in the same period (about 370 times); to calculate the growth index of constant prices based on 100 in 1978, the growth index of China’s real estate economy in 2019 was 5026.17, much higher than the GDP of 3929.24 in the same period. China’s real estate achieved an increase in its added value from 2.17% to 7.03% of GDP from 1978 to 2019, at a rate of growth more than three times and has become a crucial leading industry. According to the Market Size Report on Global Real Estate, China surpassed Germany in 2018 and has grown into the world’s fourth-largest real estate market, behind only the United States, Japan and the United Kingdom.
Since real estate has played a significant role in supporting and driving China’s industrialization and urbanization and has also led to serious economic and social problems such as high housing prices, overheated investment, serious bubbles, high financial risks and narrowed development space of the real economy, it has become a focus of attention for the government, industry, academia and the public [3,4]. The real estate market is similar to coins, with two-sidedness. On the one hand, a small scale may have a weak economic and social pull effect, and on the other hand, a large scale may bring huge risks. For example, if the added value of the real estate industry is too large as a share of GDP, it may pose great danger to economic and social development. Furthermore, with the transformation of industrialization and urbanization in China and the restructuring of its real estate market, different regions and cities are experiencing varying degrees of contradictions in real estate supply and demand, and the level of real estate development, especially the spatial differences in real estate prices and their changes, are becoming increasingly evident and the spatial problem in real estate economy is becoming more acute [5,6]. In this case, an in-depth study of the spatiotemporal evolution dynamics of China’s real estate and its driving mechanisms has turned into an urgent new issue. In other words, there is an urgent need for real estate developers, managers or government officials to know the similarities and differences in the dynamics of the real estate economy in different Chinese cities: what are the nuances of their driving forces and what approaches should be taken to address them in the course of their development and management practice?
The immovability of real estate determines that real estate is a regional market, with significant variability in the development of the economy in different cities, leading to a high spatial heterogeneity and complexity of real estate market development [7]. With the advancement of industrialization, urbanization, marketization and globalization, the complexity of China’s urban real estate market in the spatial dimension is becoming more prominent, yet studies in this area, especially on the spatiality of the real estate economy in small cities, are still insufficient. This paper mainly deals with the questions as follows: (1) What regular features does the dynamic of real estate economy in small cities have? (2) What are the factors affecting the spatiotemporal evolution of the real estate economy and how to deconstruct the interaction effects or driving mechanisms among different factors? (3) How can the research methods and analysis results be applied to the making of urban real estate market governance policies? Therefore, this paper tries to quantitatively measure the dynamics and evolution model of real estate market development based on the case study of county-level cities in Gansu, China, and to quantitatively portray the force of its influencing factors and the interaction effect between its driving factors, so as to further reveal the mechanism of spatial heterogeneity and the relevance of real estate market development. It also makes recommendations for adaptive real estate market regulation measures and policy design with a view to informing policy decisions for the healthy and coordinated development of the real estate economy in China and other similar countries.
2. The Literature Review
2.1. Studies on the Spatial Effect of Real Estate Economy
The focus is on spatial topics of real estate market development, including spatial distribution, spatial agglomeration, spatial decision making, spatial impact and spatial relevance and correlation of the real estate industry. For example, Gu analyzed the time-varying conditional correlations and contagion effects among global real estate markets by means of multivariate generalized autoregressive conditional heteroscedasticity (MGARCH) with spatial effects [8]. Moscone [9] and Mosciaro [10] discussed the spatial effects of the real estate economy in the United States, Brazil, Italy and other countries, arguing that real estate has grown into a productive tool for urban space and finance. Evans argues that the real estate economy is naturally spatial and constructs an urban housing spatial agent-based model [11]. Dube [12] and Barreca [13] measured the spatial autocorrelation of the real estate economy and analyzed the main factors influencing the real estate market development from a spatial perspective. Pace put forward a method for spatial statistical analysis of real estate [14], and Wang conducted an empirical study of real estate space, analyzing the spatiotemporal agglomeration and evolution characteristics of the real estate industry in Guangzhou [15]. Lukas [16], Shatkin [17], Susewind [18] and Ramos [19] analyzed the role and influence of real estate production and transformation in the process of urban growth, spatial competition, spatial segregation and social and spatial inequality, stating that real estate has become an urban growth machine, and introduced the study of real estate economics into political economy and political ecology. Jun [20], Iqbal and Wilhelmsson [21,22] and Aguirre [23] analyzed the spatial role and impact of real estate and related factors, including the impact of the greenbelt on the real estate market, the spatial pattern of crime hotspots on housing prices and the informal real estate development on the construction of urban space.
2.2. Studies on Factors Influencing Real Estate Market Development
The focus is on the analysis of the composition and strength of the factors influencing the real estate economy development, including the following three directions, that is, supply-side research, demand-side research and comprehensive research.
The first is the supply-side research, which focuses on exploring the impact of land, capital, institutions, population and labor, inventory management and innovation and other factors on real estate market development [24]. For example, Dong analyzed the way that land auction formats affect the market structure and aggregate surplus of real estate development [25]. Golob analyzed the effect of capital parameters such as inflation and interest rates on the value of real estate [26]. Ahmed [27] investigated the impact of unconventional monetary policies on the development of commercial housing in Italy. Edelstein analyzed the influence that institutional factors have on the real estate returns across the world, arguing that excess real estate returns depend to some extent on how good a country’s legal system and corporate governance environment is, and that institutional factors have a more prominent impact on international real estate returns in the Asia-Pacific region [28]. Wei analyzed the influence of institutional factors on real estate credit in China, revealing the unraveled prevalent evasive practices and illicit tactics adopted by developers to thwart policy effects [29]. Bergeaud analyzed the causal connection between labor demand and real estate development [30].
The second is the demand-side research, which focuses on the impact of factors such as investment and development, consumption and sales, openness and globalization on real estate market development. Warsame believes that the intensity of competition, the scale of subsidies and the proportion of tax revenue are important factors that affect the development of real estate in Sweden [31]. Shen analyzed the key factors affecting green procurement in real estate development [32]. Zalejska-Jonsson, from a consumer perspective, analyzed the willingness of residents to pay for green land and space during housing and constructed a comprehensive conceptual model [33]. McMillan [34] analyzed the impact of community characteristics on real estate investors and sales; Ullah [35] analyzed the key factors influencing the purchase or rental decision of smart real estate; Dabholkar [36] explored the drive mechanism of real estate agent service on real estate consumption, especially home sellers. Oikarinen analyzed the impact of foreign investment on the economic development of real estate, believing that the increase in foreign investors has a very significant negative impact on the capitalization of the real estate market [37]. Zhang [38] stated that the real estate market plays a significant role in import and export under the new normal in China; Sun [39] argued that the highly externally oriented economic structure has led to the structural real estate bubbles in China; Zhang [40] examined the connection between international tourism and real estate market development in Iceland.
The third is the comprehensive research, which focuses on the impact of multi-factor or comprehensive conditions on real estate market development, different from the supply-side research and the demand-side research. For example, Yan analyzed the impact of real estate on macroeconomic development based on data mining [41]; Ang analyzed the factors that have a joint influence on public and private real estate returns and cycles [42]; Kirikkaleli analyzed the impact of exchange rates and gold prices on real estate stock prices in Turkey [43]. Furthermore, in terms of the international real estate market development, Hamelink analyzed the key factors influencing international real estate security returns [44]; Ho created a multi-factor estimation model for international direct real estate risk premiums [45]; Pavlov analyzed the impact of macroeconomic risk factors on international real estate security returns [46]; Eichholtz analyzed how much continental factors influence international real estate returns [47]; Carrasco-Gallego [48] viewed the relationship between real estate and the financial sector, the labor market and the agents of producing entities in the development of macroeconomic and financial stability.
2.3. Summary of the Literature Review
Constructive and creative results have generally been achieved in the study of spatial effects and influencing factors of real estate economy, which have enriched the theoretical connotation of real estate economics and provided important reference for this paper. However, there are certain shortcomings in the existing studies, mainly in the following two areas:
First, existing studies focus on single or special cases in large cities or metropolitan areas, lacking specialized studies on small cities and comparative studies among multiple cities. Existing papers prefer case studies of large cities and metropolitan areas in developed countries or regions. For example, Bouwmeester [49] analyzed the impact of polycentric development on the spatial evolution of real estate values in Barcelona; Sarathy [50] analyzed the total quality management practices in real estate in metropolitan areas such as Mumbai and Bangalore; Chang [51] analyzed the impact of environmental greening design on the real estate market in Taiwan metropolitan areas; Long [52] analyzed the impact of shopping malls on apartment prices in Stockholm; Martori [53] analyzed the connection between real estate bubbles and urban population density in six metropolitan areas in Spain; Wilhelmsson [54,55,56] conducted a systematic study on the impact of real estate market risks, buyers’ bargaining power and criminal space on housing prices in Stockholm; Smith [57] studied the impact of VAT on real estate development in Chicago. As stated above, the real estate economy is regional, and comparative studies of multiple regions and ordinary cities (generated with a large proportion and little distinctive features in the town system) are of great value. However, such studies are still very rare; nothing is available except exploratory studies conducted by Berggren [58], Mandell [59], Liu [60,61] and Yang [62] based on the case investigation of Sweden and China.
Second, there is a lack of comprehensive multivariate studies and insufficient analysis of the interaction effects between factors. Many factors and their interaction will have an impact on the development and change of the real estate industry. The factors are in a complex interactive connection, and many factors may show synergistic reinforcement or antagonistic constraints in the interaction, thus influencing the driving force of the factors acting alone. However, the existing papers neglect quantitative measurements and in-depth analysis. In addition, many of the papers show significant spatial effects of real estate development dynamics, but their work is based on traditional regression models rather than spatial econometric models, leading to impaired accuracy of the analysis results. Finally, China’s real estate development plays an important role in its own and world economic development, which is typical and representative in the world. However, most of the papers focus on developed countries in Europe and the Americas (such as the United States, Spain, Italy, etc.) and pay less attention to less developed countries, especially China.
3. Research Design
3.1. Study Area: County Level Cities in Gansu Province
The study area covers 83 county-level cities in Gansu (Figure 1). Gansu, located in the northwest of China, is an underdeveloped inland province with 86 county-level cities. It is noteworthy that Anning, Jishishan and Maqu were excluded from the study area for three reasons: non-availability of their variable data or no such data, their limited number and a small scale of real estate that have a negligible and tolerable impact on the study area and the intention to avoid data interpolation or estimation processing procedures, so as to ensure the accuracy of the research and analysis.
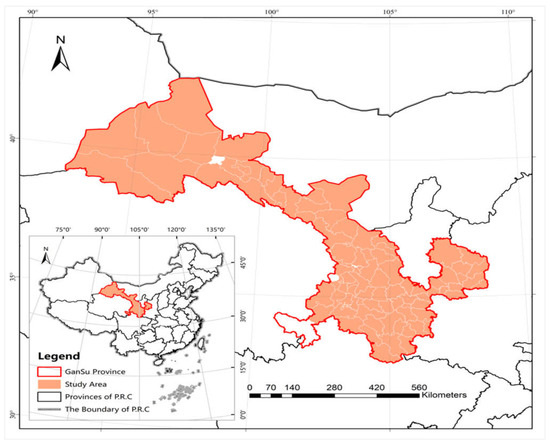
Figure 1.
Study Area.
Gansu attaches great importance to the development of the real estate economy, and it has promulgated and implemented Opinions of Gansu Provincial Department of Construction on Stabilizing Housing Price and Promoting Healthy Development of Real Estate Industry, Opinions of Promoting Sustained, Stable and Healthy Development of Real Estate Industry and other policies. A series of initiatives have promoted the continuous and rapid expansion of the real estate economy, the increased proportion of the added value of the real estate industry to GDP amidst fluctuations and the growing maturity of the real estate market (Figure 2).
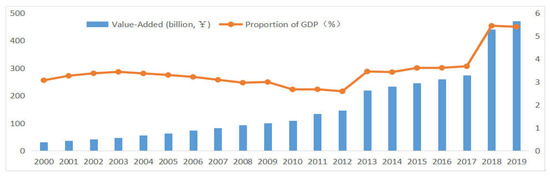
Figure 2.
Evolution of real estate market in Gansu Province.
Small cities account for the largest proportion in the regional urban system, and the case studies of county-level cities in Gansu are highly representative and universal. In 2019, there were 333 prefecture-level cities and 2846 county-level cities in China, the latter 8.5 times more than the former. The existing studies mainly focus on large cities and metropolitan areas, but the applicability and practicality of the existing findings to small cities are insufficient due to factors such as development stage, resource conditions and scale effects. In addition, there are 31 provinces, autonomous regions and municipalities directly under the Central Government in China, and Gansu Province is located in the underdeveloped areas in the west, which is also fairly representative of China. In 2019, real estate in Gansu saw an added value up to CNY 47.049 billion, accounting for 5.40% of GDP, and it has grown into the leading industry in the province. Compared with other Chinese provinces in the same period, Gansu is in the middle in real estate market development (see Figure 3), not an extreme case with the best or worst real estate market development, so the studies on it will provide a beneficial reference for more provinces or similar regions. In general, the town construction of county-level cities in Gansu is highly dependent on real estate market development due to the lack of characteristic resources and industries, while its real estate market development is facing more and greater difficulties and challenges, so its comparative study will offer a great value in both theory and practice.
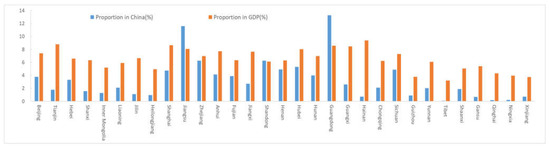
Figure 3.
Comparative analysis of China’s real estate.
3.2. Research Steps
The first step is to study spatiotemporal dynamics. First, this paper reveals the geographical pattern of real estate economy development using GIS spatial analysis tools. Second, it analyzes the evolution pattern of real estate economy development by leveraging the Boston Consulting Group Matrix. Third, it examines the spatial effects of real estate economy development by Exploratory Spatial Data Analysis (ESDA) and Gini methods to measure spatial heterogeneity, agglomeration and autocorrelation. The second step is to study the driving mechanism. First, the model that should be used for the regression analysis is selected based on the presence or absence of spatial effects. Second, Geodetector is used to measure the direct and interactive influences of different factors. The third step is to study the policy design. We apply the research methods and analysis results to the practical work of real estate economy development in Gansu and propose strategies and suggestions for zoning management (Figure 4).
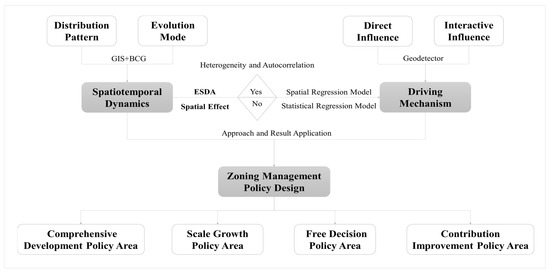
Figure 4.
Research steps.
The size of the added value achieved by real estate is a key indicator to measure the real estate industry and economy development, and its share in GDP (Gross Domestic Product) presents the part of real estate in the urban economic development. Both of them are major parameters for evaluating the overall strength of real estate market development and its contribution as dependent variables in this paper. The analysis of the literature review in the second part shows that real estate market development is influenced by many factors such as land, capital and finance, institutions, population, taxation, exchange rate, foreign investment and tourism, and that more complex relationships or influence changes will be produced in the process of the superposition of different factors. Real estate market development has always been perceived as a complex issue determined by both endogenous and exogenous elements. Therefore, with reference to the aforementioned findings and in view of the data accessibility and completeness, this paper chooses 30 indicators as independent variables from five areas of economic development level—industrial structure, demographic characteristics, social facility conditions and institutional and policy drivers—to probe into the driving mechanism of distribution patterns in real estate market (Table 1).

Table 1.
Variable selection and its implication description.
We make the following assumptions in the construction of the indicator system: the size of GDP and per capita GDP reflect the level and stage of urban economic development on the whole and they represent the macroeconomic context of real estate market development [63,64]. Land finance (the practice of some local governments relying on revenues from the granting of land-use rights to sustain local fiscal expenditures) is the underlying logic of China’s real estate economy, and the impact of fiscal revenues and expenditures on the development of the real estate economy should not be ignored [65]. The level of residents’ income determines their purchasing power, the household and social consumption level reflects the general situation of the consumer market and the residents’ income and consumption ability are important factors affecting the demand and sales of real estate [66]. The development of real estate is bound up with industrialization and urbanization in China. The development of industry and finance and the urban–rural transformation of population residence and identity are key to the stable, healthy and sustainable development of real estate economy. Both industrial structure and demographic characteristics are in a complex interaction with real estate [67]. Transportation, schools, hospitals and other infrastructure and public services determine the spatial accessibility of real estate and convenience of life, and social opinion is closely connected with the level of public knowledge and understanding of real estate, all having a significant influence on the decision making of home buyers [68]. The administrative ranking of a city, its positioning in the plan for developing functional zones and the poverty-stricken county level determine the driving forces of urban development and the potential scale of real estate market, especially in the context of China’s implementation of “Fight against Poverty”. The “Ensuring Housing” initiative has enabled poverty-stricken counties to access additional development resources and investment support for real estate development from the central and provincial governments. Real estate market management, with the help of deposit and loan policy adjustment, is the key point in policy design for real estate market development.
Most of the data are from the Statistical Yearbook published by the Gansu Provincial Bureau of statistics, and a small part of the data are from the work reports and statistical data published by the official websites of the city government. The indicators of independent variables with different data sources are described as follows: Baidu index of real estate public opinion () was retrieved from Google search. On 22 June 2021, the author conducted a Baidu search with the keywords “real estate + city names (83)” and took the number of search results as the raw value for discretization as the independent variable. Administrative level () value is determined according to the administrative ranking of the city and, in this paper, it is set to one for general counties, two for autonomous counties, three for county-level cities and four for municipal districts. To directly obtain the discrete data. , the value is determined according to the main function positioning of each city in the Main Function Zone Planning of Gansu Province and, in this paper, it is set to one for the key ecological function areas with restricted development, two for the main agricultural product producing areas with restricted development and three for the key urban areas for development. The value is determined according to the poverty-stricken county level determined by the central and Gansu provincial governments and, in this paper, it is set to one for non-poor counties, two for provincial poor counties and three for national poor counties in this paper.
3.3. Research Methods
3.3.1. Spatiotemporal Dynamic Analysis Method: Boston Consulting Group Matrix (BCG)
The Boston Consulting Group matrix, a classic approach to business management, is applied to analyze the spatiotemporal evolution patterns of urban real estate development in this paper. The real estate economic growth speed (GS) and relative share (RS) are calculated based on the Boston Consulting Group matrix. The cities in the study area are divided into four types by their average as the threshold: star, cow, question and dog. Star cities are the leaders of regional development, indicating that the growth speed and relative share of real estate economy are at a high level. Cow cities are the backbone of regional development and, despite a low growth speed of the real estate economy, they have a high position in the study area with a high relative share. Question cities constitute potential growth poles in regional development and they may grow into emerging regional leaders in the future under reasonable policy guidance due to their high growth speed, despite their current relative share still remaining at a very low level. Dog cities are marginalized groups arising from regional development and they should implement adaptive policies in the future to promote the transformation and development of urban real estate due to their low growth speed and relative share, otherwise they may turn into a new threat to the sustainable development of the study area. With t representing the time, which is 3 years in this paper, and representing the base period value, final value and maximum value of the real estate economy development indexes in city , GS and RS are calculated as follows [69].
3.3.2. Spatial Effect Analysis Method: ESDA and Gini
Exploratory spatial data analysis (ESDA), cold and hot spots and the Gini index are leveraged in this paper to analyze the spatial correlation, agglomeration and heterogeneity of real estate economy development. The spatial autocorrelation index is an important indicator to measure the degree of potential interconnection and interdependence of research objects in a region. Spatial autocorrelation includes both global and local types. The former describes the spatial characteristics of attribute values of spatial elements in the whole region and reflects the similarity of their adjacent attribute values, which is of great significance for analyzing and describing the distribution characteristics of spatial attributes in the whole region; the latter is used to calculate and analyze the degree of association between the spatial objects in the region and their adjacent objects, investigate the local characteristics of the spatial distribution of the research objects and present the spatial differences and instability of the local region. In this paper, the Gini index is used to measure and evaluate the spatial heterogeneity of real estate market development in county-level cities in Gansu. According to studies by the United Nations Development Programme and other organizations, a Gini index greater than 0.4 indicates a large gap, and a value of 0.6 or greater indicates a huge gap [70].
Moran’s I is used in this paper to measure the global autocorrelation, and the of the cold and hot spots tool is used to analyze the local autocorrelation. The Moran’s I value is in the range of [−1, 1]. At a given level of significance (generally 5%), it indicates a positive spatial correlation if >0, or indicates a more significant spatial correlation when it has a larger value; on the contrary, it indicates a negative spatial correlation if <0, or indicates a greater spatial difference when it has a smaller value. It indicates a random spatial distribution if =0. A larger value of represents a higher agglomeration. represents a high-value cluster area when positive, which is known as a hot spot; on the contrary, it represents a low-value cluster and is called a cold spot when negative. Based on the research method of Zhao [70], the study area is classified into hot spot, sub-hot spot, sub-cold spot and cold spot by the natural breakpoint method to classify the statistics of . The calculated is based on the equation as follows:
where N represents the number of study objects, and are observed values of study objects and , is the average of observations, is a spatial weight matrix in the global spatial autocorrelation and a standardized value for spatial weights in the local spatial autocorrelation, is the sum of spatial weight matrices and and are the normalized values of the observations of study objects and . The spatial autocorrelation analysis is performed based on Arcgis 10.2 (Developed by Environmental Systems Research Institute in the United States) and GeoDa 1.18 in this paper, where the spatial weight matrix is a distance-based one and the parameters are all system defaults. The maximum number of neighbors is 66, the minimum is 1 and the average is 32, with a median value of 30. The distance is measured by the Euclidean Distance and the specified bandwidth is 442,404 by the distance band method and the number of neighbors is four by the K-Nearest Neighbor method.
3.3.3. Geodetector
Geodetector finds a wide utilization in the study of natural and economic and social influencing factors [71]. The method quantifies the importance of independent variables relative to dependent variables by analyzing the overall variability between different geospatial regions; it also shows significant advantages in dealing with mixed data [72]. Since the scientific problem in this paper is essentially to detect the spatial pattern of real estate market development in small cities and the driving factors behind it, and the type of driving factors involves mixed data, the method is quite applicable to this study. The Geodetector carries four functional modules for factor detection, interaction detection, risk detection and ecological detection, with algorithms and related software available at http://www.geodetector.cn, accessed on 21 March 2021.
In this paper, two functional modules for factor detection and interaction detection are employed to study the forces of influencing factors of the spatial differentiation of real estate market development and their interaction in county-level cities in Gansu. The factor detection module is used to detect whether the difference in the geographical distribution of independent variables is the cause of the spatial differentiation of dependent variables, and the interaction detection module is mainly to detect whether the respective variables have independent effects in explaining the dependent variables or whether they interact to produce enhanced or weakened explanatory power.
In Geodetector, the index is used to measure the influence of the driving factor () on the real estate economic development level (), where q () represents the direct influence and q (∩) represents the interactive influence. The maximum value of index is one, and the minimum value is zero. The value of the q index will be larger if the independent variable has a stronger influence on the dependent variable. Geodetector calculates the index by analyzing the similarity between the geographical distribution patterns of and . The basic principle it follows is that the software will create a higher index when the geographical distribution pattern between the independent variable and the dependent variable is more similar [73]. The index is calculated as follows [74]:
where h is the classification number of the influence factor (). Because the spatial clustering algorithm is generally adopted when comparing and analyzing the similarity of geographical distribution patterns, this data discretization process can improve the stability and smoothness of the model. For the layer and the study area, and N, respectively, represent the number of small cities, and represent the variance of the real estate economic development level () and SSW and SST represent the sum of squares. According to the relationship between the interaction influence and the direct influence (Max (q ()), q ()), min (Min (q (), q ()) and sum (q () + q ()), the interaction relationship is divided into five types (Table 2) [75].
Table 2.
Interaction between explanatory variables ( and ).
It should be highlighted that social phenomena are often not determined by the force of a single factor but the result of the interaction of a variety of factors. The different influencing factors are interrelated, intersecting and influential but not independent of each other. The development and management of real estate economy is a typical social phenomenon, which is influenced by many factors with different factors in a complex relationship. If the results of Geodetector-based analysis show interaction effects as weaken nonlinear, single nonlinear weaken, bifactor enhancement and nonlinear enhancement, it indicates that the effects of the independent variables on the dependent variables are non-independent of each other. In this paper, it suggests that the joint action of the two factors on real estate economy development may lead to a weakening of the driving force or to an increase in the force and that their superposition property and effect may vary when different factors interact.
4. Results
4.1. Spatiotemporal Dynamics
4.1.1. Distribution Pattern Analysis
The nuclear density analysis shows a significant spatial inequality in the real estate market development of county-level cities in Gansu, with the spatial agglomeration in the southeast region higher than in the northwest. In terms of the added value of real estate, county-level cities in Gansu are distributed in a pattern of “polar nuclei” and there are three high-density concentration centers of Lanzhou, Wuwei and Jiuquan. In terms of the proportion of the added value of real estate to GDP, the southeast and northwest of Gansu are in a serious imbalance, with high-density cities concentrated in a contiguous distribution in the southeast region and distributed like a string of pearls in the northwest (Figure 5 and Figure 6).
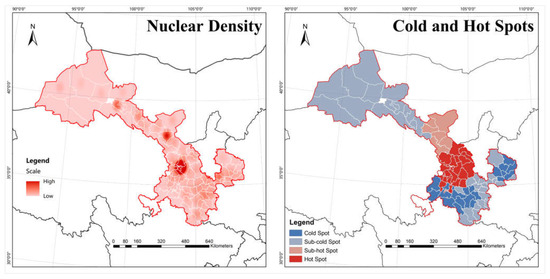
Figure 5.
Spatial analysis on industrial scale of real estate in Gansu.
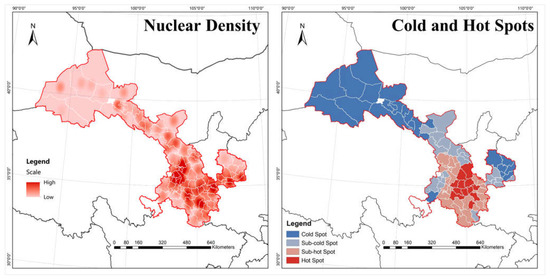
Figure 6.
Spatial analysis on economic contribution of real estate in Gansu.
In addition, hot and cold cities are characterized by significant clustering with large differences in the spatial patterns of industrial scale and economic contribution. For the former, hot and sub-hot cities are concentrated in the central provincial capital metropolitan area, while cold-spot cities are concentrated in the southeast and southwest of Gansu, and sub-cold cities are distributed in their periphery and northwestern Gansu. For the latter, hot and sub-hot cities are concentrated in southern Gansu, while cold and sub-cold cities are concentrated on the north bank of the Yellow River and in resource-intensive areas of Gansu.
The Gini index is 0.57 for the industry scale, indicating a strong spatial heterogeneity of real estate market development in county-level cities in Gansu. The Gini index is 0.27 for the economic contribution, indicating that there is a weak spatial heterogeneity of real estate market development in county-level cities in Gansu. The Moran’s I value for industry scale and economic contribution are 0.182 (p < 0.01, Z = 4.96) and 0.282 (p < 0.03, Z = 4.17), respectively, which shows a positive spatial correlation and dependence of real estate market development in Gansu.
4.1.2. Evolution Mode
In terms of industry scale, the Boston Consulting Group Matrix analysis shows that the number of star cities, cow cities, question cities and dog cities are distributed in a “pyramid”-shaped structure. Qilihe, Xigu, Qinzhou, Maiji, Gangu County, Liangzhou, Kongdong and Xifeng are star cities, mostly municipal districts of prefecture-level cities. Chengguan, Gaolan, Yuzhong, Ganzhou, Suzhou and Wudu are cow cities, scattered along the banks of the Yellow River. Question cities account for 33.73%, including Jinchuan, Yongchang, Jingyuan, Huining, Qin’an, Zhangjiachuan, Minqin, Gulang, Linze, Shandan, Jingchuan, Chongxin, Huachi, Heshui, Zhengning, Longxi and Weiyuan. Dog cities account for 49.40%, including Honggu, Yongdeng, Baiyin, Pingchuan, Jingtai, Qingshui, Wushan, Tianzhu, Sunan, Minle, Gaotai, Lingtai, Zhuanglang, Jingning, Huating, Jinta, Guazhou and Subei, mostly clustered in the northern, western and Lanzhou-Baiyin integrated development areas. The value of Moran’s I is 0.085, (p < 0.10, Z = 1.33), indicating a weak positive spatial correlation. The cold and hot spot areas are in gradient distribution from southwest to northeast, with hot spot cities clustered in the west side of the study area, secondary hot spots and secondary cold spots expanding outward in turn and cold spot cities clustered in the north end and southwest edge of Gansu (Figure 7).
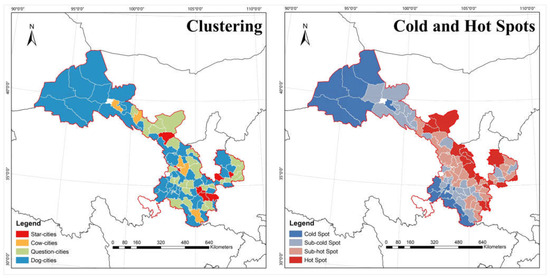
Figure 7.
Spatial analysis on industrial scale of real estate in Gansu.
In terms of economic contribution, the Boston Consulting Group Matrix analysis shows a largely equal number of star cities, cow-cities, question cities and dog cities. Star cities account for 21.69%, including Chengguan, Qilihe, Huining, Qinzhou, Qingshui, Zhangjiachuan, Liangzhou, Tianzhu, Kongdong, Jingchuan, Zhengning, Weiyuan, Dangchang, Xihe, Kangle and Guanghe, scattered in southern Gansu. Cow cities account for 22.89%, clustered in the Dingxi-Tianshui region, including Gaolan, Yuzhong, Qin’an, Gangu, Wushan, Gulang, Minle, Lingtai, Zhuanglang, Jingning, Suzhou, Tongwei, Lintao, Hezheng, Dongxiang and Hezuo. Question cities and dog cities account for the same percentage (27.71%). The former includes Xigu, Honggu, Yongdeng, Jinchuan, Yongchang, Baiyin, Pingchuan, Jingyuan, Maiji, Minqin, Linze, Shandan, Jinta, Aksai, Dunhuang, Xifeng, Huachi, Heshui and Longxi, relatively concentrated in the Hexi corridor and Qingyang region. The latter includes Jingtai, Ganzhou, Sunan, Gaotai, Chongxin, Huating, Guazhou, Subei, Yumen, Zhenyuan, Anding, Wudu, Liangdang, Linxia, Yongjing, Lintan, Zhuoni, Xiahe, Zhouqu and Diebu, clustered in the Jiuquan-Jiayuguan and Gannan-Longnan regions. The value of Moran’s I is 0.177, (p < 0.01, Z = 2.68), indicating a high positive spatial correlation. The cold and hot spot areas have formed a “core-periphery” spatial structure, with the hot and secondary hot spot cities clustered in the south of Gansu, the cold spot cities clustered in the north of Gansu and the secondary cold spot cities clustered in the north of the provincial capital metropolitan area, extending to Gannan, Longnan and Qingyang (Figure 8).
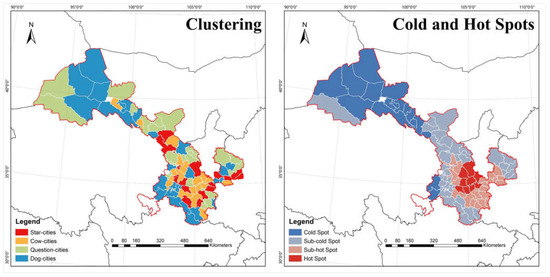
Figure 8.
Spatial analysis on economic contribution of real estate in Gansu.
4.2. Drive Mechanism Analysis
4.2.1. Direct Influence
For industry scale, per capita GDP (), mileage of highway () and number of primary schools () failed to pass the significance test. Per capita disposable income of residents (), per capita consumption expenditure of residents (), floating population () and only passed the loose significance test of 10%, while the rest factors passed the loose significance test of 5% and a more stringent level. At the significance level of 0.05, the driving factors are ranked by intensity as follows: added value of tertiary industry () > total retail sales of consumer goods () > revenue () > number of hospital beds () > amount of deposit () > amount of loan () > urban population () > doctors and related technicians () > employment in the secondary industry () > output value of financial industry () > GDP () > permanent resident population () > employment in the tertiary industry () > administrative level () > Baidu index of real estate public opinion () > added value of secondary industry () > number of industrial enterprises above designated size () > main function planning () > household registration population () > urbanization rate () > output value of industry () > number of secondary schools () > expenditure (); the driving forces are ranked by intensity as economic > institutional > industrial > social > population (Table 3). The mean value of both factors and driving forces is 0.23, with 13 factors and two driving forces above the mean value.
Table 3.
Analysis of factor detector.
For economic contribution, GDP (), added value of tertiary industry (), number of industrial enterprises above designated size (), Baidu index of real estate public opinion (), doctors and related technicians (), administrative level (), main function planning () and amount of deposit () failed to pass the significance test; total retail sales of consumer goods (), employment in the secondary industry () and amount of loan () only passed the loose significance test of 10%, while the rest factors passed the significance test of 5% and a more stringent level. At the significance level of 0.05, the driving factors are ranked in the order of intensity as per capita GDP () > floating population ( > household registration population () > urban population () > revenue () > number of primary schools () > per capita disposable income of residents () > permanent resident population () > number of secondary schools () > expenditure () > employment in the tertiary industry () > output value of industry () > added value of secondary industry () > mileage of highway () > urbanization rate () > per capita consumption expenditure of residents () > output value of financial industry () > number of hospital beds () > policies for poor counties (); the driving forces are ranked in the order of intensity as economic > population > social > industrial > institutional. The mean value of the factors is 0.26, with 10 above the mean value; the mean value of the driving forces is 0.23, with 2 above the mean value. Mean values of the driving forces of industrial scale and economic contribution are ranked as economic > population > social > industrial > institutional, indicating that the stage and level of macroeconomic development, population size, social and facility conditions, industrial strength and structure and institutional and policy environment have a great influence on the distribution patterns of real estate market development.
4.2.2. Interactive Influence
The interaction force value is in the range of 0–1, and a larger value indicates a stronger force. For industry scale, there are 253 factor pairs with a maximum value of 0.66 (permanent resident population ∩ doctors and related technicians, ∩) and a minimum value of 0.09 (expenditure ∩ number of secondary schools, ∩) for factor pair interactions at the significance level of 0.05, with a difference of about seven times between the two. The Gini index is 0.56, which belongs to high heterogeneity. The mean value of the factor pair interaction effects is 0.39, and about 51.38% of the factor pairs are above the mean value. The top five factor pairs include permanent resident population ∩ doctors and related technicians (∩), employment in the secondary industry ∩ doctors and related technicians (∩), GDP ∩ employment in the tertiary industry (∩), employment in the secondary industry ∩ number of hospital beds (∩) and revenue ∩ permanent resident population (∩), all with interaction strengths greater than 0.55. For economic contribution, there are 231 factor pairs with a maximum value of 0.91 (per capita GDP ∩ household registration population, ∩) and a minimum value of 0.20 (total retail sales of consumer goods ∩ number of hospital beds, ∩) for factor pair interactions at the significance level of 0.05, with a difference of about 4.5 times between the two. The Gini index is 0.57, which belongs to high heterogeneity. The mean value of the factor pair interaction effects is 0.63, and about 56.71% of the factor pairs are above the mean value. The top five factor pairs include ∩ household registration population (∩), per capita GDP ∩ employment in the tertiary industry (∩), per capita GDP ∩ urban population (∩), household registration population ∩ floating population (∩) and per capita GDP ∩ mileage of highway (∩), all with interaction strengths greater than 0.85.
By nature breaks, factor pair interaction effects are classified into five types: higher, high, medium, low and lower. For industry scale, the distribution of the five types of factor pairs shows the characteristics of a “rugby ball”. There are 21 factor pairs with a higher effect, accounting for about 8.30%; 60 with a high effect, accounting for about 23.72%; 76 with a medium effect, accounting for about 30.04%; 72 with a low effect, accounting for about 28.46%; 24 with a lower effect, accounting for about 9.49%. For economic contribution, the distribution of the five types of factor pairs shows the characteristics of an “inverted pyramid”. There are 72 factor pairs with a higher effect, accounting for about 31.17%; 62 with a high effect, accounting for about 26.84%; 45 with a medium effect, accounting for about 19.48%; 29 with a low effect, accounting for about 12.55%; 23 with a lower effect, accounting for about 9.96% (Figure 9).
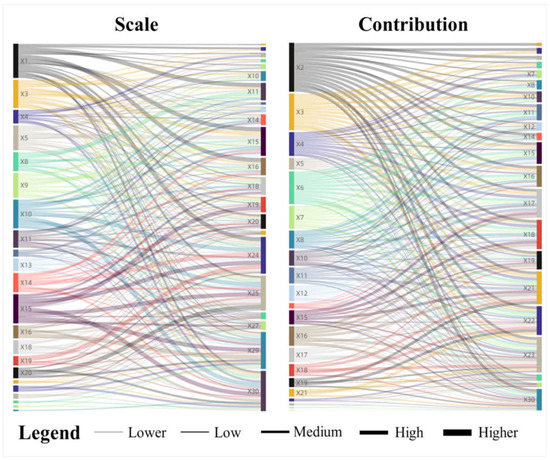
Figure 9.
Analysis of interaction detector.
The spatial differentiation drivers of real estate development are all bifactor or nonlinear enhanced with each other, with no independent or fading connection. For the industry scale, the factor pairs are dominated by bifactor enhancement and supplemented by nonlinear enhancement. There are 41 pairs with nonlinear enhancement, accounting for about 16%. Factor pairs with nonlinear enhancement include GDP ∩ expenditure (∩), GDP ∩ employment in the tertiary industry (∩), GDP ∩ household registration population (∩), expenditure ∩ total retail sales of consumer goods (∩), expenditure ∩ per capita disposable income of residents (∩), expenditure ∩ employment in the secondary industry (∩), expenditure ∩ employment in the tertiary industry (∩), expenditure ∩ output value of industry (∩), expenditure ∩ number of industrial enterprises above designated size (∩), expenditure ∩ output value of financial industry (∩), expenditure ∩ urban population (∩), expenditure ∩ urbanization rate (∩), expenditure ∩ Baidu index of real estate public opinion (∩), expenditure ∩ administrative level (∩), expenditure ∩ main function planning (∩), expenditure ∩ amount of deposit (∩), expenditure ∩ amount of loan (∩), added value of secondary industry ∩ employment in the tertiary industry (∩), added value of secondary industry ∩ household registration population (∩), added value of secondary industry ∩ number of secondary schools (∩), employment in the secondary industry ∩ doctors and related technicians (∩), employment in the tertiary industry ∩ output value of industry (∩), output value of industry ∩ permanent resident population (∩), output value of industry ∩ household registration population (∩), output value of industry ∩ Baidu index of real estate public opinion (∩), output value of industry ∩ number of secondary schools (∩), number of industrial enterprises above designated size ∩ household registration population (∩), number of industrial enterprises above designated size ∩ (∩), output value of financial industry ∩ household registration population (∩), permanent resident population ∩ urbanization rate (∩), permanent resident population ∩ doctors and related technicians (∩), permanent resident population ∩ main function planning (∩), household registration population ∩ urbanization rate (∩), household registration population ∩ Baidu index of real estate public opinion (∩), household registration population ∩ main function planning (∩), household registration population ∩ amount of deposit (∩), urbanization rate ∩ number of secondary schools (∩), urbanization rate ∩ number of hospital beds (∩), urbanization rate ∩ doctors and related technicians (∩), Baidu index of real estate public opinion ∩ number of secondary schools (∩) and Baidu index of real estate public opinion ∩ main function planning (∩). The non-linear enhancement interaction effect of expenditure (), output value of industry (), household registration population (), urbanization rate (), Baidu index of real estate public opinion () and number of secondary schools () is more significant.
For the economic contribution, the factor pairs are dominated by non-linear enhancement with bifactor enhancement as a supplementary factor. There are 24 pairs with bifactor enhancement, accounting for about 10%. Factor pairs with bifactor enhancement include: per capita GDP ∩ per capita disposable income of residents (∩), per capita GDP ∩ added value of secondary industry (∩), per capita GDP ∩ output value of industry (∩), per capita GDP ∩ permanent resident population (∩), per capita GDP ∩ floating population (∩), per capita GDP ∩ policies for poor counties (∩), expenditure ∩ number of secondary schools (∩), expenditure ∩ policies for poor counties (∩), total retail sales of consumer goods ∩ output value of financial industry (∩), total retail sales of consumer goods ∩ number of hospital beds (∩), per capita disposable income of residents ∩ policies for poor counties (∩), per capita consumption expenditure of residents ∩ policies for poor counties (∩), added value of secondary industry ∩ output value of industry (∩), added value of secondary industry ∩ policies for poor counties (∩), employment in the secondary industry ∩ number of hospital beds (∩), employment in the tertiary industry ∩ number of hospital beds (∩), output value of industry ∩ policies for poor counties (∩), output value of industry ∩ number of hospital beds (∩), permanent resident population ∩ household registration population ∩), floating population ∩ policies for poor counties (∩), urban population ∩ number of hospital beds (∩), urbanization rate ∩ policies for poor counties (∩), number of secondary schools ∩ number of hospital beds (∩) and number of primary schools ∩ policies for poor counties (∩). Per capita GDP (), number of hospital beds () and policies for poor counties () are dominated by the bifactor enhanced interaction effect, while the nonlinear enhanced interaction effect is more prominent in the rest factors (Figure 10).
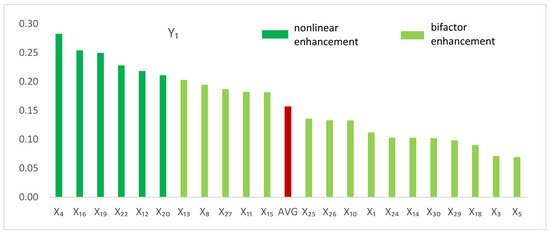
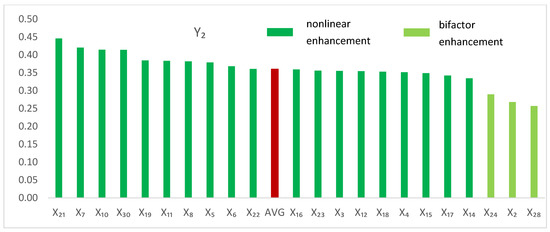
Figure 10.
Average enhancement degree of factor interaction effect. Note: Red represents the average value.
4.2.3. Mechanism Analysis
Based on whether they can pass the significance test, 30 driving factors are classified into three types, that is, scale-oriented driving factors, contribution-oriented driving factors and comprehensive-oriented driving factors. Scale-oriented driving factors include GDP (), total retail sales of consumer goods (), added value of tertiary industry (), employment in the secondary industry (), number of industrial enterprises above designated size (), Baidu index of real estate public opinion (), doctors and related technicians (), administrative level (), main function planning (), amount of deposit () and amount of deposit (), with a mean value of 0.26. Contribution-oriented driving factors include per capita GDP (), expenditure (), per capita disposable income of residents (), per capita consumption expenditure of residents (), output value of industry (), floating population (), mileage of highway (), number of secondary schools (), number of primary schools () and policies for poor counties (), with a mean value of 0.27. Comprehensive-oriented driving factors include revenue (), added value of secondary industry (), employment in the tertiary industry (), output value of financial industry (), permanent resident population (, household registration population (), urban population (), urbanization rate () and number of hospital beds (), with a mean value of 0.25. It should be noted that expenditure (), output value of industry () and number of secondary schools () pass the significance test for both industrial scale and economic contribution, and they are classified as contribution-oriented driving factors as their q values corresponding to industrial scale are too small.
The impact factors are further divided into three subcategories, that is, “key factors”, “important factors” and “auxiliary factors”, based on the ranking and average of the q values of all influencing factors in the broad categories (Figure 11). “Key factors” are generally TOP3 factors, mainly exerting a direct action with a balancing of the interactions between factors. The q values of the “important factors” are around the mean level, and their direct and factor interaction forces act simultaneously. “Auxiliary factors” are generally at the bottom three of the ranking, and they are dominated by the interaction with a very weak direct action. In addition, importance should be attached to the special role of super-interaction factors with non-linear enhancement effects, especially expenditure (), output value of industry (), household registration population (), urbanization rate (), Baidu index of real estate public opinion ()and number of secondary schools (), which have a non-linear enhancement effect on both industrial scale and economic contribution.
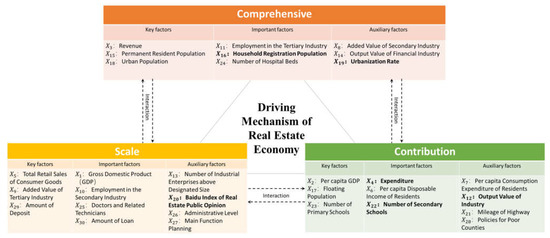
Figure 11.
Driving mechanism of real estate economy.
The presence of the interaction effect suggests that the joint driving force of the different factors may be much greater than when they are independent, and it has a significant enhancement effect on the driving force of real estate economy development in small cities. It is to be noted that the influencing factors proposed in this paper all have an influence on the development of real estate economy in urban areas, but the nature and intensity of their forces vary considerably in different dimensions. For many influencing factors, they have little direct acting forces, but their interactive influence may be very large and may significantly enhance the driving force of different factors on real estate development. Therefore, it is necessary to exercise reasonable control over them in the process of real estate economic management and to construct a variety of combinations of influencing factors according to the scale-oriented and contribution-oriented development goals, so as to amplify the positive effects while weakening and avoiding the negative effects. The driving mechanism of China’s real estate economy development, in general, is very complex due to the large number of influencing factors, their strong interactive effects and the large variation in the intensity and nature of the forces at different times. It is important to pay attention to these nuances in the process of managing real estate economy development and to propose adaptive and targeted recommendations or solutions.
5. Discussion: Management Policy Design Application
The spatial heterogeneity, clustering and autocorrelation of real estate development is a dominating presentation of the dynamic attributes of the real estate market, which is a concentrated reflection of differentiated distribution, interconnection and changes trend of parameters such as the real estate market scale, demand, supply and price in the spatial territory in different cities [76,77]. Influenced by the development stage, resource endowment and location conditions, the county-level cities in Gansu show significant spatial heterogeneity in real estate market development. Some findings in this paper have testified partial content of the existing papers. This study concludes that finance, especially savings and loans, has a significant influence on real estate and macroeconomic development, which is generally in agreement with the findings of Klett [78], Gabauer [79], Wilhelmsson [80], Wang [81], Golob [82], Carmichael [83], Cerutti [84] and Stevenson [85]. Klett, based on a study of Santiago, Chile, argues that real estate production and finance and land reserve are in a complex and synergistic promotion connection, with finance facilitating real estate development and real estate being progressively financialized through the land market. Bates argues that there is a strong causal relationship between real estate and macroeconomics in the US states [86]. Wilhelmsson believes that bank loans have a significant influence on real estate and macroeconomics and that the influence increases over time. This paper argues that population mobility and demographic structure as well as population urbanization rate play a key role in the economic development and spatial heterogeneity of real estate, which is confirmed by existing papers. Fernandez holds that there is a dynamic interaction between the real estate economy and population in Spain [87], Wang argues that population migration and demographics have a positive effect on the real estate economy [88] and Liu argues that the patterns of interaction between urbanization and investment in real estate vary across regions [89].
China has been increasing its regulatory measures on the real estate economy in recent years, with a series of policies issued by the central and local governments to regulate the real estate economy. Most provinces in China have already proposed the plan for “zoning control” or even “one policy for one city”, so that different policies are adopted in different cities and even differentiated measures are taken in different areas in the same city. However, the actual results of these measures are not satisfactory in general. We believe one of the major reasons is that the regulatory measures and policies available have failed to effectively touch the spatial contradictions faced by the real estate market development. Policymakers do not have a full understanding of the complexity of spatial differences and linkages in the real estate economy currently, resulting in a weak spatial directionality of real estate regulation measures and insufficient precision and synergy in regulation. How to classify different cities in a region reasonably? What are the key points in differential policy design? To answer these two questions is the key to economic development and spatial governance of real estate and is precisely the focus of this paper. City classification should be oriented to real estate market development goals and problems, and policy design should be based on the operation rules of distribution patterns of real estate market development and its driving mechanism. According to the mean value of industrial scale and economic contribution, 83 county-level cities in Gansu can be divided into four policy zonings by the real estate market development and the differentiated development policies can be designed depending on the influence factors and their interaction effects (Figure 12).
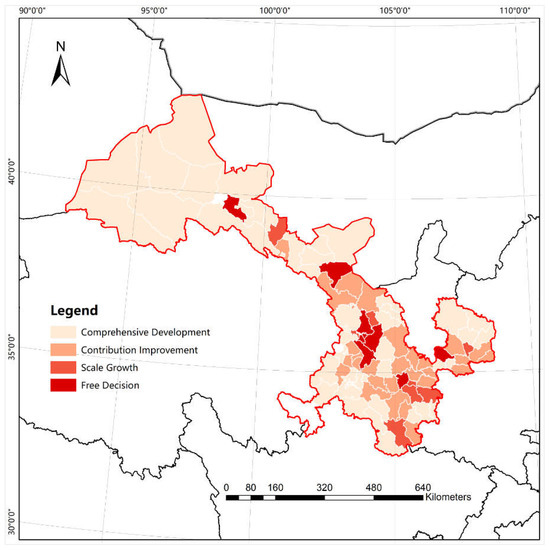
Figure 12.
Policy classification chart of the real estate market development.
5.1. Comprehensive Development Policy Area
The first is the comprehensive development policy area, including Honggu, Yongdeng, Jinchuan, Yongchang, Pingchuan, Jingyuan, Minqin, Sunan, Linze, Gaotai, Shandan, Chongxin, Huating, Jinta, Guazhou, Subei, Aksai, Yumen, Dunhuang, Qingcheng, Huachi, Heshui, Anding, Longxi, Dangchang, Liangdang, Linxia, Yongjing, Lintan, etc. The real estate industrial scale and economic contribution of these 39 cities are lower than the average, with the characteristics of “double low”. The policy design for real estate market development in these cities should focus on comprehensive-oriented driving factors, especially revenue (), permanent resident population (), urban population (), household registration population (), urbanization rate () and other key factors, as well as interaction factors with super non-linear enhancement effects, to achieve comprehensive development and systematic growth of the real estate economy.
In the future, the two-way regulation of supply (real estate enterprises) and demand (real estate consumers) should be coordinated based on the matching of resources of industry, city, people, land and housing to push the progress of the real estate economy development. First, efforts should be made to enhance forward-looking planning, overall planning and strategic layout for the real estate industry and to optimize the scale and spatial layout of real estate development in light of population demand and the stage of urbanization. Second, it is necessary to keep extending the industry chain while strengthening the weak parts so as to promote the integrated development of the upstream, midstream and downstream of the real estate industry chain, with green building materials, prefabricated building and construction operations as the upstream of the industry chain, real estate development enterprises and property enterprises as midstream and marketing, advertising and design, brokerage, legal, accounting and other related services as the downstream. Third, according to the renewal and transformation process of the central area of the county, the activation effect of government funds should be leveraged to advance the transformation of urban villages, old factory buildings and old housing estates and to improve the quality of the living environment by pushing the construction process of a 15-min convenience service circle. In accordance with the principles of “one policy for one community” and “one policy for one building”, menu-style project renovation should be carried out with focus on improving the infrastructure and public service facilities of the old community, covering education (especially primary and middle schools), fire protection, parking and garbage handling. Fourth, great efforts should be made to develop functional real estate products, including facilities for logistics, business, senior care, tourism, culture, education and sports, to meet market demand at different levels.
5.2. Contribution Improvement Policy Area
The second is the contribution improvement policy area, covering 28 county-level cities with above-average real estate industrial scale but below-average economic contribution, characterized by “high and low” levels. Huining, Jingtai, Qingshui, Tai’an, Wushan, Zhangjiachuan, Gulang, Tianzhu, Minle, Jingchuan, Lingtai, Zhuanglang, Jingning, Zhengning, Zhenyuan, Tongwei, Weiyuan, Xihe and Dongxiang are in such a policy area. The policy design for real estate market development in these cities should focus on the contribution-oriented driving factors, especially per capita GDP (), floating population (), number of primary schools (), expenditure (), number of secondary schools (), output value of industry () and other key factors, as well as interaction factors with super non-linear enhancement effects, to rapidly increase the contribution of real estate economy to local economic development.
The focus in the future should be placed on enhancing supply-side management and increasing support for the development of real estate enterprises. First, more guidelines should be given to the development of large and local real estate enterprises, and local large and medium-sized real estate development enterprises should be encouraged to extend to property, brokerage and senior care industries to provide high-level, proactive and value-added services to achieve the integrated development of the whole industry chain characterized by product diversity and diversification. It is necessary to accelerate the development of local real estate brokerage, valuation, property and other supporting services. Chain real estate brokerage companies should be introduced, and local real estate brokerage enterprises should be cultivated to create a coordinated development of small, medium and large-sized real estate brokerage enterprises. Second, it is important to strengthen the training of real estate practitioners and to encourage real estate enterprises to carry out close cooperation with colleges and universities and professional training institutions, focusing on cultivating all types of skilled and applied professionals that are in short supply in the development of the local real estate industry. A sound long-term mechanism for vocational training of real estate talents should be established to conduct multi-level, multi-professional and multi-form on-the-job skills training. Large real estate enterprises and property service enterprises should be encouraged to build a team of technical qualified personnel that master new technologies, new techniques and new standards, to effectively meet the future demand of urban residents for services in housing refinishing, smart homes and other emerging areas of residential life. Third, new technologies such as blockchain, Internet of Things, artificial intelligence, big data and 5G should be employed to promote the digital transformation of the real estate industry and to explore new forms and scenarios of the real estate economy. Fourth, it is necessary to increase financial support for real estate enterprises, guide banks and financial institutions to implement differentiated credit policies for real estate enterprises, raise the amount of loans for enterprise development and construction and personal mortgage loans and shorten the credit processing and lending time for real estate enterprises.
5.3. Scale Growth Policy Area
The third is the scale growth policy area, covering Xigu, Baiyin, Qinzhou, Maiji, Ganzhou, Xifeng and Wudu, seven county-level cities with below-average real estate industrial scale but above-average economic contribution, characterized by “high and low” levels. The policy design for real estate market development in these cities should focus on scale-oriented driving factors, especially total retail sales of consumer goods (), added value of tertiary industry (), amount of deposit (), Baidu index of real estate public opinion () and other key factors, as well as interaction factors with super non-linear enhancement effects, which help to significantly expand the local real estate market size and economic strength.
The focus in the future should be placed on enhancing demand-side management, especially on increasing support for real estate consumers. First, it is necessary to adapt to the process of urbanization and industrialization, bring in the local agricultural migrant population relying on county towns, key towns and industrial parks, and accelerate the development of diversified commercial housing according to the size and structural characteristics of the employed population to meet the housing needs of the floating population. By leveraging social consumption and the development of service industry, it is necessary to explore the development modes of “real estate + leisure”, “real estate + health”, “real estate + tourism” and “real estate + emerging industries”, relying on local ecology, culture, recreation, science and technology, hospital resources and scenic spots to provide diversified real estate products and to build a modern habitat industry system of “real estate +”, thus further expanding the scale of real estate. Third, loans, especially provident fund support, should be accessible to new home buyers among those moving from rural to urban areas, such as reducing the down payment ratio, expanding the coverage of housing fund, increasing the investment in personal housing mortgage loans and lowering the interest rate of housing loans. Fourth, it is necessary to explore the new modes of real estate marketing with synchronous interaction and organic integration of “online and offline” operations. Real estate enterprises should strengthen their cooperation with emerging technology companies and network marketing platforms and rely on virtual reality technology, cloud technology and other cutting-edge technology to make it possible for online view of real estate projects, online negotiation, online signing and online registration, with the help of online trade platforms, investment platforms and service trade cooperation platforms.
5.4. Free Decision Policy Area
The fourth is the free decision policy area, covering Chengguan, Qilihe, Gaolan, Yuzhong, Gangu, Liangzhou, Kongtong, Suzhou and Lintao, nine county-level cities with above-average real estate industrial scale and economic contribution, characterized by “double- high” level. The policy design for real estate market development in these cities is quite flexible. For the growth-oriented policy design, policy control and guidance points can be taken from the 30 factors as needed, in particular, the role of key factors and super interaction effect factors should be emphasized to promote the local real estate economy to grow bigger and stronger. For the contraction-oriented policy design, efforts should be made to avoid the 30 driving factors and achieve the consumption reduction for upgrading and transformation of local real estate market development based on other studies and the reality of local development.
The regulation and statistics of the real estate market should be enhanced in the future to maintain the stable and healthy development of the real estate market. It is important to accelerate the establishment of real estate enterprise credit databases, real estate enterprise credit files and accordingly carry out enterprise credit evaluations for reward and punishment. Credit evaluation should be performed based on credit files established by real estate development enterprises, including real estate enterprise qualifications, business performance, contract performance, tax payment, trustworthy awards, bank credit, violations of law, public complaints and disciplinary actions for breach of trust. The real estate development enterprises involved in market access, land transfer, development and construction, business operation, capital use and housing delivery should be managed differently according to the credit rating. Enterprises with high credit should be given policy preference and priority support, enterprises with poor credit should be required to make corrections within a fixed period of time under key supervision, and for any enterprises that refuse to make corrections, appropriate punishment measures should be taken, so as to constantly optimize the business environment of the real estate market. In addition, the existing commercial housing online registration system, inventory housing online registration system, housing mortgage, housing rental and other systems should be integrated to establish a comprehensive real estate transaction information platform and real estate risk warning and monitoring system based on the combination with intelligent technology to achieve unified real estate market supervision. In addition, it is necessary to strengthen real estate statistics, regulate the release of real estate information and create a good market environment.
6. Conclusions
This paper quantitatively examines the development dynamic characteristics of real estate in Gansu, empirically investigates its influencing factors and their interaction effects, reveals the driving mechanism of real estate development and further puts forward targeted optimization policies and measures. The study findings show that the distribution patterns of real estate development in Gansu is significant, and its spatial heterogeneity, agglomeration and autocorrelation comes into being from unsynchronized macroeconomic, social, industrial, demographic, institutional and policy development interweaved with the real estate control, with significant differences in the driving forces and complex interaction effects. Carrying out differentiated policy design and adapting measures tailored to specific local conditions for real estate market development and spatial governance, oriented by urban real estate development goals and problems faced, and based on the operation rules of real estate distribution patterns driving mechanism can significantly improve the precision and synergy of policies, with great practical significance and theoretical value.
From the academic perspective, this paper provides a new technical framework for scholars to study the mechanism of real estate market development, helping them to grasp and reveal the spatial pattern of real estate market development and its evolution. It also offers a valuable reference for the study of real estate market development in multi-scale or similar case areas such as prefecture-level cities, provinces and countries. From a practical perspective, this paper will help city government officials to create a constructive and referential real estate control mode. It will also provide a decision-making basis for real estate upgrading and transformation and optimization of regional layout and economic contribution, and will propose valuable suggestions for governments at all levels to establish high-quality real estate development planning and differentiated policy design.
However, there are certain shortcomings in our study, which may have some influence on the accuracy and applicability of the conclusions. Firstly, although the indicators of independent variables adopted in this study cover a wide range, those in the policy and institutional domains in this paper are still insufficient, with a lack of comparative analysis over the years because of the difficulty of original data acquisition. Secondly, influenced by the scale effect, the mechanism of the same phenomenon at macro, meso and micro spatial scales may be different and there are no multi-scale or cross-scale comparative studies at the local, provincial, regional or national levels in this paper. Thirdly, we sincerely call on more researchers to join this research and jointly create more and more valuable new elements and knowledge for the Word.
Author Contributions
Conceptualization, K.L. and H.C.; methodology, S.Z. and P.Z.; software, S.Z. and Y.Z.; validation, H.C. and K.L.; formal analysis, K.L. and S.Z.; investigation, H.C., P.Z. and K.L.; resources, P.Z. and S.Z.; data curation, S.Z. and K.L.; writing—original draft preparation, H.C., S.Z. and P.Z.; writing—review and editing, K.L. and Y.Z.; visualization, S.Z., Y.Z. and H.C.; supervision, K.L. and Y.Z.; project administration, H.C. and P.Z.; funding acquisition, K.L. and P.Z. All authors have read and agreed to the published version of the manuscript.
Funding
This paper and the related research are financially supported by the Natural Science Foundation of Gansu Province (Project Number: 20JR5RA415), and National Natural Science Foundation of China (Project Number: 51768029), National Natural Science Foundation of China (Project Number: 51768030).
Data Availability Statement
The data used in this paper mainly come from the Gansu Development Yearbook, Gansu Rural Yearbook, and China Statistical Yearbook. Most of the data can be obtained by visiting the following links: http://tjj.gansu.gov.cn/tjj/c109464/info_disp.shtml, accessed on 3 August 2021; https://data.cnki.net/yearbook/Single/N2021040103, http://www.stats.gov.cn/tjsj/ndsj/, accessed on 15 August 2021.
Acknowledgments
We are very grateful to the two reviewers for their constructive and enlightening comments. At the same time, all the authors thank the editors Tian, Zheng and Li for their help and support in reviewing and publishing.
Conflicts of Interest
The authors declare no conflict of interest.
References
- Marfatia, H.A.; André, C.; Gupta, R. Predicting Housing Market Sentiment: The Role of Financial, Macroeconomic and Real Estate Uncertainties. J. Behav. Financ. 2022, 23, 189–209. [Google Scholar] [CrossRef]
- Ross, E.J.; Shibut, L. Loss Given Default, Loan Seasoning and Financial Fragility: Evidence from Commercial Real Estate Loans at Failed Banks. J. Real Estate Financ. Econ. 2020, 63, 630–661. [Google Scholar] [CrossRef]
- Huang, Y.; Khan, J.; Girardin, E.; Shad, U. The Role of the Real Estate Sector in the Structural Dynamics of the Chinese Economy: An Input–Output Analysis. China World Econ. 2021, 29, 61–86. [Google Scholar] [CrossRef]
- Jiang, Y.; Zheng, L.; Wang, J. Research on external financial risk measurement of China real estate. Int. J. Financ. Econ. 2020, 26, 5472–5484. [Google Scholar] [CrossRef]
- Han, Y.; Zhang, H.; Zhao, Y. Structural evolution of real estate industry in China: 2002–2017. Struct. Chang. Econ. Dyn. 2021, 57, 45–56. [Google Scholar] [CrossRef]
- Cai, Z.; Liu, Q.; Cao, S. Real estate supports rapid development of China’s urbanization. Land Use Policy 2020, 95, 104582. [Google Scholar] [CrossRef]
- Montagnoli, A.; Nagayasu, J. UK house price convergence clubs and spillovers. J. Hous. Econ. 2015, 30, 50–58. [Google Scholar] [CrossRef]
- Gu, H.; Liu, Z.; Weng, Y. Time-varying correlations in global real estate markets: A multivariate GARCH with spatial effects approach. Phys. A Stat. Mech. Appl. 2017, 471, 460–472. [Google Scholar] [CrossRef]
- Moscone, F.; Tosetti, E.; Canepa, A. Real estate market and financial stability in US metropolitan areas: A dynamic model with spatial effects. Reg. Sci. Urban Econ. 2014, 49, 129–146. [Google Scholar] [CrossRef]
- Mosciaro, M. The real estate/financial complex in Brazil and Italy: Tools for the financial production of urban space. Scr. No-Va-Rev. Electron. Geogr. Cienc. Soc. 2021, 25, 59–81. [Google Scholar] [CrossRef]
- Evans, B.P.; Glavatskiy, K.; Harré, M.S.; Prokopenko, M. The impact of social influence in Australian real estate: Market forecasting with a spatial agent-based model. J. Econ. Interact. Coord. 2021, 1–53. [Google Scholar] [CrossRef]
- Dubé, J.; Legros, D. A spatio-temporal measure of spatial dependence: An example using real estate data. Pap. Reg. Sci. 2013, 92, 19–30. [Google Scholar] [CrossRef]
- Barreca, A.; Curto, R.; Rolando, D. Urban Vibrancy: An Emerging Factor that Spatially Influences the Real Estate Market. Sustainability 2020, 12, 346. [Google Scholar] [CrossRef]
- Pace, R.K.; Barry, R.; Sirmans, C.F. Spatial Statistics and Real Estate. J. Real Estate Financ. Econ. 1998, 17, 5–13. [Google Scholar] [CrossRef]
- Wang, P.; Lin, X.; Dai, D. Spatiotemporal Agglomeration of Real-Estate Industry in Guangzhou, China. Sustainability 2017, 9, 1445. [Google Scholar] [CrossRef]
- Lukas, M.; López-Morales, E. Real estate production, geographies of mobility and spatial contestation: A two-case study in Santiago de Chile. J. Transp. Geogr. 2018, 67, 92–101. [Google Scholar] [CrossRef]
- Shatkin, G. The real estate turns in policy and planning: Land monetization and the political economy of peri-urbanization in Asia. Cities 2016, 53, 141–149. [Google Scholar] [CrossRef]
- Susewind, R. Spatial Segregation, Real Estate Markets and the Political Economy of Corruption in Lucknow, India. J. S. Asian Dev. 2015, 10, 267–291. [Google Scholar] [CrossRef]
- Ramos, G.C.D. Real Estate Industry as an Urban Growth Machine: A Review of the Political Economy and Political Ecology of Urban Space Production in Mexico City. Sustainability 2019, 11, 1980. [Google Scholar] [CrossRef]
- Jun, M.-J. The effects of Seoul’s greenbelt on the spatial distribution of population and employment, and on the real estate market. Ann. Reg. Sci. 2012, 49, 619–642. [Google Scholar] [CrossRef]
- Ceccato, V.; Wilhelmsson, M. Do crime hot spots affect housing prices? Nord. J. Criminol. 2019, 21, 84–102. [Google Scholar] [CrossRef]
- Iqbal, A.; Wilhelmsson, M. Park proximity, crime and apartment prices. Int. J. Hous. Mark. Anal. 2018, 11, 669–686. [Google Scholar] [CrossRef]
- Aguirre, C.; Marmolejo, C. Polycentrism impact on the spatial distribution of values Real estate: An analysis for the metropolitan area of Barcelona. Rev. Constr. 2011, 10, 78–88. [Google Scholar] [CrossRef]
- Li, W.; Weng, L.; Zhao, K.; Zhao, S.; Zhang, P. Research on the Evaluation of Real Estate Inventory Management in China. Land 2021, 10, 1283. [Google Scholar] [CrossRef]
- Dong, Z.; Sing, T.F. How Do Land Auction Formats Influence the Market Structure and Aggregate Surplus of Real Estate Development? Real Estate Econ. 2016, 44, 691–725. [Google Scholar] [CrossRef]
- Golob, K.; Bastic, M.; Psunder, I. Influence of Inflation and Interest Rates on The Value of Real Estate. Actual Probl. Econ. 2012, 134, 372–381. [Google Scholar]
- Ahmed, I.; Socci, C.; Severini, F.; Pretaroli, R.; Al Mahdi, H.K. Unconventional monetary policy and real estate sector: A financial dynamic computable general equilibrium model for Italy. Econ. Syst. Res. 2020, 32, 221–238. [Google Scholar] [CrossRef]
- Edelstein, R.; Qian, W.; Tsang, D. How Do Institutional Factors Affect International Real Estate Returns? J. Real Estate Financ. Econ. 2011, 43, 130–151. [Google Scholar] [CrossRef]
- Wei, Y.; Lam, P.T.-I.; Chiang, Y.-H.; Leung, B.Y.-P.; Seabrooke, W. An Exploratory Analysis of Impediments to China’s Credit Control on the Real Estate Industry: An institutional perspective. J. Contemp. China 2014, 23, 44–67. [Google Scholar] [CrossRef]
- Bergeaud, A.; Ray, S. Adjustment Costs and Factor Demand: New Evidence from Firms’ Real Estate. Econ. J. 2021, 131, 70–100. [Google Scholar] [CrossRef]
- Abukar, W.; Rune, W.; Mats, W.; Zan, Y. The Impact of Competition, Subsidies and Taxes on Production and Construction Cost: The Case of the Swedish Housing Construction Market. Int. Sch. Res. Not. 2013, 7, 1–7. [Google Scholar]
- Shen, L.; Zhang, Z.; Zhang, X. Key factors affecting green procurement in real estate development: A China study. J. Clean. Prod. 2017, 153, 372–383. [Google Scholar] [CrossRef]
- Zalejska-Jonsson, A.; Wilkinson, S.J.; Wahlund, R. Willingness to Pay for Green Infrastructure in Residential Development—A Consumer Perspective. Atmosphere 2020, 11, 152. [Google Scholar] [CrossRef]
- McMillan, A.; Chakraborty, A. Who Buys Foreclosed Homes? How Neighborhood Characteristics Influence Real Estate-Owned Home Sales to Investors and Households. Hous. Policy Debate 2016, 26, 766–784. [Google Scholar] [CrossRef]
- Ullah, F.; Sepasgozar, S.M.E. Key Factors Influencing Purchase or Rent Decisions in Smart Real Estate Investments: A System Dynamics Approach Using Online Forum Thread Data. Sustainability 2020, 12, 4382. [Google Scholar] [CrossRef]
- Dabholkar, P.A.; Overby, J.W. An investigation of real estate agent service to home sellers: Relevant factors and attributions. Serv. Ind. J. 2006, 26, 557–579. [Google Scholar] [CrossRef]
- Oikarinen, E.; Falkenbach, H. Foreign investors’ influence on the real estate market capitalization rate—Evidence from a small open economy. Appl. Econ. 2017, 49, 3141–3155. [Google Scholar] [CrossRef]
- Zhang, H.; Li, L.; Chen, T.; Li, V. Where will China’s real estate market go under the economy’s new normal? Cities 2016, 55, 42–48. [Google Scholar] [CrossRef]
- Sun, L.; Zhang, S. External Dependent Economy and Structural Real Estate Bubbles in China. China World Econ. 2008, 16, 34–50. [Google Scholar] [CrossRef]
- Zhang, H.R.; Yang, Y. Does Tourism Contribute to Real Estate Boom? A Dsge Modeling in Small Open Economy. J. Hosp. Tour. Res. 2021, 45, 257–279. [Google Scholar] [CrossRef]
- Yan, Z.L. Empirical Researches on Macroeconomic Influence factors in Real Estate Based on Data Mining (DM). Agro Food Ind. Hi-Tech 2017, 28, 2729–2732. [Google Scholar]
- Ang, A.; Nabar, N.; Wald, S.J. Searching for a Common Factor in Public and Private Real Estate Returns. J. Portf. Manag. 2013, 39, 120. [Google Scholar] [CrossRef]
- Kirikkaleli, D.; Athari, S.A.; Ertugrul, H.M. The real estate industry in Turkey: A time series analysis. Serv. Ind. J. 2021, 41, 427–439. [Google Scholar] [CrossRef]
- Hamelink, F.; Hoesli, M. What factors determine international real estate security returns? Real Estate Econ. 2004, 32, 437–462. [Google Scholar] [CrossRef][Green Version]
- Ho, D.K.H.; Addae-Dapaah, K.; Glascock, J.L. International Direct Real Estate Risk Premiums in a Multi-Factor Estimation Model. J. Real Estate Financ. Econ. 2015, 51, 52–85. [Google Scholar] [CrossRef]
- Pavlov, A.; Steiner, E.; Wachter, S. Macroeconomic Risk Factors and the Role of Mispriced Credit in the Returns from International Real Estate Securities. Real Estate Econ. 2015, 43, 241–270. [Google Scholar] [CrossRef]
- Eichholtz, P.; Huisman, R.; Koedijk, K.; Schuin, L. Continental Factors in International Real Estate Returns. Real Estate Econ. 1998, 26, 493–509. [Google Scholar] [CrossRef]
- Carrasco-Gallego, J. Real Estate, Economic Stability and the New Macro-Financial Policies. Sustainability 2021, 13, 236. [Google Scholar] [CrossRef]
- Bouwmeester, J.; Hartmann, T. Unraveling the self-made city: The spatial impact of informal real estate markets in informal settlements. Cities 2021, 108, 102966. [Google Scholar] [CrossRef]
- Sarathy, P.S. TQM practice in real-estate industry using AHP. Qual. Quant. 2013, 47, 2049–2063. [Google Scholar] [CrossRef]
- Chang, K.-F.; Chou, P.-C. Measuring the influence of the greening design of the building environment on the urban real estate market in Taiwan. Build. Environ. 2010, 45, 2057–2067. [Google Scholar] [CrossRef]
- Wilhelmsson, M.; Long, R. Impacts of shopping malls on apartment prices: The case of Stockholm. Nord. J. Surv. Real Estate Res. 2020, 5, 29–48. [Google Scholar] [CrossRef]
- Martori, J.C.; Madariaga, R.; Oller, R. Real estate bubble and urban population density: Six Spanish metropolitan areas 2001–2011. Ann. Reg. Sci. 2016, 56, 369–392. [Google Scholar] [CrossRef]
- Wilhelmsson, M.; Zhao, J. Risk Assessment of Housing Market Segments: The Lender’s Perspective. J. Risk Financ. Manag. 2018, 11, 69. [Google Scholar] [CrossRef]
- Wilhelmsson, M. Evidence of Buyer Bargaining Power in the Stockholm Residential Real Estate Market. J. Real Estate Res. 2008, 30, 475–500. [Google Scholar] [CrossRef]
- Wilhelmsson, M.; Ceccato, V. Does burglary affect property prices in a nonmetropolitan municipality? J. Rural Stud. 2015, 39, 210–218. [Google Scholar] [CrossRef]
- Smith, B.C. The impact of tax increment finance districts on localized real estate: Evidence from Chicago’s multifamily markets. J. Hous. Econ. 2006, 15, 21–37. [Google Scholar] [CrossRef]
- Berggren, B.; Fili, A.; Wilhelmsson, M. Homeownership and entrepreneurship A regional and industrial analysis of house prices and startups. Int. J. Hous. Mark. Anal. 2019, 12, 456–473. [Google Scholar] [CrossRef]
- Mandell, S.; Wilhelmsson, M. Financial infrastructure and house prices. Appl. Econ. 2015, 47, 3175–3188. [Google Scholar] [CrossRef]
- Liu, X.-X.; Song, Y.-Y.; Liu, H.-H.; Yang, G.-L. Regional efficiency of the real estate industry in 35 large and medium-sized cities in China: A meta-frontier SBM approach. Post-Communist Econ. 2021, 34, 376–408. [Google Scholar] [CrossRef]
- Liu, X.-X.; Liu, H.-H.; Yang, G.-L.; Pan, J.-F. Productivity assessment of the real estate industry in china: A two-stage malmquist productivity index. Int. J. Strat. Prop. Manag. 2021, 25, 146–168. [Google Scholar] [CrossRef]
- Yang, G.-L.; Fukuyama, H.; Chen, K. Investigating the regional sustainable performance of the Chinese real estate industry: A slack-based DEA approach. Omega 2019, 84, 141–159. [Google Scholar] [CrossRef]
- Franses, P.H.; De Groot, B. Do commercial real estate prices have predictive content for GDP? Appl. Econ. 2013, 45, 4379–4384. [Google Scholar] [CrossRef]
- Jin, Y.; Leung, C.K.; Zeng, Z. Real Estate, the External Finance Premium and Business Investment: A Quantitative Dynamic General Equilibrium Analysis. Real Estate Econ. 2012, 40, 167–195. [Google Scholar] [CrossRef]
- Pan, J.-N.; Huang, J.-T.; Chiang, T.-F. Empirical study of the local government deficit, land finance and real estate markets in China. China Econ. Rev. 2015, 32, 57–67. [Google Scholar] [CrossRef]
- Bischoff, O. Explaining regional variation in equilibrium real estate prices and income. J. Hous. Econ. 2012, 21, 1–15. [Google Scholar] [CrossRef]
- Ren, H.; Folmer, H.; Van der Vlist, A.J. What role does the real estate–construction sector play in China’s regional economy? Ann. Reg. Sci. 2014, 52, 839–857. [Google Scholar] [CrossRef]
- Bashar, O.H.M.N. An Intra-City Analysis of House Price Convergence and Spatial Dependence. J. Real Estate Financ. Econ. 2020, 63, 525–546. [Google Scholar] [CrossRef]
- Li, L.; Zhao, K.; Wang, X.; Zhao, S.; Liu, X.; Li, W. Spatio-Temporal Evolution and Driving Mechanism of Urbanization in Small Cities: Case Study from Guangxi. Land 2022, 11, 415. [Google Scholar] [CrossRef]
- Zhao, S.; Zhao, K.; Zhang, P. Spatial Inequality in China’s Housing Market and the Driving Mechanism. Land 2021, 10, 841. [Google Scholar] [CrossRef]
- Wang, J.-F.; Li, X.-H.; Christakos, G.; Liao, Y.-L.; Zhang, T.; Gu, X.; Zheng, X.-Y. Geographical detectors-based health risk assessment and its application in the neural tube defects study of the Heshun region, China. Int. J. Geogr. Inf. Sci. 2010, 24, 107–127. [Google Scholar] [CrossRef]
- Wang, J.F.; Xu, C.D. Geodetector: Principle and prospective. Acta Geogr. Sin. 2017, 72, 116–134. [Google Scholar]
- Zhao, S.; Li, W.; Zhao, K.; Zhang, P. Change Characteristics and Multilevel Influencing Factors of Real Estate Inventory—Case Studies from 35 Key Cities in China. Land 2021, 10, 928. [Google Scholar] [CrossRef]
- Wang, J.F.; Zhang, T.L.; Fu, B.J. A measure of spatial stratified heterogeneity. Ecol. Indic. 2016, 67, 250–256. [Google Scholar] [CrossRef]
- Wang, J.F.; Hu, Y. Environmental health risk detection with GeogDetector. Environ. Model. Softw. 2012, 33, 114–115. [Google Scholar] [CrossRef]
- Holmes, M.J.; Otero, J.; Panagiotidis, T. Property heterogeneity and convergence club formation among local house prices. J. Hous. Econ. 2019, 43, 1–13. [Google Scholar] [CrossRef]
- Ding, R.X. Research on Regional Spatial Differentiation and Regulation Optimization of China’s Real Estate Market; China Social Sciences Press: Beijing, China, 2020. [Google Scholar]
- Klett, I.G. Real estate production, financial intermediation and land banking in Santiago de Chile. Scr. Nova-Rev. Electron. Geogr. Cienc. Soc. 2021, 25, 33–57. [Google Scholar] [CrossRef]
- Gabauer, D.; Gupta, R. Spillovers across macroeconomic, financial and real estate uncertainties: A time-varying approach. Struct. Chang. Econ. Dyn. 2020, 52, 167–173. [Google Scholar] [CrossRef]
- Wilhelmsson, M. What Role Does the Housing Market Play for the Macroeconomic Transmission Mechanism? J. Risk Financ. Manag. 2020, 13, 112. [Google Scholar] [CrossRef]
- Wang, F.; Ran, G. Excessive Financial Support, Real Estate Development and Macroeconomic Growth: Evidence from China. Emerg. Mark. Financ. Trade 2019, 55, 2437–2447. [Google Scholar] [CrossRef]
- Golob, K.; Bastic, M.; Psunder, I. Analysis of Impact Factors on the Real Estate Market: Case Slovenia. Eng. Econ. 2012, 23, 357–367. [Google Scholar] [CrossRef][Green Version]
- Carmichael, B.; Coën, A. Real estate as a common risk factor in the financial sector: International evidence. Financ. Res. Lett. 2020, 32, 101172. [Google Scholar] [CrossRef]
- Cerutti, E.; Dagher, J.; Dell’Ariccia, G. Housing finance and real-estate booms: A cross-country perspective. J. Hous. Econ. 2017, 38, 1–13. [Google Scholar] [CrossRef]
- Stevenson, S. Macroeconomic and Financial Determinants of Comovement across Global Real Estate Security Markets. J. Real Estate Res. 2016, 38, 595–624. [Google Scholar] [CrossRef]
- Bates, L.J.; Giaccotto, C.; Santerre, R.E. Is the Real Estate Sector More Responsive to Economy-Wide or Housing Market Conditions? An Exploratory Analysis. J. Real Estate Finance Econ. 2015, 51, 541–554. [Google Scholar] [CrossRef]
- Fernandez, M.D.; Marron, M.L.; Rodriguez, P.M. Does the population determine the dynamics of the real estate activity? An analysis of cointegration for the Spanish case. Investig. Econ. 2016, 75, 103–124. [Google Scholar] [CrossRef][Green Version]
- Wang, X.; Hui, E.C.-M.; Sun, J. Population Aging, Mobility, and Real Estate Price: Evidence from Cities in China. Sustainability 2018, 10, 3140. [Google Scholar] [CrossRef]
- Liu, T.-Y.; Su, C.-W.; Chang, H.-L.; Chu, C.-C. Is urbanization improving real estate investment? A cross-regional study of China. Rev. Dev. Econ. 2018, 22, 862–878. [Google Scholar] [CrossRef]


Publisher’s Note: MDPI stays neutral with regard to jurisdictional claims in published maps and institutional affiliations. |
© 2022 by the authors. Licensee MDPI, Basel, Switzerland. This article is an open access article distributed under the terms and conditions of the Creative Commons Attribution (CC BY) license (https://creativecommons.org/licenses/by/4.0/).