Abstract
There is no comprehensive understanding of the problems that may impact the performance of the different actors that participate in the design of construction projects. In the absence of clarity about the problems and challenges that may impact the interactions, it is not possible to propose action plans to optimize the performance of the design teams. Therefore, this study proposes to identify the main problems and challenges in the interactions of design teams in building projects. A mixed review method is used to integrate bibliometric reviews, systematic reviews, and social network analysis to build a complete picture of the reviewed topic while highlighting certain key areas to ensure in-depth research. To achieve the objective of this work, the research was divided into three stages: (1) study of interactions in design teams; (2) identification of problems in design team interactions; and (3) study of problems in design team interactions. Through this study, four current major trends of research were identified: (1) Collaboration and BIM; (2) Design teams in the construction industry; (3) Design management; and (4) Collaborative design methodologies and processes. In addition, the most relevant problems or challenges within design team interactions arise in communication, collaboration, coordination, trust, and role identification.
1. Introduction
The architecture, engineering, and construction (AEC) industry is a complex and dynamic business since there are different actors involved in construction projects that are aiming to meet their objectives with diverse interests and relationships [1]. The design process grows in complexity as much as it increases the specialized knowledge provided by a large number of design contributors from a wide variety of organizations [2], which is stimulated by the specialty subcontracting practice [3].
Several groups of professionals play different roles in construction projects, with a high level of fragmentation in the division of tasks and responsibilities among the professionals that integrate the teams (architects, engineers, and surveyors, among others) [4]. Consequently, the AEC industry is fragmented into several specialties throughout the different stages of the project life cycle [5,6]. On the one hand, fragmentation indeed generates a high level of specialization of each part; on the other hand, integrating the different specialties becomes complex as the number of parts into which the work is divided increases, thus requiring a better and greater interaction among the specialties [7].
A low level of interaction directly impacts project performance [8]. Therefore, a deficient interaction in the work teams of the AEC industry can result in poor performance, both in the realization of each of its stages (design, construction, maintenance, operation, and deconstruction) and at a global level in the project life cycle [9]. Thus, in order to deliver successful construction projects, the design process requires collaboration among multidisciplinary teams [10], in which the design team participants must have high levels of interaction [11]. The latter is generated through communication, coordination, and collaboration among the participants [12].
A higher interaction among the project team enhances the trust and learning of the work teams, achieving high levels of commitment and understanding among the team members [13]. Consequently, improving information flows among people allows for better project performance [14]. For this reason, it becomes relevant to understand how the interactions within the AEC teams work, particularly the design teams, since the design decisions can significantly affect the whole project performance. Design teams play an important role while creating design concepts and refining the client’s requirements for the project [15]. Plus, design decisions directly impact on projects costs since the costs of changes in this phase are negligible compared to the costs of changes in future stages [16].
Currently, some experiences have made it possible to study the interactions of design teams in building projects. For instance, Hickethier et al. [17] examined the information flow within design teams working in an IPD (integrated project delivery) project, concluding that both collaboration and trust are central elements in projects with multi specialists. Moreover, Svalestuen et al. [18] identify twelve key elements that influence a construction design team; their findings conclude that the interaction between team participants is fundamental to achieve good performance. In particular, elements such as knowing the roles of the members of the design team, trust, and collaboration links. Another relevant work is by Al Hattab & Hamzeh [19], which analyzes design errors with a strong focus on interaction dynamics, communication, and information flow. Finally, Herrera et al. [11] propose a method to understand interactions in construction design teams using metrics from social network analysis (SNA) and sociograms generated within these temporary organizations.
These studies seek to understand the interactions that exist in design teams in construction projects, however, there is no in-depth study of the factors that affect the interactions in design teams. Therefore, there is no comprehensive understanding of the problems that may impact the performance of the different actors that participate in the design of construction projects. In the absence of clarity about the problems and challenges that may impact the interactions, it is not possible to propose action plans to optimize the performance of these teams in terms of communication, coordination, and collaboration. Considering this knowledge gap, this study proposes to identify the main problems and challenges in the interactions of design teams in building projects through the generation and analysis of keyword co-occurrence maps of the main design problems and its networks among the literature.
2. Materials and Methods
This research aims to identify the problems within the interactions of the design teams. To achieve this objective, the mixed method literature review has been selected. Unlike other methods of literature review, such as summarization of prior knowledge (narrative review or descriptive review, for example), explanation (theoretical review or realistic review, for example), data aggregation or integration (meta-analysis or qualitative systematic review, for example), or critical assessment of literature (critical review) that have specific approaches (from a single qualitative or quantitative viewpoint), the mixed method integrates quantitative and qualitative approaches in the same research study [20,21,22]. Mixed methods aim to maximize the strengths and minimize the weaknesses of both qualitative and quantitative methods [23]. This type of review can reduce the influence of the subjective judgment of the manual qualitative review method and improve the depth and understanding of the results of the quantitative review method [24,25]. The interactions and issues between the design teams are identified from the literature and then studied to understand the results and draw conclusions. To achieve the goal of the research, i.e., find the problems within the design teams’ interactions, the authors combined a quantitative (bibliometric approach) and a qualitative (systematic approach) literature review in this study [24,25].
In this research, the review through a bibliometric analysis was used as a quantitative method, while the systematic literature review was used as a qualitative method. The quantitative approach was complemented with a network analysis and another bibliometric study. A bibliometric study is a statistical analysis method that aims to visualize structural and dynamic aspects of scientific research [26]. Bibliometric mapping serves as an important technique within bibliometrics as it allows visualization of the knowledge domain and the relationships between articles and journals, among others [27]. In this research, bibliometric mapping was used to identify the knowledge domains and determine the most frequent problems mentioned by researchers under these domains.
Fundamentally, keyword co-occurrence analysis was adopted to visually explore the research databases, the distribution of the domains, and the main research trends in design team interactions. In addition, the bibliometric study allowed an analysis of the most productive journals and associated countries. In this way, it was possible to evaluate both the historical progress and the main research directions to assess the status and growth trend of the research field. Furthermore, the knowledge domain map is an image that shows the structure of the scientific knowledge, depicted in numerous relationships between the domains [28]. Therefore, the bibliometric study made it possible to generate a knowledge structure around the research on design team interactions, facilitating the understanding of the studied knowledge domain.
At the same time, a systematic review was carried out to provide a comprehensive view of the existing research to identify the common problems in the interactions of design teams, thus obtaining a first approach to the main problems related to this topic based on their major mention by the authors. Finally, the bibliometric mapping was used again to determine the main problems and challenges presented in the interactions of design teams with a statistical and quantitative approach, generating a map of co-occurrence of the problems identified in each of the papers. This also made it possible to generate a knowledge structure around the problems in the interactions of the design teams. This bibliometric study was complemented with a network analysis and, in particular, the study of the centrality metrics of the generated network. Centrality refers to the importance or prominence of elements within a network. Therefore, these metrics allowed us to determine quantitatively the main problems in this domain.
Consequently, a mixed review method is used to integrate bibliometric reviews, systematic reviews and social network analysis to build a complete picture of the reviewed topic while highlighting certain key areas to ensure in-depth research [29]. To achieve the objective of this work, the research was divided into three stages: (1) study of interactions in design teams; (2) identification of problems in design team interactions; and (3) study of problems in design team interactions. Figure 1 shows the proposed mixed method.
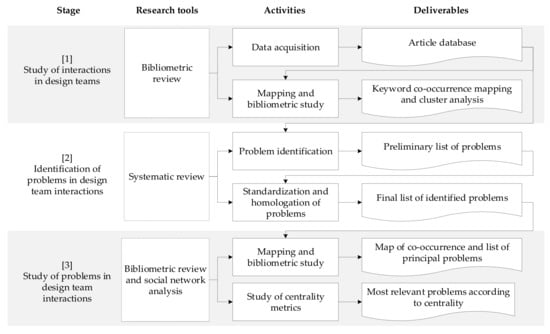
Figure 1.
Research methods.
2.1. Study of Interactions in Design Teams—Bibliometric Review
To obtain a general understanding of the knowledge domain, a bibliometric study of the existing literature on construction design teams, their interactions, teamwork, and collaboration was conducted. This stage was conducted with two main tasks: (1) data collection; and (2) mapping and bibliometric study. First, a data-collection strategy was developed, which involved determining the keywords and selecting the database to obtain a complete dataset. The data collection from the existing literature included scientific papers and articles from specialized journals in the AEC industry and the main congresses’ proceedings between 2010 and 2021. The last 10 years of research were selected since experiences in similar bibliometric studies indicate that this is a sufficient period of time to analyze current trends and challenges in a research topic [25,30,31,32,33]. To perform data collection in the fields related to design teams and teamwork, the search was conducted in the Scopus and the Web of Science libraries. The reasons for selecting the databases of Scopus and Web of Science are as follows: (1) they have a relatively wide range of coverage in the domain of construction research compared with other databases [34,35,36,37]; (2) they are a better choice for interdisciplinary research topics [37]; and (3) they have a wide range of coverage on journal publications [38]. The search strategy was the application of the seven following reference topics “design team”, “teamwork”, “collaboration”, “team interaction”, “building”, “construction”, and “problems” combined into twelve search possibilities (I to XII) in the fields “title, abstract and keywords”. The articles were selected by applying the following inclusion/exclusion criteria: (1) focus on building/construction engineering design; (2) focus on design teams; and (3) journals related to the AEC industry. Articles regarding the design teams from other industries and topics related to engineering education were excluded. The selected papers were included in the bibliometric analysis. Figure 2 shows, in a simplified manner, the steps performed for the acquisition and selection of literature papers.
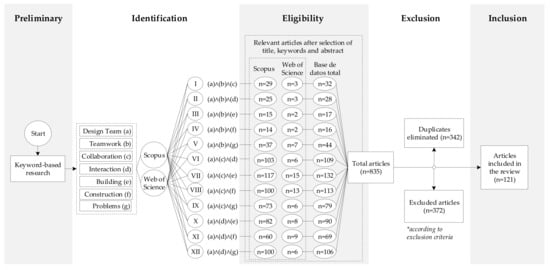
Figure 2.
Outline of the literature collection and selection process.
The 121 collected papers were analyzed according to their annual distribution (from 2010 to present), production by country, and publisher, including the main journals and conferences. Then, a bibliometric mapping was carried out using the VOSviewer, an open-access software [27]. This tool has advantages for the visualization of knowledge maps and clustering and for being widely used in the development and visualization of bibliometric analysis. Bibliometric maps, science maps, or scientograms, represent a scientific domain [39]. The use of these diagrams provides a better understanding of the structure of a scientific domain since the graphical representation of the different units and their relationships facilitate their visualization [40]. They are mostly built on the principle of co-occurrence relationships or the common occurrence of two units of information in a document [41]. The main use of this software was for the generation of keyword co-occurrence maps, allowing the visualization of the scientific domain and identification of the main research areas within the knowledge domain in question, which allowed a holistic view of the current branches and main topics of development of the research area to be obtained.
The main objective of co-occurrence analysis is to describe the relationship and internal compositional structure in each scientific domain and reveal the main research fronts. A research front is understood as the conceptual combination of a research topic and emerging theoretical trends and new topics [28]. To develop the domain knowledge about design teams, the authors mapped the co-occurrence of keywords within the selected articles; the mapping is based on distance. The distance between two elements reflects the strength of the relationship between them [27]; a smaller distance generally indicates a stronger relationship. The size of the element label reflects the number of articles in which the term appears. A larger label size indicates that more publications contain that term. The different colors represent different groups of grouped items using the VOSviewer grouping technique [42].
2.2. Identification of Problems in Design Team Interactions—Systematic Review
Following the bibliometric study in Stage 1, a qualitative analysis of the selected articles was carried out. This task was performed manually and aimed to identify the problems and challenges in the interactions of design teams mentioned by the researchers, based on a systematic review of the articles selected in the previous stage. The qualitative analysis was divided into two main activities: (1) problem identification; and (2) problem standardization and homologation. All of this was supported by a systematic review of the selected articles.
In the first activity, the problems mentioned by the papers’ authors were identified through the document review. These papers were extracted and indexed in a bibliographic database composed of the bibliographic characteristics of each document, namely authors, title, year, source title, abstract, and keywords, with an additional index for the problems identified in each article. In the second activity, each of the extracted problems were standardized using a maximum of four words to describe the problem in a common structure. Finally, a homologation process of the standardized problems was carried out so that similar problems, or problems that essentially pointed to a common problem, were matched. Upon completing these tasks, a list with a common structure and optimal order was generated for the subsequent bibliometric analysis performed in Stage 3. As a result, the problems identified in each article were compiled in a bibliographic database, which also included the characteristics of the article itself.
2.3. Review of Problems in the Interactions of Design Teams—Bibliometric Review and Systematic Network Analysis
Once the problems mentioned by the authors had been identified, the VOSviewer software was used again to perform a bibliometric mapping of the generated database, as shown in Figure 1. For this purpose, bibliometric techniques were applied, such as word co-occurrence, to identify the researchers’ main or most cited problems within the generated database. In the literature, co-occurrence, co-words, or co-terms analysis is understood as the study of the co-occurrence, or joint occurrence, of two terms in a given textual corpus to identify the conceptual and thematic structure of a scientific domain [43,44].
Stage 3 was executed within two activities: (1) bibliometric mapping and study; and (2) centrality metrics studies. First, bibliometric mapping was performed using VOSviewer software. Bibliometric maps were generated based on the co-occurrence of the identified problems and the frequency table (number of occurrences) provided by the same software. Then, based on the co-occurrence map and the frequency table, the main problems were identified by their greater co-occurrence, which is reflected in the size of the nodes in the bibliometric map by their greater frequency and by their relationships with the rest of the problems. The main problems were discussed in depth, analyzing possible solutions that have been developed from Lean and BIM methodologies.
Finally, for a more accurate analysis of the main problems, the network centrality metrics were studied using Gephi, a specialized network analysis software [45]. Gephi allows visualizing, manipulating, and analyzing networks by providing graphs and quantitative metrics to form a deep understanding of the studied networks [19]. To study the metrics of the generated network, the problem co-occurrence map made in VOSviewer was exported to the software Gephi, from which the main network metrics were obtained to identify the most important problems within the generated network. In graph theory, several centrality measures have been defined for the nodes that make up these maps, such as: (1) degree centrality, which represents the number of edges or connections that a node presents [46]; (2) closeness centrality, which indicates the speed in which a node can disseminate information to all the others, a strong closeness centrality indicates nodes that are influential in the network [47]; (3) betweenness centrality, which is the number of shortest paths on which a node is located, it indicates the ability of a node to establish relationships with other nodes in the graph [17,47]; and (4) eigenvector centrality, which indicates the importance of a node in the network through the principle that high-scoring nodes contribute more to the score than connections with low-scoring vertices [47,48]. This stage made it possible to identify numerically and graphically the main problems presented by the interactions of the design teams.
3. Discussion and Results
3.1. Annual Quantitative Distribution of Literature
A total of 121 papers from the selected knowledge base were distributed chronologically between 2010 and 2021, as shown in Figure 3. Preliminary assumptions can be learned that relevant research on interactions in design teams and the problems that impact them have remained relatively constant from 2010 to date. The peak of relevant publications occurred in 2011 and 2017 with 16 articles each year, followed closely by 15 and 14 publications in 2014 and 2013, respectively. It is important to note that the articles published in 2021 were retrieved in the first quarter of the year, so the total number of articles for that period is incomplete. Although it is not possible to identify any growth trend or any growing interest in the research area, it is possible to conclude that since 2010 there has been a steady development of relevant research about design team interactions.
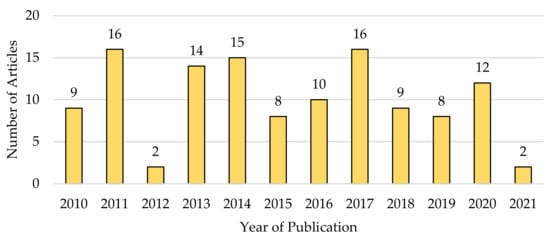
Figure 3.
Number of relevant articles published between 2010 and 2021.
3.2. Quantitative Analysis of the Main Countries
According to the results obtained, the papers were produced in 37 different countries (or territories); Table 1 lists the seven most productive countries. Most of the publications are from Europe. However, the United States is the most productive country in relevant studies on design team interactions with 29 publications, followed closely by the United Kingdom with 28 papers. In third and fourth places are the Netherlands and Norway with nine and seven publications respectively, and closing the list are Germany, Hong Kong, and Israel, all with five publications each (Table 1).

Table 1.
Top seven most productive countries of the selected publications.
Figure 4 presents a heat map showing the publication density of the main research countries. The higher the number of publications, the warmer the color is (red) and the lower the number of publications, the cooler the color is (yellow). In addition, if concentric colored clusters are shown, it means that there are close collaboration links between these countries. As Figure 4 shows, the countries with the largest nodes are in the central positions of the blocks in this density view. The United States and the United Kingdom are observed in the most central positions and with warmer color trends. Strong ties between the core countries are not discernible; however, the United States stands out with several links around it, such as Canada, Norway, Netherlands, and Germany, so it stands out as an open environment for collaboration. On the other hand, the United Kingdom lacks strong ties around it, thus appearing as a more hermetic collaborative environment.
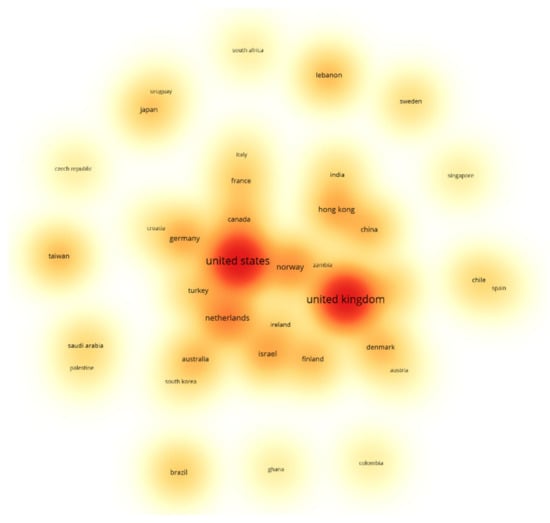
Figure 4.
The density of the main researching countries according to the total number of selected publications.
3.3. Quantitative Analysis of the Main Journals and Conferences
From the 121 relevant publications, a total of 73 journals and conferences papers were identified, covering engineering, construction, design, management, architecture, building, and other research fields. Table 2 shows the 20 most productive journals and conferences, representing 56% of the total number of publications studied. Within the top journals and conferences listed in Table 1, there are four conferences, one congress, and fifteen journals. In general, the top journals and conferences analyzed are multidisciplinary or interdisciplinary, indicating that the knowledge domain around design team interactions is a multidisciplinary science and generally involves all disciplines of the AEC industry.
Table 2.
Main academic sources identified with two or more articles.
3.4. Keyword Co-Occurrence Analysis
Previously to the keyword co-occurrence analysis, all the existing keywords in the publications, namely, 364 keywords, were grouped according to their topics. For instance, “BIM”, “building information model”, “building information modeling”, “building information modeling”, and “building information modeling (BIM)” were unified into a single term called “BIM”, reducing the total number of keywords to 337. Then, the bibliographic information of these articles was entered into VOSviewer and the minimum number of occurrences of a word was set to two, leaving out terms with no repetition within the domain, which reduced the total number of keywords from 337 to 71. With this number, a keyword co-occurrence map was generated as depicted in Figure 5, in which the keywords were grouped into four clusters (represented by the colors red, yellow, blue, and green) according to the highest similarity concerning each research topic. Table 3 details quantitative information of the main keywords (four or more occurrences) presented in Figure 5. Moreover, the average year of the publication shows the average period in which researchers have mentioned a given keyword. The “Links” column corresponds to the number of connections between a term and the others, while the “Total Links Strength” column reflects the strength or weight of these links.
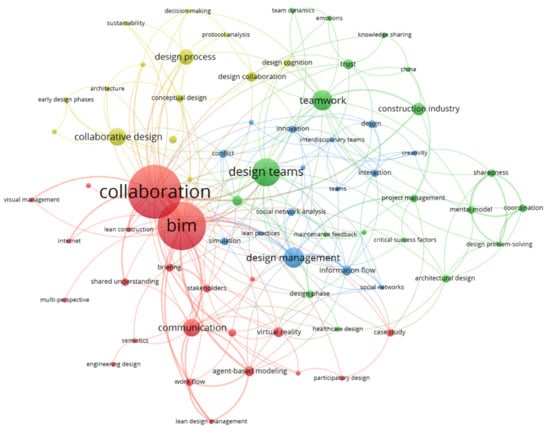
Figure 5.
Co-occurrence map of keywords.
Table 3.
Main keywords in selected articles, four or more occurrences.
Several findings are identified based on the co-occurrence map in Figure 5 and the quantitative information in Table 3. Through the clustering of keywords, it was possible to distinguish the main groups of terms associated with the predominant lines of research, such as (1) collaboration and BIM; (2) design teams in the construction industry; (3) design management; and (4) collaborative design methodologies and processes.
3.4.1. Collaboration and BIM—Cluster 1 (Red)
The main keywords in this cluster are collaboration, BIM, communication, agent-based modeling, and virtual reality. This corresponds to the main cluster, where the two keywords most frequently cited by the authors in the articles studied are collaboration and BIM. These topics are a response of researchers to the criticism regarding the AEC industry fragmentation and the necessity for change. The change promoted requires collaboration and the application of emerging methodologies such as BIM that are seen as enablers to build the integrated teams [4]. However, the design process often lacks collaboration between design teams from different organizations, leading to problems such as insufficient information for critical decision making. Therefore, efficient and systematic information exchanges between designers become essential to achieve design objectives [49].
Additionally, terms such as communication, agent-based modeling, and virtual reality appear frequently within this group. There is a strong link between BIM and communication because both BIM and lean practices drive information sharing and communication within design teams and can shape the design process by minimizing the occurrence of errors during the design process [19]. Although design involves collaboration that increasingly requires dynamic and complex information exchanges between multidisciplinary teams, and although BIM has emerged as a solution to innumerable problems, the design process continues to suffer from malfunctions, mainly attributable to a lack of consideration of the inherent problems in the communication and behavior of design teams when adopting BIM [50]. For this reason, it has been examined whether the adoption of BIM can improve the design by considering both social interaction mechanisms and information flow. The main methodology used for these purposes is agent-based modeling [50,51]. Alternatively, the design community has shown an increased interest in virtual reality in project review contexts, thus encouraging the use of collaborative virtual reality environments that facilitate design team participation and shared project exploration [52].
Finally, one of the major benefits of using BIM in the design and construction industry is increasing participation and interaction between the various stakeholders. Although BIM and collaboration are jointly researched in most cases, there are still significant problems in design team interactions, mainly attributable to poor communication and weak information flows. Following this research front, there are proposals, methodologies, and systems that seek to integrate BIM with other elements such as virtual reality [53,54] in collaborative work environments, which seek to reduce communication gaps and improve information flows within the project stakeholders and the design team. There are drivers for the study and implementation of BIM for building projects, but many of the BIM design tools lack the capabilities to validate and verify more advanced project models, having to rely on other specialized BIM tools. This makes it difficult to implement interoperable processes between separate or non-colocated design teams. The solution to this is to implement solutions that fulfill BIM with collaboration and communication between participants. Although the BIM approach can be applied in any route of the bidding process, improving the overall process and presenting several advantages, in some cases these types of implementation lead to a certain level of isolation between the design and construction phases. As a result, the process may lack knowledge and collaboration. Therefore, the implementation of BIM must be accompanied by processes that foster collaboration between the stakeholders [55].
3.4.2. Design Teams in the Construction Industry—Cluster 2 (Green)
The main keywords in this cluster are design teams, teamwork, construction industry, facility management, and trust. This cluster is the second most dominant, where design teams is the term visualized as the main theme of this group, and possibly of the network in general, since it is located within the map as the most central term. In addition, teamwork stands out as a second term within this cluster and the construction industry serves to somehow limit this group only to design teams in this industry.
It is known that the effectiveness levels of design teams in the construction industry are directly related to teamwork and this is reinforced in multidisciplinary design teams where individual team members have specific competencies [56]. There are different models for design development and management: cooperative design, an approach based on teamwork and interactions among stakeholders. While the literature emphasizes communication as a key to good collaboration and teamwork, successful teamwork occurs through efficient collaboration and communication based primarily on shared understanding [2]. Today, distributed work teams are an increasingly common feature of engineering design work; consequently, a key factor for successful teamwork is developing a shared understanding, which is difficult in distributed design teams [57]. Now, for geographically distributed teams, trust is an important factor affecting the performance of the design team on a construction project, therefore, to improve performance, the factors affecting trust must be identified [58]. Strongly efficient design teams are important for collaboration among participants in the design phase. Trust is highlighted as one of the most important elements influencing the performance of the design team, along with good collaboration and role identification [18].
While there is a relative consensus on the factors that impact the performance of design teams in the construction industry, there are still elements to contend with. One of them is the spatial distribution of design teams. Not having colocated teams makes collaboration, role identification, and trust difficult; moreover, the progressive trends of globalization and specialization in the construction industry make collaboration between design stakeholders in distant locations crucial [59]. This latter point has generated great interest in the study of team dynamics and emotions [60] and mental models [61] to integrate and coordinate design teams in the construction industry.
3.4.3. Design Management—Cluster 3 (Blue)
The main keywords in this group are design management, information flow, innovation, interaction, and conflict. Design management is visualized as the main topic in this group, however issues such as information flow, interaction, and innovation also stand out. This is due to the fact that in the construction industry the design process is a multidisciplinary and complex process that must be carefully managed to improve the efforts of the different participants and the various organizations; it is in this context that innovation and emerging technologies arise in order to achieve the integration of the teams [4]. For this reason, design management is mainly associated with the use of BIM and can be improved by using the new tools and methods introduced by BIM and Lean construction. However, in current project practices the roles of people, design methods, communication, and information flow between designers are often derived from the document-based design management era. Design teams can only partially adapt to the new way of working [62]. During the design phase, coordination is related to information flow management, which, when poorly managed, results in designers suffering from information overload. In these cases, increased information flow reduces the efficiency and effectiveness of design communication [17].
Understanding the process by which information flows between project participants is essential to improve design management. Construction projects are complex products developed by teams. One of the main difficulties in design teamwork is to achieve a continuous and smooth information flow. When it fails, it results in bottlenecks and rework that negatively impact teamwork, reducing the final product quality [63]. Thus, design management has a strong connection with the information flow, which is in line with the fact that taking management approaches and tools aligned with Lean construction in the design phases increases the number of people involved and, therefore, also could increases the need for coordination [17]. As design management in engineering and construction involves multidisciplinary teams, this range of professionals provides great opportunities for increased creativity and innovation [64]. For this reason, several studies within this cluster focused on innovation in design, emphasizing the interactions between participants and the possibility of building successful teams [65], analyzing the temporal relationships between team members, and how the management of design, disagreements, and conflicts influence the success of design teams.
3.4.4. Collaborative Design Methodologies and Processes—Cluster 4 (Yellow)
The main keywords in this group are collaborative design, design process, design collaboration, conceptual design, design cognition, and virtual collaboration. This group shows collaborative design and design processes as the most relevant topics in this research area. The widely recognized importance of collaborative design has led to developing frameworks and tools to support collaboration in the construction industry. Therefore, collaborative and multidisciplinary design processes enable design teams to be more effective and responsive to market challenges [66]. Effective collaboration during the early design stages leads to less iterative cycles in later stages; however, there are major variables during collaborative design processes, such as workflow, education, and practitioners’ backgrounds [67].
The other terms in the cluster are collaboration in design, conceptual design, and virtual collaboration; they are relevant because in the conceptual design phase, communication for the synchronization of information generally requires designers to use digital design tools that are flexible and intuitive. Full integration of people is not yet achieved because conventional design methods continue to be used and have not been replaced by appropriate digital formats [59]. In particular, in the early stages of construction projects, which are considered the most critical phases, virtualization is increasing in sync with the greater geographical dispersion of project teams [68], thus, virtual collaboration activities are extremely relevant in non-colocated design teams.
This cluster highlights a line focused on design processes with a strong focus on the collaborative area. Research includes how to improve collaboration within design teams in the construction industry, which requires both the skills to recognize and diagnose teamwork problems and the behavioral changes needed to correct them [69]. This stems from a social perspective on work that suggests that both designers and clients should work collaboratively over time to improve future work [70]. Therefore, research in this topic points out the development of indicators and criteria of cognitive studies within design teams to evaluate the performance of collaborative designs.
3.5. Analysis of Problems in the Interactions of Design Teams
This section presents the results of the systemic analysis of the selected articles in conjunction with bibliometric mappings and network analysis to generate a new knowledge structure focusing on the problems that affect design team interactions. From the 121 publications studied in this research, problems were identified through the systematic review of 89 articles, discarding 32 publications due to the following reasons: they did not present problems in design teams, or had no access.
3.5.1. Quantitative Analysis of Co-Occurrence of Problems
The co-occurrence of problems within the selected articles was mapped to construct the domain knowledge about problems in design team interactions. Figure 6 is the co-occurrence map of the identified problems, showing the general structure of the joint occurrence of the problems identified in each of the articles reviewed. A total of 129 problems were identified. The detailed quantitative information for each of the keywords in Figure 6 was tabulated in Table 4, which lists the main problems identified with an appearance or occurrence greater than 10.
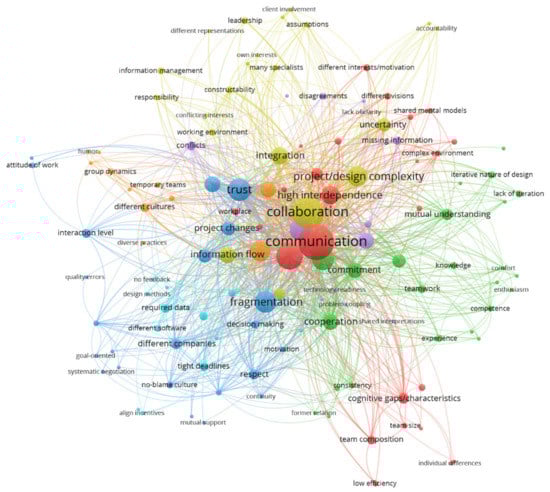
Figure 6.
Co-occurrence map of identified problems.
Table 4.
Main problems in selected items, 10 or more occurrences.
In addition, Figure 7 presents a heat map that visually shows the density of occurrence of the main problems identified by zooming in on the center of the network, where the most relevant elements are in terms of their number of occurrences and links. The concentric blocks indicate that the problems occur simultaneously, which leads to the conclusion that they are highly interrelated, i.e., that the presence of one of them may imply that there are other problems around it or that the existence of root problems (those that are around it) generate a larger problem (the most central ones).
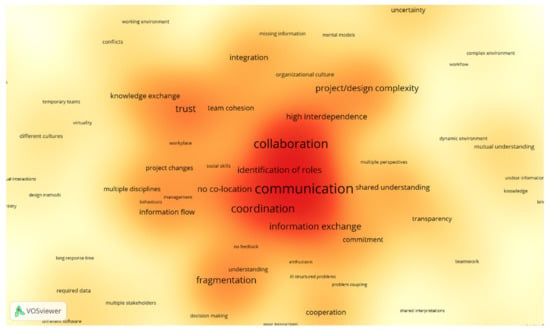
Figure 7.
The density of occurrence of the main problems.
For example, in Figure 7, communication can be identified as the most central element, triggered consequently by the elements concentric on it such as collaboration, identification of roles, coordination, and interchange of information. Another interpretation of the heat map is that the central problem generates these peripheral problems; in this case, it might be that communication problems generate poor coordination, little coordination, and do not allow the identification of roles or the exchange of information. Other elements identified with a concentric tendency are trust, team cohesion, and knowledge sharing. Two more valid readings can be recognized; that trust generates difficulties in team cohesion and knowledge sharing, or that the latter might generate trust problems in the teams. A more in-depth study would be needed to determine in which cases the perimeter problems generate the central problems and vice versa. The subsequent use of centrality metrics such as closeness or betweenness may help to give the first indication of this.
To better visualize the main problems identified in Figure 6, an approach was made to the center of the generated network, where the most important nodes in the network are located in terms of the number of occurrences, connections, and the weight of these connections. Figure 8 shows an approach to the center of the generated network to visualize the main elements grouped in that position. In this case, the analysis focused on the behavior of the individual nodes and how they relate to the elements around them, i.e., it is more convenient to analyze the nodes and their links with the elements around them.
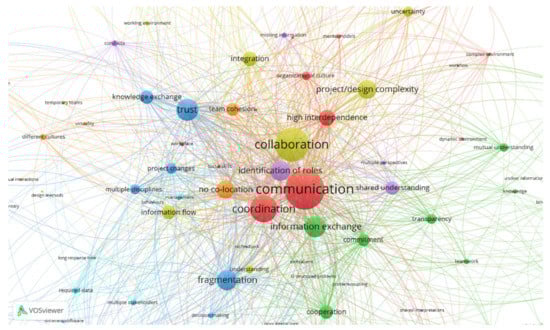
Figure 8.
Co-occurrence of the main identified problems.
Thus, concerning the network characteristics present in Figure 6, the density of occurrence in Figure 7, the quantitative data in Table 4, and the review of articles performed, at least ten relevant problems are identified within the interactions of design teams, these are (ordered by highest occurrence): (1) communication; (2) collaboration; (3) coordination; (4) trust; (5) information exchange; (6) fragmentation; (7) role identification; (8) project and design complexity; (9) non-colocation; and (10) high interdependence. The three main problems (considering the highest occurrence, number of connections, and their weight) are studied as follows:
- Communication: This element appears in 70 out of 89 articles studied, representing 78.7% of occurrence. However, since the 1940s, most authors have concluded that the fragmented nature of the industry, the lack of coordination and communication between the parties, the informal and unstructured learning process, and the lack of customer focus inhibit overall performance in the construction industry [4]. Some studies along this line have sought to understand and propose tools that encourage communication between designers [59]. Other studies suggest that information exchange and communication impact the occurrence and dissemination of design errors, hence proposing BIM methodologies and Lean practices would minimize this occurrence [19]. Moreover, communication is the manner in which design knowledge is exchanged [63] and is emphasized as a key element for good collaboration and teamwork. There are multiple definitions for the word “team”, but one of the concepts that is predominant in these definitions is communication, i.e., the ability of the participants to exchange information [71]. In areas such as sustainable design, it has been highlighted that the most important challenges are communication and coordination of multidisciplinary teams [49]. Some studies have investigated typical problems in structural design management [62], determining that the most important causes of these problems were lack of communication and unclear division of responsibilities, among others. In general, products in the AEC industry require a specialized design process involving interdisciplinary relationships. In such relationships, collaboration, communication, and information exchange are the essential elements in developing a good design [72]. In summary, communication is one of the fundamental elements within the design process, being key in the management of multidisciplinary teams and also impacting or being strongly related to other key elements such as coordination, knowledge sharing, collaboration, and information exchange. This can be seen in Figure 8, where communication is seen as the most central and influential element in the network, presenting strong links with collaboration, coordination, information exchange, and trust, which is reaffirmed by the data in Table 3, where communication is the problem with the most connections and with the greatest importance or weight of these elements.
- Collaboration: This element appears in 56 out of 89 articles studied, representing 62.9% of occurrence. Design work involves collaboration that increasingly requires exchanges of information between multidisciplinary teams [50]. Based on this, collaboration and trust make good design management possible and allow people to perform what is best for the project [17]. Some studies show that projects benefit from multidisciplinary collaboration [73]. Following this line, the widely recognized importance of collaborative design has led to the development of frameworks and tools to support collaboration in the construction industry [10]. It is widely accepted that building design results from interdisciplinary collaboration [74], plus several typical problems in the industry are attributable to the lack of collaboration and innovation in design [4]. Thus, studying the culture of collaboration among designers has been the focus of some studies [59] due to team performance implications. Due to this impact, there is a growing focus on collaboration and collective design [2], such is the importance of collaboration for an effective design. Even applying BIM methodologies, BIM coordinators, and regular modeling meetings do not remove the importance of collaboration and communication in design [62]. Some studies have proposed systems to enable design collaboration [72], especially focused on geographically separated design teams where collaboration becomes more critical. Moreover, the study of collaborative interactions can open up broader concepts such as team communication, participation, contribution, and relationships [68]. In summary, collaboration is also one of the fundamental elements within design, being key in the effectiveness of multidisciplinary design teams and, furthermore, being strongly related to other key elements such as trust and communication. The above can also be observed in Figure 8, where collaboration is re-stated as one of the central and influential elements in the network, presenting strong links with communication, coordination, and trust. This is reaffirmed through the data in Table 3, where collaboration is the second problem with the most connections and also the second with the highest importance or weight of these.
- Coordination: This element appears in 41 out of 89 items studied, representing 46.1% of occurrence. It is known that, in essence, the construction industry is complex and based on punctual projects and temporal relationships; this situation significantly affects key interactions such as the communication flow and the coordination process between teams [75]. The importance of coordination in the design industry is that it has led to the study of the role of mental models in coordinating team activities during design problem solving [61]; a persistent concern when designing buildings is coordinating the different design inputs for a project [76]. Typically, both the client and the design team work in different locations and offices, leading to poor coordination, lack of collaboration, excessive variations, design changes, failed rework, and unjustified delays [77]. Coordination is considered one of the dimensions that impact an integrated work team and other relevant dimensions such as information transfer, trust, and collaboration [11]. In many countries, the concept of “everything in writing” is applied through the request for information, but these requests, apart from being time-consuming, are sequentially difficult to follow and coordinate [78]. Consequently, in addition to team coordination problems, there is a strong difficulty in coordinating the documentation in the design. Other studies point out that because the design is a combination of individual and collective activities, it is relevant to study social and cognitive factors [79]; thus, it has been concluded that increased coordination leads to the development of a shared understanding within the team. In summary, coordination is the third fundamental element within design, being key in the planning and integration of design teams, information exchange, collaboration, trust, and shared understanding. This can also be seen in Figure 8, in which coordination represents one of the central and influential elements in the network, presenting strong links with communication, collaboration, trust and information exchange. This is reaffirmed through the data in Table 3, where coordination is the third problem with the most connections and with the greatest weight of these.
Managing the information flow within the production management is one of the critical aspects that might affect the efficiency of the whole project [80]. An increase in specialization requires greater interaction among the parties, and technological tools are not enough to achieve it due to the fact that information flow requires understanding of the social phenomena that exist in the organizations, for instance, the social and technical factors [13]. BIM has a high technological component that has been extensively studied in recent years; however, its implementation has several challenges from the perspective of people and organizational processes [81]. For instance, BIM requires intense process changes of the involved parties and a higher level of team communication [82]. To obtain positive results, the collaboration among owners, design teams, and contractors has to be significantly improved [55]. Some problems detected in our study were “use of different software”, “lack of digital technology knowledge level”, and “technology readiness”. This makes it difficult to implement interoperable processes between separate or non-colocated design teams [55]. When reviewing trends in the implementation of new methodologies, such as Green Building Technologies, it is possible to find other social barriers, such as: resistance to change, lack of knowledge and awareness, and increased design costs [83]. Therefore, it is also necessary to assess the contextual conditions (e.g., government regulations and R&D incentives) of design teams implementing new technologies aligned with digital transformation [84].
In summary, the predominance of a triad, composed of communication, collaboration, and coordination, can be identified as the main problems that arise in the interactions of the design teams; besides being the most relevant in terms of occurrence, they present a strong interconnection between them. For example, communication and collaboration present a link strength of 49, the highest interconnection between the problems; the connection between coordination and communication presents a weight of 37; and between collaboration and coordination there is a connection strength of 30. These are the three highest linkage scores within the network, which confirms the joint implication and importance of these three elements. The confirmation from this study is one of the first experiences with quantitative components that reaffirm this fact since no major studies of a measurable or quantifiable nature are reported to confirm the high importance of these elements for high-performance teams or their strong interconnection. Other problems to highlight are identifying roles, which appears as a central problem but with fewer occurrences than the three previous ones. Trust, fragmentation, and information exchange also stand out as problems with high occurrence but less centrality in the network.
3.5.2. Network Metrics
To complement the knowledge structure generated and deepen the understanding of the main problems identified, the network generated in the previous section (Figure 6) was exported to a network metrics analysis tool (Gephi), which also makes it possible to determine a series of metrics that will allow the most relevant problems to be identified. As mentioned above, rather than studying the general network structure, what is relevant is to analyze the nodes and how they are linked to each other.
Different metrics were used in the network analysis; in particular, the metrics of interest refer to the nodes, such as degree, betweenness, closeness, and eigenvector centrality. Thus, a node’s degree is the number of edges that are adjacent to the node; betweenness centrality measures the frequency with which a node appears on the shortest paths between nodes in the network; closeness centrality measures the average distance from a given node to all other nodes in the network; and eigenvector centrality assesses the importance of a node based on its connections.
From the metrics in Table 5 and the graph in Figure 6, several findings can be identified. Concerning closeness centrality, the problems with the highest closeness centrality are: (1) communication; (2) collaboration; (3) coordination; (4) trust; and (5) role identification. It indicates that these elements are central problems in the network and present great proximity to more peripheral problems; these nodes tend to be influential, i.e., are influencers or generators of other problems around them.
Table 5.
Metrics of the main problems in the selected articles.
For the case of intermediation centrality, the problems with the highest centrality are again: (1) communication; (2) coordination; (3) collaboration; (4) trust; and (5) role identification. This indicates that these elements are problems with a high capacity for connection with other groups in the network and high levels of interaction with various elements within the network. These elements have multiple links with other groups of problems that tend to occur together with other conflicts, or the presence of these problems implies the existence of other problems around them.
Concerning eigenvector centrality, the scenario is similar. The problems with the highest eigenvector centrality are again: (1) communication; (2) collaboration; (3) coordination; (4) role identification; and (5) trust, only presented in positions 4 and 5, which are reversed. It indicates that these elements are the most important in the graph, under the premise that their connections are generally influential and are important vertices in the network. It could be thought that these elements are relevant because of their greater influence and joint appearance with other problems. Their influence and connections are related to other relevant problems, which reaffirms their greater importance in the network.
Regarding degree centrality, the common scenario is repeated. The problems with the greatest centrality are: (1) communication; (2) collaboration; (3) coordination; (4) trust; and (5) role identification. This indicates that they are strongly connected to other problems, and therefore their importance in the network is greater. These elements are the most connected, so they are strongly related to other nodes, and the case under study indicates that many problems are related to these nodes. It is not possible to conclude from this metric whether these problems are the consequence of a series of root problems or whether they are triggers for other elements since it is not possible to visualize whether the connections enter or leave each node.
In summary, these five elements repeated in each of the metrics studied correspond to the main problems encountered in design team interactions. This confirms the findings of previous co-occurrence analysis and highlights again the triad composed of communication, collaboration, and coordination as the most relevant problems. The analysis of social networks in conjunction with the metrics allows deepening and obtaining more clarity on whether these five elements are the consequence of the problems around them, or if rather these central elements of the network are the ones that generate an accumulation of problems in their environment. For example, due to the closeness centrality metric, it could be estimated that these central elements are influencers of their problems. On the other hand, the betweenness centrality metric allowed us to estimate that other problems generally accompany these elements. Finally, both the degree metric and the eigenvector metric supported the pinpointing of these problems as highly relevant due to their number of connections with other problems and their importance.
4. Conclusions
The use of bibliometric analysis enabled the generation of a knowledge structure about the relevant publications on interactions in design teams. Through this structure it the main research fronts and trends, and the most productive countries and journals in the area were identified. These analyses represent a strong contribution to knowledge in the area since the structures allowed the generation of new knowledge. For example, through the keyword co-occurrence analysis, it was possible to visually explore the main research fronts or trends, which is new knowledge. Through this study, four current major trends of research were identified: (1) collaboration and BIM; (2) design teams in the construction industry; (3) design management; and (4) collaborative design methodologies and processes.
However, the most important contribution of this study is the identification and understanding of the main problems affecting the interactions of design teams in building projects. Through quantitative methods, such as mapping and bibliometric study and network analysis, several problems, challenges, and key elements in the review of publications about design were identified. This study identified the problems and challenges in the interactions of the design teams, thus generating a list of key problems to consider when managing design teams. This list was structured based on systematic reviews, bibliometric techniques, and the study of network metrics.
The most relevant problems or challenges within design team interactions arise in communication, collaboration, coordination, trust, and role identification. These findings are a great contribution of knowledge to improve the performance of design teams, taking control, and managing the design process with a strong focus on communication, collaboration, and coordination. However, there are no major contributions that allow the identification of a measurable relationship between these three identified problems, despite being widely discussed elements in high-performance teams in the AEC industry. The relationship between communication, collaboration, and coordination and their importance detected a measurable character and is based on the documented findings of various authors in an extensive base of scientific publications, thus representing the knowledge documented by different authors in a wide variety of studies. Therefore, this research may be one of the first approaches to determine a real interconnection of these elements and their impact on team performance. Thus, this study may be a foundation for further development in this area, which opens opportunities for future lines of research associated with the study of the interconnections of the problems identified and the generation of desirable networks of response to them. The root causes of the problems encountered need to be further explored, particularly in the context of construction project design teams. In addition, the impact and implementation strategy of new technologies to support the design process should be further studied, as digital transformation and remote working are realities that the industry needs to address. The practical implication is that to obtain the desired performance within design teams, the elements that impact their interactions must be managed, in particular, regarding the communication, collaboration, coordination, trust, and role identification. Then, decision makers and teams’ managers are responsible for promoting the teams interactions. These findings can be of value and use to researchers and practitioners in the AEC industry seeking evidence on the various difficulties and challenges encountered in building design teams’ interactions. Thus, providing a valuable reference to deepen their understanding of these problems and allowing them to formulate action plans based on evidenced and studied problems, aiming for future solutions to generate better performance within the industry teams.
However, although this research was based on a mixed methodology involving quantitative and qualitative analyses to reduce bias in interpreting results, it is not possible to ensure that it is eliminated. Thus, if greater certainty is sought, it is necessary to deepen the lines of research opened by this study. In this sense, the results obtained can be submitted to a group of experts so that through debate and discussion, they can complement the research, thus increasing the certainty of the findings. However, the results obtained in this research are consistent with the consensus identified and the literature about project teams in the AEC industry, highlighting as characteristic elements the high fragmentation, lack of collaboration, problems in communication or information flow, and difficulties in coordinating specialties, which supports and provides strong solidity to the findings.
It is noteworthy that although the study enabled the identification of a large cloud of problems and represented them visually on a map with nodes and connections, it was not possible to identify the direction of the interconnections between them, so that it was not possible to conclude irrefutably whether the problems identified as central are the product of an accumulation of problems around them or, on the contrary, whether it is the central problems that generate the cloud of difficulties around them. The metrics used in this work provided a first approach to closing this gap. However, because the network generated is undirected, the conclusions on the directionality or flow of the problems are not entirely clear. Due to this, a possible line of research is opened to determine whether there is any causal relationship between the problems identified: whether the main problems identified are the generators of other problems that are located more perimetrically in the network, or if these perimeter problems are the generators of the central problems. This would allow the identification of the root causes of typical problems within design teams that would facilitate design management improvement processes.
Furthermore, while the main problems within design team interactions have been found, an important front would be identifying the ideal interaction structures within design teams to prevent the problems encountered from occurring. Thus, an interesting research direction would be to determine the desirable interaction networks concerning the key issues identified. These “model networks” identify the ideal characteristics of a design team’s interactions, to avoid the occurrence of problems identified in this study. Therefore, an evaluation framework would be created to compare these ideal networks with actual interaction networks of the design teams, to evaluate the design teams’ interactions, and identify the possible deviations between the actual and desirable interactions, which would allow optimizing the performance of the design teams. Other limitation of this research study is the amount of samples collected. The Scopus and Web of Science databases were the only sources taken for the sample, not considering other search engines present in the research domain. Therefore, future studies related to this topic may include other sources and databases to have more consolidated information to achieve more comprehensive results. This study has a descriptive purpose and is limited to that; however, it is proposed as future work to address and analyze potential solutions to these problems and their root causes through the implementation of supplementary methodological strategies, such as Lean design, BIM, target value design, and agile project management, among others.
Author Contributions
Conceptualization, R.F.H. and E.I.G.-D.; methodology, R.F.H. and E.I.G.-D.; software, E.I.G.-D.; formal analysis, R.F.H. and E.I.G.-D.; writing—original draft preparation, R.F.H. and E.I.G.-D.; writing—review and editing, F.M.-L.R., E.A. and C.N.B.; visualization, F.M.-L.R.; supervision, R.F.H. and E.A.; funding acquisition, R.F.H. All authors have read and agreed to the published version of the manuscript.
Funding
This research was funded by Proyecto VRIEA-PUCV, grant number 039353. The last author would like to thank Coordenação de Aperfeiçoamento de Pessoal de Nível Superior (CAPES), Brazil, for the PNPD postdoctoral scholarship.
Institutional Review Board Statement
Not applicable.
Informed Consent Statement
Not applicable.
Acknowledgments
The authors wish to thank the TIMS space (Technology, Innovation, Management, and Innovation) of the School of Civil Engineering of the Pontificia Universidad Católica de Valparaíso (Chile) where the research was carried out.
Conflicts of Interest
The authors declare no conflict of interest.
References
- Esa, M.; Alias, A.; Samad, Z.A. Project managers’ cognitive style in decision making: A perspective from construction industry. Int. J. Psychol. Stud. 2014, 6, 65–73. [Google Scholar] [CrossRef]
- Moum, A. Design team stories: Exploring interdisciplinary use of 3D object models in practice. Autom. Constr. 2010, 19, 554–569. [Google Scholar] [CrossRef]
- Oviedo-Haito, R.J.; Jiménez, J.; Cardoso, F.F.; Pellicer, E. Survival factors for subcontractors in economic downturns. J. Constr. Eng. Manag. 2014, 140, 811. [Google Scholar] [CrossRef]
- Elmualim, A.; Gilder, J. BIM: Innovation in design management, influence and challenges of implementation. Archit. Eng. Des. Manag. 2014, 10, 183–199. [Google Scholar] [CrossRef]
- Dainty, A.R.J.; Briscoe, G.H.; Millett, S.J. Subcontractor perspectives on supply chain alliances. Constr. Manag. Econ. 2001, 19, 841–848. [Google Scholar] [CrossRef]
- Love, P.E.D.; Irani, Z.; Cheng, E.; Li, H. A model for supporting inter-organizational relations in the supply chain. Eng. Constr. Archit. Manag. 2002, 9, 2–15. [Google Scholar] [CrossRef]
- Ng, S.; Tang, Z. Labour-intensive construction sub-contractors: Their critical success factors. Int. J. Proj. Manag. 2010, 28, 732–740. [Google Scholar] [CrossRef]
- Herrera, R.F.; Mourgues, C.; Alarcón, L.F. Assessment of lean practices, performance and social networks in Chilean airport projects. In Proceedings of the 26th Annual Conference of the International Group for Lean Construction 2018 (IGLC 2018), Chennai, India, 16–22 July 2018; pp. 603–613. [Google Scholar]
- Baiden, B.K.; Price, A.D.F.; Dainty, A.R.J. The extent of team integration within construction projects. Int. J. Proj. Manag. 2006, 24, 13–23. [Google Scholar] [CrossRef]
- Ren, Z.; Anumba, C.J.; Yang, F. Development of CDPM matrix for the measurement of collaborative design performance in construction. Autom. Constr. 2013, 32, 14–23. [Google Scholar] [CrossRef]
- Herrera, R.F.; Mourgues, C.; Alarcón, L.F.; Pellicer, E. Understanding interactions between design team members of construction projects using social network analysis. J. Constr. Eng. Manag. 2020, 146, 04020053. [Google Scholar] [CrossRef]
- Schöttle, A.; Haghsheno, S.; Gehbauer, F. Defining cooperation and collaboration in the context of lean construction. In Proceedings of the 22nd Annual Conference of the International Group for Lean Construction, Oslo, Norway, 25–27 June 2014; pp. 1269–1280. [Google Scholar]
- Phelps, A.F. Behavioral factors influencing lean information flow in complex projects. In Proceedings of the 20th Conference of the International Group for Lean Construction, San Diego, CA, USA, 18–20 July 2012; p. 94117. [Google Scholar]
- Flores, J.; Ruiz, J.C.; Alarcón, D.; Alarcón, L.F.; Salvatierra, J.L.; Alarcón, I. Improving connectivity and information flow in lean organizations: Towards an evidencebased methodology. In Proceedings of the 22nd Annual Conference of the International Group for Lean Construction, Oslo, Norway, 25–27 June 2014; pp. 1109–1120. [Google Scholar]
- Oluwatayo, A.A.; Amole, D. Ownership, Structure, and Performance of Architectural Firms. Front. Archit. Res. 2013, 2, 94–106. [Google Scholar] [CrossRef][Green Version]
- The American Institute of Architects. Integrated Project Delivery: A Guide; The American Institute of Architects: Sacramento, CA, USA, 2007; Volume 1. [Google Scholar]
- Hickethier, G.; Tommelein, I.D.; Lostuvali, B. Social network analysis of information flow in an IPD-project design organization. In Proceedings of the 21st Annual Conference International Group for Lean Construction, Fortaleza, Brazil, 29 July–2 August 2013; Volume 1, pp. 315–324. [Google Scholar]
- Svalestuen, F.; Frøystad, K.; Drevland, F.; Ahmad, S.; Lohne, J.; Lædre, O. Key elements to an effective building design team. In Proceedings of the International Conference on Project Management, Vilamoura, Portugal, 7–9 October 2015; Elsevier Masson SAS: Sapporo, Japan, 2015; Volume 64, pp. 838–843. [Google Scholar]
- Al Hattab, M.; Hamzeh, F. Using social network theory and simulation to compare traditional versus BIM-lean practice for design error management. Autom. Constr. 2015, 52, 59–69. [Google Scholar] [CrossRef]
- Zou, P.X.W.; Sunindijo, R.Y.; Dainty, A.R.J. A mixed methods research design for bridging the gap between research and practice in construction safety. Saf. Sci. 2014, 70, 316–326. [Google Scholar] [CrossRef]
- Paré, G.; Trudel, M.-C.; Jaana, M.; Kitsiou, S. Synthesizing information systems knowledge: A typology of literature reviews. Inf. Manag. 2015, 52, 183–199. [Google Scholar] [CrossRef]
- Kosztyán, Z.T.; Csizmadia, T.; Katona, A.I. SIMILAR—Systematic iterative multilayer literature review method. J. Informetr. 2021, 15, 101111. [Google Scholar] [CrossRef]
- Johnson, R.B.; Onwuegbuzie, A.J. Mixed methods research: A research paradigm whose time has come. Educ. Res. 2004, 33, 14–26. [Google Scholar] [CrossRef]
- Harden, A.; Thomas, J. Mixed methods and systematic reviews: Examples and emerging issues. In SAGE Handbook of Mixed Methods in Social & Behavioral Research; SAGE Publications, Inc.: Thousand Oaks, CA, USA, 2010; pp. 749–774. [Google Scholar]
- Oraee, M.; Hosseini, M.R.; Papadonikolaki, E.; Palliyaguru, R.; Arashpour, M. Collaboration in BIM-based construction networks: A bibliometric-qualitative literature review. Int. J. Proj. Manag. 2017, 35, 1288–1301. [Google Scholar] [CrossRef]
- Cobo, M.J.; López-Herrera, A.G.; Herrera-Viedma, E.; Herrera, F. Science mapping software tools: Review, analysis, and cooperative study among tools. J. Am. Soc. Inf. Sci. Technol. 2011, 62, 1382–1402. [Google Scholar] [CrossRef]
- Van Eck, N.J.; Waltman, L. Software survey: VOSviewer, a computer program for bibliometric mapping. Scientometrics 2010, 84, 523–538. [Google Scholar] [CrossRef] [PubMed]
- Zou, X.; Yue, W.L.; Vu, H.L. Visualization and analysis of mapping knowledge domain of road safety studies. Accid. Anal. Prev. 2018, 118, 131–145. [Google Scholar] [CrossRef]
- Yin, X.; Liu, H.; Chen, Y.; Al-Hussein, M. Building information modelling for off-site construction: Review and future directions. Autom. Constr. 2019, 101, 72–91. [Google Scholar] [CrossRef]
- Santos, R.; Costa, A.A.; Grilo, A. Bibliometric analysis and review of Building Information Modelling literature published between 2005 and 2015. Autom. Constr. 2017, 80, 118–136. [Google Scholar] [CrossRef]
- Wang, H.; Pan, Y.; Luo, X. Integration of BIM and GIS in sustainable built environment: A review and bibliometric analysis. Autom. Constr. 2019, 103, 41–52. [Google Scholar] [CrossRef]
- Matarneh, S.T.; Danso-Amoako, M.; Al-Bizri, S.; Gaterell, M.; Matarneh, R. Building information modeling for facilities management: A literature review and future research directions. J. Build. Eng. 2019, 24. [Google Scholar] [CrossRef]
- Ganbat, T.; Chong, H.-Y.; Liao, P.-C.; Wu, Y.-D. A bibliometric review on risk management and building information modeling for international construction. Adv. Civ. Eng. 2018, 2018, 8351679. [Google Scholar] [CrossRef]
- Hosseini, M.R.; Maghrebi, M.; Akbarnezhad, A.; Martek, I.; Arashpour, M. Analysis of citation networks in building Information modeling research. J. Constr. Eng. Manag. 2018, 144, 04018064. [Google Scholar] [CrossRef]
- Hosseini, M.R.; Martek, I.; Zavadskas, E.K.; Aibinu, A.A.; Arashpour, M.; Chileshe, N. Critical evaluation of off-site construction research: A Scientometric analysis. Autom. Constr. 2018, 87, 235–247. [Google Scholar] [CrossRef]
- Van Eck, N.J.; Waltman, L. CitNetExplorer: A new software tool for analyzing and visualizing citation networks. J. Informetr. 2014, 8, 802–823. [Google Scholar] [CrossRef]
- Mongeon, P.; Paul-Hus, A. The journal coverage of Web of Science and Scopus: A comparative analysis. Scientometrics 2016, 106, 213–228. [Google Scholar] [CrossRef]
- Iowa State University Library Database Comparisons. Available online: https://instr.iastate.libguides.com/comparisons (accessed on 3 May 2021).
- Small, H. Tracking and predicting growth areas in science. Scientometrics 2006, 68, 595–610. [Google Scholar] [CrossRef]
- Small, H. Co-citation in the scientific literature: A new measure of the relationship between two documents. J. Am. Soc. Inf. Sci. 1973, 24, 265–269. [Google Scholar] [CrossRef]
- Gálvez, C. Visualizing research lines in public health: An analysis based on bibliometric maps applied to the Revista Española de Salud Pública (2006–2015). Rev. Esp. Salud Publica 2016, 90, e1–e10. [Google Scholar] [PubMed]
- Perianes-Rodriguez, A.; Waltman, L.; van Eck, N.J. Constructing bibliometric networks: A comparison between full and fractional counting. J. Informetr. 2016, 10, 1178–1195. [Google Scholar] [CrossRef]
- Galvez, C. Co-word analysis applied to highly cited papers in Library and Information Science (2007–2017). Transinformacao 2018, 30, 277–286. [Google Scholar] [CrossRef]
- Miguel, S.; Caprile, L.; Jorquera-Vidal, I. Co-term and social networks analysis for the generation of subject maps. Prof. Inf. 2008, 17, 637–646. [Google Scholar] [CrossRef]
- Bastian, M.; Heymann, S.; Jacomy, M. Gephi: An open source software for exploring and manipulating networks. BT—International AAAI Conference on Weblogs and Social. In Proceedings of the Third International AAAI Conference on Weblogs and Social Media, San Jose, CA, USA, 17–20 May 2009; pp. 361–362. [Google Scholar]
- Alarcón, D.M.; Alarcón, I.M.; Alarcón, L.F. Social network analysis: A diagnostic tool for information flow in the AEC industry. In Proceedings of the 21st Annual Conference of the International Group for Lean Construction, Fortaleza, Brazil, 31 July–2 August 2013; pp. 196–205. [Google Scholar]
- McKnight, W. Chapter twelve—Graph databases: When relationships are the data. In Information Management: Strategies for Gaining a Competitive Advantage with Data; McKnight, W.B.T.-I.M., Ed.; Morgan Kaufmann: Boston, MA, USA, 2014; pp. 120–131. ISBN 978-0-12-408056-0. [Google Scholar]
- Golbeck, J. Chapter 3—Network structure and measures. In Analyzing the Social Web; Golbeck, J.B.T.-A.S.W., Ed.; Morgan Kaufmann: Boston, MA, USA, 2013; pp. 25–44. ISBN 978-0-12-405531-5. [Google Scholar]
- Zanni, M.A.; Soetanto, R.; Ruikar, K. Towards a BIM-enabled sustainable building design process: Roles, responsibilities, and requirements. Archit. Eng. Des. Manag. 2017, 13, 101–129. [Google Scholar] [CrossRef]
- Al Hattab, M.; Hamzeh, F. Simulating the dynamics of social agents and information flows in BIM-based design. Autom. Constr. 2018, 92, 1–22. [Google Scholar] [CrossRef]
- Al Hattab, M.; Hamzeh, F. A process-social perspective for understanding design information flow. Lean Constr. J. 2017, 11, 1–11. [Google Scholar]
- Nikolić, D.; Maftei, L.; Whyte, J. Becoming familiar: How infrastructure engineers begin to use collaborative virtual reality in their interdisciplinary practice. J. Inf. Technol. Constr. 2019, 24, 489–508. [Google Scholar] [CrossRef]
- Lin, Y.C.; Chen, Y.P.; Yien, H.W.; Huang, C.Y.; Su, Y.C. Integrated BIM, game engine and VR technologies for healthcare design: A case study in cancer hospital. Adv. Eng. Inform. 2018, 36, 130–145. [Google Scholar] [CrossRef]
- Tutt, D.; Harty, C. Journeys through the CAVE: The use of 3D immersive environments for client engagement practices in hospital design. In Proceedings of the 29th Annual Conference Association of Researchers in Construction Management, Reading, UK, 2–4 September 2013; pp. 111–121. [Google Scholar]
- Ciribini, A.L.C.; Mastrolembo Ventura, S.; Paneroni, M. Implementation of an interoperable process to optimise design and construction phases of a residential building: A BIM Pilot Project. Autom. Constr. 2016, 71, 62–73. [Google Scholar] [CrossRef]
- Koolwijk, J.S.J.; van Oel, C.J.; Gaviria Moreno, J.C. No-blame culture and the effectiveness of project-based design teams in the construction industry: The mediating role of teamwork. J. Manag. Eng. 2020, 36, 04020033. [Google Scholar] [CrossRef]
- Cash, P.; Dekoninck, E.A.; Ahmed-Kristensen, S. Supporting the development of shared understanding in distributed design teams. J. Eng. Des. 2017, 28, 147–170. [Google Scholar] [CrossRef]
- Ding, Z.; Ng, F. Personal construct-based factors affecting interpersonal trust in a project design team. J. Constr. Eng. Manag. 2010, 136, 227–234. [Google Scholar] [CrossRef]
- Ibrahim, R.; Pour Rahimian, F. Comparison of CAD and manual sketching tools for teaching architectural design. Autom. Constr. 2010, 19, 978–987. [Google Scholar] [CrossRef]
- Jung, M.F. Coupling Interactions and Performance: Predicting Team performance from thin slices of conflict. ACM Trans. Comput. Hum. Interact. (TOCHI) 2016, 23, 1–32. [Google Scholar] [CrossRef]
- Casakin, H.; Badke-Schaub, P. Sharedness of team mental models in the course of design-related interaction between architects and clients. Des. Sci. 2017, 3, 1–21. [Google Scholar] [CrossRef]
- Tauriainen, M.; Marttinen, P.; Dave, B.; Koskela, L. The effects of BIM and lean construction on design management practices. Procedia Eng. 2016, 164, 567–574. [Google Scholar] [CrossRef]
- Tribelsky, E.; Sacks, R. The relationship between information flow and project success in multi-disciplinary civil engineering design. In Proceedings of the IGLC, Haifa, Israel, 14–16 July 2010; pp. 140–150. [Google Scholar]
- Reiter-Palmon, R.; Leone, S. Facilitating creativity in interdisciplinary design teams using cognitive processes: A review. Proc. Inst. Mech. Eng. Part C J. Mech. Eng. Sci. 2019, 233, 385–394. [Google Scholar] [CrossRef]
- Paletz, S.B.F.; Chan, J.; Schunn, C.D. The dynamics of micro-conflicts and uncertainty in successful and unsuccessful design teams. Des. Stud. 2017, 50, 39–69. [Google Scholar] [CrossRef]
- Guerra, A.L.; Gidel, T.; Kendira, A.; Vezzetti, E.; Jones, A. Co-evolution of design tactics and CSCWD systems: Methodological circulation and the TATIN-PIC platform. In Proceedings of the 19th International Conference on Engineering Design (ICED), Seoul, Korea, 19–22 August 2013; 2013; 9, pp. 315–324. [Google Scholar]
- Leon, M.; Laing, R. Towards a computer mediated methodology for collaborative design during the early architectural design stages. In Proceedings of the 2013 IEEE 17th International Conference on Computer Supported Cooperative Work in Design (CSCWD), Whistler, BC, Canada, 27–29 June 2013. [Google Scholar] [CrossRef]
- Uflacker, M.; Zeier, A. A semantic network approach to analyzing virtual team interactions in the early stages of conceptual design. Futur. Gener. Comput. Syst. 2011, 27, 88–99. [Google Scholar] [CrossRef]
- Dong, A.; Kleinsmann, M.S.; Deken, F. Investigating design cognition in the construction and enactment of team mental models. Des. Stud. 2013, 34, 1–33. [Google Scholar] [CrossRef]
- Collinge, W.H. Client requirement representations and transformations in construction project design. J. Eng. Des. Technol. 2017, 15, 222–241. [Google Scholar] [CrossRef]
- McComb, C.; Cagan, J.; Kotovsky, K. Optimizing design teams based on problem properties: Computational team simulations and an applied empirical test. J. Mech. Des. Trans. ASME 2017, 139, 041101. [Google Scholar] [CrossRef]
- Chen, H.M.; Hou, C.C. Asynchronous online collaboration in BIM generation using hybrid client-server and P2P network. Autom. Constr. 2014, 45, 72–85. [Google Scholar] [CrossRef]
- Sødal, A.H.; Lædre, O.; Svalestuen, F.; Lohne, J. Early Contractor Involvement: Advantages and Disadvantages for the Design Team. Master’s Thesis, Institutt for Bygg, Anlegg og Transport, Oslo, Norway, 2014; pp. 519–531. [Google Scholar]
- Kärnä, S.; Junnonen, J.M. Designers’ performance evaluation in construction projects. Eng. Constr. Archit. Manag. 2017, 24, 154–169. [Google Scholar] [CrossRef]
- Nawi, M.N.M.; Lee, A.; Kamar, K.A.M.; Hamid, Z.A. A critical literature review on the concept of team integration in industrialised building System (IBS) project. Malaysian Constr. Res. J. 2011, 9, 1–17. [Google Scholar]
- Luck, R. Articulating (mis)understanding across design discipline interfaces at a design team meeting. Artif. Intell. Eng. Des. Anal. Manuf. AIEDAM 2013, 27, 155–166. [Google Scholar] [CrossRef][Green Version]
- Chin, S.P.; Ngai, C.Y.K.; Ramanathan, M. Integrated team design process—Successful stories of Hong Kong MTR Corporation projects. Procedia Eng. 2011, 14, 1190–1196. [Google Scholar] [CrossRef][Green Version]
- Keating, E.; Jarvenpaa, S.L. Interspatial subjectivities: Engineering in virtual environments. Soc. Semiot. 2011, 21, 219–237. [Google Scholar] [CrossRef]
- Casakin, H.; Badke-Schaub, P. Measuring sharedness of mental models in architectural and engineering design teams. In Proceedings of the 19th International Conference on Engineering Design (ICED), Seoul, Korea, 19–22 August 2013; 7, pp. 169–178. [Google Scholar]
- Dave, B.; Kubler, S.; Främling, K.; Koskela, L. Addressing Information Flow in Lean Production Management and Control in Construction. In Proceedings of the 22nd Annual Conference of the International Group for Lean Construction, Oslo, Norway, 25–27 June 2014; pp. 581–592. [Google Scholar]
- Arayici, Y.; Coates, P.; Koskela, L.; Kagioglou, M.; Usher, C.; O’Reilly, K. Technology Adoption in the BIM Implementation for Lean Architectural Practice. Autom. Constr. 2011, 20, 189–195. [Google Scholar] [CrossRef]
- Fakhimi, A.H.; Majrouhi Sardroud, J.; Azhar, S. How can lean, IPD and BIM work together? In Proceedings of the 33rd International Symposium on Automation and Robotics in Construction, Auburn, AL, USA, 18–21 July 2016; pp. 1–8. [Google Scholar]
- Darko, A.; Chan, A.P.C.; Ameyaw, E.E.; He, B.-J.; Olanipekun, A.O. Examining issues influencing green building technologies adoption: The United States green building experts’ perspectives. Energy Build. 2017, 144, 320–332. [Google Scholar] [CrossRef]
- Darko, A.; Chan, A.P.C.; Yang, Y.; Shan, M.; He, B.-J.; Gou, Z. Influences of barriers, drivers, and promotion strategies on green building technologies adoption in developing countries: The Ghanaian case. J. Clean. Prod. 2018, 200, 687–703. [Google Scholar] [CrossRef]


Publisher’s Note: MDPI stays neutral with regard to jurisdictional claims in published maps and institutional affiliations. |
© 2021 by the authors. Licensee MDPI, Basel, Switzerland. This article is an open access article distributed under the terms and conditions of the Creative Commons Attribution (CC BY) license (https://creativecommons.org/licenses/by/4.0/).