Abstract
Indoor air quality and thermal conditions are important considerations when designing indoor spaces to ensure occupant health, satisfaction, and productivity. Carbon dioxide (CO2) concentration and indoor air temperature are two measurable parameters to assess air quality and thermal conditions within a space. Occupants are progressively affected by the indoor environment as the time spent indoors prolongs. Specifically, there is an interest in carrying out investigations on the indoor environment through surveying existing Heating, Ventilation, Air Conditioning (HVAC) system operations in classrooms. Indoor air temperature and CO2 concentration in multiple lecture halls in Toronto, Canada were monitored; observations consistently show high indoor air temperature (overheating) and high CO2 concentration. One classroom is chosen as a representative case study for this paper. The results verify a strong correlation between the number of occupants and the increase in air temperature and CO2 concentration. Building Energy Simulation (BES) is used to investigate the causes of discomfort in the classroom, and to identify methods for regulating the temperature and CO2 concentration. This paper proposes retro-commissioning strategies that could be implemented in institutional buildings; specifically, the increase of outdoor airflow rate and the addition of occupancy-based pre-active HVAC system control. The proposed retrofit cases reduce the measured overheating in the classrooms by 2-3 °C (indoor temperature should be below 23 °C) and maintain CO2 concentration under 900 ppm (the CO2 threshold is 1000 ppm), showing promising improvements to a classroom’s thermal condition and indoor air quality.
1. Introduction
In the design of the built environment, it is often a conventional practice to only consider the physical features of spaces whilst there are many other aspects largely influencing the indoor environmental quality (IEQ). For example, outdoor air ventilation rates are determined according to the conditioned area served by the Heating, Ventilation, Air Conditioning (HVAC) system and a default occupant density value defined according to building type [1]. This design method fails to take into account the effect of occupant density changing over time and their interaction with the immediate indoor environment. Therefore, researchers shift their focus to the adaptive design method, in which occupants are considered as integral parts of the whole comfort system of the building [2]. The number of occupants is modelled as a stochastic variable that can have an influence either by actively improving the thermal environment through occupant comfort control [2,3] or passively being the source causing discomfort in the space [4,5]. For example, an adult around 21–50 years old releases approximately 0.005 L/s [6] of carbon dioxide (CO2) as a by-product of bodily function and heat of 150 W through convection, radiation, vapour, and sweat [7]. Table 1 lists the various IEQ measurement thresholds in non-residential buildings. Through measuring CO2 concentration and indoor air temperature, this study aims to evaluate the contribution of high occupant density to undesirable indoor air quality and thermal conditions in a typical classroom.

Table 1.
Indoor environmental quality (IEQ) measurements.
Multiple research studies concern the IEQ and thermal comfort of educational buildings. CO2 is often used as one of the metrics for evaluating the IEQ since the presence of CO2 at its threshold level is often an indication of an area of indoor pollutant concerns with poor ventilation [13]. Asif et al. [14] conducted an assessment of IEQ in four university buildings and investigated on the impact of different HVAC systems on building IEQ. They concluded that IEQ is heavily dependent on the type of ventilation system used. CO2 levels were found to be highest in the university building utilizing non-centralized HVAC system. Krawczyk et al. [12] measured the CO2 concentrations in two school buildings located in different climate and developed a model for estimating the concentration level. The study noted that the CO2 concentration threshold is often exceeded within the first hour of occupancy. They suggested using air change rates of 2.5-5 to reduce the concentration. Zomorodian, Tahsildoost, and Hafezi [15] conducted a review on the thermal comfort in educational buildings and noted that most studies emphasize ventilation as a significant determining factor of IEQ and thermal comfort in classrooms. Ventilation demand increases with higher occupancy in classrooms [16]. University lecture halls are of particular interest for indoor air quality and thermal condition studies because students spend most of their time in lecture halls and energy savings are of importance to institutions [17]. This is also due to its occupancy pattern, usually with high occupant density that may dramatically vary throughout a day as students enter and leave the classroom in groups. If the HVAC system is not operated sufficiently, the heat and CO2 accumulated during one lecture session may adversely affect the students in the following lecture session [18]. Architects and engineers use the thermal environment condition standards of ASHRAE 55, European Committee for Standardization CEN 15251: Indoor Environmental Input Parameters for Design and Assessment of Energy Performance of Buildings, and International Organization for Standardization ISO-7730: Ergonomics of the Thermal Environment as reference documents in their designs, but largely ignored (knowingly or unknowingly) the impact of transient occupancy pattern to the IEQ of classrooms. Studies [18,19,20,21,22] have expressed the inappropriate application of current standards, which are based on office buildings with a steady number of occupants, to the classroom environment due to different occupancy schedules.
Seppänen, Fisk, and Lei [23] conducted 24 case studies and concluded that a 2% decrease in productivity is observed for a 1 °C increase in air temperature above 25 °C. Charzidiakou et al. [24] suggest that IEQ assessments be mandatory as part of building regulations due to the interrelationship between thermal condition, indoor pollutant levels, ventilation rates, and CO2 concentration. In their studies focusing on educational buildings, it is observed that keeping temperatures below 26 °C in summer and 22 °C in winter by outdoor air ventilation can limit the amount of Volatile Organic Compounds (VOC) below the threshold, above which sensory irritation is likely to occur. There is a correlation between high indoor air temperature and occupants’ productivity as noted by Singh, Ooka, and Rijal [18]. Indoor air temperature and CO2 concentration may be related because there is a higher likelihood of a space overheating above 25 °C when CO2 concentration are above 1500 ppm [24]. Persily and de Jonge [5] identify that CO2 accumulation in the space from occupants can cause indoor air quality concerns. CO2 is reported to affect students’ decision making and performance starting from 1000 ppm, and more significant effects when exposed to 2500 ppm [25]. CO2 concentration of 1000 ppm is the threshold of safety defined by relevant standards and design guidelines [1,5], due to studies showing a correlation between cognitive function scores and CO2 concentration [2]. Sick Building Syndrome (SBS), or the health effects caused by long term exposure to pollutants in the built environment, is prevalent in the presence of degraded indoor air quality [26]. The symptoms may include nasal congestion, dryness of eyes and skin, and headaches [27]. Norback et al. [28] conclude that indoor air temperature and CO2 concentration are important considerations in indoor environment assessments. CO2 concentration measurements are to be used to calculate accurate outdoor air ventilation rates.
The HVAC systems should be operated pre-actively in response to uncertain occupancy patterns anticipated in classrooms. Jaakkola et al. [27] relate SBS with inadequate mechanical ventilation rates as the primary cause. They identified that a reduction in ventilation rate caused a slight but significant increase in the occurrence of SBS symptoms. Due to the growing awareness of energy efficiency, research has been conducted over the past 25 years to investigate alternative HVAC controls for addressing the issues of internal heat gain without excessive energy consumption [11]. Kleiminger et al. [11] mentioned that occupancy prediction algorithms which control heating systems and temperature setpoint are effective in adjusting heating output throughout the day for the purpose of saving energy. The above-mentioned studies focus mainly on using ventilation as the strategy to remove excessive internal heat gain while lowering its corresponding energy consumption. CO2 concentration, as another source of discomfort in indoor environments with high variable occupancy, is discussed in studies targeting CO2 based ventilation control [29].
The above-mentioned literature shows that the IEQ in classrooms is an area of concern and prompted this study’s investigation on the indoor condition during lecture hours. This study investigates how to regulate both the CO2 concentration and indoor air temperature of classrooms via optimizing HVAC operation. The goal of this research is to evaluate the indoor environment of university lecture halls and propose mitigation strategies accordingly. Actual conditions are monitored, and a thermal sensation survey was done to identify and confirm the existing aspects of discomfort present in a classroom. The presence of discomfort as identified from on-site measurements and survey motivated further research. Specifically, strategies to optimally control the outdoor airflow rate and the heating output of the HVAC system will be proposed and evaluated using Building Energy Simulation (BES) to determine if the cause of discomfort is related to the inadequacy of the existing HVAC system. The main objective is to propose an optimal HVAC operation scheme to improve the indoor environment in classrooms.
2. Methodology
The typical method of collecting data on occupants’ activity level, clothing level, and thermal sensation rated on the ASHRAE standard 55 7-point scale is through the occupant questionnaire. This study uses on-site measurements and a questionnaire to grasp occupants’ perception of the thermal environment. In addition, BES is commonly used for research in thermal comfort because of the abundant building information stored in the models and the ability to predict indoor thermal conditions. This study uses BES to assess options for reducing indoor environment discomfort as identified from on-site measurements. Section 2.1 will describe the on-site measurement procedures. Commonly used software includes EnergyPlus and eQUEST [2]. A study by Boudier et al. [30] couples a thermal comfort model with BES. The thermal comfort model uses the calculated mean radiant and air temperature at each time step to estimate perceived sensation votes, which then allows logic in the indoor condition controller to correct the set-point temperature at the next time step. BES can be used for investigating classroom thermal conditions and optimizing HVAC control systems while considering energy consumption, as shown in both Wang et al. and Saleem et al.’s studies [31,32]. In the studies, it was proven that BES results were able to match on-site measurements with minor observed discrepancies. Section 2.2 describes the simulation methodology and model inputs. Section 2.3 presents the proposed HVAC operation alternatives.
2.1. On-Site Measurement Procedures
Nine large classrooms in Toronto, Canada, ranging from 90 to 200 occupant capacity, are measured for indoor air temperature and CO2 concentration. Results are consistent among the classrooms tested. One of the classrooms (which its occupancy capacity is the median among the nine classrooms tested) is selected as an example for discussion in this paper. A comparison of testing results is included in Table A1 of Appendix A. It is evident that the classroom selected for analysis has the highest maximum indoor air temperature, which is the main problem to be discussed in this paper. The classroom can hold a maximum occupancy of 160 people and is on the basement level of a 3300 sq. m building with a total of 5 stories. The testing spans from 9:00 am to 5:00 pm on a typical winter day with 4 classes taking place during those hours. Objective measures include a collection of data on indoor air temperature, relative humidity and CO2 concentration using a portable data logger (temperature accuracy ±0.2 °C, relative humidity accuracy ±2.5% from 10% to 90%) and a high precision IAQ instrument (accuracy of ±50 ppm CO2 ±2% of mv for a range of 0 to 5000 ppm CO2). The measurements are taken at nine locations around the perimeter of the classroom with one located in the center (refer to Figure A1 in Appendix A). The dataloggers are placed underneath tables at a height of 1.0-1.1 m and at 1 m away from the perimeter walls. It is understood that ASHRAE Standard 55 requires measurements at 0.1 m, 0.6 m, and 1.1 m. However, the disruption to students must be minimized for this testing. In such a case, the dataloggers are placed underneath the desks. The readings are at a 1-min interval for temperature and a 10-min interval for CO2. In addition, subjective measures are used to assess the occupant’s thermal perception through a questionnaire relating to activity level, clothing level, thermal comfort on a 7-point scale, and students’ satisfaction with the thermal condition (refer to Appendix B).
2.2. Simulation Methodology
A baseline model consisting of the classroom and its related building’s characteristics is created. Energy simulations are conducted with two commonly used simulation software in the industry; eQUEST and EnergyPlus. EnergyPlus is used in companion with its Graphical User Interface (GUI), DesignBuilder, to facilitate the input of building descriptions into the calculations. The use of two simulation software is justified by the purpose of increasing confidence in the simulated model of the classroom. It provides an insight into the difference between the two respective software in considering internal heat gains and the options available to model custom HVAC operations. A study by Hong [33] considered the advanced capabilities of EnergyPlus compared to eQUEST and found out that eQUEST’s limited feedback between HVAC and building loads calculations result in limited accuracy in zone temperatures. Therefore, this study aims to incorporate added value in comparing the two models against measured data for validation. Furthermore, this study focuses only on the heating season and the reported heating end-use energy is used to evaluate the efficiency of the HVAC system in providing the desired indoor temperature. Since zone level energy use is not directly obtainable from energy simulation results, the method used for determining zone energy consumption is as follows:
where:
- Ez (i) = Energy consumption of a zone (i) (kWh)
- n = Total number of zones in the building
- Qz (i)= Heating load of a zone (i) (kW)
- Eb = Energy consumption of the building (kWh)
Simulation Model Description-Baseline Case
Inputs and assumptions in the simulations are summarized in Table 2 for EnergyPlus and eQUEST models. Note that the building is simplified in the models (refer to Figure 1 and Figure 2 for the building model visualization) as it is only concerned with the classroom in particular, treating the rest of the building as an adjacent zone. The weather data used for both simulations is the Canadian Weather for Energy Calculations (CWEC) 2016 Typical Meteorological Year (TMY) weather file for Toronto, ON International Airport [34]. Lecture schedules provided by the university are used as occupancy inputs. The classroom is conditioned by an Air Handling Unit (AHU). The system is a full air system and distributes conditioned air through air ducts with Variable Air Volume (VAV) terminals to each classroom. Considering the measured condition in the actual classroom and referencing Ontario Building Code (OBC) 6.2.1.2. for the design of indoor air temperatures [35], the heating setpoint temperature is defined as 21.2 °C.
Table 2.
Inputs to EnergyPlus and eQUEST Models.
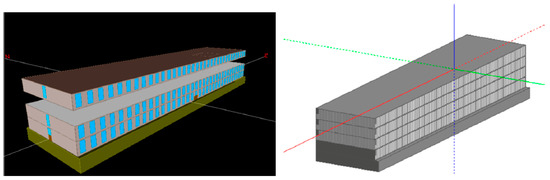
Figure 1.
Geometric Visualization of the monitored building from eQUEST and DesignBuilder interfaces.
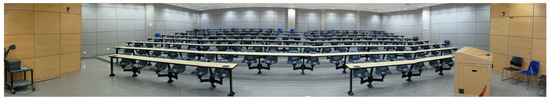
Figure 2.
A view of the monitored classroom.
2.3. Proposed HVAC Operation Alternatives
Recent trends in improving existing buildings include retro-commissioning, where the focus is not on the equipment or additional technologies that can be used, but rather first considering the most efficient way to operate the HVAC systems [36]. Since the classroom considered in this study does not have windows, natural ventilation is not available. A study by Gao et al. [37] monitored the indoor climate of classrooms using a variety of ventilation methods including manually operable windows, automatically operable windows with or without exhaust fan, and balanced mechanical ventilation. The case with mechanical ventilation was favourable and performed better than naturally ventilated cases since it had a lower temperature still within thermal comfort range and a CO2 level not exceeding 1000 ppm. A series of HVAC operation strategies considering higher outdoor airflow rate and pre-active controls using occupancy schedules described as follows have been implemented in the simulation as revised cases to regulate indoor air temperature and CO2 concentration.
2.3.1. Optimum Outdoor Air Flow Rate
Equation (2) models the relationship between CO2 concentration and the outdoor airflow rate. It is based on the balance of CO2 from occupant respiration offset by air infiltration and mechanical ventilation, considering the assumption that the CO2 concentration is fully mixed in the classroom when students are seated in a uniform pattern. Occupancy is modelled based on the schedule pertaining to the day of on-site testing. The model calculates the CO2 concentration in the classroom based on infiltration Air Change per Hour (ACH), outdoor ACH, occupancy schedule, and the volume of the space. The calculated concentration is then compared to measured data to validate the model. The CO2 concentration is regulated in revised case 1 with the optimized air change rate given by:
where:
- V = Total volume of conditioned room (m3)The volume of the classroom is 800 m3
- c = Concentration of carbon dioxide in indoor air (ppm)
- 106 = Conversion unit for concentration measured in ppm
- Nppl = Number of occupantsThe number of occupants is a variable according to occupancy schedule
- μ = Constant representing CO2 concentration from respiration per person (m3/min)The estimated concentration is 0.36581 × 10⁻⁴ m3/min
- ACHvent+infil = Air change rate per hour from outdoor air ventilation and infiltration (#/hour)The estimated ACH for infiltration is 1.1/hour referenced from United States Army Corps of Engineers (USACE) Standard for Air Leakage [38]The ACH for outdoor air ventilation is a variable
- Co = Concentration of CO2 in the outdoor air (ppm)Average concentration in Toronto is 300ppm, referenced from ASHRAE Standard 62.1-2016 [9]
- 3600 = A constant, seconds in an hour
By increasing the value of the outdoor air change rate while keeping other variables as constant, the model estimated CO2 concentration to be under 1000 ppm when using a 2.5 ACH. The rate is used in BES to correlate the decrease of CO2 with a decrease in temperature. It is changed as a variable in the simulation to confirm the appropriate rate needed in the classroom to both lower temperature and CO2 concentration. The use of 0.5 ACH in the model resulted in the CO2 level similar to the measured data, thus validating the accuracy of the model. Therefore, it is estimated that mechanical ventilation is at 0.5 ACH in the existing classroom. This model indicates that the optimized air change rate is 2.5 ACH or above.
2.3.2. Occupancy-Based Pre-Active HVAC Control
Erickson et al. [31] noticed that most buildings are conditioned without predicting the actual number of occupants in the space to start corresponding adjustments to the HVAC system and have noted that occupancy prediction is useful for mitigating this issue. Several studies [11,39,40] investigated smart heating systems and HVAC control strategies that can adjust set-point temperature using occupancy prediction algorithms. In existing buildings, delayed action on the HVAC operation corresponding to the occupancy in the zone often leads to unnecessary over-conditioning and extra energy consumption. Dong et al. [41] and Rafsanjani et al. [42] consider the role occupancy plays in HVAC controls to minimize energy consumption. HVAC control based on occupancy patterns is often managed by Model Predictive Control (MPC) [11]. Dong et al. [41] claim that a 20% reduction in energy consumption can be achieved using proper MPC. The MPC used in Swaminathan et al.’s [40] study consists of an integrated control structure to track changing occupancy patterns. It also features a pre-cooling action that is implemented prior to occupancy increase. For example, outdoor airflow is drawn into the space half an hour before the room fills up with more people [40].
The proposed solution in this current study aims to reduce heating system output when the occupancy is expected to rise, similar to the concept of MPC as introduced before. Table 3 summarizes the modifications made in the revised cases to simulate proposed control on the heating and ventilation system based on occupancy. In revised case 1 done by CO2 model (refer to Section 2.3.1), only the outdoor airflow rate was altered. Revised case 2 done by BES includes both increased outdoor airflow rate and occupancy-based heating availability schedule. Occupancy schedules (refer to Appendix C) and HVAC control were coupled in simulation by setting a heating availability schedule for the heating system to adjust the ratio of heating output into the zone based on expected occupant load. The objective of this study is to determine if the proposed adjustments made to HVAC operation can improve the IEQ of a classroom.
Table 3.
Summary of Changed Variables Between Baseline Case and Revised Case.
3. Results
First, the on-site measurements are presented to show the current thermal condition and indoor air quality of the classroom in Section 3.1. Section 3.2 presents the BES model validation for both EnergyPlus and eQUEST to confirm that the model is calibrated for further investigation. Section 3.3 and Section 3.4 presents the results from the proposed HVAC operation schemes for reducing CO2 and indoor temperature. By using these proposed strategies, the IEQ significantly improved in the aspects of preventing overheating. Lastly, Section 3.5 shows the Energy Use Intensity (EUI) resulted from using the proposed strategies.
3.1. Thermal Condition and Indoor Air Quality in the Classroom
Measurements confirm that the temperature increases throughout the day as more lectures take place. There is a strong correlation between the number of occupants and temperature increase, as well as CO2 concentration (Figure 3 and Figure 4). The indoor air temperature on a typical winter day reached up to 25 °C. The mechanical system was not activated because the measured temperature near the thermostat was higher than the upper limit of the setpoint dead band. The measured air velocity in the room did not exceed 0.2 m/s. In addition, the surveys showed that students expressed more satisfaction with the classroom’s thermal condition when fewer occupants are present in the room. According to the thermal sensation survey, only marginally 80% of people ranked their thermal sensation to be within the acceptable thermal sensation range (−1 to +1) (refer to Appendix B). The occupant’s comfort level is being compromised. The on-site measurements inferred a hypothesis that the reason for the high temperature and rising carbon dioxide concentration may be due to the lack of outdoor air ventilation in the space since heat and CO2 accumulates in a high amount over the duration of the day. BES is therefore needed to investigate possible causes and solutions to the problems identified from on-site measurements.
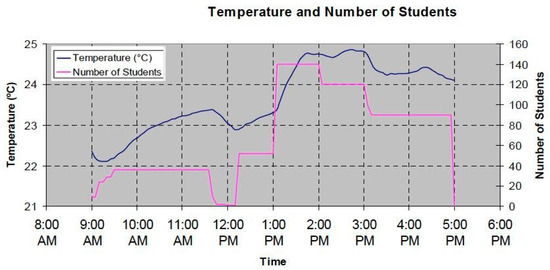
Figure 3.
Measured temperature increase due to the addition of occupants in the classroom.
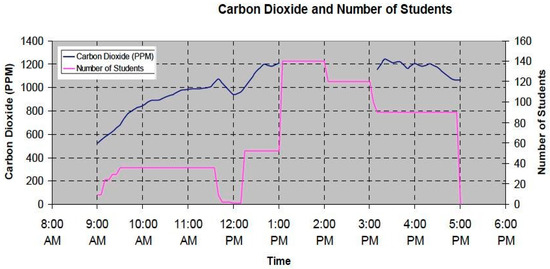
Figure 4.
Increase in carbon dioxide due to the addition of occupants in the classroom.
3.2. Validation of Baseline Case
Similar to the measured data, the simulation predicted daily winter temperatures to be around the range of 18 to 25 °C, thus causing undesirable indoor thermal conditions due to overheating (refer to Figure 5 and Figure 6). The shoulder seasons exhibit cases of overheating when the exterior temperature is increasing, due to the switchover between heating and cooling. The heating season is of interest in this study because Toronto has a semi-continental climate and is heating-dominated. Both eQUEST and EnergyPlus results show the fluctuation of temperature around the set-point in the classroom throughout the occupied hours and varying throughout the week depending on changes in occupant density. EnergyPlus results show that the temperature starts at 18 °C when unoccupied and rises to set point of 21 °C when occupied, then gradually increases to around 23 °C to 25 °C as the day goes on and the room fills with more occupants, before lastly returning back to 18 °C when unoccupied over the night. The peak air temperature noted is usually at the hours when the occupancy is the highest. Since indoor air temperature and CO2 concentration continuously increase, this indicates that there may be insufficient outdoor air ventilation while the HVAC system is supplying heating output more than needed. As observed in Figure 7, both EnergyPlus and eQUEST models created in this study have predicted the trend of indoor air temperature fluctuations similar to the observed measured data.
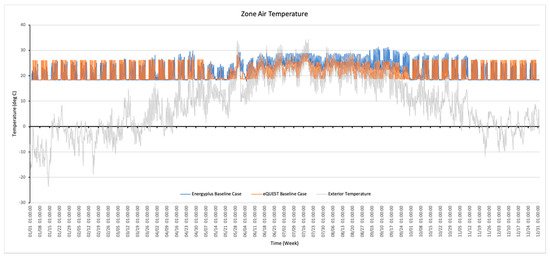
Figure 5.
Simulated annual temperature profile from eQUEST and EnergyPlus showing overheating.
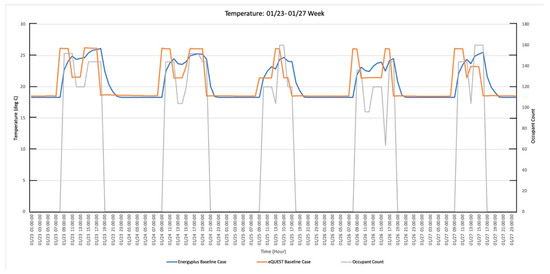
Figure 6.
Temperature throughout a week, referencing occupants count.
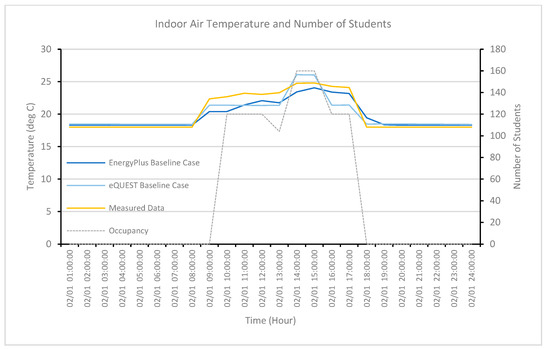
Figure 7.
Simulated indoor air temperature compared to the measured data during occupied hours, referencing occupants count.
Two statistical indices, Root Mean Squared Error (RMSE) and Coefficient of Variation of RMSE (CVRMSE) are used to evaluate the simulation models, as follows:
where:
- i = 1: EnergyPlus result at timestep j, i=2: eQUEST result at timestep j (°C)
- j = Timestep (seconds)
- n = Total number of timesteps
- ta_m (j) = Measured indoor air temperature (°C)
- ta_s (i, j) = Simulated indoor air temperature for instance i (°C)
- Mavg = Average of the measured indoor air temperature, (°C)
The CVRMSE of the simulated and measured data in this study is closer to the lower value of the standards’ range (refer to Table 4). Standards such as ASHRAE Guideline 14, International Performance Measurement and Verification Protocol (IPMVP), and Federal Energy Management Program (FEMP) indicate the acceptable accuracy range to be between 5-20%, with 0% being the perfect case [43]. RMSE and CVRMSE are negatively oriented scores. The simulated results tend to underestimate the temperature most of the time. This implies that the simulations are under-predicting the impact of occupancy density and other internal gain factors on the increase in indoor air temperature. However, at times of highest occupancy during the day, eQUEST results predicted a higher temperature than the actual measured data (refer to Figure 7).
Table 4.
Error Indices Calculated to Evaluate the Predicted Model against Measured Values.
Robert et al.’s paper [44] which also evaluates simulation models, is used as a reference for benchmarking the error values. RSME is used as a validation index because it is more sensitive to deviations than other indices such as Mean Absolute Error (MAE), and is used when larger errors are undesirable. CVRMSE is considered in Hong et al.’s paper [43] as a metric for reliability analysis between hourly baseline models and existing buildings. CVRMSE is an indication of how well the simulation matches the variation in measured values [45]. CVRMSE is used in addition to RMSE for normalizing by the mean value of measured data to avoid ambiguity. The work by Rallapalli [46] has noted a difference between eQUEST, EnergyPlus, and actual measured data. However, Rallapalli did not discuss in detail the comparison between measured and simulated results. Moreover, there are more literature on comparing simulated energy consumption to empirical data than for indoor air temperature. Studies that compare measured indoor temperature with simulations notice that there is a temperature difference of 1 °C and is mostly during the daytime where occupancy and solar radiation are the affecting factors [17,47].
3.3. Revised Case 1-Reduction in CO2 Concentration
In Figure 8, the baseline model (in blue) which used 0.5 ACH has a comparable pattern with the measured data (in yellow). As a revised case, the airflow rate is increased to 2.5 ACH (refer to Section 2.3.1), which resulted in CO2 concentration below 1000 ppm, which is the acceptable level according to ASHRAE Standard 62.1-2016 [9] (refer to Figure 8). The growth in concentration due to increased occupancy is at a slower rate than the baseline case. Based on this result showing 2.5 ACH as the optimal air change rate which can lower CO2 concentration, it is recommended that the classroom should be operated with such an increased air flow rate.
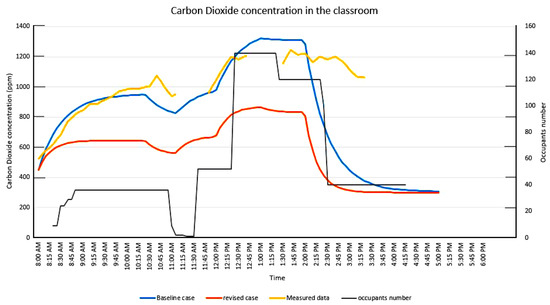
Figure 8.
Carbon dioxide concentration compared between measured and simulated model. Note that the measured data is segments due to the disruption of the equipment; however, the concentration increase can still be observed.
3.4. Revised Case 2-Reduction in Hourly Indoor Air Temperature to Minimize Overheating
Thermal modelling confirms that the airflow rate used in revised case 1 is effective in reducing the indoor air temperature. The indoor air temperature overheated to around 24–26 °C in the baseline cases, while the revised case controlled the temperature under 23 °C. Figure 9 and Figure 10 show the temperature in January. At times when the exterior temperature is relatively high, the indoor air temperature for the revised case is 23 °C, which is close to the set-point temperature of 21 °C and, thus, would not be considered overheating (refer to Figure 11 and Figure 12). This is due to increasing the ventilation airflow rate to 2.5 ACH and using an occupancy schedule for controlling heating.
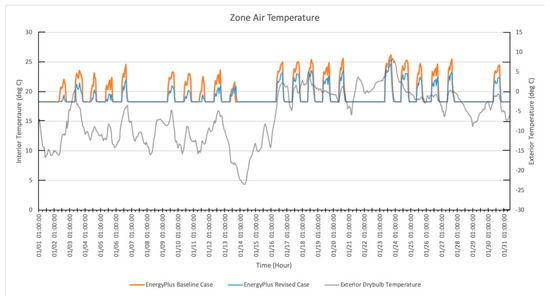
Figure 9.
EnergyPlus temperature results in January with baseline case (red) and revised case 2 (blue) showing a reduction in temperature when outdoor airflow rate is increased.
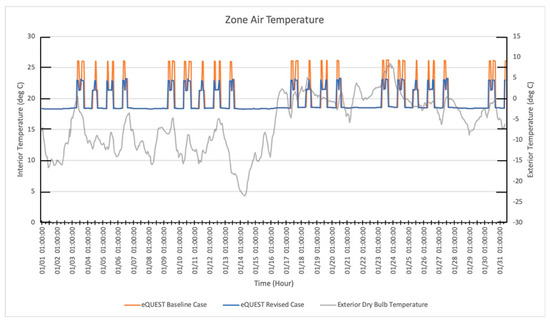
Figure 10.
eQUEST temperature results in January with baseline case (red) and revised case 2 (blue), showing a reduction in indoor air temperature when outdoor air flow rate is increased.
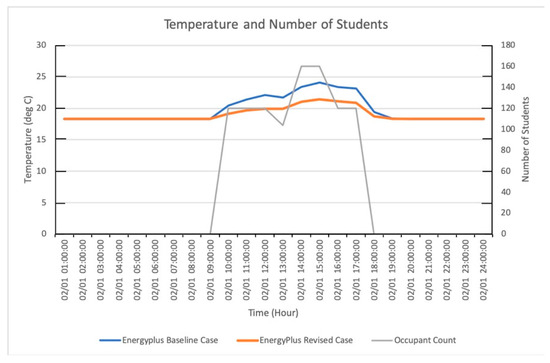
Figure 11.
EnergyPlus temperature results of a day, showing a reduction in indoor air temperature.
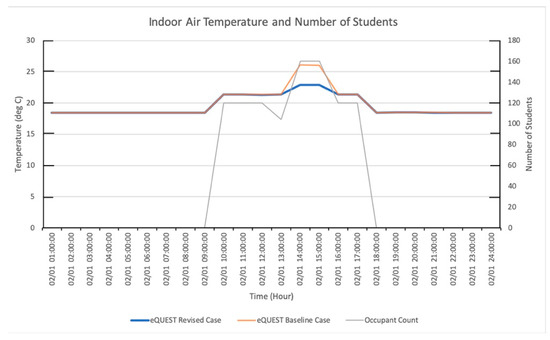
Figure 12.
eQUEST temperature results of a day, showing a reduction in indoor air temperature.
3.5. Energy Consumption
Since the objective is to mitigate wintertime overheating, only heating energy consumption will be reported in the following. Heating energy forms a large part of a building’s total energy consumption. Natural Resources Canada reported that within the energy end-use breakdown of commercial and institutional buildings, 48% are accounted for from space heating, while only 5% are from space cooling [48]. The Energy Use Intensity (EUI), reported in Table 5 and Table 6, shows the impact that the mitigation strategies have on the energy consumption of each model. The reduction of heating energy input into space reduces energy consumption, but this reduction is not sufficient to offset the added energy from operating mechanical ventilation. However, the consumption from mechanical ventilation does not result in a large increase in total consumption. Note that the eQUEST results are consistently higher than the EnergyPlus results, which is in agreement with Rallapalli’s study [46]. The difference is more noticeable in the zonal energy use due to the variation in the ratio between zone and the sum of all zones’ heating load (refer to Section 2.2). Since indoor air temperature simulated by each model is not exactly the same, there will also be evident contrast in the reported energy consumption. Measured data is also unavailable for each zone because the university does not use submetering for their facilities. The main finding from simulating energy consumption is to confirm that the increase in airflow rate would not result in a large addition of energy use.
Table 5.
Building Level Energy Use Intensity of Revised Cases from EnergyPlus and eQUEST (all figures in kWh/m2·year).
Table 6.
Zonal Energy Use Intensity of Revised Cases from EnergyPlus and eQUEST (all figures in kWh/m2·year).
The energy consumption including ventilation and heating in a day with occupied lecture hours in mid-day and non-occupied at other hours shows the efficacy of the proposed strategies. Figure 13 shows that the energy consumption from the baseline case (red datapoints) is increased during expected beginning of school hours (8:00). The energy consumption is high even when there are no occupants, and does not decrease in anticipation of upcoming high occupancy load. The decrease of energy demand responses to the increase in temperature starting at 13:00 when a lecture takes place. On the other hand, the Revised Case 2 with proposed strategies (blue datapoints) that take into consideration occupancy predictions steadily cumulates throughout the day except for the hours with increased occupancy where a higher energy consumption is due to increased mechanical ventilation. The cumulative energy consumption for baseline is 174 kWh while it is 186 kWh for the revised case. The increase in energy consumption is not drastically higher nor at a disadvantage, given that the IEQ and thermal condition are improved.
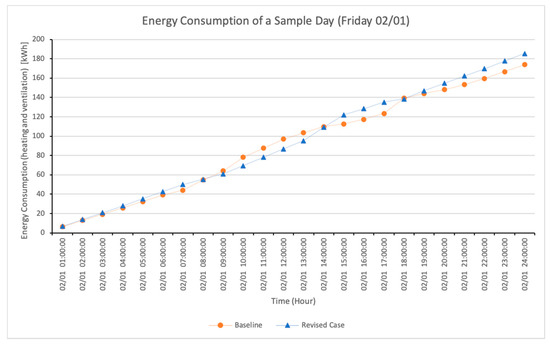
Figure 13.
Cumulative Energy Consumption (Mechanical Ventilation and Heating inclusive) of a day, comparison between baseline and revised case.
4. Discussion
The on-site measurements confirmed that the classroom is overheated in the wintertime and CO2 concentration is accumulating with the increase in occupancy density. In addition, the questionnaire confirms that students are not satisfied with the classroom comfort level. It is evident that occupancy is a major heat and CO2 source while the space does not have adequate methods of dissipating such heat and contaminants.
Simulation identified efficient HVAC operation to be dependent on outdoor airflow rate and quantity of heating output determined by schedules. It provided an insight into the importance of occupancy in BES and HVAC operation. Table 7 and Table 8 summarizes the main results of the revised cases, showing reduced CO2 concentration and the indoor air temperature remained closer to the intended indoor air temperature set-point during the heating season. The previously measured CO2 concentration is exceeding the ASHRAE standard of 1000 ppm as the acceptable range for indoor air. Therefore, university lecture classrooms should include systems for increased outdoor air ventilation such as the use of a heat recovery ventilator (HRV) or an energy-recovery ventilator (ERV).
Table 7.
Reduction in Carbon Dioxide Concentration.
Table 8.
Elimination of Overheating.
This research shows that occupant satisfaction is jeopardized when the HVAC system is not adjusting its operation until the occupant behaviour causes a disturbance on indoor air temperature, which is in agreement with Leaman and Bordass’s findings [3]. Similarly, it is evident through the results of this current research that the constant change in occupancy density throughout the day causes high air temperature and unsatisfactory indoor air quality within the space. Increasing outdoor air ventilation and scheduling the heating availability dynamically according to occupancy density is therefore proven in this study as effective solutions to stabilize the indoor air temperature and CO2 concentration. It aligns with the values of research related to Model Predictive Control [41] and supports the development in set-point temperature algorithms tuned with the estimation of upcoming occupancy load.
5. Conclusions and Future Works
The assessment conducted in this study raises the concern of high indoor air temperature and CO2 concentration within university lecture classrooms. The assumption of static occupancy, as adopted in thermal comfort standards such as ASHRAE 55, is not sufficient for classrooms. It is evident that existing HVAC operation strategies must be improved, and the interventions proposed above have been effective in properly controlling indoor air temperature and CO2 concentration. The key changes to HVAC operation are identified as increasing outdoor air ventilation and controlling the system according to dynamic occupancy density. If institutional buildings adopt these interventions, the benefit would be improved thermal condition and indoor air quality. It will be a stride towards improving students’ productivity and satisfaction towards their learning environment.
Ongoing research includes updating measurements of air temperature in various classrooms over a longer period of time and considering more thermal comfort parameters. Measured data from a winter school term will help calibrate the model (baseline case) more accurately, as well as provide more occupancy data over a longer period of time throughout the year. Furthermore, only the wintertime overheating effect has been analyzed in this study, while summertime subcooling may also be an issue present in the classrooms. In addition to hourly indoor air temperature and CO2 concentration comparison between measured and simulated data, other parameters to assess thermal comfort such as relative humidity and mean radiant temperature may also be compared using BES, similar to what has been done in Ahmad et al. and Chenari et al.’s research [49,50]. Chenari et al. [50] simulated occupancy and CO2 based demand-controlled mechanical ventilation strategies using EnergyPlus to explore and arrive at a conclusion regarding the impact that schedule and ventilation strategies have on energy consumption and indoor air quality. In this way, there can be more insight into optimal ventilation strategies that controls a wider range of indoor air quality and thermal condition parameters.
Moreover, note that the current HVAC operation changes implemented in EnergyPlus and eQUEST are theoretical and are to be tested in actual practice to determine its validity in influencing the indoor environment. Changing the heating schedules based on occupancy is a variable that is changed within energy simulation, but the actual implementation of these strategies to the classroom is not within this research’s current scope. By observing the positive effects that resulted from these variations, it indicates a possibility of improving HVAC operational strategies in similar ways, but with practical and tangible methods such as through the use of sensors. This study has demonstrated that BES can identify overheating and high CO2 concentration to develop possible solutions. However, an overarching practical issue that most energy modelers face is the time and effort required to collect adequate data and develop reliable energy models. Detailed energy modelling using building simulation programs requires many inputs, and modelers may not have full knowledge of each input’s relative importance to simulation outcomes, level of uncertainty, and the appropriate default values to use. This issue is exacerbated when actual or realistic data (i.e., occupancy, operational schedules, infiltration) are not available while the use of typical input values or assumptions is not appropriate for the application [51]. In the future, BES will provide unprecedented value in assisting the design and operation of low energy buildings that address occupancy comfort. It is hopeful that more HVAC operation schemes can be tested for effectiveness in improving the thermal condition and indoor air quality through building simulation, which in turn can provide better living and working spaces for occupants.
Author Contributions
C.T.: Conceptualization, Data Curation, Formal Analysis, Investigation, Methodology, Software, Visualization, Writing-original draft, Writing- review and editing. Y.Z.: Conceptualization, Data Curation, Formal Analysis, Investigation, Methodology, Software, Visualization, Writing—original draft, Writing—review and editing. Z.L.: Conceptualization, Formal Analysis, Funding Acquisition, Methodology, Project Administration, Resources, Supervision, Writing- review and editing. L.Z.: Project Administration, Supervision, Validation, Writing—review & editing. All authors have read and agreed to the published version of the manuscript.
Funding
This research is partially funded by Natural Sciences and Engineering Research Council of Canada, Discovery Grant (NSERC DG (RGPIN-2016-04176)).
Acknowledgments
The preparation of this paper is partly supported by the Building Science Graduate Program at Ryerson University, Canada.
Conflicts of Interest
The authors declare no conflict of interest.
Abbreviations
| Acronym | Description |
| CO2 | Carbon Dioxide |
| IEQ | Indoor Environmental Quality |
| HVAC | Heating, Ventilation, Air Conditioning |
| SBS | Sick Building Syndrome |
| BES | Building Energy Simulation |
| GUI | Graphical User Interface |
| AHU | Air Handling Unit |
| VAV | Variable Air Volume |
| CAV | Constant Air Volume |
| FCU | Fan Coil Unit |
| COP | Coefficient of Performance |
| ACH | Air Change per Hour |
| MPC | Model Predictive Control |
| RMSE | Root Mean Squared Error |
| CV RMSE | Coefficient of Variance of Root Mean Squared Error |
| MAE | Mean Absolute Error |
| EUI | Energy Use Intensity |
| HRV | Heat Recovery Ventilator |
| ERV | Energy Recovery Ventilator |
Appendix A. On-Site Measurement Procedures and Comparison
Table A1.
Measurements Result of the Classrooms Tested.
Table A1.
Measurements Result of the Classrooms Tested.
| RBB 2119 | ARC 108 | ENG LG14 | VIC 105 | RBB 2147 | ENG 106 | KHE 221 | RCC 204 | RBB 2166 | |
|---|---|---|---|---|---|---|---|---|---|
| Date of Testing | Jan.25 | Jan.29 | Jan.30 | Jan.31 | Feb.01 | Feb.04 | Feb.05 | Feb.13 | Feb.15 |
| No. of Hours Tested | 8 | 9 | 8 | 6 | 6 | 5 | 7 | 7 | 8 |
| Capacity | 90 | 170 | 160 | 120 | 135 | 90 | 120 | 20 | 200 |
| Mechanical system | VAV | CAV | VAV | CAV | VAV | VAV | VAV | VAV | VAV |
| Indoor Temperature (°C) | |||||||||
| Average | 23.5 | 23.6 | 23.7 | 21.5 | 23.1 | 22.9 | 23.7 | 22.4 | 23.2 |
| Maximum | 24.3 | 24.5 | 24.9 | 23.9 | 23.8 | 23.8 | 24.4 | 23.2 | 23.9 |
| Minimum | 22.7 | 21.8 | 22.1 | 20.6 | 22.5 | 21.7 | 21.6 | 21.4 | 22.3 |
| Average Exterior Temperature (°C) | −6.5 | 6.3 | −6.9 | −5.9 | −0.9 | 2.5 | 6 | −5.2 | −4.7 |
| Thermostat Set point Temperature (°C) | |||||||||
| Heating | 21.2 | 21.7 | 22 | 22 | 21.2 | 21.2 | 22 | 22 | 21.2 |
| cooling | 23.5 | 24 | 23.5 | 23.5 | 23.5 | ||||
| Relative Humidity (%) | |||||||||
| Average | 21 | 39 | 23 | 16 | 24 | 35 | 33 | 16 | 26 |
| Maximum | 16 | 42 | 27 | 31 | 28 | 39 | 39 | 20 | 28 |
| Minimum | 18 | 36 | 18 | 15 | 22 | 34 | 28 | 15 | 24 |
| Average air velocity (m/s) | 0.14 | 0.18 | 0.09 | 0.11 | 0.16 | 0.11 | 0.09 | 0.1 | 0.11 |
| Carbon Dioxide (ppm) | |||||||||
| Average | 584 | 1306 | 1005 | 933 | 566 | 791 | 1015 | 858 | 623 |
| Maximum | 699 | 1813 | 1244 | 1327 | 668 | 1097 | 1264 | 1245 | 764 |
| Minimum | 420 | 520 | 525 | 528 | 437 | 485 | 555 | 406 | 479 |
| Thermal Sensation Ranges | |||||||||
| −5 | 9% | 8% | 1% | 28% | 2% | 10% | 7%% | 8% | 9% |
| 0.09 | 68% | 72% | 80% | 63% | 73% | 80% | 81%% | 76% | 74% |
| 2,3 | 23% | 20% | 19% | 9% | 25% | 10% | 12% | 16% | 17% |
| Satisfaction with Thermal Condition | |||||||||
| Satisfied | 91% | 55% | 88% | 58% | 92% | 81% | 69% | 80% | 82% |
| Dissatisfied | 9% | 45% | 12% | 42% | 8% | 19% | 31% | 20% | 18% |
| Satisfaction with Indoor Air Quality | |||||||||
| Satisfied | 85% | 48% | 81% | 64% | 83% | 80% | 60% | 73% | 78% |
| Dissatisfied | 15% | 52% | 19% | 36% | 17% | 20% | 40% | 27% | 22% |
| Average clo value | 0.95 | 0.87 | 0.88 | 0.87 | 0,93 | 0.89 | 0.79 | 0.91 | 0.88 |

Figure A1.
Plan Showing Dataloggers Placement Distribution Across the Classroom.
Figure A1.
Plan Showing Dataloggers Placement Distribution Across the Classroom.

Appendix B. Questionnaire Results

Figure A2.
Thermal Sensation Survey Results. Note that CPS 590, AER 423, and CPS 393 are lecture course codes respectively.
Figure A2.
Thermal Sensation Survey Results. Note that CPS 590, AER 423, and CPS 393 are lecture course codes respectively.


Figure A3.
Thermal Satisfaction Survey Results.
Figure A3.
Thermal Satisfaction Survey Results.


Figure A4.
Air Quality Satisfaction Survey Results.
Figure A4.
Air Quality Satisfaction Survey Results.

Appendix C. Classroom Lecture Schedules and Occupancy Pattern Input to Simulation

Figure A5.
Weekly Lecture Schedule and Expected Occupant Numbers in the Classroom.
Figure A5.
Weekly Lecture Schedule and Expected Occupant Numbers in the Classroom.


Figure A6.
Monday Occupancy Pattern (input to BES).
Figure A6.
Monday Occupancy Pattern (input to BES).


Figure A7.
Tuesday Occupancy Pattern (input to BES).
Figure A7.
Tuesday Occupancy Pattern (input to BES).


Figure A8.
Wednesday Occupancy Pattern (input to BES).
Figure A8.
Wednesday Occupancy Pattern (input to BES).


Figure A9.
Thursday Occupancy Pattern (input to BES).
Figure A9.
Thursday Occupancy Pattern (input to BES).


Figure A10.
Friday Occupancy Pattern (input to BES).
Figure A10.
Friday Occupancy Pattern (input to BES).

References
- ANSI/ASHRAE Addendum f to ANSI/ASHRAE Standard 62.1-2016. 2016. Available online: https://www.ashrae.org/File%20Library/Technical%20Resources/Standards%20and%20Guidelines/Standards%20Addenda/62.1-2016/62_1_2016_f_20180914.pdf (accessed on 7 July 2020).
- de Dear, R.J.; Akimoto, T.; Arens, E.A.; Brager, G.; Candido, C.; Cheong, K.W.D.; Li, B.; Nishihara, N.; Sekhar, S.C.; Tanabe, S.; et al. Progress in thermal comfort research over the last twenty years. Indoor Air 2013, 23, 442–461. [Google Scholar] [CrossRef] [PubMed]
- Leaman, A.; Bordass, B. Productivity in buildings: The ‘killer’ variables. Build. Res. Inf. 1999, 27, 4–19. [Google Scholar] [CrossRef]
- Mudarri, D.H. Potential correction factors for interpreting CO2 measurements in buildings. ASHRAE Trans. 1997, 103, 244. [Google Scholar]
- Persily, A.; de Jonge, L. Carbon dioxide generation rates for building occupants. Indoor Air 2017, 27, 868–879. [Google Scholar] [CrossRef] [PubMed]
- Rodero, A.; Krawczyk, D.A. Method for estimation of CO2 gains from persons in buildings. Proceedings 2018, 2, 1309. [Google Scholar] [CrossRef]
- Ahmed, K.; Kurnitski, J.; Olesen, B. Data for occupancy internal heat gain calculation in main building categories. Data Br. 2017, 15, 1030–1034. [Google Scholar] [CrossRef]
- Canada Health and Welfare. Exposure Guideline for Non-Residential Indoor Air Quality. 1987. Available online: https://www.toalltech.com/wp-content/themes/alltech/images/air_quality.pdf (accessed on 7 July 2020).
- ASHRAE. ANSI/ASHRAE Standard 62.1-2019 Ventilation for Acceptable Indoor Air Quality; American Society of Heating, Refrigerating, and Air-Conditioning Engineers, Inc.: Atlanta, GA, USA, 2019. [Google Scholar]
- ASHRAE. ASHRAE/ANSI Standard 55-2017 Thermal Environmental Conditions for Human Occupancy; American Society of Heating, Refrigerating, and Air-Conditioning Engineers: Atlanta, GA, USA, 2017. [Google Scholar]
- Kleiminger, W.; Santini, S.; Mattern, F. Smart heating control with occupancy prediction: How much can one save? In Proceedings of the 2014 ACM International Joint Conference on Pervasive and Ubiquitous Computing, Adjunct Publication, WA, USA, 13 September 2014; pp. 947–954. [Google Scholar]
- Krawczyk, D.A.; Rodero, A.; Gładyszewska-Fiedoruk, K.; Gajewski, A. CO2 concentration in naturally ventilated classrooms located in different climates—Measurements and simulations. Energy Build. 2016, 129, 491–498. [Google Scholar] [CrossRef]
- de Abreu-Harbich, L.V.; Chaves, V.L.A.; Brandstetter, M.C.G.O. Evaluation of strategies that improve the thermal comfort and energy saving of a classroom of an institutional building in a tropical climate. Build. Environ. 2018, 135, 257–268. [Google Scholar] [CrossRef]
- Asif, A.; Zeeshan, M.; Jahanzaib, M. Indoor temperature, relative humidity and CO2 levels assessment in academic buildings with different heating, ventilation and air-conditioning systems. Build. Environ. 2018, 133, 83–90. [Google Scholar] [CrossRef]
- Zomorodian, Z.S.; Tahsildoost, M.; Hafezi, M. Thermal comfort in educational buildings: A review article. Renew. Sustain. Energy Rev. 2016, 59, 895–906. [Google Scholar] [CrossRef]
- Theodosiou, T.G.; Ordoumpozanis, K.T. Energy, comfort and indoor air quality in nursery and elementary school buildings in the cold climatic zone of Greece. Energy Build. 2008, 40, 2207–2214. [Google Scholar] [CrossRef]
- Allab, Y.; Pellegrino, M.; Guo, X.; Nefzaoui, E.; Kindinis, A. Energy and comfort assessment in educational building: Case study in a French university campus. Energy Build. 2017, 143, 202–219. [Google Scholar] [CrossRef]
- Singh, M.K.; Ooka, R.; Rijal, H.B. Thermal comfort in Classrooms: A critical review. In Proceedings of the 10th Windsor Conference 2018—Rethinking Comfort, Windsor, UK, 12–15 April 2018; Cumberland Lodge: Windsor, UK, 2018; pp. 649–668. [Google Scholar]
- Cao, B.; Zhu, Y.; Ouyang, Q.; Zhou, X.; Huang, L. Field study of human thermal comfort and thermal adaptability during the summer and winter in Beijing. Energy Build. 2011, 43, 1051–1056. [Google Scholar] [CrossRef]
- Wang, Z.; Li, A.; Ren, J.; He, Y. Thermal adaptation and thermal environment in university classrooms and offices in Harbin. Energy Build. 2014, 77, 192–196. [Google Scholar] [CrossRef]
- Cheng, M.J.; Hwang, R.L.; Lin, T.P. Field experiments on thermal comfort requirements for campus dormitories in Taiwan. Indoor Built Environ. 2008, 17, 191–202. [Google Scholar] [CrossRef]
- Wang, Z.; Ning, H.; Zhang, X.; Ji, Y. Human thermal adaptation based on university students in China’s severe cold area. Sci. Technol. Built Environ. 2017, 23, 413–420. [Google Scholar] [CrossRef]
- Seppänen, O.; Fisk, W.; Lei, Q. Effect of Temperature on Task Performance in Office Environment; Ernest Orlando Lawrence Berkeley National Laboratory: Berkeley, CA, USA, 2006; p. 11. [Google Scholar]
- Chatzidiakou, L.; Mumovic, D.; Summerfield, A. Is CO2 a good proxy for indoor air quality in classrooms? Part 1: The interrelationships between thermal conditions, CO2 levels, ventilation rates and selected indoor pollutants. Build. Serv. Eng. Res. Technol. 2015, 36, 129–161. [Google Scholar] [CrossRef]
- Satish, U.; Mendell, M.J.; Shekhar, K.; Hotchi, T.; Sullivan, D.; Streufert, S.; Fisk, W.J. Is CO2 an indoor pollutant? direct effects of low-to-moderate CO2 concentrations on human decision-making performance. Environ. Health Perspect. 2012, 120, 1671–1677. [Google Scholar] [CrossRef]
- Dorizas, P.V.; Assimakopoulos, M.; Santamouris, M.; Sifnaios, J.; Stathi, K. Does indoor environmental quality affect students performance? In Proceedings of the 34th AIVC-3rd TightVent-2nd Cool Roofs’-1st Venticool Conference, Athens, Greece, 25–26 September 2013. [Google Scholar]
- Jaakkola, J.J.K.; Heinonen, O.P.; Seppanen, O. Mechanical ventilation in office buildings and the sick building syndrome: An experimental and epidemiological study. Indoor Air 1991, 1, 111–121. [Google Scholar] [CrossRef]
- Norback, D.; Michel, I.; Widstrom, J. Indoor air quality and personal factors related to the sick building syndrome. Scand. J. Work Environ. Health 1990, 16, 121–128. [Google Scholar] [CrossRef] [PubMed]
- Schibuola, L.; Scarpa, M.; Tambani, C. CO2 based ventilation control in energy retrofit: An experimental assessment. Energy 2018, 143, 606–614. [Google Scholar] [CrossRef]
- Boudier, K.; Fiorentini, M.; Hoffmann, S.; Kalyanam, R.; Kokogiannakis, G. Coupling a Thermal Comfort Model with Building Simulation for User Comfort and Energy Efficiency. In CESBP Central European Symposium on Building Physics/BauSIM; University of Wollongong: Wollongong, Australia, 2016. [Google Scholar]
- Wang, Y.; Kuckelkorn, J.; Zhao, F.Y.; Liu, D.; Kirschbaum, A.; Zhang, J.L. Evaluation on classroom thermal comfort and energy performance of passive school building by optimizing HVAC control systems. Build. Environ. 2015, 89, 86–106. [Google Scholar] [CrossRef]
- Saleem, A.A.; Abel-Rahman, A.K.; Ali, A.H.H.; Ookawara, S. An analysis of thermal comfort and energy consumption within public primary schools in Egypt. IAFOR J. Sustain. Energy Environ. 2016, 3. [Google Scholar] [CrossRef]
- Hong, T. EnergyPlus Analysis Capabilities for Use in California Building Energy Efficiency Standards Development and Compliance Calculations; 822E; Lawrence Berkeley National Lab (LBNL): Berkeley, CA, USA, 2009; pp. 1–30. [Google Scholar]
- U.S. Department of Energy’s (DOE) Building Technologies Office. Weather Data by Location- EnergyPlus. Available online: https://energyplus.net/weather-location/north_and_central_america_wmo_region_4/CAN/ON/CAN_ON_Toronto.716240_CWEC (accessed on 4 November 2019).
- The Ontario Building Code Design Indoor Air Temperatures. Available online: http://www.buildingcode.online/816.html (accessed on 5 November 2019).
- Matutinovic, L. Using calibrated energy models to help understand, manage and improve existing building energy performance. ESIM 2014 Biannu. Conf. IBPSA-Canada Proc. 2014. Available online: http://www.ibpsa.org/proceedings/eSimPapers/2014/8A.3.pdf (accessed on 7 July 2020).
- Gao, J.; Wargocki, P.; Wang, Y. Indoor air quality and thermal environment in classrooms with different ventilation systems. REHVA J. 2014, 51, 10–14. [Google Scholar]
- USACE CECW Pamphlet-Construction Quality Assurance Representative’s Guide Volume 6: Building Envelopes Foreword; Department of the Army Corps of Engineers: Washington, DC, USA, 2016. Available online: https://www.publications.usace.army.mil/Portals/76/Publications/EngineerPamphlets/EP_415-1-261%20Vol-06.pdf?ver=2016-05-19-145012-860 (accessed on 7 July 2020).
- Erickson, V.L.; Carreira-Perpiñán, M.Á.; Cerpa, A.E. Occupancy-based system for efficient reduction of HVAC energy. In Proceedings of the 10th International Conference on Information Processing in Sensor Networks, IPSN’11, Chicago, IL, USA, 12–14 April 2011; pp. 258–269. [Google Scholar]
- Swaminathan, S.; Wang, X.; Zhou, B.; Baldi, S. A university building test case for occupancy-based building automation. Energies 2018, 11, 3145. [Google Scholar] [CrossRef]
- Dong, J.; Winstead, C.; Nutaro, J.; Kuruganti, T. Occupancy-based HVAC control with short-term occupancy prediction algorithms for energy-efficient buildings. Energies 2018, 11, 2427. [Google Scholar] [CrossRef]
- Rafsanjani, H.N.; Ahn, C.R.; Alahmad, M. A review of approaches for sensing, understanding, and improving occupancy-related energy-use behaviors in commercial buildings. Energies 2015, 8, 10996–11029. [Google Scholar] [CrossRef]
- Hong, T.; Kim, C.J.; Jeong, J.; Kim, J.; Koo, C.; Jeong, K.; Lee, M. Framework for approaching the minimum CV(RMSE) using energy simulation and optimization tool. Energy Procedia 2016, 88, 265–270. [Google Scholar] [CrossRef]
- Roberts, B.M.; Allinson, D.; Diamond, S.; Abel, B.; Bhaumik, C.D.; Khatami, N.; Lomas, K.J. Predictions of summertime overheating: Comparison of dynamic thermal models and measurements in synthetically occupied test houses. Build. Serv. Eng. Res. Technol. 2019, 40, 512–552. [Google Scholar] [CrossRef]
- Reddy, D. Use of Energy and Other Monitored Data to Calibrate a Whole Building Energy Model. Doctoral Dissertation, University of Washington, Seattle, WA, USA, 2013. [Google Scholar]
- Rallapalli, H.S. A Comparison of Energyplus and eQUEST Whole Building Energy Simulation Results for a Medium Sized Office Building. Doctoral Dissertation, Arizona State University, Tempe, AZ, USA, 2010. [Google Scholar]
- Zerroug, A.; Eglis, D. Analysis of results of energy consumption simulation With Equest and Energyplus. In Proceedings of the International Conference Civil Engineering. 2011, pp. 102–107. Available online: https://llufb.llu.lv/conference/Civil_engineering/2015/Latvia_CivilEngineering2015Vol5-102-107.pdf (accessed on 7 July 2020).
- Natural Resources Canada (NRCAN). Survey 2000, Commercial and Institutional Building Energy Use—Summary Report. August 2003. Available online: https://oee.nrcan.gc.ca/publications/statistics/scieu/2009/pdf/SCIEU2009Establishments.pdf (accessed on 7 July 2020).
- Ahmad, M.W.; Hippolyte, J.; Reynolds, J.; Mourshed, M.; Rezgui, Y. Optimal scheduling strategy for enhancing IAQ, thermal comfort and visual using a genetic algorithm. In Proceedings of the ASHRAE IAQ 2016, Alexandria, VA, USA, 12–14 September 2016. [Google Scholar]
- Chenari, B.; Lamas, F.B.; Gaspar, A.R.; da Silva, M.G. Simulation of occupancy and CO2-based demand-controlled mechanical ventilation strategies in an office room using EnergyPlus. Energy Procedia 2017, 113, 51–57. [Google Scholar] [CrossRef]
- Hong, T.; Langevin, J.; Sun, K. Building simulation: Ten challenges. Build. Simul. 2018, 11, 871–898. [Google Scholar] [CrossRef]


© 2020 by the authors. Licensee MDPI, Basel, Switzerland. This article is an open access article distributed under the terms and conditions of the Creative Commons Attribution (CC BY) license (http://creativecommons.org/licenses/by/4.0/).