Distribution of Concentrated Loads in Timber-Concrete Composite Floors: Simplified Approach


Abstract
:1. Introduction
2. Parametric Study
- The support conditions, with a maximum deviation of 75% between BS (Ss) and BS with Sae);
- The degree of oversizing, with a maximum deviation of 66% (Ov), 58% (Un) and 56% (EC5), considering the limit spans 2.00 m and 16.00 m;
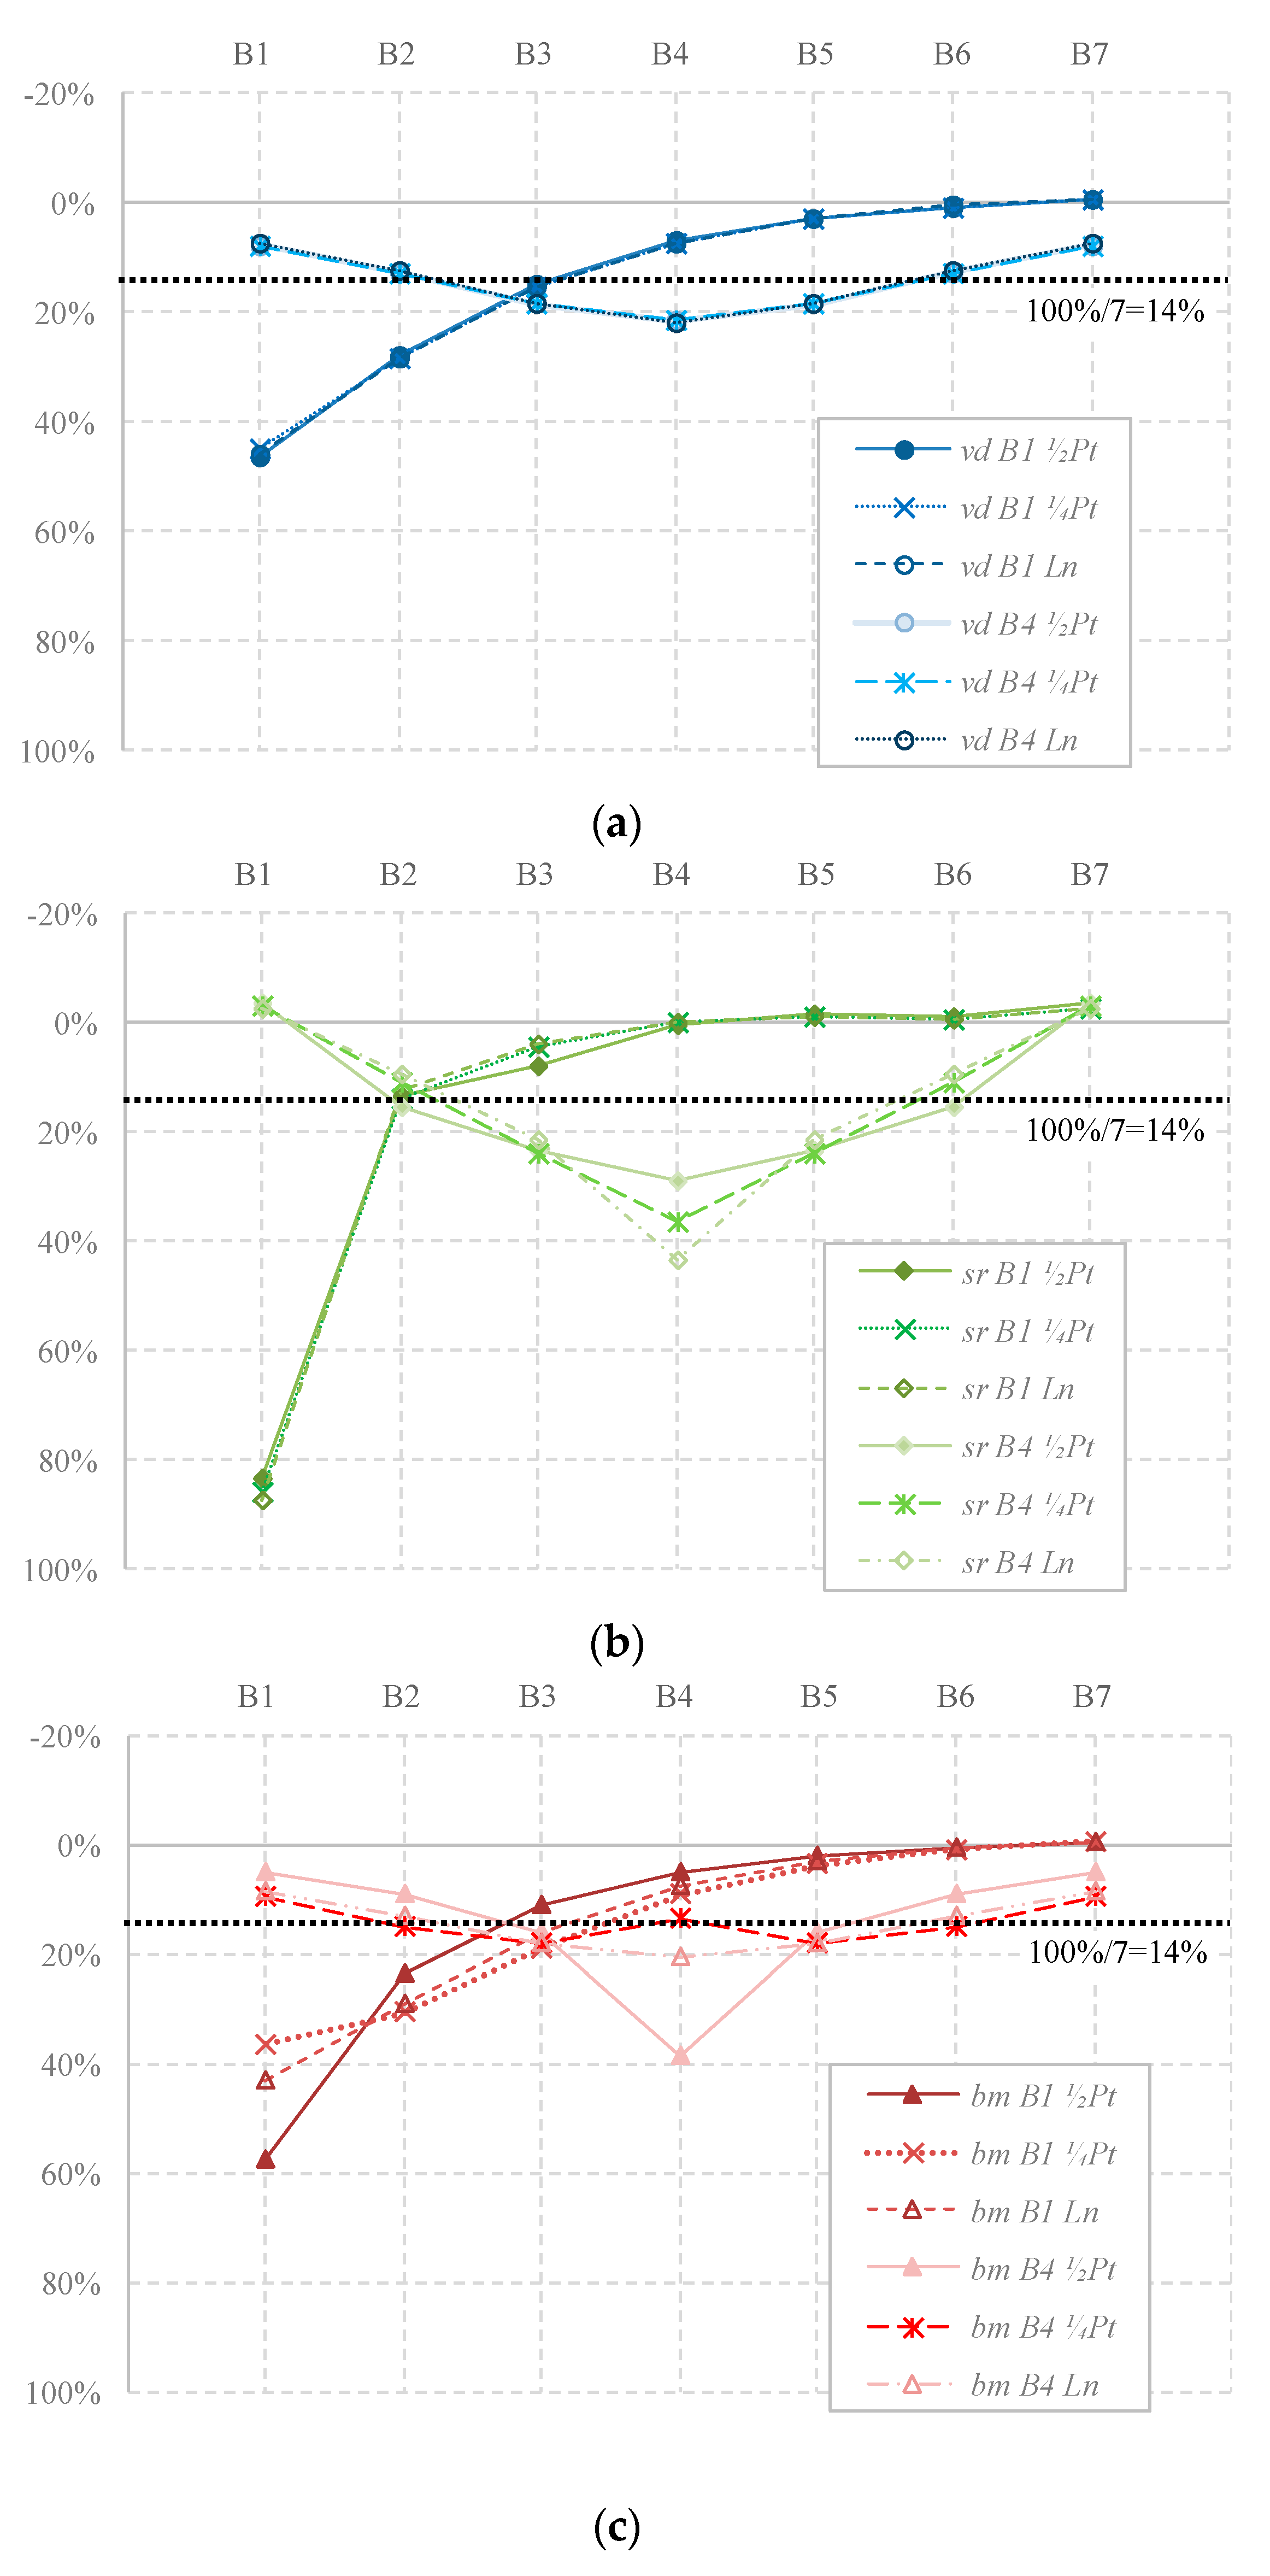
- The loading position, with a maximum deviation of 58% considering the loading applied at B1 vs. applied at B4 when the modeling BS with lK connection is considered (reaching 60% when in association with DO—verified for the modeling task with the same cross-section as BS and L = 16.00 m (underestimated timber section));
- The span length, with a maximum deviation of 47% between spans of 2.00 m and 16.00 m;
- The concrete thickness, with a maximum deviation of 45% between thicknesses of 0.02 m and 0.20 m;
- The existence of a timber deck underneath the concrete layer, instead of timber beams and interlayer using juxtaposed beams or a CLT deck, with a maximum deviation of 27%; and
- The concrete strength, with a maximum deviation of 18% between an LWAC LC16/18 and an NWAC C40/50.
3. Simplified Approach
4. Conclusions
Author Contributions
Funding
Acknowledgments
Conflicts of Interest
Abbreviation
| bm | is the longitudinal bending moment at mid-span |
| BS | is the Base Simulation |
| bslab | is the width of the slab |
| CLT | is the Cross Laminated Timber |
| cfi | is the extra coefficient to obtain a better approximation with i = {vd, sr, bm} |
| EPP | is the elastic-perfectly plastic behavior |
| Fx | is the fixed support condition |
| GL | is the Glued Laminated Timber, Glulam |
| hc | is the concrete thickness |
| hi | is the interlayer thickness |
| hK | is the high stiffness |
| ht | is the height of the timber beam |
| I | is the I-shape cross-section |
| L | is the span |
| LE | is the linear elastic behavior |
| lK | is the low stiffness |
| Ln | is the line load |
| LVL | is the Laminated Veneer Lumber |
| LWAC | is the lightweight aggregate concrete |
| mK | is the medium stiffness |
| NWAC | is the normal strength concrete |
| Ov | is the overestimated sizing section |
| Pr | designation of the simplified approach |
| Pt | is the point load |
| R | is the correlation coefficient |
| Sae | is the simply supported condition in all ends |
| sb | is the beam spacing |
| Sc | is the support condition |
| sr | is the support reaction |
| Ss | is the simply supported condition |
| sw | is the self-weight |
| Un | is the underestimated sizing section |
| vd | is the vertical displacement at mid-span |
| is the average of the values to approximate | |
| zi | is the value obtained by the polynomial fit for the i point, location, |
| Zi | is the value to approximate for the i point, location. |
| ▯ | is the rectangular shape cross-section |
| ◯ | is the round shape cross-section |
References
- Emperger, F. Der Holzbeton. Dinglers Polytech. J. 1920, 335, 109–112. [Google Scholar]
- Dias, A.; Skinner, J.; Crews, K.; Tannert, T. Timber-concrete-composites increasing the use of timber in construction. Eur. J. Wood Wood Prod. 2016, 74, 443–451. [Google Scholar] [CrossRef]
- Van Der Linden, M. Timber Concrete Composite Floor Systems. Ph.D. Thesis, University of Delft, Delft, The Netherlands, December 1999. Available online: https://repository.tudelft.nl/islandora/object/uuid:6b2807c2-258b-45b0-bb83-31c7c3d8b6cd?collection=research (accessed on 12 June 2019).
- Jorge, L.; Lopes, S.; Cruz, H. Interlayer Influence on Timber-LWAC Composite Structures with Screw Connections. J. Struct. Eng. 2011, 137, 618–624. [Google Scholar] [CrossRef]
- Yeoh, D. Behaviour and Design of Timber-Concrete Composite Floor System. Ph.D. Thesis, University of Canterbury, Christchurch, New Zealand, 2010. Available online: https://ir.canterbury.ac.nz/handle/10092/4428 (accessed on 12 June 2019).
- Lukaszewska, E. Development of Prefabricated Timber-Concrete Composite Floors; Luleå University of Technology: Luleå, Sweden, 2009. [Google Scholar]
- Wacker, J.; Dias, A.; Hosteng, T. Investigation of Early Timber-Concrete-Composite Bridges in the USA. In Proceedings of the 3rd International Conference on Timber Bridges, Skellefteå, Sweden, 26–29 June 2017. [Google Scholar]
- Zhu, W.; Yang, H.; Liu, W.; Shi, B.; Ling, Z.; Tao, H. Experimental investigation on innovative connections for timber–concrete composite systems. Constr. Build. Mater. 2019, 207, 345–356. [Google Scholar] [CrossRef]
- Yeoh, D.; Fragiacomo, M.; De Franceschi, M.; Heng Boon, K. State of the Art on Timber-Concrete Composite Structures: Literature Review. J. Struct. Eng. 2011, 137, 1085–1095. [Google Scholar] [CrossRef]
- Branco, J.M.; Descamps, T.; Tsakanika, E. Repair and Strengthening of Traditional Timber Roof and Floor Structures. In Strengthening and Retrofitting of Existing Structures; Costa, A., Arêde, A., Varum, H., Eds.; Springer: Singapore, 2018; pp. 113–138. [Google Scholar]
- Croatto, G.; Turrini, U. Restoration of historical timber structures—Criteria, innovative solutions and case studies. In Proceedings of the Intervir em Construções Existentes de Madeira, Guimarães, Portugal, 5 June 2014; Lourenço, B.P., Sousa, J.B.M.H.S., Eds.; Universidade do Minho: Braga, Portugal, 2014; pp. 119–136. [Google Scholar]
- Projetos, Miguel Guedes Arquitetos, Lda. Available online: http://www.miguelguedes.pt/pt/projetos/ver/palacio-do-raio-centro-interpretativo-de-memorias-da-misericordia/ (accessed on 12 June 2019).
- Vencedores, 2016, Reabilitação do Palácio do Raio, in Prémio Nacional de Reabilitação Urbana. Available online: https://premio.vidaimobiliaria.com/ (accessed on 12 June 2019).
- Dias, A.; Fragiacomo, M.; Gramatikov, K.; Kreis, B.; Kupferle, F.; Monteiro, S.; Sandanus, J.; Schänzlin, J.; Schober, K.; Sebastian, W.; et al. Design of Timber-Concrete Composite Structures. A State-of-the-Art Report by COST Action FP1402/WG 4; Dias, A., Schänzlin, J., Dietsch, P., Eds.; Verlag: Aachen, Germany, 2018. [Google Scholar] [CrossRef]
- EU. Eurocode 5: Design of Timber Structures—Part. 1–1: General—Common Rules and Rules for Buildings; EN1995-1-1; European Committee for Standardization: Brussels, Belgium, 2004. [Google Scholar]
- Monteiro, S.; Dias, A.; Lopes, S. Transverse distribution of internal forces in timber–concrete floors under external point and line loads. Constr. Build. Mater. 2016, 102, 1049–1059. [Google Scholar] [CrossRef]
- Monteiro, S.; Dias, A.; Lopes, S. New guidelines for design of timber-concrete systems for point and line loads. In Proceedings of the WCTE 2016—World Conference on Timber Engineering, Vienna, Austria, 22–25 August 2016. [Google Scholar]
- Dias, A.; Monteiro, S.; Martins, C. Reinforcement of timber floors—Transversal load distribution on timber-concrete systems. Adv. Mater. Res. 2013, 778, 657–664. [Google Scholar] [CrossRef]
- Kieslich, H.; Holschemacher, K. Investigations on load sharing effects in timber-concrete composite constructions. In Proceedings of the 9th International Conference on Structural Analysis of Historical Constructions (SAHC 2014), Mexico City, Mexico, 14–17 October 2014; Peña, F., Chávez, M., Eds.; 2014. Available online: https://www.semanticscholar.org/paper/INVESTIGATIONS-ON-LOAD-SHARING-EFFECTS-IN-COMPOSITE-KieslichHolschemacher/ffe798847d3b910f0f9266072092c4a7b3b7752a (accessed on 12 June 2019).
- Kieslick, H.; Holschemacher, K. Transversal load sharing in timber-concrete floors—Experimental and numerical investigations. In Proceedings of the 14 World Conference on Timber Engineering, Vienna, Austria, 22–25 August 2016. [Google Scholar]
- Mudie, J.; Sebastian, W.M.; Norman, J.; Bond, I.P. Experimental study of moment sharing in multi-joist timber-concrete composite floors from zero load up to failure. Constr. Build. Mater. 2019, 225, 956–971. [Google Scholar] [CrossRef]
- Antunes, S. Distribuição Transversal de Cargas em Lajes Mistas Madeira-Betão, Estudo da Influência da Secção Transversal. Master’s Thesis, University of Coimbra, Coimbra, Portugal, 2019. [Google Scholar]
- Monteiro, S.; Dias, A.; Lopes, S. Transverse distribution of concentrated loads in timber-concrete floors—Parametric study. Proc. Inst. Civil Eng. Struct. Build. in press. [CrossRef]
- EU. Eurocode 2: Design of Concrete Structures—Part. 1–1: General—Common Rules and Rules for Buildings; EN1992-1-1; CEN: Brussels, Belgium, 2004. [Google Scholar]
- EU. Structural Timber; EN338; European Committee for Standardization: Brussels, Belgium, 2003. [Google Scholar]
- EU. Eurocode 1: Actions on Structures—Part. 1–1: General Actions—Densities, Self-Weight, Imposed Loads for Buildings; EN1991-1-1; European Committee for Standardization: Brussels, Belgium, 2001. [Google Scholar]
- Monteiro, S. Load Distribution on Timber-Concrete Composite Floors. Ph.D. Thesis, University of Coimbra, Coimbra, Portugal, 2015. [Google Scholar]


| Type | Parameter | Symbol | ||
|---|---|---|---|---|
| Geometrical | Slab | Span | L | |
| Width | bslab | |||
| Beam spacing | sb | |||
| Cross-section | Thickness | Concrete | hc | |
| Interlayer | hi | |||
| Timber | ht | |||
| Shape | Beam | ▯, I, ◯ | ||
| Material | Concrete | Strength class | According to EC2 [24] | |
| Aggregates | Normal-weight | NWAC | ||
| Light-weigh | LWAC | |||
| Timber | Strength class | According to EN 338 [25] | ||
| Product | Solid | |||
| Wood-engineered | GL, LVL, OSB + LVL, CLT | |||
| Mechanical behavior | Connection stiffness | Low | lK | |
| Medium | mK | |||
| High | hK | |||
| Material | Linear | Elastic | LE | |
| Non-linear | Elastic Perfectly-plastic | EPP | ||
| Support conditions, Sc | Beams’ ends | Simply supported | Ss | |
| Fixed | Fx | |||
| All ends | Simply supported | Sae | ||
| Loading | Type | Point load | Mid-span | ½ Pt |
| Quarter-span | ¼ Pt | |||
| Linear load | Ln | |||
| Location | On each beam at a time | B1, B2,…, B7 | ||
| Floor use | Domestic and residential activities | According to EC1 [26] | A | |
| Areas where people congregate, with possible physical activities. | C4 | |||
| Degree of oversizing, DO | Timber cross-section | Undersized | Un | |
| EC5 “tight-fit” | According to EC5 [15] | EC5 | ||
| Oversized | Ov | |||
| Maximum Deviation [%] | Beam | Load Type | Quantity | Parameter | Details |
|---|---|---|---|---|---|
| 75 | B1 | ½ Pt | sr | Support conditions, Sc | Simply supported on beams’ ends, Ss vs. Simply supported on all ends, Sae |
| 36 | B1 | Ln | bm | ||
| 31 | B1 | Ln | vd | Concrete thickness, hc | 0.02 m vs. 0.07 m (BS) |
| B2 | ½ Pt | sr | |||
| B1 | Ln | bm | |||
| 28 | B2 | Ln | sr | Span, L | 4.00 m (BS) vs. 16.00 m * |
| 27 | B1 | ½ Pt | sr | Beams vs. deck | BS vs. CLT deck |
| 26 | B1 | ½ Pt | vd | Span, L | 4.00 m (BS) vs. 16.00 m * |
| 24 | B1 | ½ Pt | bm | ||
| 17 | B1 | Ln | vd | Concrete strength | LC16/18 vs. C25/30 (BS) |
| 16 | B1 | Ln | bm | ||
| 14 | B4 | ½ Pt | bm | Beams vs. deck | BS vs. CLT deck |
| B2 | Ln | sr | Concrete strength | LC16/18 vs. C25/30 (BS) | |
| 10 | B1 | ½ Pt | vd | Support conditions, Sc | Simply supported, Ss vs. Fixed, Fx |
| Maximum Deviation [%] | Beam | Load Type | Quantity | Parameter | Details |
|---|---|---|---|---|---|
| 70 | B1 | ½ Pt | sr | CLT and Sc | CLT + Ss vs. CLT + Sae |
| 58 | - | ½ Pt | sr | Load location | B1 vs. B4 for BS with lK connection |
| 47 | B2 | Ln | sr | Span, L | 2.00 m (BS) vs. 16.00 m* |
| 45 | B1 | ½ Pt | vd | Concrete thickness, hc | 0.02 m vs. 0.20 m |
| B1 | Ln | bm | |||
| 44 | B1 | Ln | vd | Span, L | 2.00 m (BS) vs. 16.00 m* |
| 43 | B2 | Ln | sr | hc | 0.02 m vs. 0.20 m |
| 41 | B1 | Ln | bm | Span, L | 2.00 m (BS) vs. 16.00 m* |
| 32 | B1 | ½ Pt | sr | CLT and sb | BS + juxtaposed beams vs. CLT deck |
| 29 | - | Ln | vd | Load location | B1 vs. B4 for BS with LC16/18 concrete |
| Ln | bm | ||||
| 26 | B1 | Ln | vd | CLT and Sc | CLT + Ss vs. CLT + Sae |
| 23 | B1 | ½ Pt | bm | ||
| 18 | B1 | Ln | vd | Concrete strength | LC16/18 vs. C40/50 |
| 17 | B1 | Ln | bm | ||
| 15 | B2 | Ln | sr | ||
| B1 | Ln | vd | CLT and sb | BS + juxtaposed beams vs. CLT deck | |
| 11 | B1 | Ln | bm | CLT and sb |
| Maximum Deviation [%] | Beam | Load Type | Quantity | Parameter | Details |
|---|---|---|---|---|---|
| 60 | - | ½ Pt | sr | Load location | B1 vs. B4 for Un with L = 16.00 m |
| 43 | B1 | Ln | vd | EC5 | L = 4.00 m vs. L = 16.00 m |
| 42 | B1 | Ln | vd | Ov | |
| 41 | B1 | Ln | bm | EC5 | |
| 39 | B4 | Ln | sr | Un | |
| 38 | B1 | ½ Pt | vd | Un | |
| B1 | Ln | bm | Ov | ||
| 37 | B1 | Ln | bm | Un | |
| 36 | B2 | Ln | sr | EC5 | |
| 31 | B2 | Ln | sr | Ov | |
| 30 | - | vd | Ln | Load location | B1 vs. B4 for EC5 with L = 4.00 m |
| bm | Ln | ||||
| 66 | B1 | Ln | vd | Ov | L = 2.00 m vs. L = 16.00 m |
| 64 | B1 | Ln | bm | Ov | |
| 58 | B1 | Ln | vd | Un | |
| 56 | B1 | ½ Pt | vd | EC5 | |
| B1 | Ln | bm | Un | ||
| B2 | Ln | sr | Un | ||
| B1 | Ln | bm | EC5 | ||
| B2 | ½ Pt | sr | Ov | ||
| 53 | B2 | ½ Pt | sr | EC5 |
| Quantity | vd ½ L | vd ¼ L | sr | |||||||
|---|---|---|---|---|---|---|---|---|---|---|
| Pr ∙ cfi | vs. | ½ L | ¼ L | Ln | ½ L | ¼ L | Ln | ½ L | ¼ L | Ln |
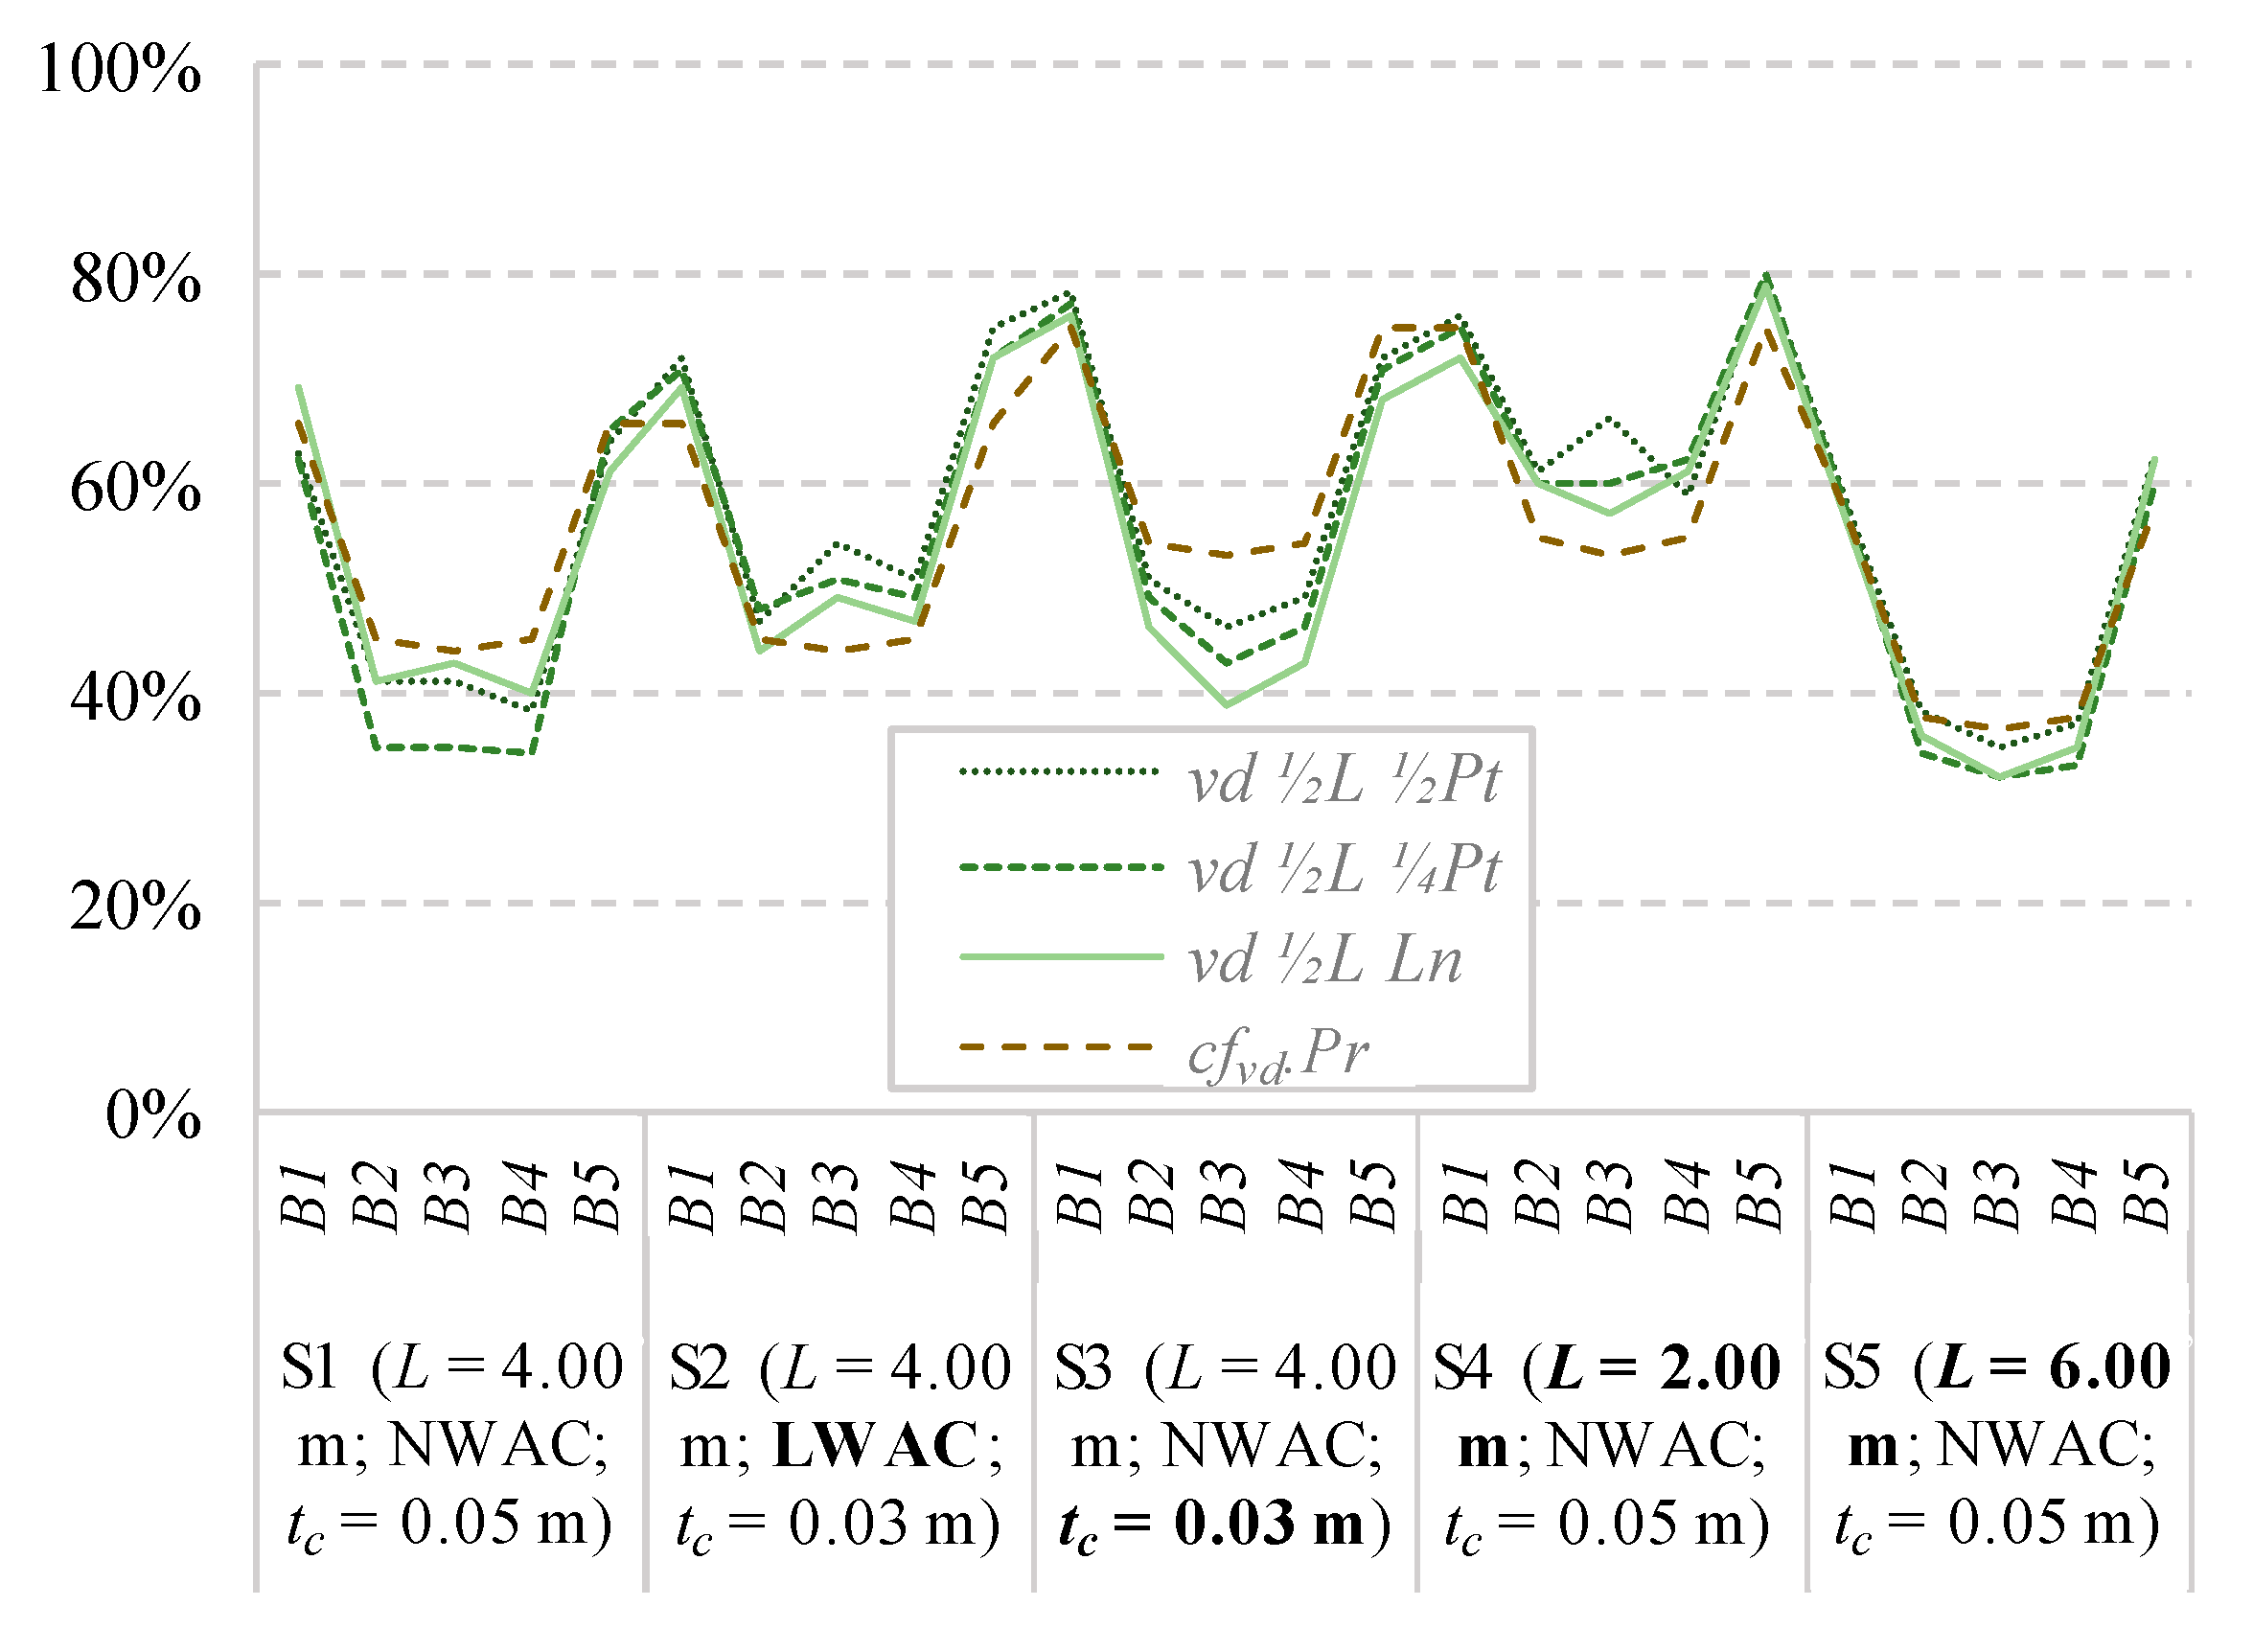
| Experimental specimen | S1 (L = 4.00 m; NWAC; tc = 0.05 m) | 4 | 7 | 2 | 4 | 3 | 1 | 11 | 6 | −2 |
| S2 (L = 4.00 m; LWAC; tc = 0.05 m) | −7 | −5 | −3 | −5 | −9 | −4 | 3 | −6 | −14 | |
| S3 (L = 4.00 m; NWAC; tc = 0.03 m) | 3 | 5 | 8 | 6 | 1 | 6 | 19 | 9 | −1 | |
| S4 (L = 2.00 m; NWAC; tc = 0.05 m) | −6 | −5 | −3 | −3 | −4 | −2 | −3 | −8 | −9 | |
| S5 (L = 6.00 m; NWAC; tc = 0.05 m) | −1 | 2 | 1 | 0 | -3 | −1 | 4 | 0 | −5 | |
© 2020 by the authors. Licensee MDPI, Basel, Switzerland. This article is an open access article distributed under the terms and conditions of the Creative Commons Attribution (CC BY) license (http://creativecommons.org/licenses/by/4.0/).
Share and Cite
Monteiro, S.; Dias, A.; Lopes, S. Distribution of Concentrated Loads in Timber-Concrete Composite Floors: Simplified Approach. Buildings 2020, 10, 32. https://doi.org/10.3390/buildings10020032
Monteiro S, Dias A, Lopes S. Distribution of Concentrated Loads in Timber-Concrete Composite Floors: Simplified Approach. Buildings. 2020; 10(2):32. https://doi.org/10.3390/buildings10020032
Chicago/Turabian StyleMonteiro, Sandra, Alfredo Dias, and Sérgio Lopes. 2020. "Distribution of Concentrated Loads in Timber-Concrete Composite Floors: Simplified Approach" Buildings 10, no. 2: 32. https://doi.org/10.3390/buildings10020032
APA StyleMonteiro, S., Dias, A., & Lopes, S. (2020). Distribution of Concentrated Loads in Timber-Concrete Composite Floors: Simplified Approach. Buildings, 10(2), 32. https://doi.org/10.3390/buildings10020032