Abstract
Aiming at the forming efficiency and roundness of the longitudinal submerged arc welded (LSAW) pipes in JCO (J-shape to C-shape to O-shape) forming process, this paper proposes a four-point air bending process. Compared with the traditional three-point air bending process, The new process can provide a more uniform bending moment, does not need to crimp the edges of steel sheet, shorten the residual straight segment length, and lengthen the forming length in single pass. The mechanical model is established to analyze the static equilibrium conditions and elastic–plastic deformation. The process is simulated by using the software package ABAQUS, to find the maximum punch spacing, and further determine the formulation principles of other process parameters. In addition, a contour detection method for the LSAW pipes in forming process is proposed based on machine vision (planar-array CCD camera produced by Gray Point Corporation, Vancouver, Canada). This method can not only quickly detect the contour of each pass, but also splice the detected contours together to obtain the overall contour with the given splicing algorithm. According to the measured contour, the bending angle, radius, and roundness can be calculated, to correct the punch reduction in the next pass and improve the forming accuracy of the pipes. Finally, an experimental system is designed to verify the proposed four-point bending JCO forming process and contour detection method. The result shows that the error between the contour detection method and CMM (coordinate measuring machine) is less than 0.5% for the overall contour, the two experimental pipes require 13 and 15 passes respectively, the roundness of pipes are less than 1.1%, which is much better than that of traditional three-point bending JCO forming process.
1. Introduction
The large scale longitudinal submerged arc welded (LSAW) pipes are often used to construct long-distance transportation pipeline, especially in areas with complex geological conditions and the poor natural environment because of its short weld length and uniform stress distribution. LSAW pipes are typically large thin-walled pipes with dimensions ranging from 6 to 12 m in length, 406 to 1626 mm in diameter, and 6.4 to 64 mm in wall thickness, and usually manufactured by the JCO process or UO (U-shape to O-shape) process [1]. The UO process has high production rates with thirty-five pipes per hour, but permits poor flexibility and requires a large investment. The JCO process needs significantly lower investments and production rates of which are just up to eighteen pipes per hour [2]. JCO process is bending one side of the steel sheet with initially crimped edges into “J” shape by multiple concentric bending passes, then bending the other side in the same way and making the sheet like a “C”, after that, becoming a “O” shape pipe with an open seam, as shown in Figure 1. Roundness is an important technical index to measure the quality of pipe, and the current pipeline standard API (American Petroleum Institute) Spec 5L [3] stipulates that the roundness of pipe should not exceed 1.5% of the diameter (0.75% when the pipe is used in offshore). In the early stages, the process parameters were usually controlled by the production experience, which is not only inefficient but also ineffective. On this basis, Fu et al. [4] proposed a mathematical punch design method to obtain the desire springback radius based on dimensional analysis. Osadchii et al. [5] built a model to calculate the relationship between the punch reduction and springback radius of pipe based on the FEM (finite element method). However, both of the above methods just consider one process parameter and ignore the other process parameters that also have a great influence on bending result.
Figure 1.
JCO forming process of longitudinal submerged arc welded (LSAW) pipe: (a) LSAW pipe, (b) J forming, (c) C forming, and (d) O forming.
The quality of pipe is generally affected by the bending angle, which determines the average radius. Moreover, to control the springback of bending angle in the V-bending process, Kumar et al. [6] predicted the springback in the V-bending process by FEM and Fan et al. [7] discussed the influence of process parameters on springback by taking the air bending of X80 pipe. Besides, the incremental bending method was used under conditions of that the material properties are unknown or unstable, and the deviation of bending angle is less than 1° [8,9]. However, the FEM and the incremental bending method must be reapplied when the material and size of the pipe are changed, affecting the efficiency of the process parameter formulation. Based on the springback theory of small curvature plane bending [10] and the incremental bending method, Zhao et al. [11] developed an intelligent control system for the LSAW pipe with JCO process, which can not only give the optimal parameters, but also the punch reduction of each pass can be modified according to the deviation value of the bending angle.
At present, most manufacturers still use the traditional three-point method, leading to a long residual straight segment, which mainly due to an uneven stress distribution. Practice shows that the ellipticity increases with increase of the residual straight segment length, which seriously affects the quality of formed pipes, but this problem has rarely been reported. Inspired by this, a conclusion is drawn that the loading moment should be as close as possible to the theoretical value. In order to shorten the residual straight segment length, the length of single pass is reduced and then the number of passes in actual production is increased, The mechanism of this method is that the bending moment distribution tends to be uniform, as shown in the Figure 2, where the is defined as the elastic limit bending moment.
Figure 2.
Bending moment distribution of JCO forming with three-point air V-bending process: (a) before pass length decreased and (b) after pass length decreased.
Yet, the problem cannot be settled well, as the forming efficiency is greatly reduced. Therefore, the four-point air bending method for JCO forming process is proposed. As shown in Figure 3, the bending moment of the new forming process is evenly distributed and more close to the theoretical value. Compared with the three-point bending process, the residual straight segment of the pipe is shorter, the roundness is lower, the number of passes can be reduced, and the steel sheet does not need to crimp the edge before JCO forming process.
Figure 3.
Bending moment distribution of JCO forming with four-point air bending process.
Due to the variable sheet material properties, even reliable theoretical calculations of process parameters can just be taken as initial values. In order to increase the quality not only of the whole pipes but also of each single pipe, it is necessary to modify the parameters according to the contour of pipe in the JCO forming process. Over the years, many contour detection methods have been explored, especially noncontact optical measurement techniques. The Zumbach Company in Switzerland used laser scanning method to measure the diameters of formed pipe. The German company Lap Laser developed a system for measuring the outer contour of pipe by rotating laser ranging sensors. A 2D reduction sensor based on the principle of 2D triangulation method has been developed by Keynes Company in Japan, the contour can be obtained by using this sensor and rotating the formed pipe in all directions. Obviously, these systems can just detect the contour and measure the roundness after the pipe forming completed. Based on the scan laser and three-point bending process, Thome et al. [12] built a closed loop control system which can correct the process parameters in the forming process, but the system can just measure the lower half contour of pipe and need a six laser scan unit which require large cost. The CCD camera is widely used in the field of contour detection because of its advantages of large detection area, fast speed and high accuracy. Ayub et al. [13] developed an in-line inspection of roundness error with CCD camera, and the detection accuracy can reach 0.01 mm. However, this system can only detect small cylindrical parts. Min et al. [14] studied the rail gauge detection based on CCD camera, while the accuracy can only reach 1 mm. Although the contour can be quickly detected by the CCD camera, the detection accuracy is limited when the size of the detected part is large. Due to the small size of single-pass in the three-point bending with JCO forming process, Li et al. [15] proposed a single-pass angle detection method based on the feature that the over residual straight segment length, and the angle detection accuracy can reach 0.2°. Furthermore, Jia et al. [16] proposed a profile-matching method, which can splice several partially overlapping contours to get the overall contour of the part. Nevertheless, in the JCO forming process of LASW pipes, the shape of the pipe keeps changing, and it is difficult to find the overlapping portions of the contours.
Therefore, to meet the constantly increasing quality requirements of formed pipes, particularly regarding the permitted geometric deviations, this paper proposes a new loading method, that is, four-point air bending JCO forming process for LSAW pipes, providing a practical bending moment distribution close to the theoretical value. Combing with this new process, the new methods for contour detection and overall contour splicing are put forward based on the CCD camera. Finally, an experiment system is designed to verify the four-point air bending JCO forming process and the new contour detection method.
2. Four-Point Air Bending for JCO Forming Process of LSAW Pipes
In the JCO process with four-point air bending, as shown in Figure 4, the process parameters according to the material properties and target size of pipe are calculated first. Then the single pass bending is performed, where the punches and dies are completely symmetrical in geometry, the unformed part of the sheet is supported by two dies, and the punches are returned to original position after gradually reduced to the definite reduction.
Figure 4.
The schematic diagram of the four-point air bending JCO forming process.
During each step of bending, the contour image can be acquired by a CCD camera, mounted in the normal direction of the pipe end face, to calculate the bending angle and radius of this pass. At the same time, the overall contour is spliced together by all formed passes and the roundness and radius are updated and calculated to modify the reduction of next pass. Based on this, the sheet is moved one step to press the next single pass, and the previous step is repeated until the section becomes J-shaped. Further, the sheet is formed from the other end, and the sheet is changed from J to C and then to O-shaped. As a result, the pipe is obtained by four-point forming process.
3. Establishment and Analysis of the Mechanical Model
3.1. Static Analysis (Bending Moment)
As the four-point air bending JCO forming process is actually a multipass bending progressive process, one pass is selected as the study object. The mechanical model and moment distribution of the static bending are shown in Figure 5.
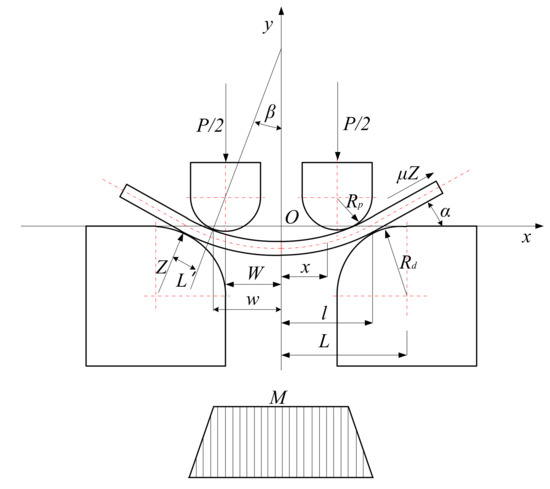
Figure 5.
Mechanical model of the four-point air bending.
Considering the static equilibrium condition and geometric relationships,
Defining the bending moment of the point where the abscissa is as , then,
where is friction factor, is rotation angle at fulcrum, is rotation angle at tangent point of punch and sheet, is bending force, is radius of punch fillet, is radius of die fillet, is reaction force at fulcrum, is thickness of sheet, is distance from to the center of punch fillet in -axis direction, is distance from to the contact point between sheet and punch in -axis direction, is distance from to the center of die fillet in -axis direction, and is distance from to the contact point between sheet and die in -axis direction. After sheet bending, springback occurs and the geometric relationship between the punch and the die is satisfied:
where is rotation angle at fulcrum after springback and is residual straight segment length.
3.2. Elastic–Plastic Analysis
3.2.1. Basic Assumptions
- (1)
- Pure bending assumption: the static bending process is considered to be a pure bending process, which means to ignore the influence of normal stress causes and to consider the bending strains only.
- (2)
- Neutral layer coinciding assumption: the strain neutral layer, stress neutral layer, and geometric neutral layer always coincide during the deforming process.
- (3)
- Bilinear hardening material model assumption: Effects of initial strain and change of material properties are neglected. The relationship between strain and stress iswhere is Young’s modulus, is yield strength of material, and is plastic tangent modulus.
- (4)
- Plane section assumption: any plane section remains plane after deforming and no aberrance occurs, so the strain distribution on any section is linear. The strain is expressed aswhere is strain, is the distance from the neutral layer, and is the curvature of neutral layer after loading.
- (5)
- Uniaxial stress state assumption: any particle on the sheet is uniaxially stretched or compressed when a deformation occurs.
3.2.2. Bending Process and Springback Analysis
At the beginning of the bending process, the bending radius is large, the stresses are less than the yield limit of the material, and only the elastic deformation occurs in the deformation zone. Then, as the punch is continuously pressed, the bending radius decreases, the inner and outer edges of the sheet enter the plastic deformation state from the elastic deformation state, and gradually expand toward the center of the sheet.
is defined as the elastic limit radius when the inner and outer edges of sheet is just entering the state of plastic deformation, as shown in Figure 6, and the moment at this time is the elastic limit bending moment, which are expressed as
where is yield strain of material, is the section moment of inertia, and is width of the sheet.
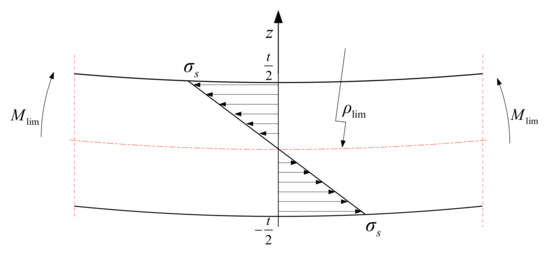
Figure 6.
Stress distribution at the .
After the sheet enters the elastoplastic bending stage, where , the bending moments are equal, and plastic deformation occurs. Therefore, there is a boundary point between elastic deformation zone and elastic–plastic deformation zone, and its abscissa satisfies . According to Equation (4) and Equations (9)–(11), there is
If , the bending moment can be expressed as,
The above equation is transformed into a cubic equation with one variable , and, moreover, is solved by combining the Kardan formula and Shengjin formula [17],
where
Based on the definition of curvature and slope, it can be conclude that
where is the rotation angle of the point with abscissa .
Simultaneous Equation (18) and Equation (19):
Under the conditions of , and , Equation (20) is substituted for Equation (14) and integrated, there is
Then, the reduction of the punch is calculated according to the geometric relationship,
Springback is one of the unavoidable problems and has a decisive effect on the dimensional accuracy of the formed pipe. The springback in four-point air bending process is analyzed based on the springback theory of small curvature plane bending. When , the relationship between the and the is as follows
where is the radius of the point with abscissa after springback. The sheet is not plastically deformed under the condition of , the radius is infinite after springback. Thus, according to Equation (14) and Equations (20)–(22), the , and rotation angle after springback can be calculated:
Based on the above theoretical model, the loading force and the reduction of punch can be calculated, and the flow chart is shown in Figure 7.
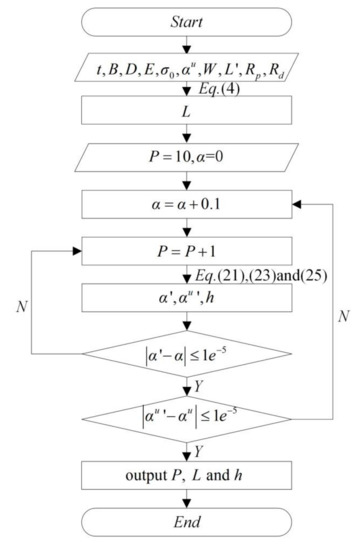
Figure 7.
Flow chart of calculating the P and h.
4. Finite Element Simulation and Parameters Formulation
The main defects of four-point bending JCO forming process are radius error, over residual straight segment length, and stress concentration. Those defects have decisive effect on the quality of pipes and can be eliminated or reduced by controlling the forming parameters. In order to study the relationship between parameters and defects, the four-point bending JCO forming process is simulated.
4.1. Finite Element Model
The finite element model of four-point bending JCO forming process is established by ABAQUS 6.10 software (SIMULIA Corporation, Johnston, RI, USA). The mechanical properties and geometric dimensions of the sheets are shown in Table 1 and Table 2. The punch diameter, die diameter and relative residual straight segment length are given in Table 3. The sheet is discretized by 4-node bilinear plane strain quadrilateral with incompatible modes (CPE4I). The punches and dies are modeled as discrete rigid body. The contact between the sheet and punch is set as a pure master–slave and kinematic contact condition and the frictional coefficient is 0.06. In addition, the ABAQUS/Standard solver is employed.

Table 1.
Material properties of sheets.
Table 2.
Geometric dimensions of pipes.
Table 3.
Process parameters.
4.2. Analysis of Simulation Results
4.2.1. Radius Error Analysis
According to the mechanical model, a circular arc with uniform curvature distribution can be obtained by four point bending process. However, the simulation results show that when the spacing of punch is too large, the sheet will no longer follow the four-point pure bending deformation law, the sheet in the zone of two tangent points of the punch cannot be formed into an approximate standard arc and a straight section appears, as shown in Figure 8. In order to facilitate the analysis of this phenomenon, , and are defined, respectively, as
where is difference value of deflection between formed arc and standard arc, is relative deflection difference, is relative radius, is relative spacing of punch, and is relative residual straight segment length.
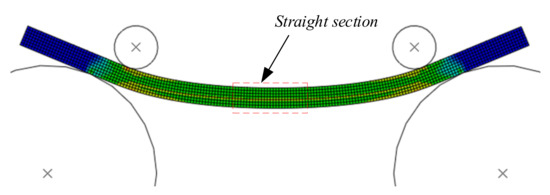
Figure 8.
Straight section in four-point bending process.
Figure 9 shows the relationship between and under the condition of X70 as material, , , , , and . It is obvious that as increases, gradually increases, and when is less than 4, grows gently and can be kept substantially below 1%, after that increases rapidly. Therefore, should be less than 1% to ensure the pipe size accuracy, and the maximum value of , in this case, is called , which is the limit relative spacing of punch.
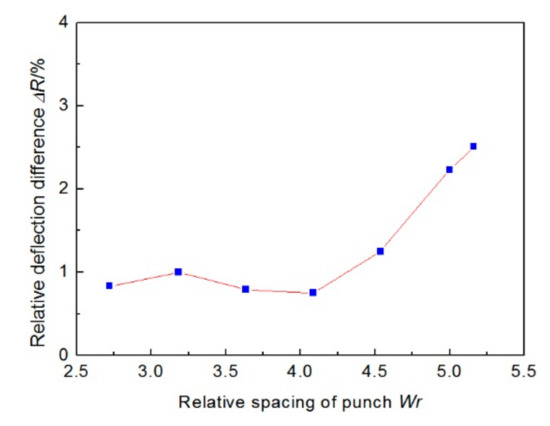
Figure 9.
Relationship between and .
Then, the relationship between and is studied with the same condition but the material is SS400, X70, X80, and , as shown in Figure 10.
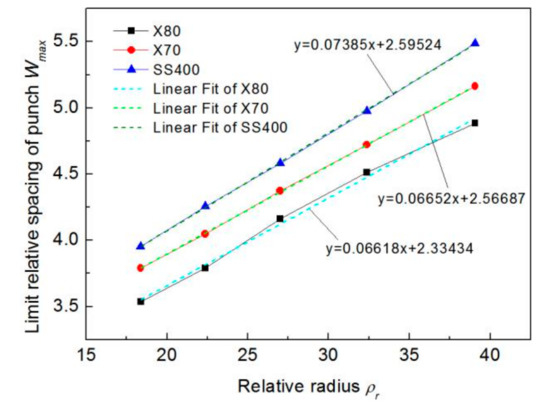
Figure 10.
Relationship between and .
It can be seen that, the of each materials gradually increases as increases, and exhibits a linear correlation of different laws. Therefore, using this discovery, the relationship between and is analyzed too, as shown in Figure 11. It is shown that the decreases as the yield stress increases with the same , and also has a good linear relationship. According to this characteristic, the of other materials and other can be predicted in the actual production.
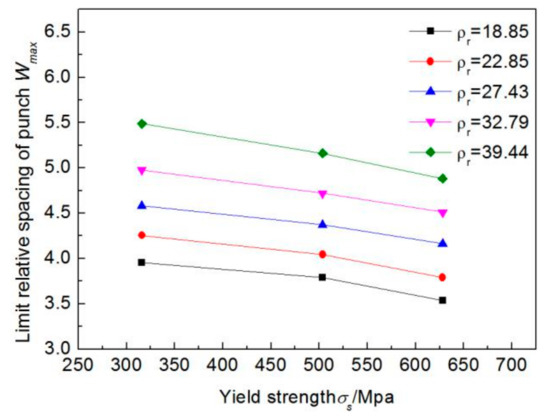
Figure 11.
Relationship between and .
4.2.2. Residual Straight Segment Length Analysis
According to the simulation results, it is easy to find that the length of the has a significant impact on the and . Figure 12 shows the relationship between and with different .
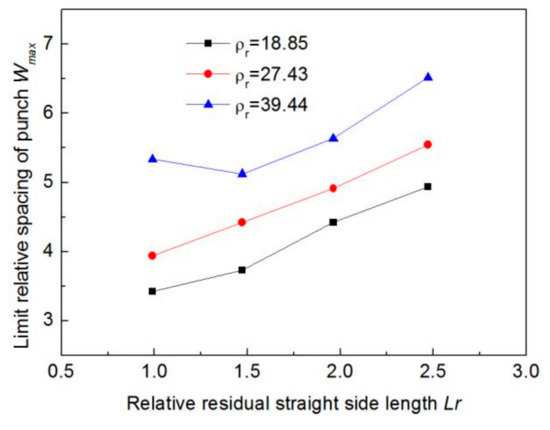
Figure 12.
Relationship between and .
When is greater than 1.5, increases approximately linearly with . Figure 13 shows that the pressure decreases with the increase of , and the decreasing range decreases gradually. An excessive pressure can lead to stress concentration and obvious indentation, as shown in Figure 14. Therefore, appropriately increasing the value of can not only increase the and improve the efficiency, but also reduce the pressure to eliminate the defect of stress concentration and lower the requirements of the equipment. However, excessively increasing the value of , makes the bending process close to three-point bending, and increases the roundness of the pipe. In practice, the value of is usually controlled at 1.5.
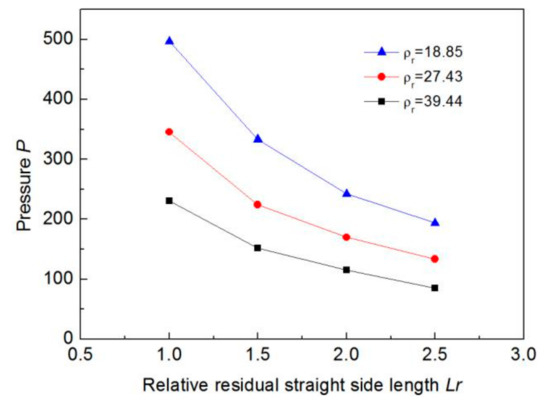
Figure 13.
Relationship between and .
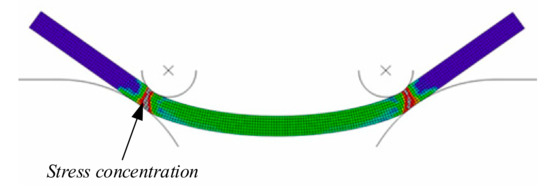
Figure 14.
Defect of stress concentration.
4.2.3. Dimension Analysis
Table 4 shows that the limit relative spacing of punch is basically same, as long as the ratio of punch radius and die radius is same. Due to this characteristic, the relationship between with the ratio of punch radius and die radius is analyzed and, for convenience of analysis, the ratio of radius of punch and die is defined as .
Table 4.
with different combinations of punch and die.
It can be seen from Figure 15, that increases as increases, but when reaches 3, the trend of to increase becomes slower and finally almost unchanged. Although is related to , and regardless of the size of the punch and die, when the radius of punch and die are small relative to the sheet thickness, the stress concentration defects may occur and affect the quality of pipe. Therefore, must be equal to or greater than 3 and and should not be too small relative to the sheet thickness.
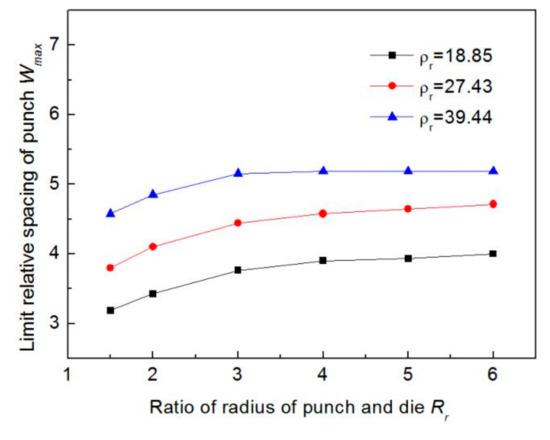
Figure 15.
Relationship between and the .
4.3. Formulation of Process Parameters
According to the above analysis, the , , and can be determined by combining the material properties and the geometrical dimensions of the pipe, and due to the established four-point bending mechanical model, the maximum springback bending angle can be obtained. Furthermore, the steel sheet does not have the crimping edge, so the minimum quantity of passes is
By taking as the quantity of passes which is the minimum singular value satisfies , the springback bending angle , spacing of punch and pass length are obtained.
After that, according to the flow chart shown in Figure 7, the required spacing of dies , pressure and reduction can be calculated. Finally, four-point bending for JCO forming process of LASW pipe can be carried out according to the obtained process parameters.
5. Contour Detection Method Based on Machine Vision
The purpose of contour detection during the JCO forming process is to monitor the formation of the pipe in real time, so as to optimize the reduction of punch in time and obtain high-quality pipe. The CCD camera is adopted because of its advantages such as high speed, high precision, and strong adaptability, which meet the requirements of contour detection.
5.1. Formulation of Process Parameters
In the process of contour detection, the bending part of each pass is photographed by CCD camera after single-pass bending, and then the image is processed as the flow shown in Figure 16.
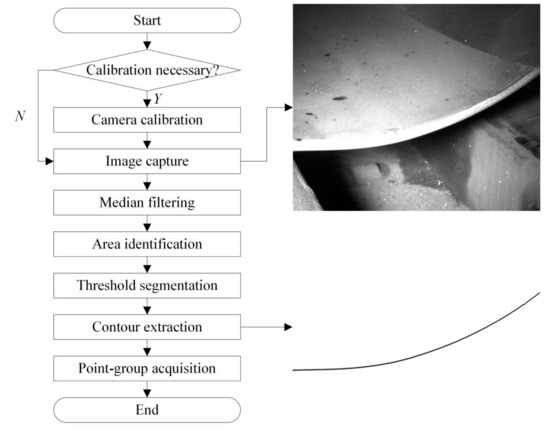
Figure 16.
Image processing flow and processing result.
After that, the point-group is obtained, which includes the coordinate of each point of the contour in the established coordinate system. The contour is represented by , and its two endpoints are and .
It is hard to measure the bending angle directly because of the small residual straight segment length, so the bending angle () is calculated according to the characteristic that the four-point bending process is symmetrical. Firstly, making a line parallel to the x-axis intersects with the contour at point through the point ; the midpoint is . Then, the next adjacent point is calculated in the same way, and the above process is repeated until there is no corresponding point, as shown in Figure 17a.
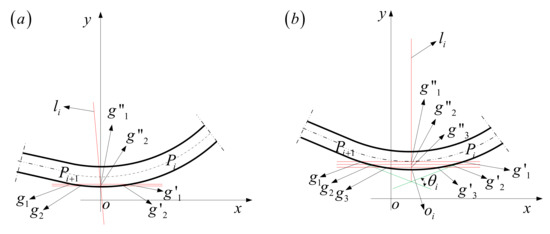
Figure 17.
Rotating contour to obtain forming angle : (a) contour before rotation, (b) contour after rotation.
Fitting line with points , , by least square method, if the line is not perpendicular to the x-axis, then the contour is rotated clockwise at an angle of with as the center of the circle. Repeating the above steps to get the new line , if the line is not perpendicular to the x-axis too, then the contour is rotated clockwise at an angle of with as the center of the circle again until the line is perpendicular to the x-axis, as shown in Figure 17b. Let the contour satisfy the equation at this time, there must be
According to Equation (37), and can be obtained, the tangent and of contour can be made through these two points. The forming angle , which is the angle between tangent and , can be calculated.
5.2. Splicing Algorithm for the Overall Contour
Base on the detected contour of first pass, the formed part and point-group are obtained. The two endpoints are and and the forming angle is . Then the point-group is rotated and translated, so that the tangent is parallel to the x-axis and the point coincides with the original point . The point-group is achieved, the two endpoints are transformed into and . Making an arc with radius through both the end points, the error is measured and the relative error of this pass is calculated.
After the second pass carried out, the above process is repeated to achieve the contour and point-group . The two end points are and , the bending angle is , and the relative error is . In order to better measure the quality of formed passes, the contours must be spliced together to obtain the overall contour. The overall contour of the first pass is defined as the point-group . As the point moves to in the second pass, the point-group moves the same way and be rotated degree with the center point , so is transformed into the point-group with the end points and .
The contours of first two passes can be spliced into and represented by point-group . Similarly, after the i-pass bent, the point-group is , the two endpoints are and , the forming angle is , the relative error is , and the is changed to ,
At this time, the overall contours can be spliced into and represented by point-group , as shown in Figure 18.
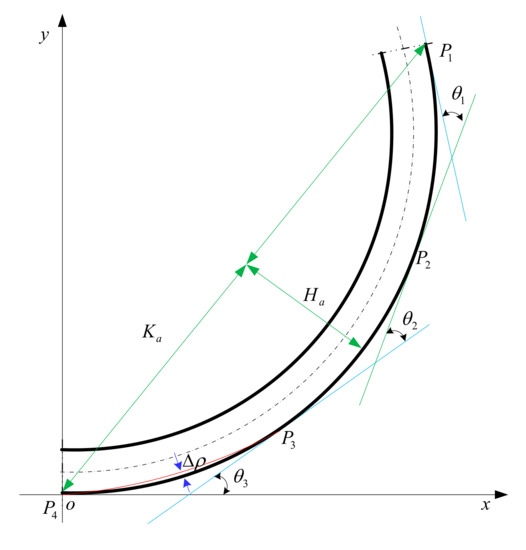
Figure 18.
Splicing of the overall contour.
One of the important index of pipe quality is roundness ,
where is the length of semi-major axis and is the length of semi-minor axis. However, and can only be measured after pipe forming is completed. Based on this, is defined, which can reflect the forming quality of formed part of pipe.
where is the half of chord length between the two ends, is the standard half of chord length after the pass is formed, is the chord height, and is the standard chord height. In this way, and can be calculated according to the overall contour of the formed part, then the reduction of the next pass can be modified. The process of contour detection and splicing is shown in Figure 19.
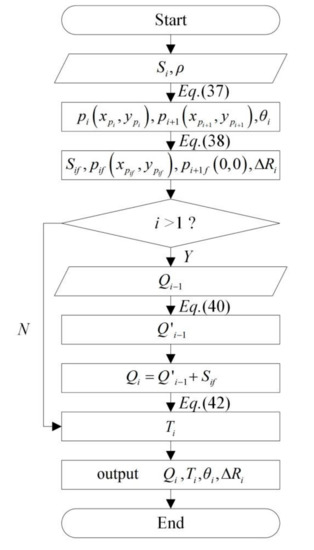
Figure 19.
Flow chart of contour detection and splicing.
6. Experiment Design
In order to verify the correctness of the four-point bending process and contour detection method, a small experimental system are developed, including CCD camera, fill light, punches, dies, I-shape plate, slider, and base plate, as shown in Figure 20. The punches are connected to the groove of the I-shaped plate, which is fixed on the crossbeam of the test machine and the spacing between them can be adjusted. The dies are fixed on two slides, which are connected together through the screw, and the spacing between them can be adjusted too. The CCD camera and fill light are mounted in the direction perpendicular to the end face of the pipe to detect the contour of each pass. The geometrical dimensions and material properties of the target pipes are shown in Table 5, the process parameters are given in Table 6.
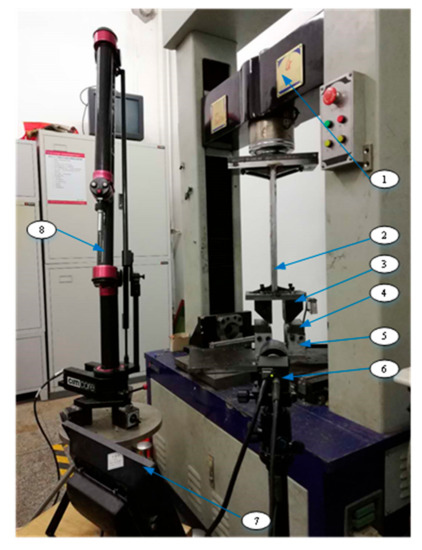
Figure 20.
Four-point bending device: (1) test machine, (2) I-shaped plate, (3) punch, (4) die, (5) slide, (6) CCD camera, (7) fill light, and (8) CMM.
Table 5.
Material properties of sheet.
Table 6.
Process parameters.
The testing machine is a WDD-LCT-150 (Lier Corporation, Qingdao, China) electronic tension torsion multifunctional testing machine with a reduction accuracy of 0.01 mm and a maximum allowable load of 150 KN. The CCD camera, model GS3-PGE-50S5M-C produced by Gray Point Research Corporation, Vancouver, BC, Canada, can take images with a size of 2048 × 2448 pixels. The contour of the pipe is also measured by the 3000iTM series of portable coordinate measuring machines (CMM produced by CimCore Corporation, Farmington Hills, MI, USA) with a measurement accuracy of 0.01 mm. The experimental process is shown in Figure 21, and the software is programmed to control the experimental process according to the flow chart.
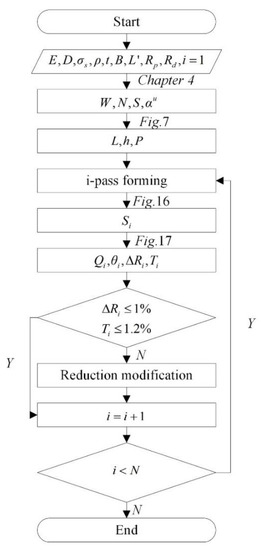
Figure 21.
Flow chart of experiment.
7. Experimental Results Analysis
In the pipe forming process, the contour of each pass is detected by the contour detection system based on the CCD camera and is compared with the direct measurement data of the CCM. Figure 22a shows the contours of the first pass. It can be seen that the data errors of the two detection methods are small and the approximate maximum error of the same point are 0.21 mm and 0.19 mm, respectively. The bending angle of each pass is calculated by the proposed rotation method, as shown in Figure 22b. Comparing with the target angle, the errors of the first several passes are larger, and then the punch reductions are modified to 3.35 mm and 3.67 mm respectively, the latter passes decrease and tend to be stable, except the last pass due to the blocking of the I-shaped plate. Figure 22c shows that the overall contours of the splicing method and CMM method after “J” forming completed, which have little difference. The approximate maximum error occurs at the end of the contours, with distances of 1.68 mm and 1.14 mm, which are 0.48% and 0.36% of the respective formed parts. In addition, there is no big fluctuation in the data of all passes, which indicates that the detection system is stable and effective.
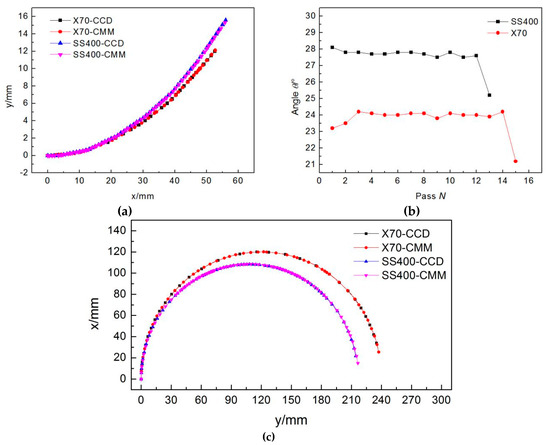
Figure 22.
The single pass contours and overall contours detected by CCD and CMM: (a) Contours after first pass, (b) angle of each pass with CCD contour, and (c) overall contours of the splicing method and CMM after “J” forming.
According to the detection contours of CCD and CMM, and can be calculated, as shown in Figure 23. It can be seen that relative error is stable and lower than 1% apart from the last pass due to the reason of the last bending angle. -values continuously decreases until the “J” forming completed, which means that the half passes are already complete, then suddenly increases to a level similar to the first pass, and decreases as the number of passes increases again until the "C" shape forming completed. According to the Equation (42), the reason for this phenomenon is that the values of the are stable or change a little in the forming process, but the standard half chord length of formed part increases as growing of formed part. Then -values change to level of the first pass when sheet is bending from the other side, which also means the “C” forming start, and increase repeatedly. At last pass, the -values suddenly and dramatically increase for the same reason like relative error . Besides, the values of and indicate the feasibility of the four-point bending JCO forming process. The pipes after forming are shown in Figure 24. Then, the contours of pipes are detected by CMM after that the pipes are welded, as shown in Figure 25. The roundness of pipes are 1.1% and 0.99%, respectively, which meet the requirement in API 5L that the roundness of the pipe is less than 1.5%. Besides, the two pipes require 13 and 15 passes respectively, which is far less than the 25 and 27 passes for the three-point bending JCO forming process.
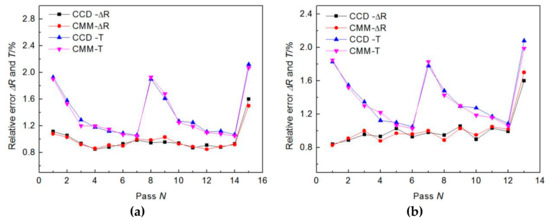
Figure 23.
The and of each pass by the contours of CCD and CMM: (a) X70 and (b) SS400 .
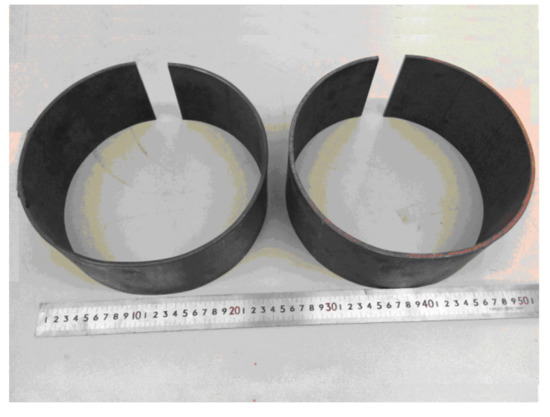
Figure 24.
Pipes after forming.
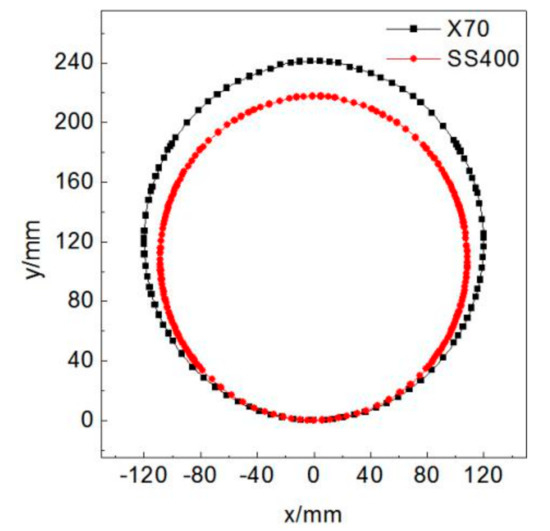
Figure 25.
Contour of pipes after welding.
8. Conclusions
Aiming at the forming efficiency and roundness of the LASW pipes with the JCO forming process, this paper proposes a new forming method of four-point bending, and a new contour detection method based on planar-array CCD camera. The calculation method of process parameters and the specific flow of production are determined by combining the above two methods. In addition, the verification experiments are carried out. The conclusions are as follows.
- (1)
- The bending moment in the four-point bending process is evenly distributed between punch points, producing an arc with uniform curvature for the LSAW pipes.
- (2)
- The steel sheet does not need to crimp the edge before JCO forming process, which improves efficiency and reduces cost.
- (3)
- The pressure and reduction can be calculated based on the mechanical model of the four-point bending process, the material properties and process parameters.
- (4)
- The simulation results show that there is a limit to the relative spacing of punch for the pipe with certain geometrical dimensions and mechanical properties; based on this, the other process parameters are further determined.
- (5)
- The contour detection method based on the CCD camera can be used to detect the forming status of single pass, and the contour splicing method is proposed at the same time to obtain the overall contour of the formed part. These new methods take less time and have higher accuracy than previous detection methods.
- (6)
- Aiming at the four-point bending JCO forming process and the new contour detection method, the experiments were carried out. The two pipes required 13 and 15 passes, respectively, and the roundness of pipes are less than 1.1%, which is significantly less than the three-point bending JCO forming process. In addition, the contour detection system seems to run stably and accurately.
Author Contributions
Conceptualization, Z.Z. and J.Z.; Methodology, Z.Z. and J.Z.; Software, H.W.; Validation, Z.Z., G.Y., and J.Z.; Formal analysis, Z.Z.; Writing—original draft preparation, Z.Z.; Writing—review and editing, Z.Z. and J.Z.; Supervision, J.Z.; Funding acquisition, G.Y.
Funding
This research was funded by the China Postdoctoral Science Foundation, grant number 2018M641672.
Conflicts of Interest
The authors declare no conflicts of interest.
References
- Wang, C.; Yu, G.; Wang, W.; Zhao, J. Deflection detection and curve fitting in three-roll continuous straightening process for lsaw pipes. J. Mater. Process. Tech. 2017, 255, 150–160. [Google Scholar] [CrossRef]
- Genser, B.; Kleinjans, B. L-SAW large-diameter pipe production. Top quality is what counts Where are the trends leading? What are the benefits of UOE and JCOE®, Baosteel BAC; Shanghai Scientific and Technological Literature Publishing House: Shanghai, China, 2008; pp. 89–93. [Google Scholar]
- Specification for Line Pipe: API Specification 5L, 2018 Forty-Sixth Edition; American Petroleum Institute: Washington, DC, USA, 2018.
- Fu, Z.; Mo, J.; Wang, Y.; Ma, Z. Punch design’s springback prediction and geometrical parameter inverse of air-bending forming of sheet metal. J. Huazhong Univ. of Sci. Tech. 2009, 37, 86–89. [Google Scholar]
- Osadchii, V.Y.; Gaas, E.A.; Zvonarev, D.Y.; Kolikov, A.P. Shaping of thick sheet in the production of welded large-diameter pipe. Steel Transl. 2014, 44, 63–66. [Google Scholar] [CrossRef]
- Kumar, A.; Panangipalli, V.K.; Mahesh, K.; Swati, M. Prediction of springback in v-bending and design of dies using finite element simulation. Int. J Mater. Prod. Technol. 2010, 39, 291–301. [Google Scholar] [CrossRef]
- Fan, L.F.; Gao, Y.; Yan, J.X.; Yun, J.B. Effects of simulation parameters on springback in air bending of JCO forming. App. Mech. Mater. 2014, 623, 117–120. [Google Scholar] [CrossRef]
- Wang, F.; You, Y.P. Study on springback control of v-bending process of metal sheet. Mater. Sci. Tech. 2012, 20, 35–38+44. [Google Scholar]
- Vorkov, V.; Aerens, R.; Vandepitte, D.; Duflou, J.R. On the identification of a loading scheme in large radius air bending. Key Eng. Mater. 2015, 639, 155–162. [Google Scholar] [CrossRef]
- Zhao, J.; Yin, J.; Ma, R.; Ma, L.X. Springback equation of small curvature plane bending. Sci. China. Tech. Sci. 2011, 54, 2386–2396. [Google Scholar] [CrossRef]
- Zhao, J.; Li, J.; Qu, X.; Wang, G.; Sun, H.; Ma, R. Study on intelligent control technology for forming steel pipe of pipeline with JCO process. Sci. Chin. Technol. Sci. 2011, 10, 2754–2759. [Google Scholar] [CrossRef]
- Thome, M.; Vochsen, J.; Gotsis, V. Calculation tool and closed loop control for the JCO® pipe forming process. Procedia Eng. 2017, 207, 1605–1610. [Google Scholar] [CrossRef]
- Ayub, M.A.; Mohamed, A.B.; Esa, A.H. In-line inspection of roundness using machine vision. Procedia Tech. 2014, 15, 808–817. [Google Scholar] [CrossRef]
- Min, Y.; Wang, H.; Kang, F.; Dang, J. Study on rail gauge detection systems based on image sensors. Laser Tech. 2015, 39, 344–348. [Google Scholar]
- Li, J.; Zhao, J.; Ma, R. Precise bending pipeline steel pipes with JCO forming. Opt Precis Eng. 2010, 18, 638–645. [Google Scholar]
- Jia, L.; Wang, J.; Yin, Z.; Zheng, Z.; Li, S. Profile matching method for the measurement of steep conformal optics. Chin. Mech Eng. 2009, 20, 1159–1162. [Google Scholar]
- Fan, S. A new extracting formula and a new distinguishing means on the one variable cubic equation. Nat Sci J Hainan Teach Coll. 1989, 2, 91–98. [Google Scholar]
© 2019 by the authors. Licensee MDPI, Basel, Switzerland. This article is an open access article distributed under the terms and conditions of the Creative Commons Attribution (CC BY) license (http://creativecommons.org/licenses/by/4.0/).