Abstract
This study aims to investigate the effect of loading factors on damage accumulation under variable amplitude vibration (VAV). Vibration fatigue experiments are conducted under both constant amplitude vibration (CAV) and VAV loading cases. The effects of loading sequence, loading amplitude, stress difference, and cyclic ratio on damage accumulation are analyzed. It is found the damage accumulation rate is strongly affected by the loading sequence: the fatigue lives can be ranked in descending order as the one-way low-high loading, the constant loading, and the one-way high-low loading. The effect of stress difference on damage accumulation is not significant, while the damage accumulation varies a lot according to the cyclic ratio of the two-level loading blocks and the fatigue life could be extended by increasing the lower loading cycles. Comparing with linear and double linear damage rules, models based on nonlinear damage rules have apparent advantages in predicting accuracy in VAV conditions, in which the nonlinear continuous damage model has the best compromise between availability and precision.
1. Introduction
Vibration fatigue under variable amplitude loading is one of the common failure modes of engine structures [1,2]. It has been validated that the fatigue damage is influenced by loading factors, e.g., loading sequence, loading amplitude, load difference, and cyclic ratio. Jeelani [3] investigated the high cycle fatigue and damage accumulation of Ti–6Al–4V bars under multi-level tension-compression loads. Dattoma [4] measured the S-N curve of 30NiCrMoV12 steel under symmetrical, two-level, and multi-level loading conditions. Aid [5] conducted a series of variable loading experiments of 6082 T6 Aluminum alloy including four blocks loading and random loading conditions. Pereira [6] carried out multi-level loading tests with different sequences (high-low and low-high) and a constant loading test using P355NL steel under various cyclic ratios. However, a common feature of the above studies is that the loading sequences used are either in ascending order (e.g., low-high loading) or in descending order (e.g., high-low loading). Thus similar results are obtained that the damage accumulation is less than 1 under the low-high loading case and is more than 1 under the high-low loading case.
For the random loading case, Mall [7,8,9] found that not only the fatigue life but also the fatigue limit decrease comparing with those under the constant amplitude vibration (CAV). Casiati et al. [10] found that the maximum transformation strain of the Cu–Al–-Be alloy decreases during the multi-level loading cases. Mutoh [11] also proved that the fatigue limit of a spring steel under random loading spectrum reduces by 5% than that of CAV. Dungey [12] found that the application of combined cycle fatigue is detrimental to fatigue life under conditions of large vibrational amplitudes.
Under variable amplitude vibration (VAV), Kinyon and Hoeppner [13] concluded that Miner rule is insufficient to predict failure lives of Ti–6Al–4V with multiple load levels. Zhu et al. [14] proposed a new damage accumulation model based on Miner rule to consider the coupled damage due to HCF-LCF interaction by introducing four load parameters, and results show that the proposed model provides good predictions. Mlikota et al. [15] proposed a micro-model containing the microstructure of carbon steel to simulate the crack growth process, which shows an acceleration effect on short-crack growth rate due to overload. Yuan et al. [16] developed a two-fold nonlinear grain-based fatigue damage model for VAV by combining short fatigue crack model and grain-based Miner rule.
In VAV loading cases, the difference between the consecutive load levels can cause considerable influence on the damage accumulation. Salvati et al. [17] studied the fatigue crack acceleration due to a single compressive underload through residual stress mapping and crack closure analysis. It is found the main contributions to crack acceleration are the crack tip blunting, crack closure, and the crack tip residual stress variation. Li et al. [18] modelled a volume of 304 L steel to study VAV effects on cyclic plasticity and microcrack initiation. It is found that overload effects on cyclic plasticity and microcrack initiation are significant and the local stress and maximum shear strain amplitudes are useful in predicting crack initiation. It is clear from the above analyses that the variable loading condition can affect the damage accumulation in different ways. However, it would be more appropriate to study the correlated effect of multiple loading factors on the fatigue damage comprehensively.
To study the correlated effect of loading factors on damage accumulation, vibration fatigue tests under CAV and VAV are conducted. The S-N curve of Ti–6Al–4V is obtained for the resonance vibration fatigue. Then the damage accumulation under VAV is investigated including three loading cases: the high-low loading, the low-high loading, and the repeated block loading. The effects of loading factors, such as the loading sequence, the stress difference and the cyclic ratio on damage accumulation are analyzed. Different damage accumulation models are adopted and compared in the fatigue life prediction under various loading cases.
2. Experiments
The specimen is made of Ti–6Al–4V with ultimate strength of 1005 MPa, yield strength of 910 MPa, Young’s modulus of 114 GPa, Poisson’s ratio of 0.34, and density of 4420 kg/m3. As shown in Figure 1, the beam specimen used is 120 mm × 20 mm × 1.5 mm. The minimum width in the center is 10 mm and both lateral faces of the arcs are polished by sandpaper (number 240, 600, 1000, and 2000, successively).
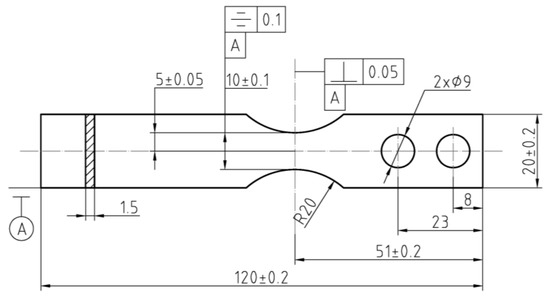
Figure 1.
Sketch of the fatigue test specimen.
The configurations of the vibration fatigue test are shown in Figure 2. In the test, the specimen is fixed on the right edge to the vibrating rig through two bolts. A sinusoidal waveform with the first order natural frequency of the specimen is applied, which is automatically searched by the vibration control system (STI Inc., Suzhou, China). The test stops when the first order natural frequency reduces by 1%. The vibration amplitude is measured and recorded through an accelerometer (PCB Group Inc., Depew, NY, USA) on the specimen tip, and the stress is calculated accordingly. The tests are conducted under room temperature and atmosphere.
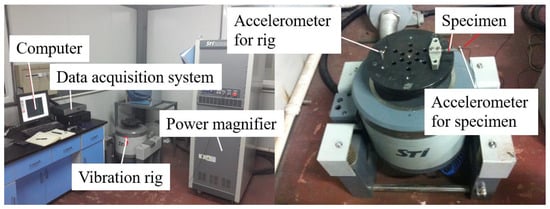
Figure 2.
Configuration of vibration fatigue test.
The vibration fatigue test consists of three parts: (1) CAV, (2) one-way two-level loading, and (3) two-level repeated block loading. The CAV test is used to obtain the S-N curve, the one-way two-level loading is to analyze the effect of loading sequence on the damage accumulation, and the two-level block repeated loading is for investigating the damage accumulations under various loading differences and cyclic ratios. The loading profiles used in the vibration fatigue tests are shown in Figure 3. The details of the experiment are given as below:
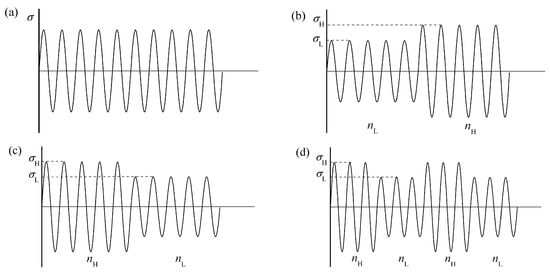
Figure 3.
Schematics of (a) constant amplitude loading; (b) low-high loading; (c) high-low loading; (d) two-level repeated block loading.
- In the CAV test, the maximum stress and the stress amplitude are constant (see Figure 3a), and the maximum stress is within the range of 420–570 MPa.
- The two-block loading test consists of the high-low (H-L) and the low-high (L-H) cases (Figure 3b,c). Three stress levels are used including 517 MPa, 595 MPa, and 647 MPa. The specimen is firstly loaded at one stress level for certain cycles and then loaded at another stress level until failure.
- The loading spectra of the two-level block loading test (Figure 3d) are composed of several loading blocks with different stress levels. The loading level within each block is the same, but the difference between loading levels and the cyclic ratio between blocks are variable. Therefore, two sorts of two-level block loading tests are studied: (a) variable loading difference of 23 and 153 MPa with the constant cyclic ratio of 1. and (b) variable cyclic ratio from 0.2 to 20 at the constant load difference of 59 MPa.
3. Damage Models
The linear damage rule (LDR) [19] assumes that the relationship between the fatigue damage and the loading cycle is linear. The damage per loading cycle is considered independent from loading parameters and the failure occurs when the accumulative damage reaches 1. Because the effects of material deterioration and loading sequence on the damage accumulation are not considered, the critical damage value, DCR, always deviates from 1 under a multi-level loading condition. To overcome the above limits, a nonlinear damage rule (NLDR) [20] was proposed considering the correlation of damage and loading parameter:
where xi is an exponent related to the ith cycle load. To utilize the equation, however, the exponent needs to be recalculated for different loading conditions. If the damages of a structure under two different stress σ1 and σ2 are identical (D1 = D2), then:
where n1 and N1 are the loading cycle and the fatigue life when the damage is D1 under the stress level of σ1, n2′ and N2 are the loading cycle and the fatigue life when the damage is D2 under the stress level of σ2, and n2 is the remaining life under the stress level of σ2. Then Equation (2) can be transformed into:
For a two-level loading, the x1/x2 can be fitted as a whole using the experimental data instead of fitting x1 and x2 individually [21]. Based on material tests, Manson and Halford [22] gave a relationship between the loading cycle and the fatigue life under the two-level loading condition as follows:
On the basis of Equations (3) and (4), the damage curve approach (DCA) [22] can be wrote in the following form:
Further simplifying Equation (5), the double linear damage rule (DLDR) was proposed, in which the overall fatigue process is divided into two separate stages—the crack initiation and the crack propagation—and each stage follows the respective linear damage rules. Using DLDR, a transition point (or a knee-point) requires attention and the corresponding slope was given as 0.25 [22]:
Continuum damage mechanics approach can be adopted into the deteriorating mechanical behavior using a continuum scale [23] to describe the continuity of damage accumulation. Based on the strain equivalence hypothesis, a differential equation [24] is proposed to evaluate the nonlinear damage accumulation, in which the variables can be either stress/strain or other causes of damage. The nonlinear continuous damage (NLCD) model can be described as follows:
where β, M0 and b are material properties, σm = σmax (1 + R)/2 is the mean stress, σmax is the peak stress, R is the stress ratio, σa is the stress amplitude, and α is a parameter correlated to the load. The expression of α is given as
where <x> = 0 when x ≤ 0 and <x> = x when x > 0, σ−1 is the fatigue limit, σu is the ultimate tensile strength, and H and h are factors that can be obtained by test.
As shown in Equation (8), the fatigue life N is a differential equation of the damage D, and the whole fatigue life of a structure can be regarded as a damage accumulation process from D = 0 to D = 1, where D = 0 means the structure is brand new and D = 1 means the structure is fractured. On this basis, the fatigue life can be obtained by integrating D from 0 to 1 and the final fatigue life under CAV can be obtained as:
In the case of VAV, Equation (8) can be transformed into:
For the two-level loading:
For the multi-level loading:
where Y is an auxiliary variable and the failure occurs when Y is 1.
4. Results and Discussion
4.1. Constant Amplitude Loading Test
The results of the CAV tests and the S-N curve of the Ti–6Al–4V are given in Table 1 and Figure 4, respectively. The fatigue limit of the Ti–6Al–4V (107 cycles) is 440 MPa.

Table 1.
Constant amplitude vibration (CAV) test results.
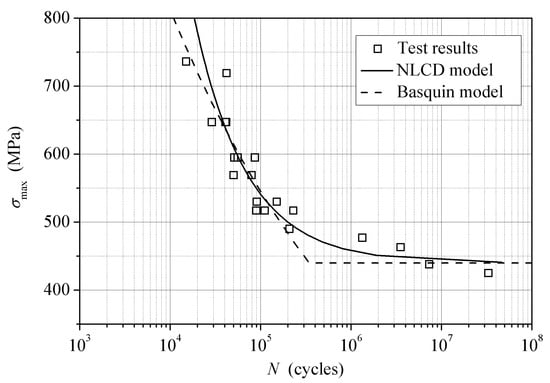
Figure 4.
S-N curves of Ti–6Al–4V under stress ratio of −1.
The Basquin model [25] and the Chaboche model (NLCD) are employed to fit the experimental data. The expression of the Basquin model is given as follows:
where a and b are material parameters. The parameters of Basquin model and NLCD model are obtained as a = 3995, b = −0.173, M0β/H =2.75 × 10⁴, and β = 0.03781. The calculated and the tested S-N curves are overlaid in Figure 4. It can be seen that these two models have the same predictions in the middle stress region of 500–650 MPa. Under a relative high stress level (σmax > 650 MPa), the Basquin model gives a shorter fatigue life than the NLCD, but the relative errors of the two models from the experimental data are similar. In the low stress range under 500 MPa, the NLCD shows a competitive performance in particular when the load is close to the fatigue limit. Near the fatigue limit, the prediction of the Basquin model show a knee point while that of the NLCD model is very smooth and much closer to the experimental data.
4.2. High-Low and Low-High Block Loading Test Results
Three loading levels (517 MPa, 595 MPa, and 647 MPa) are combined in the one-way two-level loading case. The corresponding CAV fatigue lives are 1.44 × 10⁵ cycles (517 MPa), 6.45 × 10⁴ cycles (595 MPa), and 3.72 × 10⁴ cycles (647 MPa), which are used to determine the cycle fractions per loading block. The cycle number of the first loading block varies from 0.17 to 0.80 times of the CAV fatigue life under the same load. The detailed loading information and the experimental results are listed in Table 2.
Table 2.
Test results under one-way two-level loading.
The fatigue lives under the one-way two-level loading conditions are compared with the CAV results (Figure 5). The equivalent stress is calculated according to the cycle fraction of the two blocks [6]. Under a specific stress level the two-level data follows a pattern: taking the CAV results as reference, the data from the H-L case concentrates on the left side and that from the L-H case locates on the right side. In other words, at a given stress level the fatigue life under the L-H loading is always the longest, and the H-L loading sequence leads to the shortest fatigue life. The results indicate that the damage accumulation varies with loading sequence so that considering the loading sequence effect on the fatigue life prediction in the VAV case is very necessary.
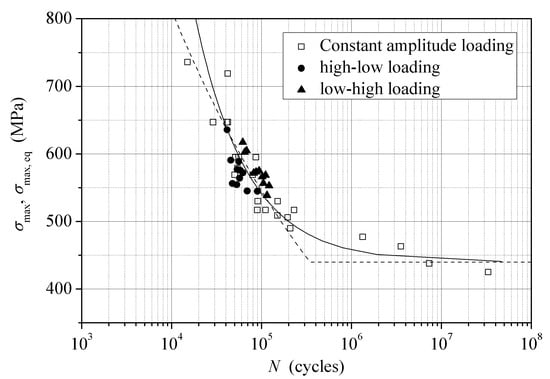
Figure 5.
Comparison of fatigue lives under CAV and one-way two-level loading conditions.
The tested damage fractions and the predicted damage accumulation curves are illustrated in Figure 6. The damage fractions caused by the second loading block (n2/N2) are plotted against that caused by the first loading block (n1/N1). In the 647/517 MPa case, the LDR gives the same diagonal for both two loading sequences, which means the sum of damage caused by the two-level load equals 1. While the results from the other four models are a series of curves below the diagonal line in the L-H (517–647 MPa) case and above the diagonal line in the H-L (647–517 MPa) case. The results show that the effect of the loading sequence on the fatigue life is not considered in the LDR model but can be considered in the other four models. The DLDR curves are actually composed of two sections representing the damage in the two fatigue phases which are very similar with the DCA. NLDR and NLCD exhibit the highest accuracies in the damage fraction prediction in this case. Similar results can be found in the 595/517 MPa case. The comparison between the experimental and the calculated results of n2/N2 are shown in Figure 7. The relative prediction errors are 92.2% (LDR), 56.9% (DLDR), 59.2% (DCA), 21.0% (NLDR), and 34.0% (NLCD), which further proves that NLDR and NLCD have better performances. It should be noticed that, to utilize the NLDR, the parameter x1/x2 is calculated for every loading condition, which is 0.44 for H-L (647–517 MPa), 2.49 for L-H (517–647 MPa), 0.27 for H-L (595–517 MPa), and 1.48 for L-H (517–595 MPa). From this point of view, the NLCD is much easier to apply with acceptable sacrifices of precision.
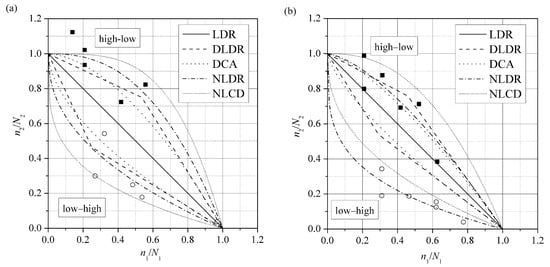
Figure 6.
Test results and predicted damage fractions under (a) 647/517 MPa and (b) 595/517 MPa.
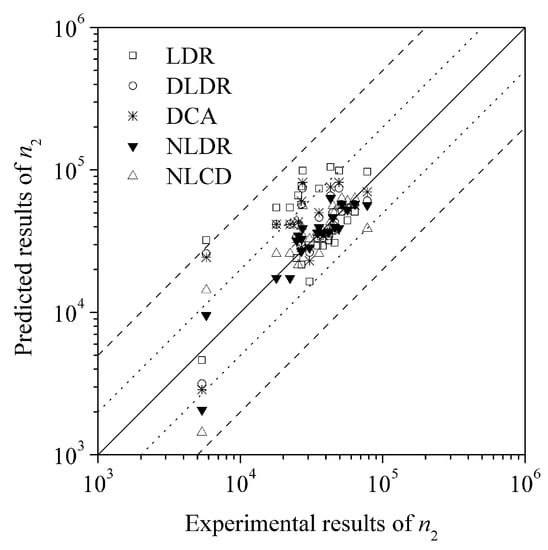
Figure 7.
Relative errors of predicted n2.
4.3. Two-Level Repeated Block Loading Test Results
The two-level repeated block loading tests with constant cyclic ratio of 1 and variable stress difference are conducted to discuss how the stress difference between loading levels affects the damage accumulation. The loads, the cycles per block, the numbers of blocks, and the experimental and predicted fatigue lives are listed in Table 3. With the same higher stress level, the fatigue life hardly changes with stress difference. However, with a certain stress difference, the fatigue life increases when the higher stress level decreases. It reveals that the effect of stress difference on the fatigue life is very slight and the total life is dominated by the higher stress level.
Table 3.
Test results under the two-level repeated loading with nL/nH = 1.
To investigate the influence of cyclic ratio on the damage accumulation, VAV tests are carried out with the same stress difference (59 MPa) under different cyclic ratios (0.2, 1, 5, 10, and 20). The load information and the fatigue lives are listed in Table 4. The loading cases can be classified into: (1) that dominated by the low-level stress (nL/nH > 1); (2) that with even distribution of the two-level stresses (nL/nH = 1); (3) that dominated by the high-level stress (nL/nH < 1). The comparison between the experimental results are shown in Figure 8. When the low-level stress cycles are the majority, the fatigue life is the longest. Accordingly, under a certain number of loading cycles, the fatigue life increases with the increase of the low-level stress proportion, and vice versa. However, the growth rate of the fatigue life decreases with increasing low-level stress proportion, which means the increase of life would stop at some point no matter how the low-level stress cycle numbers increase further.
Table 4.
Test results under the two-level repeated loading with Δσ = 59 MPa.
Figure 8.
Comparison between the experimental results with (a) nL/nH = 1 and (b) Δσ = 59 MPa.
Figure 9 illustrates the experiment data for the two-level repeated block loading case, in which the fractions of damage under the higher stress level, nH/NH, are plotted against that under the lower stress level, nL/NL. In Figure 9, the LDR line is drawn for comparison. It can be seen that the damage fractions of the two-level repeated block loading cases (both the constant cyclic ratio and the constant stress difference cases) are distributed around the D = 1 line. The results indicate that the two-level repeated loading does not bring any apparent effects on the damage accumulation comparing with the one-way two-block loading cases. As discussed above, in the constant cyclic ratio cases, the damage accumulation is dominated by the higher stress level when the higher stress cycles and the lower stress cycles are similar. However, in the case of constant stress difference, the data distribution is more dispersedly throughout the range from 0 to 1. That is to say, when the cycle number of the higher load changes, the damage fractions change accordingly. The result further proves that the damage accumulation in the repeated block loading conditions strongly depends on the higher loading level.
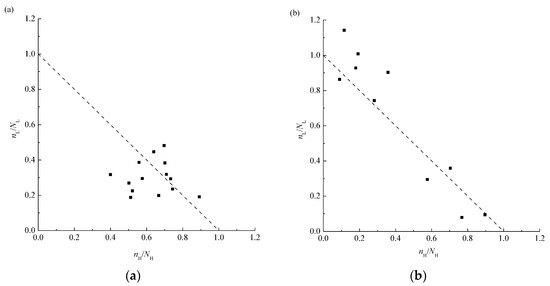
Figure 9.
Test results of the damage fractions under (a) nL/nH = 1 and (b) Δσ = 59 MPa.
In addition, the effects of cyclic ratio and stress difference on the fatigue life are also important. The sum of the cyclic ratio, Σ n/N, is introduced and the correlations between Σ n/N and loading variables (Δσ and nL/NL) are illustrated in Figure 10. It can be seen the Σ n/N does not change very much when the stress difference increases. It means that the influence of stress difference on the fatigue life would be very slight as long as the stress difference was not big enough to cause the over-load effect. It also can be found that the sum of the cyclic ratio increases with increasing proportion of the low-level load, which means that more cycles of the lower stress is able to extend the total fatigue life.
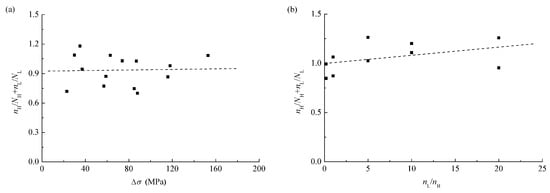
Figure 10.
Correlations between Δσ and nH/NH + nL/NL in the cases of (a) nL/nH = 1 and (b) Δσ = 59 MPa.
Overall, the damage accumulation under VAV is a complicated process coupled with influences of loading factors, in particular the impact may be significant if the over-load effect is activated by an enough large stress difference. It has been well proved that the tensile over-load can decelerate the damage accumulation so as to extend the fatigue life, while the compressive over-load would have adverse effect on the fatigue life. If the stress difference is too small to cause the over-load effect, the fatigue life would depend on the higher load level. Additionally, the over-load effect not only relates to the stress difference but also depends on the cyclic ratio. If the cycles of the low-level loading are far more than the higher-level ones, the over-load effect would be significant when the low-level load is applied. On the other hand, the fatigue life would be directly under the high-level load control when the cyclic ratio is relatively small.
The cycle number per loading block may also have impacts on the fatigue life. In the case that the cycle number is relatively large in each block, the higher load and the lower load affect the fatigue life more like separately rather than in a correlated way, in which the over-load/under-load effects are very slight. However, when the cycle number per block is small or the load alternates with a high amplitude, the over-load or the under-load effects would affect the damage accumulation apparently so that the total life of the structure may be much different.
5. Conclusions
The effect of loading sequence on fatigue damage is significant in the one-way two-level loading cases. The damage accumulation rates under different loading sequences can be ranked as H-L > CAV > L-H, and the corresponding fatigue lives can be ranked reversely.
The stress difference between loading levels has very slight effect on damage accumulation. However, under a given stress difference, the fatigue life increases apparently with decreasing higher stress level.
The cyclic ratio of the two-level repeated block loading has considerable influence on damage accumulation. Under certain loading cycles, the increase of the low-level stress proportion can decrease the damage accumulation rate so as to result in a longer fatigue life. However, this beneficial effect weakens with increasing numbers of the low-level stress cycle and will stop at some point.
For the CAV case, the NLCD has the best agreement with the experimental data. For the one-way two-level loading case, the NLDR shows the best accuracy but is complicated to apply because the parameters vary with loading condition, while the NLCD has the best compromise between the computational cost and the predicting accuracy. In the two-level repeated loading condition, the predicting performances of the LDR, the DCA, and the NLCD are similar.
Author Contributions
Jiewei Lin and Shuo Yang conceived and designed the experiments; Shuo Yang performed the experiments; Weidong Li analyzed the data; Junhong Zhang contributed materials and funds; Jiewei Lin wrote the paper.
Acknowledgments
The authors wish to acknowledge the financial support from the National Key R&D Program of China (2017YFB0103504).
Conflicts of Interest
The authors declare no conflict of interest.
References
- Donachie, M.J. Titanium: A Technical Guide; ASM International: Materials Park, OH, USA, 2000. [Google Scholar]
- Witek, L. Experimental crack propagation and failure analysis of the first stage compressor blade subjected to vibration. Eng. Fail. Anal. 2009, 16, 2163–2170. [Google Scholar] [CrossRef]
- Jeelani, S.; Ghebremedhin, S.; Musial, M. A study of cumulative fatigue damage in titanium 6Al-4V alloy. Int. J. Fatigue 1986, 8, 23–27. [Google Scholar] [CrossRef]
- Dattoma, V.; Giancane, S.; Nobile, R.; Panella, F.W. Fatigue life prediction under variable loading based on a new non-linear continuum damage mechanics model. Int. J. Fatigue 2006, 28, 89–95. [Google Scholar] [CrossRef]
- Aïd, A.; Amrouche, A.; Bouiadjra, B.B.; Benguediab, M.; Mesmacque, G. Fatigue life prediction under variable loading based on a new damage model. Mater. Des. 2011, 32, 183–191. [Google Scholar] [CrossRef]
- Pereira, H.F.; De Jesus, A.M.; Ribeiro, A.S.; Fernandes, A.A. Fatigue damage behavior of a structural component made of P355NL1 steel under block loading. J. Press. Vessel Technol. 2009, 131, 021407. [Google Scholar] [CrossRef]
- Cortez, R.; Mall, S.; Calcaterra, J.R. Investigation of variable amplitude loading on fretting fatigue behavior of Ti–6Al–4V. Int. J. Fatigue 1999, 21, 709–717. [Google Scholar] [CrossRef]
- Jin, O.; Lee, H.; Mall, S. Investigation into cumulative damage rules to predict fretting fatigue life of Ti–6Al–4V under two-level block loading condition. Transactions of the American Society of Mechanical Engineers. J. Eng. Mater. Technol. 2003, 125, 315–323. [Google Scholar] [CrossRef]
- Mall, S.; Nicholas, T.; Park, T.-W. Effect of predamage from low cycle fatigue on high cycle fatigue strength of Ti–6Al–4V. Int. J. Fatigue 2003, 25, 1109–1116. [Google Scholar] [CrossRef]
- Casciati, F.; Casciati, S.; Faravelli, L.; Marzi, A. Fatigue damage accumulation in a Cu-based shape memory alloy: Preliminary investigation. Comput. Mater. Contin. 2011, 23, 287–306. [Google Scholar]
- Mutoh, Y.; Tanaka, K.; Kondoh, M. Fretting fatigue in SUP9 spring steel under random loading. JSME Int. J. Ser. 1 Solid Mech. Strength Mater. 1989, 32, 274–281. [Google Scholar] [CrossRef][Green Version]
- Dungey, C.; Bowen, P. The effect of combined cycle fatigue upon the fatigue performance of Ti–6Al–4V fan blade material. J. Mater. Process. Technol. 2004, 153, 374–379. [Google Scholar] [CrossRef]
- Kinyon, S.E.; Hoeppner, D.W. Spectrum load effects on the fretting behavior of Ti–6Al–4V. In Fretting Fatigue: Current Technology and Practices; ASTM International: Materials Park, OH, USA, 2000. [Google Scholar]
- Zhu, S.-P.; Yue, P.; Yu, Z.-Y.; Wang, Q. A combined high and low cycle fatigue model for life prediction of turbine blades. Materials 2017, 10, 698. [Google Scholar] [CrossRef] [PubMed]
- Mlikota, M.; Schmauder, S.; Božić, Ž.; Hummel, M. Modelling of overload effects on fatigue crack initiation in case of carbon steel. Fatigue Fract. Eng. Mater. Struct. 2017, 40, 1182–1190. [Google Scholar] [CrossRef]
- Yuan, H.; Zhang, W.; Kim, J.; Liu, Y. A nonlinear grain-based fatigue damage model for civil infrastructure under variable amplitude loads. Int. J. Fatigue 2017, 104, 389–396. [Google Scholar] [CrossRef]
- Salvati, E.; Sui, T.; Zhang, H.; Lunt, A.J.G.; Fong, K.S.; Song, X.; Korsunsky, A.M. Elucidating the mechanism of fatigue crack acceleration following the occurrence of an underload Advanced Engineering. Materials 2016, 18, 2076–2087. [Google Scholar]
- Li, Y.; Aubin, V.; Rey, C.; Bompard, P. The effects of variable stress amplitude on cyclic plasticity and microcrack initiation in austenitic steel 304 L. Comput. Mater. Sci. 2012, 64, 7–11. [Google Scholar] [CrossRef]
- Miner, M.A. Cumulative damage in fatigue. J. Appl. Mech. 1945, 12, A159–A164. [Google Scholar]
- Marco, S.; Starkey, W. A concept of fatigue damage. Trans. ASME 1954, 76, 627–632. [Google Scholar]
- De Jesus, A.M.; Ribeiro, A.S.; Fernandes, A.N.A. Finite element modelling of fatigue damage using a continuum damage mechanics approach. In Proceedings of the ASME/JSME 2004 Pressure Vessels and Piping Conference, San Diego, CA, USA, 25–29 July 2004; American Society of Mechanical Engineers: New York, NY, USA, 2004; pp. 3–12. [Google Scholar]
- Manson, S.; Halford, G.R. Practical implementation of the double linear damage rule and damage curve approach for treating cumulative fatigue damage. Int. J. Fract. 1981, 17, 169–192. [Google Scholar] [CrossRef]
- Rabotnov, Y.N. Creep Problems in Structural Members; North-Holland Pub. Co.: Amsterdam, The Netherlands, 1969. [Google Scholar]
- Chaboche, J.L.; Lesne, P.M. A non-linear continuous fatigue damage model. Fatigue Fract. Eng. Mater. Struct. 1988, 11, 1–17. [Google Scholar] [CrossRef]
- Schijve, J. Fatigue of Structures and Materials; Springer: New York, NY, USA, 2001. [Google Scholar]


© 2018 by the authors. Licensee MDPI, Basel, Switzerland. This article is an open access article distributed under the terms and conditions of the Creative Commons Attribution (CC BY) license (http://creativecommons.org/licenses/by/4.0/).