Abstract
High-pressure torsion (HPT) is applied to a face-centered cubic CoCrFeMnNi high-entropy alloy at 293 and 77 K. Processing by HPT at 293 K produced a nanostructure consisted of (sub)grains of ~50 nm after a rotation for 180°. The microstructure evolution is associated with intensive deformation-induced twinning, and substructure development resulted in a gradual microstructure refinement. Deformation at 77 K produces non-uniform structure composed of twinned and fragmented areas with higher dislocation density then after deformation at room temperature. The yield strength of the alloy increases with the angle of rotation at HPT at room temperature at the cost of reduced ductility. Cryogenic deformation results in higher strength in comparison with the room temperature HPT. The contribution of Hall–Petch hardening and substructure hardening in the strength of the alloy in different conditions is discussed.
1. Introduction
The concept of high-entropy alloys (HEAs) as a mixture of more than five metallic elements in equimolar proportions was proposed first by Yeh et al. in 2004 [1]. Due to increased configurational entropy, the HEAs were expected to exist in the form of a single solid solution phase while formation of intermetallic compounds and secondary phases would be suppressed. In reality, the microstructure of alloys of multiple principle elements is usually more complicated and can consist of a mixture of different phases including intermetallic ones [2]. Among many proposed HEA compositions, CoCrFeMnNi alloy indeed has a single phase disordered fcc microstructure [3,4,5]. Due to such a ’model’ structure, this alloy is currently one of the most studied HEAs so far.
It was found that the CoCrFeMnNi alloy demonstrated very high elongation (7080%), but rather low yield strength of 200 MPa at room temperature [6,7]. Strengthening of HEA can be achieved via microstructure refinement. A reduction of a grain size from 150 to 5 µm in the CoCrFeMnNi alloy increased the yield strength by a factor of two while maintained good ductility [6]. Severe plastic deformation of the CoCrFeNiMn alloy via high-pressure torsion (HPT) expectably refined the microstructure to a grain size d~40–50 nm and increased the microhardness of the alloy by a factor of ~3 [8,9,10]. The ultimate tensile strength of the alloy after HPT was found to be ~2000 MPa [8]. The formation of the nanostructure was attributed to fragmentation of nanotwins [8] and to accelerated atomic diffusivity under the shear strain during HPT [9]. However, the microstructure and mechanical properties evolution of the alloy was insufficiently studied. For instance, the evolution of tensile properties during HPT had not been studied yet. Besides, considerably higher intensity of deformation twinning in the alloy at cryogenic temperature was observed during tension [6,11] or rolling [12]. Increased susceptibility to twinning can significantly accelerate the microstructure refinement, as it was shown earlier [12,13,14]. However, no information on attempts of HPT of the CoCrFeMnNi HEA under cryogenic conditions was found in the literature.
Therefore, the aim of the present work was to investigate in details the microstructure and mechanical properties evolution of the high-entropy CoCrFeMnNi alloy during high-pressure torsion at room temperature and to evaluate the effect of temperature decrease to 77 K on structure and properties of the alloy.
2. Materials and Methods
The equiatomic alloy with the composition of CoCrFeMnNi was produced by arc melting of the components in high-purity argon inside a water-cooled copper cavity. The purities of the alloying elements were above 99.9 %. To ensure chemical homogeneity, the ingots were flipped over and re-melted at least five times. The produced ingots of the CoCrFeMnNi alloy had dimensions of about 6 × 15 × 60 mm3. Homogenization annealing was carried out at 1000 °C for 24 h [15,16]. Prior to homogenization, the samples were sealed in vacuumed (10−2 Torr) quartz tubes filled with titanium chips to prevent oxidation. After annealing, the tubes were removed from the furnace and the samples were cooled inside the vacuumed tubes down to room temperature. After the homogenization procedure, the alloy was cold rolled with ~80% height reduction and then annealed at 850 °C for 1 h to produce a recrystallized structure. The alloy after such a treatment is hereafter referred to as the initial condition in the current study.
For HPT processing discs measuring 15 mm diameter × 0.8 mm thick were cut from the recrystallized specimens, then ground and mechanically polished. The samples were subjected to HPT at 293 K (to 90, 180, or 720° of the anvils turn) or 77 K (to 180°) under a pressure of 4.3 GPa in a Bridgman anvil-type unit with a rate of 1 rpm using a custom-built computer-controlled HPT device (W. Klement GmbH, Lang, Austria). The corresponding shear strain level γ was calculated as [17]
where N is the number of revolutions, r is the radius, and h is the thickness of the specimen.
The microstructure of the alloys was studied using transmission (TEM) and scanning (SEM) electron microscopy and electron back-scattered diffraction (EBSD) analysis. For SEM observations the specimens were mechanically polished in water with different SiC papers and a colloidal silica suspension; the final size of the Al2O3 abrasive was 0.04 μm. The samples were examined after polishing without etching. The SEM back-scattered electron (BSE) images of microstructures in the initial condition were obtained using a FEI Quanta 3D microscope. EBSD was conducted in a FEI Nova NanoSEM 450 field emission gun SEM equipped with a Hikari EBSD detector and a TSL OIM™ system version 6.0. EBSD examinations with the step size of 50 nm were carried out in an axial section in three different characteristic areas: (i) in the central part of the disc, i.e., within ±0.5 mm of the center; (ii) at half of a radius, i.e., at ~3.5 mm from the center; (iii) at the edge, i.e., at ~6–7 mm from the center. The points with confidence index (CI) < 0.1 were excluded from the analysis; these points are shown with black color to avoid any artificial interference in the microstructure. In the presented inverse pole figure (IPF) maps, the high angle (>15°) and low angle (2–15°) boundaries are shown respectively as black and white lines.
TEM examination was performed in the mid-thickness shear plane of deformed samples in the vicinity (~1 mm away) of the edge. The samples for TEM analysis were prepared by conventional twin-jet electro-polishing of mechanically pre-thinned to 100 μm foils, in a mixture of 90% CH3COOH and 10% HClO4 at the 27 V potential at room temperature. TEM investigations were performed using JEOL JEM-2100 apparatus at accelerating voltage of 200 kV.
The dislocation density was determined using X-ray diffraction (XRD) profiles analysis obtained by a RIGAKU diffractometer with Cu Kα radiation at 45 kV and 35 mA as it was done earlier for the similar alloy [18]. The value of the dislocation density, ρ, was calculated using the equation [19]
where is microstrains, D is the crystallite size, and b is the Burgers vector. The microstrains, , and the crystallite size, D, values were estimated on the basis of the Williamson–Hall plot [20], using the equation
where βs is the corrected full width at half maximum (FWHM) of the selected Kα1 reflection of the studied material, Θ is the Bragg angle of the selected reflection, λ is the Kα1 wavelength, and K is Scherrer constant. In the present study, the FWHM values and the positions of fcc (111) and (222) reflections were determined and used for further calculations. The instrumental broadening was determined from the FWHM values of the annealed silicon powder.
Mechanical properties of the alloy after HPT were determined through tensile tests of flat dog-bone specimens with gauge measuring 5 mm length × 1 mm width × 0.6 mm thickness. The samples for the tensile tests were cut from the HPT-processed discs using an electric discharge machine so that the gage was located at a distance of ~3.5 mm from the sample center. The specimens were then pulled at a constant crosshead speed of 3 mm/min (strain rate of 0.01 s−1) in a custom built computer controlled tensile stage for miniature samples to fracture. The stress–strain curves were obtained using a high-precision laser extensometer.
3. Results
In the initial condition the CoCrFeNiMn alloy had an fcc single-phase microstructure (Figure 1a). An SEM-BSE image shows a homogeneous microstructure with a grain size of ~15 µm (Figure 1b). Numerous annealing twins were found inside grains. Some pores visible as black dots can also be found in the microstructure.
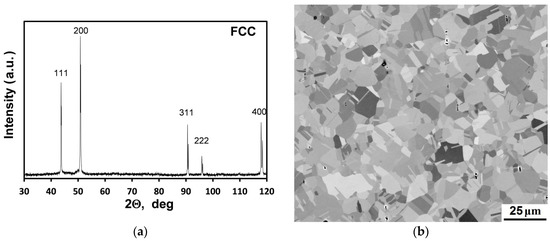
Figure 1.
Microstructure of the initial condition of the CoCrFeNiMn alloy: (a) XRD pattern; (b) SEM-BSE image.
The influence of HPT on the microstructure depended essentially on the distance from the specimen center (Figure 2). In comparison with the initial condition, a rotation of 90° at room temperature resulted in rather small changes in the microstructure (Figure 2a) associated with the formation of low-angle boundaries in some grains and appearance of individual deformation twins. It should be noted that boundaries of both deformation and annealing twins are crystallographycally identical. However, deformation twins are usually much thinner than annealing twins and intersect grains. The thickness of deformation twins in a single phase fcc microstructure is usually several tens of nanometers [12,21], whereas the thickness of annealing twins can reach several micrometers [22]. Some of the deformation twins are indicated with arrows in Figure 2b,c. The analysis of the EBSD data showed that observed (both annealing and deformation) twins belong to (111) <112> system with twin/matrix misorientation of 60° around <111>. An increase in the number of deformation twins and the development of substructure (sometimes appearing as black, poorly distinguished areas mainly in the vicinity of twin or grain boundaries) with the increase of imposed strain can be observed (Figure 2b,c).
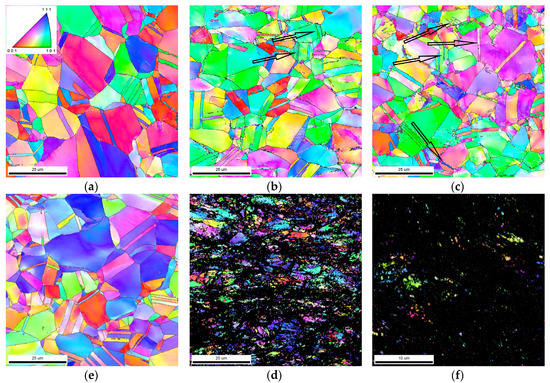
Figure 2.
EBSD IPF maps of the CoCrFeNiMn alloy after HPT at 293 K: (a,d) central part of the specimen; (b,e) half-radius; (c,f) edge of the specimens; (a–c) 90° and (d–f) 180° rotation. The corresponding true shear strain is (a) 1.1; (b) 8.4; (c) 13.5; (d) 2.2; (e) 16.8; (f) 26.9. The color code is inserted in Figure 2a. The deformation twins are indicated with arrows in Figure 2b,c.
The central part of the specimens after rotation for 180° (Figure 2d) had a microstructure very similar to that observed after 90° rotation; i.e., only little changes can be observed in comparison with the initial microstructure. This is possibly due to relatively low true strain in the central part of both specimens (ε ≤ 2.2). However, much more pronounced changes were observed at larger strain (Figure 2e,f). The microstructure at the half-radius consisted of relatively large areas of 5–7 µm with developed substructure and small fragments of ~0.5 µm (Figure 2e). Due to a high level of internal stresses which prevents obtaining identifiable Kikuchi patterns, a considerable part of the EBSD map was presented by black dot areas with a low CI. The comparison with the IPF map of the edge part of the specimen after the rotation for 90° (Figure 2c) suggests that the true shear strain of ~15 is required to produce a significant fraction of such highly-deformed areas.
At the edge of the specimen, the average size of the visible fragments decreased to ~0.5 µm (Figure 2f). However, the black dot areas with low CI occupied the majority of the scanned area thereby suggesting a very high level of internal stresses and considerable microstructure refinement. This finding is in good agreement with an increase in the true shear strain to 26.9. Detailed TEM analysis of the microstructure of those severely deformed areas is given below. Note that EBSD analysis of the sample after the rotation for 720° has produced IPF maps almost completely occupied with black dots both at the center, half-radius, and edge of the specimen that most likely associated with a considerable increase in homogeneity of the microstructure refinement. The corresponding images are not shown as they do not present any meaningful information.
The effect of a decrease in deformation temperature to 77 K was studied after the rotation for 180° (Figure 3). Microstructure changes in comparison with the specimen deformed at room temperature (Figure 2d-f) depended considerably on the examined part of the disk and the imposed strain. Microstructure of the central part of the specimen deformed at 77 K (Figure 3a) was evidentially more refined than that at room temperature (Figure 2d) and consisted of rather large areas of ~8 µm which contained individual twins and relatively poor developed substructure. Low quality of the EBSD map in between these areas indicated quite a high level of internal stresses, most likely due to strain localization. Small fragments < 1 µm in diameter were observed in severely deformed areas. Higher strain level obtained at the half of radius (ε = 16.8, Figure 3b) resulted in a microstructure which is quite similar to that at room temperature (Figure 2e). At the edge of specimens the microstructure after HPT at 77 K (Figure 3c) had an obvious metallographic texture with fragments elongated along the shear direction. The size of the majority of the fragments was quite small (0.2–0.4 µm). However, big fragments > 2 µm with poorly developed substructure were also observed in the microstructure. In addition, the fraction of visible fragments was greater than that after room temperature HPT (Figure 2f) that can suggest lower level of internal stresses in the former case.
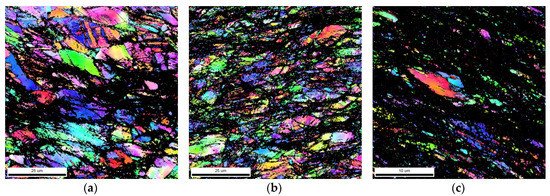
Figure 3.
Microstructure of the CoCrFeNiMn alloy after HPT at temperature of 77 K to 180°: (a) central part; (b) half-radius; (c) edge. The corresponding true shear strain is (a) 2.2; (b) 16.8; (c) 26.9.
TEM micrographs of the CoCrFeNiMn alloy microstructure after HPT at room temperature is shown in Figure 4. After HPT rotation for 90° at 293 K (Figure 4a,b) the microstructure at the edge of specimens consisted of crossing deformation twins of 50–100 nm width (corresponding diffraction pattern inserted in Figure 4a) and high dislocation density. Twins either spaced 0.5–1 µm apart (Figure 4a) or cluster together with the formation of twin bundles (Figure 4b). After the rotation for 180° at room temperature the microstructure at the edge of specimens was considerably refined (Figure 4c,d). Although the microstructure can be mainly described as a cellular one with a very high dislocation density (Figure 4c), very small grains of ~50 nm can also be recognized at larger magnification. Twin boundaries were not detected in the microstructure. However, a chain of small elongated (sub)grains in some places (indicated with dotted lines in Figure 4d) suggested that these grains can originated from twins. Rotation for 720° resulted in the formation of a homogeneous ultra-fine microstructure consisted of irregular dislocation pile-ups of different shapes and sizes and very small grains with a size of ~20–60 nm (Figure 4e,f). The diffraction pattern consisted of rings with many diffracted beams indicating the presence of many small (sub)grains with mainly high misorientation angle boundaries within the selected field of view (insert on Figure 4e).
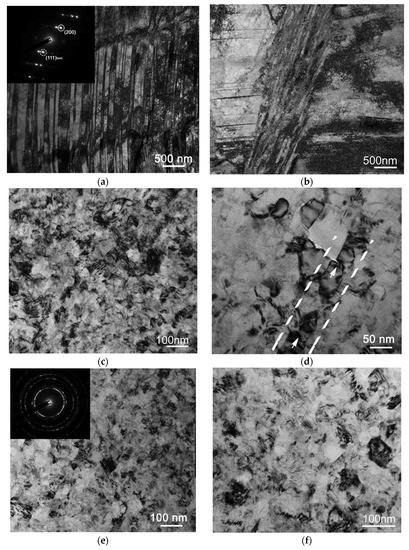
Figure 4.
TEM images of CoCrFeNiMn alloy microstructure at the edge of specimens after HPT at temperature of 293 K to: (a,b) 90° (true strain of ≈12); (c,d) 180° (true strain ≈25); (e,f) 720° (true strain ≈50). Elongated (sub)grains and transverse subboundaries are indicated with dash lines and arrows, respectively in Figure 4d.
In contrast to the room-temperature deformation (Figure 4c,d), the microstructure observed after HPT at 77 K was found to be highly inhomogeneous (Figure 5). It consisted of areas with twin bundles and structure with high dislocation density and subgrain orientation (Figure 5a). The selected area diffraction pattern (insert in Figure 5a) was obtained from a crystallite with zone axis [02]; within these crystallite areas, with both twin and subgrain structure can be observed. The reflexes characterizing the twin orientation are indexed on the diffraction pattern. The matrix reflexes show azimuthal spread, thereby suggesting the presence of small misorientations inside the crystallite. An example of such microstructure is shown in the Figure 5b. The microstructure revealed sites of different shapes and sizes with low-angle misorientation between them; meanwhile, no grains were observed in the microstructure (Figure 5b).
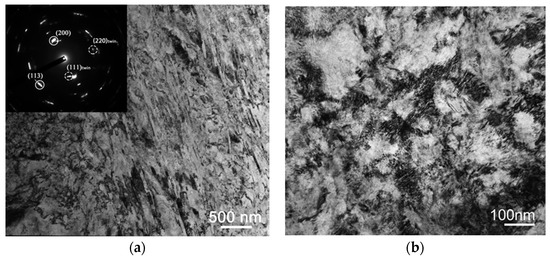
Figure 5.
TEM image of the CoCrFeNiMn alloy microstructure at the edge of specimens after HPT at temperature of 77 K to 180° (true strain ~25). (a) low magnification; (b) high magnification.
According to the XRD analysis, the dislocation density after cryogenic deformation was 2.9 × 10¹⁵ m−2. In comparison, after similar processing at room temperature the dislocation density was 9.14 × 10¹⁴ m−2, i.e., three-fold increase in dislocation density due to decrease of HPT temperature occurred. In turn, the imposed strain at room temperature had weakly affected the dislocation density. For example, the dislocation density values after rotations for 90° and 720° were 1.48 × 10¹⁵ m−2 and 8.86 × 10¹⁴ m−2, respectively, i.e., they were rather similar to each other and to dislocation density after rotation for 180° at room temperature.
Tensile stress–strain curves of the alloy are shown in Figure 6. The resulting mechanical properties including yield strength (YS), ultimate tensile strength (UTS), uniform elongation (UE), and total elongation (TE), are summarized in Table 1. Already after a rotation for 90° the alloy had a high ultimate tensile strength approaching 1 GPa but rather limited ductility of ~12%. Increasing HPT rotation from 90° to 180° resulted in a moderate rise in strength and a pronounced decrease in ductility to ~5%. At further increase in strain to two full rotations (720°) the strength of the alloy increased considerably (approximately by a factor of 2) while the ductility decreased moderately. A decrease in temperature of HPT from 293 to 77 K considerably increased the strength of the alloy but not affected ductility much. All flow curves exhibited a peak flow stress at the initial stages of deformation followed by a moderate decrease in flow stress. The uniform elongation of the alloy was rather small in all cases which is quite typical of severely deformed materials [23]. However, after strain localization (at the maximum flow stress), when the plastic deformation had become concentrated in the neck, the alloy had showed quite pronounced additional elongation.
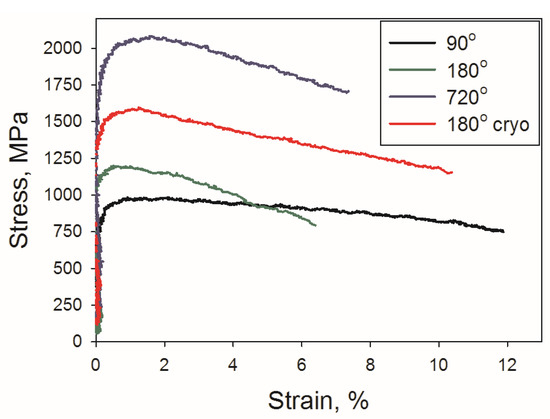
Figure 6.
Engineering stress–strain curves obtained during tensile tests of the CoCrFeNiMn alloy after HPT at 293 and 77 K.

Table 1.
Tensile mechanical properties 1 of the CoCrFeNiMn alloy after HPT at 293 and 77 K.
4. Discussion
The results of the present work clearly demonstrate that the microstructure development in the CoCrFeNiMn alloy during HPT strongly depended on both the imposed strain (i.e., the angle of rotation and the distance from the center of the discs) and deformation temperature. At room temperature, the formation of ultra-fine grained (UFG) structure on the periphery of the HPT discs occurred quite fast: 50 nm-sized (sub)grains were observed after a 180° turn (Figure 4c,d). Fast kinetics of microstructure evolution in the alloy during HPT has been already reported [9]. However, it should be noted that the microstructure developed in the beginning of HPT-straining was highly heterogeneous (Figure 2d–f). In the center of the discs, initial grains with weakly developed deformation twins/substructure had survived even after rotation for 180° (Figure 2d). This is an obvious result of a strong gradient of the imposed strain along the radius of the discs and is typical of the HPT process [17]. Meanwhile, according to the present results, homogenous UFG microstructure can be produced after the rotation for 720°.
Formation of UFG microstructure after HPT at room temperature is well documented for various metallic materials [17] including high-entropy alloys [8,9,10,24,25,26]. The microstructure evolution during HPT is usually associated with the formation of low-angle grain boundaries at low strains and transformation of some of these low-angle subgrain boundaries into high-angle grain boundaries at higher strains giving rise to a considerable microstructure refinement. However, in the materials that deform by both twinning and slip the kinetics of microstructure refinement can be enhanced due to intensive twin formation [12,13,14]. Thin twin laths which are separated from the matrix by high-angle boundaries readily transform into a chain of grains during deformation. This process is particularly relevant during initial stages of deformation when the number of twins and the density of high-angle twin boundaries are the highest [13]. It is already established that mechanical twinning can occur in the CoCrFeNiMn alloy during plastic deformation at room temperature, however, the extent and the role of twinning in microstructure development remains quite debatable [11,12,27,28].
The results of the present work indicate that twinning during HPT develops at the edge of specimens till rather small strains (rotation for ~90°, Figure 4a,b). The occurrence of twinning during HPT observed in the present study is in agreement with the results of previous investigations [8,9]. At later stages of strain (rotation for 180°), an equiaxed structure composed of a mixture of dislocation cells and grains was observed (Figure 4c). In general the process of the equiaxed fine-grained structure formation can be associated with: (i) deformation-induced twinning; (ii) fragmentation of twin laths by secondary twinning and/or transverse subboundaries (indicated with arrows in Figure 4d); (iii) formation of low-angle boundaries in those parts of microstructure which were not involved into twinning; and (iv) further increase of their misorientation to the high-angle range due to interaction with lattice dislocation like it was observed in different metallic materials—including titanium, copper based alloys, austenitic steel and some others [17,29,30,31,32]. Finally, these processes are likely to be responsible for the microstructure refinement at large strain (Figure 4e,f). This behavior is similar to that observed during room-temperature rolling of the same alloy [12]. Therefore, fast kinetics of the microstructure refinement in the CoCrFeNiMn alloy during HPT can be attributed to extensive deformation twinning which readily occurs at the early stages of deformation.
The effect of twinning on microstructure refinement should be sensitive to deformation temperature. Since the critical resolved shear stress (CRSS) for twinning in various metals and alloys depends weakly on temperature compared to that for slip [33], a decrease in deformation temperature from 293 to 77 K was believed to have resulted in more intensive twinning and increased kinetics of microstructure refinement [12,13]. However, a decrease in deformation temperature in case of HPT of the CoCrFeNiMn alloy leaded to the formation of a highly inhomogeneous microstructure composed of a mixture of twinned and fragmented areas (Figure 5). This is possibly a result of considerable increase in strength (approximately by a factor of 2 [6]) due to the lower temperature which increased strain localization and could provoke slippage of anvils at HPT and, thus, reduction of the actually imposed strain. However, the dislocation density estimated using XRD (Table 2) after cryo-deformation was considerably higher than that after room temperature HPT. This finding does not agree with the results of the dislocation density measurements during rolling at 77 K and 293 K [12]. During rolling, active twinning at 77 K promoted microstructure refinement. Possibly, dislocation mechanisms play more important role in cryo-HPT of the CoCrFeNiMn alloy than during HPT at room temperature, and therefore, the formation of homogeneous UFG structure occurs slower under cryogenic conditions.
Table 2.
Input parameters and results of calculation for the evaluation of contributions of the Hall–Petch and substructure hardening mechanisms.
The microstructure analysis is in reasonable agreement with the results of mechanical properties. The observed microstructure refinement during HPT at room temperature was accompanied by a considerable rise in strength and some decrease in ductility (Figure 6). It should be noted, however, that the difference in the microstructure in terms of (sub)grain size and dislocation density (Table 2) was negligible between the specimens processed for 180° or 720° turns. Meanwhile, the alloy after rotation for 720° was found to be approximately 30% stronger than that after strain to 180°. Also, strength of the cryo-deformed alloy was substantially higher than that of the specimen after room temperature HPT despite highly inhomogeneous, coarser microstructure.
The contributions of the most relevant hardening mechanisms in strength of the deformed alloy can be expressed as
where σ0 denotes the friction stress, σρ is the substructure hardening and σH−P is the Hall–Petch hardening. The substructure hardening σρ can be expressed as
where M is the average Taylor factor, α is a constant, G is the shear modulus, b is the Burgers vector, and ρ is the dislocation density. The Hall–Petch contribution to the strength is typically of the form
in which Ky is the Hall–Petch coefficient and d is the grain size.
The dislocation density was found to be quite similar for the specimens processed for 180° or 720° at room temperature (Table 2). This result is in agreement with the equality of measured size of cells or subgrains in both structures since it is well established that dsub~ [34], where dsub—is the average size of subgrains. Therefore, it can be assumed that the only relevant factor which changes during HPT of the alloy from 180° to 720° strain is the grain size. Here the “grain” term is used to denote the crystallites bordered by high (≥ 15°) angle boundaries. The evolution of grain size during deformation was evaluated using equation (1); the input parameters for calculation were: Ky = 0.494 MPa m1/2 and σ0 = 125 MPa (both parameters were taken from [6]), M = 3, α = 0.2, G = 81 GPа [35], b = 2.54 × 10⁻¹⁰ m [28]. Estimated dislocation densities and yield stress are tabulated in Table 2.
The best fit of experimental results was obtained when the grain sizes take on values shown in Table 2. Although microstructural investigation did not obviously support these findings, the obtained data seems quite reasonable. At the initial stages of deformation the fraction of the high-angle boundaries is rather low and consists of initial grain boundaries and boundaries of deformation twins. Therefore, the effective grain size should be approximately equal to the average space between twin boundaries. This similarity can indeed be observed in the microstructure.
During further deformation, new grains developed in place of subgrains within initial grains. This is a result of gradual transformation of geometrically necessary boundaries, which separate microvolumes with different combinations of slip systems [36], from low-angle subboundaries into high-angle grain boundaries. The fraction of high-angle grain boundaries gradually increased, thereby decreasing the effective grain size. At the final stages of HPT all sub-boundaries are expected to be transformed into boundaries; this situation was nearly reached after the rotation for 720° when the calculated grain size was only three times larger than the measured size of subgrains. Taking into account some decrease in strain along the radius (the yield stress was measured exactly at the middle of radius, while TEM investigations were performed closer to the edge of the discs) than the point where the microstructure was analyzed) this approximation can be considered quite reasonable.
The results of the calculation show that the Hall–Petch hardening contribution increased with strain while the substructure hardening maintained at approximately the same level (Table 2, Figure 7). Thus, the Hall–Petch hardening contribution becomes much more important than the substructure hardening in samples rotated for angles larger than 180°. This result is in good agreement with data reported earlier for the nanocrystalline HEA [37].
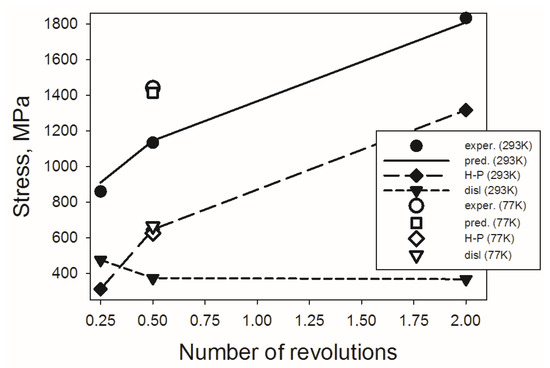
Figure 7.
The contributions of different hardening mechanisms in strength of CoCrFeNiMn alloy during HPT at 293 K and 77 K. Exper. – experimental yield stress; pred. – predicted yield stress, obtained from. Equation (4); H-P - Hall–Petch hardening; disl - substructure hardening. Temperatures of HPT are indicated in brackets.
It is worth noting that, according to the calculations, the effective grain size in the CoCrFeNiMn alloy after HPT at 293 and 77 K is approximately equal (Table 2). Higher strength of the sample deformed in cryogenic condition can be ascribed to the contribution of substructure (dislocation) hardening. After the rotation for 180° at cryogenic temperature, the contribution of the substructure hardening is comparable to that of the Hall–Petch hardening (Figure 7).
5. Conclusions
Microstructure evolution and mechanical properties of CoCrFeMnNi high-entropy alloy during high-pressure torsion (HPT) at 293 and 77 K was studied. Following conclusions were made:
- (1)
- HPT processing at room temperature results in the formation of in inhomogeneous severely deformed microstructure with (sub)grains of ~50 nm already after the rotation for 180°. The microstructure evolution was associated with intensive deformation-induced twinning, and substructure development resulted in a gradual microstructure refinement.
- (2)
- HPT at 77 K produced more heterogeneous structure in comparison with the room-temperature deformation. The dislocation density was much higher after cryogenic deformation.
- (3)
- Tensile strength of the alloy after HPT at 293 K was found to be strongly dependent on HPT strain. The ultimate tensile strength increased from 981 to 2069 MPa when the rotation angle at HPT increased from 90° to 720°. In all examined conditions, the alloy exhibited limited ductility.
- (4)
- A decrease of HPT temperature from 293 to 77 K resulted in higher tensile strength. A rotation for 180° resulted in the ultimate tensile strength of 1193 MPa and 1596 MPa after processing at room and cryogenic temperature, respectively.
- (5)
- An increase of yield strength of the alloy with an increase of the angle of rotation can mostly be ascribed to a contribution of Hall–Petch strengthening. In turn, higher strength of the alloy after HPT at 77 K was attributed to substructure (dislocation) hardening.
Acknowledgments
This study was supported by Russian Foundation for Basic Research (grant no. 16-38-60061). Authors are thankful to J. Beach for performing tensile tests. The authors are also grateful to the personnel of the Joint Research Center, “Technology and Materials”, Belgorod State National Research University, for their assistance with the instrumental analysis.
Author Contributions
Sergey Zherebtsov, Yuliya Ivanisenko, Nikita Stepanov, and Gennady Salishchev conceived and designed the experiments. Dmitry Shaysultanov, Nikita Yurchenko, Margarita Klimova and Yuliya Ivanisenko performed the experiments. Gennady Salishchev, Nikita Stepanov and Sergey Zherebtsov analyzed the data and wrote the paper.
Conflicts of Interest
The authors declare no conflict of interest.
References
- Yeh, J.-W.; Chen, S.-K.; Lin, S.-J.; Gan, J.-Y.; Chin, T.-S.; Shun, T.-T.; Tsau, C.-H.; Chang, S.-Y. Nanostructured High-Entropy Alloys with Multiple Principal Elements: Novel Alloy Design Concepts and Outcomes. Adv. Eng. Mater. 2004, 6, 299–303. [Google Scholar] [CrossRef]
- Miracle, D.B.; Senkov, O.N. A critical review of high entropy alloys and related concepts. Acta Mater. 2017, 122, 448–511. [Google Scholar] [CrossRef]
- Cantor, B.; Chang, I.T.H.; Knight, P.; Vincent, A.J.B. Microstructural development in equiatomic multicomponent alloys. Mater. Sci. Eng. A 2004, 375, 213–218. [Google Scholar] [CrossRef]
- Otto, F.; Yang, Y.; Bei, H.; George, E.P.P. Relative effects of enthalpy and entropy on the phase stability of equiatomic high-entropy alloys. Acta Mater. 2013, 61, 2628–2638. [Google Scholar] [CrossRef]
- Laurent-Brocq, M.; Akhatova, A.; Perrière, L.; Chebini, S.; Sauvage, X.; Leroy, E.; Champion, Y. Insights into the phase diagram of the CrMnFeCoNi high entropy alloy. Acta Mater. 2015, 88, 355–365. [Google Scholar] [CrossRef]
- Otto, F.; Dlouhý, A.; Somsen, C.; Bei, H.; Eggeler, G.; George, E.P. The influences of temperature and microstructure on the tensile properties of a CoCrFeMnNi high-entropy alloy. Acta Mater. 2013, 61. [Google Scholar] [CrossRef]
- Gali, A.; George, E.P. Tensile properties of high- and medium-entropy alloys. Intermetallics 2013, 39, 74–78. [Google Scholar] [CrossRef]
- Schuh, B.; Mendez-Martin, F.; Völker, B.; George, E.P.P.; Clemens, H.; Pippan, R.; Hohenwarter, A.; Völker, B.; George, E.P.P.; Clemens, H.; et al. Mechanical properties, microstructure and thermal stability of a nanocrystalline CoCrFeMnNi high-entropy alloy after severe plastic deformation. Acta Mater. 2015, 96, 258–268. [Google Scholar] [CrossRef]
- Lee, D.-H.; Choi, I.-C.; Seok, M.-Y.; He, J.; Lu, Z.; Suh, J.-Y.; Kawasaki, M.; Langdon, T.G.; Jang, J. Nanomechanical behavior and structural stability of a nanocrystalline CoCrFeNiMn high-entropy alloy processed by high-pressure torsion. J. Mater. Res. 2015, 30, 2804–2815. [Google Scholar] [CrossRef]
- Heczel, A.; Kawasaki, M.; Lábár, J.L.; Jang, J.; Langdon, T.G.; Gubicza, J. Defect structure and hardness in nanocrystalline CoCrFeMnNi High-Entropy Alloy processed by High-Pressure Torsion. J. Alloy. Compd. 2017, 711, 143–154. [Google Scholar] [CrossRef]
- Laplanche, G.; Kostka, A.; Horst, O.M.M.; Eggeler, G.; George, E.P.P. Microstructure evolution and critical stress for twinning in the CrMnFeCoNi high-entropy alloy. Acta Mater. 2016, 118, 152–163. [Google Scholar] [CrossRef]
- Stepanov, N.; Tikhonovsky, M.; Yurchenko, N.; Zyabkin, D.; Klimova, M.; Zherebtsov, S.; Efimov, A.; Salishchev, G. Effect of cryo-deformation on structure and properties of CoCrFeNiMn high-entropy alloy. Intermetallics 2015, 59, 8–17. [Google Scholar] [CrossRef]
- Zherebtsov, S.V.; Dyakonov, G.S.; Salem, A.A.; Sokolenko, V.I.; Salishchev, G.A.; Semiatin, S.L. Formation of nanostructures in commercial-purity titanium via cryorolling. Acta Mater. 2013, 61, 1167–1178. [Google Scholar] [CrossRef]
- Zherebtsov, S.V.; Dyakonov, G.S.; Salishchev, G.A.; Salem, A.A.; Semiatin, S.L. The Influence of Grain Size on Twinning and Microstructure Refinement during Cold Rolling of Commercial-Purity Titanium. Metall. Mater. Trans. A 2016, 47, 5101–5113. [Google Scholar] [CrossRef]
- Salishchev, G.A.; Tikhonovsky, M.A.; Shaysultanov, D.G.; Stepanov, N.D.; Kuznetsov, A.V.; Kolodiy, I.V.; Tortika, A.S.; Senkov, O.N. Effect of Mn and V on structure and mechanical properties of high-entropy alloys based on CoCrFeNi system. J. Alloy. Compd. 2014, 591, 11–21. [Google Scholar] [CrossRef]
- Stepanov, N.D.; Shaysultanov, D.G.; Salishchev, G.A.; Tikhonovsky, M.A.; Oleynik, E.E.; Tortika, A.S.; Senkov, O.N. Effect of V content on microstructure and mechanical properties of the CoCrFeMnNiVx high entropy alloys. J. Alloy. Compd. 2015, 628, 170–185. [Google Scholar] [CrossRef]
- Zhilyaev, A.P.; Langdon, T.G. Using high-pressure torsion for metal processing: Fundamentals and applications. Prog. Mater. Sci. 2008, 53, 893–979. [Google Scholar] [CrossRef]
- Stepanov, N.D.; Shaysultanov, D.G.; Chernichenko, R.S.; Yurchenko, N.Y.; Zherebtsov, S.V.; Tikhonovsky, M.A.; Salishchev, G.A. Effect of thermomechanical processing on microstructure and mechanical properties of the carbon-containing CoCrFeNiMn high entropy alloy. J. Alloy. Compd. 2017, 693, 394–405. [Google Scholar] [CrossRef]
- Smallman, R.E.; Westmacott, K.H. Stacking faults in face-centred cubic metals and alloys. Philos. Mag. 1957, 2, 669–683. [Google Scholar] [CrossRef]
- Williamson, G.K.; Hall, W.H. X-ray line broadening from filed aluminium and wolfram. Acta Metall. 1953, 1, 22–31. [Google Scholar] [CrossRef]
- Klimova, M.; Zherebtsov, S.; Stepanov, N.; Salishchev, G.; Haase, C.; Molodov, D.A. Microstructure and texture evolution of a high manganese TWIP steel during cryo-rolling. Mater. Charact. 2017, 132, 20–30. [Google Scholar] [CrossRef]
- Odnobokova, M.; Tikhonova, M.; Belyakov, A.; Kaibyshev, R. Development of S3n CSL boundaries in austenitic stainless steels subjected to large strain deformation and annealing. J. Mater. Sci. 2017, 52, 4210–4223. [Google Scholar] [CrossRef]
- Zherebtsov, S.; Kudryavtsev, E.; Kostjuchenko, S.; Malysheva, S.; Salishchev, G. Strength and ductility-related properties of ultrafine grained two-phase titanium alloy produced by warm multiaxial forging. Mater. Sci. Eng. A 2012, 536, 190–196. [Google Scholar] [CrossRef]
- Tang, Q.H.; Huang, Y.Y.; Huang, Y.Y.; Liao, X.Z.; Langdon, T.G.; Dai, P.Q. Hardening of an Al0.3CoCrFeNi high entropy alloy via high-pressure torsion and thermal annealing. Mater. Lett. 2015, 151, 126–129. [Google Scholar] [CrossRef]
- Shahmir, H.; He, J.; Lu, Z.; Kawasaki, M.; Langdon, T.G. Effect of annealing on mechanical properties of a nanocrystalline CoCrFeNiMn high-entropy alloy processed by high-pressure torsion. Mater. Sci. Eng. A 2016, 676, 294–303. [Google Scholar] [CrossRef]
- Moon, J.; Qi, Y.; Tabachnikova, E.; Estrin, Y.; Choi, W.-M.; Joo, S.-H.; Lee, B.-J.; Podolskiy, A.; Tikhonovsky, M.; Kim, H.S. Deformation-induced phase transformation of Co20Cr26Fe20Mn20Ni14 high-entropy alloy during high-pressure torsion at 77 K. Mater. Lett. 2017, 202, 86–88. [Google Scholar] [CrossRef]
- Joo, S.-H.; Kato, H.; Jang, M.J.; Moon, J.; Tsai, C.W.; Yeh, J.W.; Kim, H.S. Tensile deformation behavior and deformation twinning of an equimolar CoCrFeMnNi high-entropy alloy. Mater. Sci. Eng. A 2017, 689, 122–133. [Google Scholar] [CrossRef]
- Jang, M.J.; Ahn, D.-H.; Moon, J.; Bae, J.W.; Yim, D.; Yeh, J.-W.; Estrin, Y.; Kim, H.S. Constitutive modeling of deformation behavior of high-entropy alloys with face-centered cubic crystal structure. Mater. Res. Lett. 2017, 5, 350–356. [Google Scholar] [CrossRef]
- Zherebtsov, S.; Lojkowski, W.; Mazur, A.; Salishchev, G. Structure and properties of hydrostatically extruded commercially pure titanium. Mater. Sci. Eng. A 2010, 527, 5596–5603. [Google Scholar] [CrossRef]
- Salishchev, G.; Mironov, S.; Zherebtsov, S.; Belyakov, A. Changes in misorientations of grain boundaries in titanium during deformation. Mater. Charact. 2010, 61, 732–739. [Google Scholar] [CrossRef]
- Sakai, T.; Belyakov, A.; Kaibyshev, R.; Miura, H.; Jonas, J.J. Dynamic and post-dynamic recrystallization under hot, cold and severe plastic deformation conditions. Prog. Mater. Sci. 2014, 60, 130–207. [Google Scholar] [CrossRef]
- Templeman, Y.; Ben Hamu, G.; Meshi, L. Friction stir welded AM50 and AZ31 Mg alloys: Microstructural evolution and improved corrosion resistance. Mater. Charact. 2017, 126, 86–95. [Google Scholar] [CrossRef]
- Meyers, M.A.; Vöhringer, O.; Lubarda, V.A. The onset of twinning in metals: A constitutive description. Acta Mater. 2001, 49, 4025–4039. [Google Scholar] [CrossRef]
- Hull, D.; Bacon, D.J. Introduction to Dislocations; Butterworth-Heinemann: Oxford, UK, 2011; ISBN 9780080966724. [Google Scholar]
- Laplanche, G.; Gadaud, P.; Horst, O.; Otto, F.; Eggeler, G.; George, E.P.P. Temperature dependencies of the elastic moduli and thermal expansion coefficient of an equiatomic, single-phase CoCrFeMnNi high-entropy alloy. J. Alloy. Compd. 2015, 623, 348–353. [Google Scholar] [CrossRef]
- Hughes, D.; Hansen, N. Microstructure and strength of nickel at large strains. Acta Mater. 2000, 48, 2985–3004. [Google Scholar] [CrossRef]
- Fu, Z.; Chen, W.; Wen, H.; Zhang, D.; Chen, Z.; Zheng, B.; Zhou, Y.; Lavernia, E.J. Microstructure and strengthening mechanisms in an FCC structured single-phase nanocrystalline Co25Ni25Fe25Al7.5Cu17.5 high-entropy alloy. Acta Mater. 2016, 107, 59–71. [Google Scholar] [CrossRef]
© 2018 by the authors. Licensee MDPI, Basel, Switzerland. This article is an open access article distributed under the terms and conditions of the Creative Commons Attribution (CC BY) license (http://creativecommons.org/licenses/by/4.0/).