Abstract
Hypo-peritectic steels are susceptible to interfacial cracking during thin-slab continuous casting, in which non-metallic inclusions play a critical role. This study systematically investigates the effects of inclusion type and morphology on interface cracking behavior in the steel matrix, with the aim of improving billet shell quality. Hot tensile experiments were conducted using a Gleeble 3800 thermal simulator, and a finite element–based cohesive zone model was developed to simulate inclusion-induced crack nucleation and propagation. The results demonstrate that inclusions markedly influence interfacial stress distribution and damage evolution. The maximum interfacial stresses associated with MnS, Al2O3, and composite inclusions are 20.7, 23.4, and 30.5 MPa, respectively. Owing to severe stress concentration at sharp corners, composite inclusions exhibit the earliest crack nucleation at an applied stress of 11.3 MPa and the highest energy dissipation. In all cases, cracks initially nucleate at the location of maximum tensile stress (α = 90°), propagate along the interface, and subsequently penetrate into the matrix, ultimately leading to failure. The strong agreement between numerical simulations and experimental results confirms that angular inclusions accelerate damage by disrupting matrix continuity. These findings provide theoretical guidance for improving hypo-peritectic steel quality through inclusion morphology control during continuous casting.
1. Introduction
Hypo-peritectic steel is a carbon structural steel with excellent toughness and strength, and is widely used in construction, mechanical parts and structures, etc. Thin-slab continuous casting and continuous rolling technology, as a new type of compact short-process near-final continuous casting technology, has significant advantages such as short process, low cost, high efficiency and energy conservation, and environmental protection compared with traditional continuous casting. Hypo-peritectic steel is widely used in engineering, construction, and mechanical component applications because of its low cost and favorable production characteristics. The thin-slab continuous casting and continuous rolling technology greatly meets its production demands. However, the primary billet shell is highly sensitive to the size and type of inclusions, which can easily lead to the disruption of the continuity of the steel matrix, causing crack initiation and even material failure [1]. Therefore, clarifying the influence mechanism of inclusions on the interface cracking of hypo-peritectic steel is crucial for process optimization.
At present, the influence of inclusions on the mechanical properties of steel matrices has become a research hotspot. Previous studies have shown that the type, size and distribution of inclusions in the cast billet are directly related to the ductility of the steel. For instance, MnS inclusions have low strength, strong ductility and a bond energy with the matrix lower than that of oxides, which makes them prone to cracking at the interface. Meanwhile, Al2O3 inclusions are brittle and have high hardness, which can easily cause local stress concentration [2,3]. Meanwhile, scholars have confirmed through continuous damage mechanics models (such as those used for high-cycle fatigue analysis [4] and finite element techniques) that an increase in inclusion size can intensify stress concentration, and the difference in elastic modulus between inclusions and the matrix can affect the degree of stress concentration [5,6,7]. In terms of homogenization analysis, Mori–Tanaka schemes, self-consistent schemes, etc., have been used to describe the macroscopic behavior of materials [8,9,10,11,12], but they mostly focus on averaging mechanical responses and it is difficult for them to accurately reflect the micro-interface effects. Furthermore, although some studies have focused on the phenomenon of interfacial debonding and pointed out that insufficient interfacial strength can lead to the formation of voids at the spherical inclusion interface during plastic deformation [2], research shows that when the mechanical properties of inclusions approach those of the steel matrix, the influence of inclusions on fatigue life will be significantly reduced. The performance of inclusions can be controlled by adjusting the processing temperature, and the processing technology can be optimized [13,14,15]. Fu [16] et al. indicated that the degree of stress concentration increases with the increase in the size of inclusions and their distance from the surface. Lyu [17] et al. investigated through molecular dynamics methods that composite inclusions can cause lattice distortion at the interface and become nucleation points of cracks. As can be seen from the above, the numerical simulation adopted a simplified inclusion morphology (such as a single spherical shape), without systematically comparing the differentiated effects of typical morphologies such as Al2O3 (elliptical), MnS (circular), and composite inclusions (angular) on interface damage. Therefore, it is difficult to explain the essential reason why angular inclusions are prone to induced cracking. There is still a lack of in-depth exploration on the dynamic evolution of interface cracking of inclusions of different forms (especially irregular composite inclusions) under specific working conditions.
In view of this, this study combines Gleeble thermal simulation experiments with a cohesive zone model to investigate the stress field distribution of three typical inclusions in hypo-peritectic steel under high-temperature loading, explore the influence of inclusion types on interfacial cracking, and systematically study the evolution law of interfacial damage factors and the coupling relationship between energy dissipation and crack propagation to provide a targeted theoretical basis for the control of inclusions in the continuous casting process and theoretical guidance for improving the quality of the billet shell in the new continuous casting process.
2. Experimental Materials and Analytical Methodology
2.1. Specimen Preparation and Thermodynamic Characterization
The hypo-peritectic steel (Q235B) used in this study was produced under ultra-high-speed thin-slab casting conditions, with a nominal composition of Fe–0.2%Mn–0.12%Si–0.185%C. To simulate mold processing behavior, thermal plasticity tests were conducted on a Gleeble 3800 thermomechanical simulator (Gleeble, Poestenkill, NY, USA) at temperatures corresponding to high-speed continuous casting parameters. Tensile specimens were extracted from the slab’s central width region along three orientations: thickness direction, casting direction, and transverse direction. Periodic sampling intervals ensured crack-free material selection for tensile testing reference and subsequent analysis. Cylindrical specimens (10 mm diameter × 120 mm length) with M10 standard threads at both ends and a 12 mm gauge length (Figure 1) were fabricated for thermomechanical testing on the Gleeble simulator.
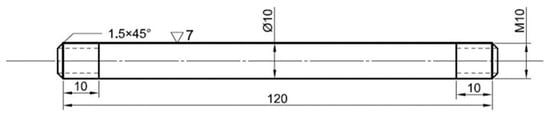
Figure 1.
Schematic drawing of tensile specimen.
A thermomechanical tensile testing protocol was developed using temperature measurements from thermocouples mounted on copper mold plates and pyrometers. This setup allowed precise monitoring of the primary shell’s average temperature evolution during mold residence. The primary shell surface temperature ranged from 1050 °C to 1350 °C. Specimens were heated at 10 °C/s to 1350 °C to achieve complete precipitate dissolution. After 1 min stabilization at 1350 °C (controlled by center-welded thermocouples), cooling at 35 °C/s—based on industrial data on temperature decline from ladle to mold exit—was applied until it reached 1200 °C. This critical temperature, where ductility decreases sharply according to plant data and experimental validation, marked the initiation point for tensile testing.
The strain energy concept [18] has been adopted as an innovative metric for quantifying thermal ductility loss. This methodology calculates the area under engineering stress–strain curves, representing energy expenditure during material deformation.
Fracture energy is evaluated through the total energy parameter (Utrue), defined as the energy absorbed during deformation until fracture [19]. The area under the true total fracture curve is calculated using Equations (1)–(3):
where σeng is the engineering stress, σtrue is the true stress, F is the applied load, A0 is the initial cross-sectional area of the sample, Ai is the instantaneous cross-sectional area of the sample, εeng is the engineering strain, and εtrue is the true strain. ΔL is the change in sample length. V is the volume and Utrue is the true total energy.
2.2. Fractographic Microstructure Analysis
Post-tensile specimens were sectioned through the necking and fracture zones using wire cutting. The polished surfaces were chemically etched with a 4% Nital solution and Klemm’s tint etching [20] to enhance ferritic phase contrast. Microstructural characterization was performed using optical microscopy, scanning electron microscopy (SEM), and energy-dispersive X-ray spectroscopy (EDS). Inclusion morphology was quantitatively analyzed using equivalent diameter measurements in ImageJ software (2015). SEM fractography revealed characteristic inclusion distributions and crack propagation. EDS elemental mapping identified the matrix composition, dominated by C, Si, Mn, S, Al, and O, with minor localized inclusions.
2.3. Finite Element Analysis
A cohesive zone model was implemented in Abaqus to investigate the mechanisms of crack initiation and propagation at matrix/inclusion interfaces. The simulation combines the stress–strain curve of the thermomechanical experiment to simulate the interface fracture of different inclusion types. Distinct material behaviors were defined: the inclusions were modeled as purely elastic, whereas the matrix was modeled as an elastoplastic material during tensile loading. This approach emphasizes the mechanical interaction at the inclusion–matrix interface. A refined micromechanical model was developed to capture the stress field distributions around inclusions, accounting for their typological, geometrical, and positional characteristics. The Von Mises stress analysis incorporated the effects of interfacial debonding. Based on scanning electron microscopy (SEM) data, the average inclusion diameter was approximately 10 μm. Consequently, all simulations were conducted using a single inclusion with a fixed diameter of 10 μm, embedded within a square matrix domain measuring 50 μm × 50 μm.
Non-metallic inclusions were modeled as brittle constituents embedded in a large-deformation elastoplastic matrix. Mesh refinement was implemented using CPS4R elements for the matrix and COH2D4 elements for the interface. The grid was locally densified around inclusions to balance numerical accuracy with computational efficiency. As shown in Figure 2, a displacement-controlled tensile loading at 0.05 m/s [21] was applied to the lower boundary. This strain rate ensures consistency between the continuous casting process and the uniaxial test conditions.
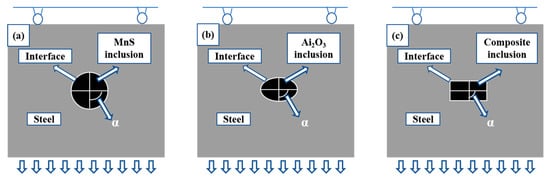
Figure 2.
The schematic diagram of loading boundary conditions of different inclusion models: (a) MnS inclusions; (b) Al2O3 inclusions; (c) composite inclusions.
However, Figure 2 does not represent the real precipitation morphology, but rather illustrates the idealized geometric configuration of the numerical model, including boundary conditions, loading direction, and interface definition, simulation parameters are detailed in Table 1. The shape and size of inclusions are affected by cooling rate, cooling method, oxygen content and other factors. For example, due to the large cooling rate, MnS cannot be fully precipitated, while the solid solution of Mn and S in steel is supersaturated. Therefore, MnS inclusions tend to be spherical.

Table 1.
Mechanical properties of inclusions and the steel matrix at 1200 C.
The bilinear cohesive zone model was implemented to characterize the interfacial stress vs. relative displacement relationship, as shown in the response curve (Figure 3). Under pure tensile and shear separation modes, normal and tangential tractions exhibit linear growth with interfacial displacement until reaching peak strength σmax, followed by progressive softening. Cohesive properties (interface bonding forces) were derived through stress–strain decoupling analysis, correlating displacement fields with strain energy relationships.
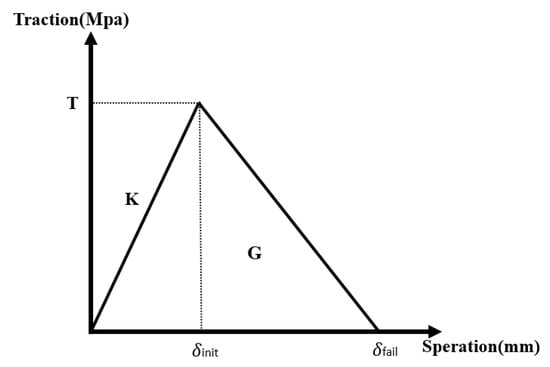
Figure 3.
Bilinear cohesion model.
Crack propagation energy dissipation was modeled through cohesive zone interactions near the crack tip, where atomic-level interaction forces perform work against opening displacements. The traction–separation constitutive law governs cohesive stress as a function of crack opening displacement.
The bilinear CZM is defined by three critical parameters [24]: the interfacial bonding strength T, the initial stiffness K, and the fracture energy G.
where δinit is the initial damage separation and δfail is the final failure separation.
Abaqus software (2021) provides four primary damage initiation criteria. This study employs the maximum nominal stress criterion, coupled with an energy-based damage evolution law. Interface failure occurs when the accumulated energy reaches the critical fracture energy (G), manifesting as crack initiation and propagation.
3. Results Analysis and Discussion
3.1. Uniaxial Tensile Testing and Validation
Figure 4 compares and analyzes the stress–strain curves of the experiment and the simulation. The results are within an acceptable error range, verifying the rationality of the predictive ability of the simulation.
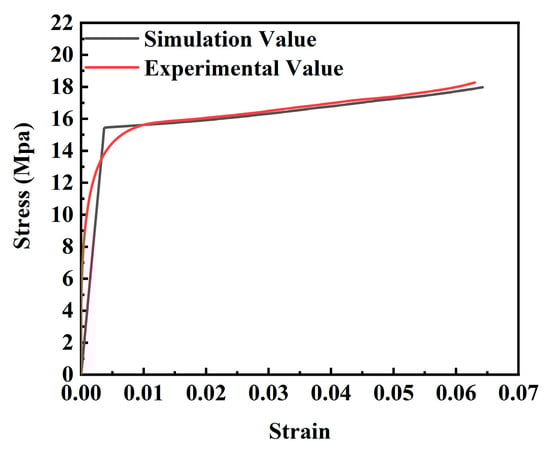
Figure 4.
Simulation error analysis of uniaxial tensile test.
Figure 5a presents the stress–strain response of hypo-peritectic steel under high cooling rates from Section 2 uniaxial tensile tests. The derived true stress–strain curve revealed ultimate tensile strength (18 MPa), yield strength (15 MPa), and strain energy density (0.34 J/mm2). According to the simulation results of the temperature distribution in the mold during the thin plate continuous casting process, the average temperature is about 1200 °C, so the feature point is selected in the simulation process, as shown in Figure 5b.
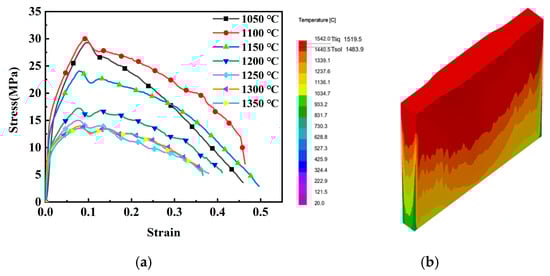
Figure 5.
Mechanical property curve at 1050–1350 °C: (a) stress–strain curves at different temperatures; (b) surface temperature distribution of slab shell.
A sensitivity analysis of simulation parameters was conducted through experimental validation. Following established methodologies, stress–strain curve correlation serves as the principal criterion for verifying computational accuracy. The hypo-peritectic steel material properties from Yang’s study [23], including pre-necking yield strength, tensile strength, and ductility characteristics, were adopted as benchmark parameters.
Figure 6a–c is the morphology and composition of three main inclusions in the sub-grain steel measured under the experimental conditions: alumina (Al2O3), manganese sulfide (MnS) and composite inclusions. The Al2O3 inclusions are mainly elliptical and exhibit high-hardness characteristics. Mn S inclusions are usually spherical. The morphology of composite silicate inclusions is irregular, and the angular morphology is obvious. Based on the scanning electron microscope characterization, an embedded inclusion model was established to best represent the geometric features.
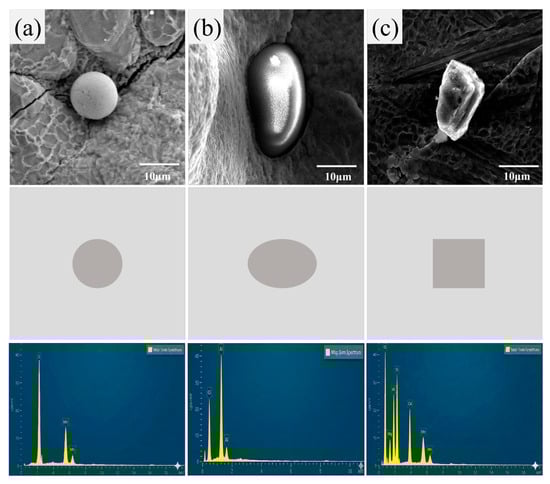
Figure 6.
Geometric model of typical inclusions: (a) MnS inclusions; (b) Al2O3 inclusions; (c) composite inclusions.
SEM fractography (Figure 6) revealed that void formation was limited within the matrix itself, with the majority of voids concentrated at the inclusion/matrix interfaces. The average diameter of the inclusions was 10 microns by ImageJ analysis of the scanning electron microscope images. Voids initiated by interfacial debonding primarily extended from the inclusion/matrix boundaries into the surrounding matrix. The SEM micrographs revealed heterogeneous grain structures near the inclusions, prominent interfacial crack propagation, and secondary cracks with cleavage steps. The presence of inclusions significantly increased the void nucleation density and coalescence probability, thereby accelerating damage evolution within the matrix [25].
3.2. Interfacial Mechanical Behavior Analysis
The presence of inclusions significantly degrades the mechanical properties of the material, primarily due to their inherent morphological variations and differing physical properties [26]. Inclusions are classified by comparing their elastic modulus with that of the steel matrix: soft inclusions have a lower modulus, whereas hard inclusions have a higher modulus. To isolate the effects of inclusion type and geometry on interfacial cracking, three 10 μm diameter inclusions (Al2O3, MnS, and composite) were modeled with perfect initial bonding. Figure 7 illustrates the stress evolution during loading. Initial stress concentration occurs at the tensile loading end and propagates inward toward the inclusions. In the pre-crack stage, interfaces remained intact while both the matrix and inclusions underwent elastic deformation, a behavior consistent across all inclusion types. The stress evolution mechanism involves three key stages: interfacial stress concentration initiates upon loading, peaks at the interface strength limit, followed by stress relaxation and crack nucleation. The matrix discontinuity induced by inclusions creates stress gradients, with maximum stresses developing at the inclusion/matrix interfaces. MnS inclusions, in particular, induce localized strain amplification, which significantly alters the deformation patterns in the adjacent matrix. The quantified critical interfacial stresses were 20.7 MPa for MnS, 23.4 MPa for Al2O3, and 30.5 MPa for the composite inclusions. Although MnS and Al2O3 inclusions exhibited similar stress and strain distributions near their interfaces, all inclusion types modified the local field gradients. Stress attenuated progressively as the crack propagated. Composite inclusions exhibited the highest interfacial stress levels. Under sustained loading, interfacial stress progressively reduced, ultimately leading to failure. Crack initiation triggers stress redistribution; the concentration shifts to new crack tips, driving further propagation. Following initiation, the rapid formation of an interfacial gap correlates with a systemic stress reduction during crack advancement.
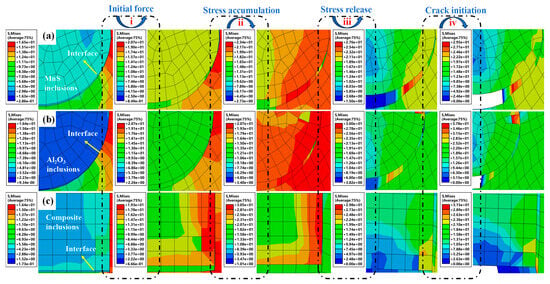
Figure 7.
Stress contour maps of different inclusion types under tensile loading: (a) matrix–MnS inclusion; (b) matrix–Al2O3 inclusion; (c) matrix–composite inclusion.
Inclusions provide strain constraint to the steel matrix under tensile stress, reducing matrix deformation while inducing localized stress concentrations. When inclusion/matrix mechanical properties are comparable, enhanced load-bearing capacity minimizes matrix disturbance during loading. Inclusions with higher Young’s modulus than the matrix (e.g., irregular composite types) develop asymmetric stress distributions, concentrating stresses along inclusion peripheries due to constrained deformation. The literature confirms failure initiates within high-modulus inclusions under sufficient stress concentration, with composite inclusions fracturing prior to matrix failure. Subsequent tensile loading propagates inclusion-born cracks through interfaces. Subcritical stresses preferentially induce interfacial debonding rather than inclusion fracture. Debonding initiation accelerates gap formation through dual-interface stress concentration, with this study focusing on such interface-dominated failure mechanisms. Pre-crack elastic stages maintain intact interfaces with effective load transfer. Inclusion-induced matrix discontinuity generates progressive stress gradients, evidenced by evolving stress contour patterns prior to failure initiation.
As shown in Figure 7, a continuous stress field exists between the inclusions and the matrix. Initial stress concentration originates in the local matrix region, shifts toward the inclusion, and peaks at the inclusion/matrix interface. With continued loading, the interfacial stress decreases, ultimately leading to macroscopic fracture. The concurrent processes of stress redistribution and micro-crack formation generate further stress concentration at the crack tips, which drives crack propagation. Interface debonding relaxes stress in the bonded region while simultaneously amplifying the stress intensity at the crack tip, thereby facilitating continuous crack propagation. The crack eventually propagates through the matrix, resulting in final fracture.
The angle α is defined relative to the y-axis, indicating interface orientation (Figure 2). Prior to crack initiation, the maximum stress occurs at the inclusion–matrix interface where α equals 90°. As shown in Figure 7, interfacial cracks initiate primarily via tensile failure at stress concentration zones. These cracks propagate along the interface before penetrating the matrix. The resulting failure mode depends on the interface orientation relative to the loading direction: interfaces at larger angles fail predominantly in tension, whereas those at smaller angles fail in a shear-dominated mode.
3.3. Evolution of Interface Damage Factors Across Models
Figure 8 presents SDEG contour maps for different inclusion models. Figure 8a depicts initial damage stages, showing SDEG peaks at stress-concentrated regions near inclusion tips, with damage localized within minimal areas at inclusion extremities. Figure 8b,c illustrates crack propagation phases, where prolonged loading increases SDEG values at identical locations until reaching unity, initiating crack formation. Subsequent crack tip advancement expands damaged zones. Figure 8d demonstrates the final failure stages, where SDEG reaches unity, indicating complete interface failure characterized by crack formation and inclusion–matrix separation. Continued displacement loading propagates interface failure progressively.
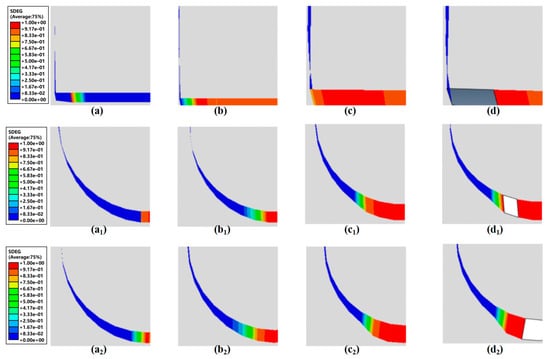
Figure 8.
Cloud map of interface damage: (a–d) MnS inclusions; (a1–d1) Al2O3 inclusions; (a2–d2) composite inclusions.
The damage factors of three models were compared through SDEG curves for different inclusions as shown in Figure 9. The analysis reveals distinct interfacial load-bearing capacities and critical fracture displacements across inclusion types. Composite inclusions exhibit premature cracking due to geometric irregularities that create vulnerable interfaces susceptible to stress concentration, ultimately reducing load-bearing capacity and accelerating crack initiation. Energy accumulation at composite inclusion interfaces reaches the material’s resistance threshold earlier, inducing crack nucleation at reduced displacement levels. MnS and Al2O3 containing steel matrices demonstrate delayed damage initiation by approximately 0.33 s compared to composite inclusions. All three SDEG curves display linear ascending trends with comparable progression rates and magnitudes.
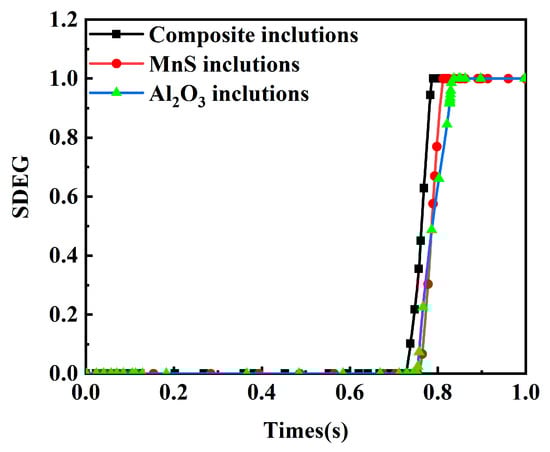
Figure 9.
SDEG–times curve.
3.4. Variation Patterns of Tension Displacement Curves Across Inclusion Mechanical Models
To analyze stress variations at interfacial regions of different inclusions, stress–displacement curves were extracted from both damaged and undamaged interface locations in the models, as shown in Figure 10.
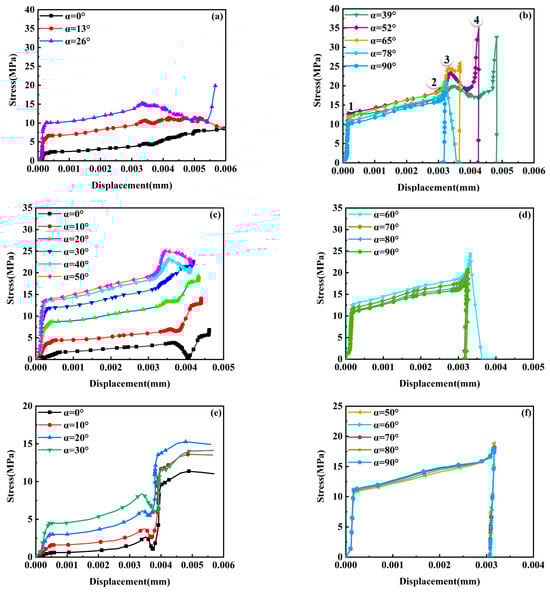
Figure 10.
Stress–displacement curves of typical inclusions. (a) MnS inclusions are not damaged; (b) MnS inclusions have been damaged; (c) Al2O3 inclusions are not damaged; (d) Al2O3 inclusions have been damaged; (e) composite inclusions are not damaged; (f) composite inclusions have been damaged.
The evolution of interfacial stress followed two distinct patterns depending on whether a crack was present, both correlating with the angle α at different interfacial positions. Prior to crack initiation, dual stress peaks were observed (Figure 10a,c,e). MnS inclusions exhibited a smooth first peak of 14.8 MPa at α = 26°, followed by a stress reduction. Al2O3 inclusions showed a higher first peak of 24.8 MPa at α = 50°, while composite inclusions had the lowest first peak at 6.7 MPa (α = 30°), indicating their minimal interfacial stress tolerance and heightened vulnerability. These dual peaks persisted exclusively at uncracked composite inclusion interfaces, suggesting a morphology-dependent characteristic. During elongation, the trend and magnitude of stress elevation remained consistent across positions. As shown in Figure 10b, stress increased sharply to stage ①, rose steadily to stage ②, and peaked at stage ③. A sharp decline was followed by a secondary increase before an abrupt drop to zero, signifying interfacial crack formation. For the case in Figure 10a (α = 26°), stress initially decreased before increasing gradually—a behavior exclusive to MnS inclusions under both cracked and uncracked conditions. In contrast, for Al2O3 and composite inclusions, interfacial stress dropped rapidly to zero immediately after peaking upon crack initiation (Figure 10d,e). For uncracked interfaces, the stress evolution before stage ③ was similar. The post-peak stress reduction and recovery originated from elastoplastic deformation: when a lower interfacial region (with its normal perpendicular to the loading axis) stretched, its stress accumulated more slowly, resulting in a lower curve slope. Before the first peak, interfacial stress increased steadily with displacement, indicating intact load-bearing capacity. Interface degradation initiated at stage ③ (Figure 10b).
Analysis of the angle α revealed that interfacial stress persisted without fracture for α between 0°and 26°. As α increased, so did the interfacial stress, making separation imminent for α between 26°and 39°. For α between 39°and 90°, larger α values required a greater critical displacement to reach peak stress and induce fracture. The tensile stress–displacement curve for MnS inclusions, analogous to a macroscopic stress–strain curve, comprised four stages (Figure 10b): a near-linear rise to 11.13 MPa at point ①; a gradual increase during crack propagation, microscopically attributed to atomic rearrangement from transgranular to slip-aligned configurations, creating a disordered zone near the crack tip; continued atomic-level stress escalation with crack opening displacement, initiating localized cracking—complete penetration became imminent as stress peaked at 17.89 MPa; and an abrupt atomic stress reduction culminating in complete fracture. For Al2O3 inclusions, the fracture-free interfacial zone was significantly larger. The critical fracture angle α ranged from 50°to 60°, governed by both loading orientation and inclusion morphology. Specifically, alignment of the tensile load with the major axis of these elliptical inclusions substantially increased the interfacial contact area, thereby enhancing load-bearing capacity. For composite inclusions, the fracture-free zone was of intermediate size, with a critical α ranging from 30°to 50°. A distinct stress concentration at α = 40°, attributable to the geometric discontinuities of their square shape, represents a key feature differentiating them from other morphologies.
As shown in Figure 11, the type of inclusions directly affects the bearing capacity of the matrix and the displacement required for complete interfacial debonding. The geometric irregularity of the composite inclusions leads to significant stress concentration, resulting in a peak interfacial stress of 11.3 MPa. Reaching the critical interfacial energy level early leads to a reduction in the displacement required for debonding. The initial slope of the stress–displacement curve is basically consistent between different inclusion types, although the interfacial stress development of manganese–sulfur inclusions is relatively low. This lower stress is attributed to the minimal effect of inclusion shape and the tight coupling between the large deformation of the matrix and the interface debonding displacement caused by damage. Once the interface tensile stress caused by displacement loading exceeds the interface bond strength, debonding will begin, which will lead to rapid stress reduction and gradual interface separation process.
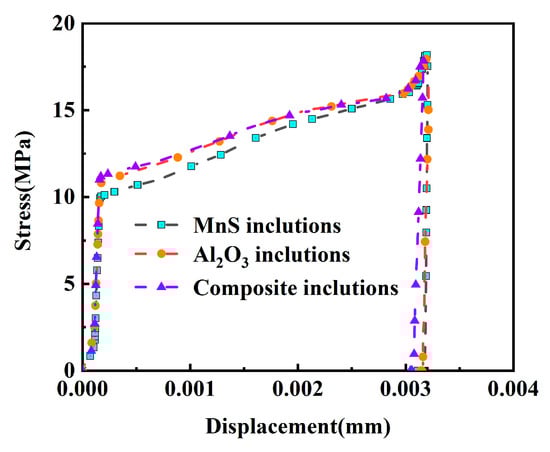
Figure 11.
Stress–displacement curve of the inclusion at α = 90°.
3.5. Energy Evolution Mechanisms
The initiation and evolution of damage at the inclusion–matrix interface during tensile loading involve the continuous input, accumulation, dissipation, and release of energy. Thus, interfacial deformation and fracture can be fundamentally understood as processes of energy transfer and conversion. Figure 12 shows the evolution of interfacial energy for the different inclusion types across a range of interfacial angles (α = 0–90°). For all morphologies, the accumulated interfacial energy exhibits a characteristic unimodal trend. Analysis of the corresponding stress curves indicates that the interface remains intact and deforms stably prior to this energy peak, during which energy is gradually stored—a phase corresponding to effective load transfer between matrix and inclusion. Damage initiates once the local interfacial traction reaches the critical threshold defined by the cohesive zone model, which occurs as the accumulated energy approaches the material’s critical fracture energy. This marks the transition from energy storage to dissipation. Beyond the peak, crack generation and propagation dominate, and the stored energy is released through interfacial separation and matrix deformation.
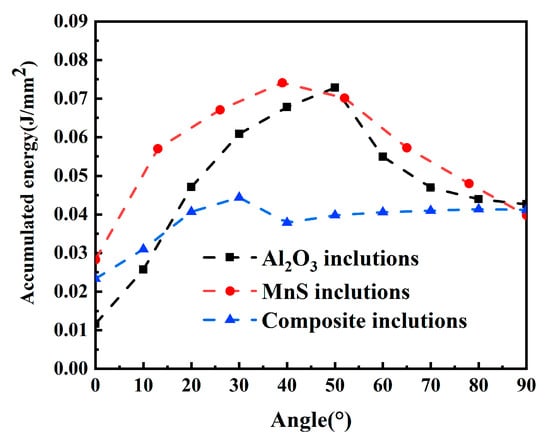
Figure 12.
Energy release rates of different types of inclusions.
The peak cumulative energies were 0.043 mJ for composite inclusions, 0.075 mJ for MnS, and 0.073 mJ for Al2O3 inclusions. The higher peak energies for MnS and Al2O3 indicate that their smoother, more regular morphologies can sustain greater elastic energy accumulation prior to failure. In contrast, the acute angles of the composite inclusions cause severe local stress concentration, leading to premature damage initiation at lower energy levels. Consequently, the composite inclusions exhibit reduced critical energy for crack initiation and lower interfacial stability, as reflected directly in their lower peak energy.
Figure 13 presents the corresponding evolution of the interfacial damage variable, stress response, and energy dissipation. At damage initiation, the instantaneous energy dissipation of composite inclusions reaches 0.000212 mJ, which is significantly higher than that of Al2O3 (0.000060 mJ) and MnS (0.000047 mJ). This elevated dissipation rate indicates that once cracking is triggered, composite inclusions undergo more unstable interfacial separation and crack propagation due to their irregular geometry. In contrast, MnS and Al2O3 inclusions exhibit smoother energy dissipation profiles, reflecting more stable crack propagation and delayed catastrophic interfacial failure.
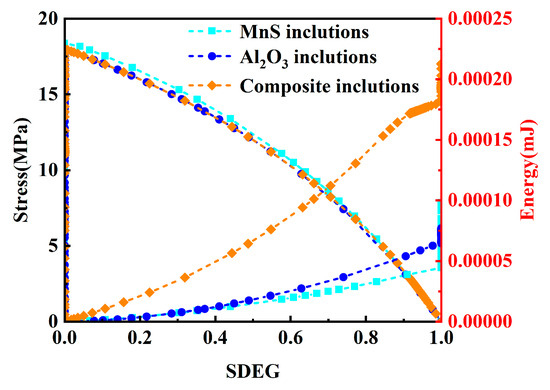
Figure 13.
SDEG–stress–energy dissipation curves of inclusions.
4. Conclusions
This study investigates the influence of inclusion types on matrix deformation and interfacial cracking using cohesive zone modeling validated by uniaxial tensile tests and numerical simulations. The conclusions are summarized as follows:
- (1)
- The type and morphology of inclusions significantly influence the interfacial stress distribution. Composite inclusions, characterized by sharp angular features, exhibit the highest interfacial stress (30.5 MPa) and the most pronounced stress concentration, resulting in crack initiation at the lowest applied stress level (11.3 MPa). In comparison, MnS and Al2O3 inclusions demonstrate lower interfacial stresses of 20.7 MPa and 23.4 MPa, respectively, with damage initiation delayed by approximately 0.33 s relative to composite inclusions.
- (2)
- All cracks initially nucleate in tensile mode at the location of maximum interfacial stress (α = 90°). The stress concentration subsequently shifts to the crack tip, driving crack propagation along the interface, and ultimately leading to failure upon penetration into the matrix. The evolution of the interfacial damage factor (SDEG) indicates that composite inclusions have the weakest load-bearing capacity and the longest crack propagation length.
- (3)
- The energy dissipation at the interface of composite inclusions is the highest (0.000212 mJ), significantly exceeding that of Al2O3 (0.000060 mJ) and MnS (0.000047 mJ). This confirms that irregularly shaped inclusions not only degrade the mechanical properties of the matrix but also cause greater energy dissipation during tensile failure. The energy release rate exhibits a unimodal distribution within α = 0° to 90°. The peak energy for composite inclusions (0.043 mJ) is lower than that for the smoother MnS (0.075 mJ) and Al2O3 (0.073 mJ) inclusions, indicating that interface failure occurs even with less accumulated energy.
- (4)
- The cohesive zone model parameters derived from experimental stress–strain curves show good agreement with simulation results, validating the model’s reliability in simulating interface crack initiation and propagation. This study quantitatively clarifies that angular composite inclusions are the most susceptible sites for micro-crack nucleation, providing a theoretical basis for improving the quality of hypo-peritectic steel billets by minimizing the formation of such harmful inclusions through composition control during continuous casting.
Author Contributions
Conceptualization, X.M. and Y.Z.; methodology, Y.W. (Yajun Wang); software, X.M.; validation, B.G., Y.Y. and Y.W. (Yitong Wang); formal analysis, J.L.; investigation, B.G.; resources, J.L.; data curation, Y.Y.; writing—original draft preparation, X.M.; writing—review and editing, Y.W. (Yajun Wang); visualization, X.M.; supervision, Y.W. (Yitong Wang); project administration, J.L.; funding acquisition, Y.Z. All authors have read and agreed to the published version of the manuscript.
Funding
This research was funded by National Natural Science Foundation of China (U21A20112), National Natural Science Foundation of China (52274333), distinguished Young Science Fund Project of Hebei Natural Science Foundation (E2023209128), Innovation Research Group Project of Natural Science Foundation of Hebei Province (E2022209093), the Central Guiding Local Science and Technology Development Fund Project (254Z1005G).
Data Availability Statement
The original contributions presented in this study are included in the article. Further inquiries can be directed to the corresponding authors.
Conflicts of Interest
The authors declare no conflicts of interest.
References
- Ziccarelli, A.; Kanvinde, A.; Deierlein, G. Cyclic adaptive cohesive zone model to simulate ductile crack propagation in steel structures due to ultra-low cycle fatigue. Fatigue Fract. Eng. Mater. 2023, 46, 1821–1836. [Google Scholar] [CrossRef]
- Pericoli, V.; Lao, X.; Ziccarelli, A.; Kanvinde, A.; Deierlein, G. Integration of an adaptive cohesive zone and continuum ductile fracture model to simulate crack propagation in steel structures. Eng. Fract. Mech. 2021, 258, 108041. [Google Scholar] [CrossRef]
- Yoon, J.I.; Lee, H.H.; Jung, J.; Kim, H.S. Effect of grain size on stretch-flangeability of twinning-induced plasticity steels. Mater. Sci. Eng. A 2018, 735, 295–301. [Google Scholar] [CrossRef]
- Kang, J.M.; Wang, Y.H.; Chen, X.M.; Zhang, C.; Peng, Y.; Wang, T. Grain refinement and mechanical properties of Fe-30Mn-0.11C steel. Results Phys. 2019, 13, 102247. [Google Scholar] [CrossRef]
- Lv, J.L.; Liang, T.X.; Wang, C.; Limin, D. Effect of ultrafine grain on tensile behaviour and corrosion resistance of the duplex stainless steel. Mater. Sci. Eng. C 2016, 62, 558–563. [Google Scholar] [CrossRef]
- Wang, J.T.; Hodgson, P.D.; Bikmukhametov, I.; Miller, M.K.; Timokhina, I. Effects of hot-deformation on grain boundary precipitation and segregation in Ti-Mo microalloyed steels. Mater. Des. 2018, 141, 48–56. [Google Scholar] [CrossRef]
- Rai, P.K.; Shekhar, S.; Mondal, K. Effects of grain size gradients on the fretting wear of a specially-processed low carbon steel against AISI E52100 bearing steel. Wear 2018, 412, 1–13. [Google Scholar] [CrossRef]
- Zhang, Y.; Luo, P.; Niu, L.; Lu, Z.; Yan, H.; Hu, X. Kinetic Analysis of High-Temperature Plastic Flow in 2.25Cr-1Mo-0.25V Steel. Materials 2019, 12, 4071. [Google Scholar] [CrossRef]
- Wang, G.; Zhang, J.; Yan, W.; Xu, H. Constitutive modelling of plastic deformation behaviour for AA7075-H18 alloy based on hot forming and indie quenching (HFQ®) process. Int. J. Mater. Form. 2022, 15, 62. [Google Scholar] [CrossRef]
- Xiao, Y.D.; Li, M.; Wang, W.; Zhou, J.; Wu, G.L.; Peng, Y. High temperature plastic deformation behavior of non-oriented electrical steel. J. Cent. South Univ. Technol. 2009, 16, 25–31. [Google Scholar] [CrossRef]
- Huitron, R.M.P.; Lopez, P.E.R.; Vuorinen, E.; Jentner, R.; Kärkkäinen, M.E. Converging cr-iteria to characterize crack susceptibility in a micro-alloyed steel during continuous casting. Mater. Sci. Eng. A 2020, 772, 138691. [Google Scholar] [CrossRef]
- Singh, P.P.; Mula, S.; Malakar, A.; Ghosh, S. Strain-rate dependent workability and plastic flow instability of a (Nb+V) stabilized microalloyed steel. Mater. Today Commun. 2022, 31, 103519. [Google Scholar] [CrossRef]
- Yang, W.; Peng, K.Y.; Zhang, L.F.; Ren, Q. Deformation and fracture of non-metallic inclusions in steel at different temperatures. J. Mater. Res. Technol. 2020, 9, 15016–15022. [Google Scholar] [CrossRef]
- Yang, Y.; Zhan, D.; Qiu, G.; Li, X.; Jiang, Z.H.; Zhang, H. Inclusion evolution in solid steel during rolling deformation: A review. J. Mater. Res. Technol. 2022, 18, 5103–5115. [Google Scholar] [CrossRef]
- Gu, C.; Liu, W.; Lian, J.; Bao, Y.P. In-depth analysis of the fatigue mechanism induced by inclusions for high-strength bearing steels. Int. J. Min. Met. Mater. 2021, 28, 826–834. [Google Scholar] [CrossRef]
- Fu, C.; Zhang, N.; He, G.; Jiang, B.; Liu, Y. Microstructural and finite element simulation analysis of the crack formed during heat treatment in the carburized 22CrMoH steel gear shaft. Eng. Fail. Anal. 2023, 147, 107165. [Google Scholar] [CrossRef]
- Lyu, Z.; Gu, C.; Liu, W.; Bao, Y.; Lian, J. Towards fatigue-resistant steels: Interfacial fatigue crack mechanisms in complex inclusions revealed by TEM and atomic simulations. Mater. Des. 2025, 253, 113902. [Google Scholar] [CrossRef]
- Olejarczyk-wożeńska, I.; Mrzygłód, B.; Hojny, M. Modelling the high-temperature deformation characteristics of S355 steel using artificial neural networks. Arch. Civ. Mech. Eng. 2022, 23, 1. [Google Scholar] [CrossRef]
- Li, Y.; Wang, X.; Yuan, G.; Han, P.; Zhu, X. Hot compression deformation and microstructure evolution of high chromium cast iron based on canning compression. J. Mater. Sci. 2021, 56, 17296–17305. [Google Scholar] [CrossRef]
- Wu, S.; Pan, J.; Scarth, D.A. Finite element analyses of crack extensions in curved compact tension specimens of irradiated Zr-2.5Nb pressure tube materials by nodal release method and cohesive zone modeling approach. Eng. Fract. Mech. 2022, 271, 108676. [Google Scholar] [CrossRef]
- Xie, G.; Wang, F.; Song, B.; Cheng, J.; Wang, J.; Zeng, X. Grain size dependence of cracking performance in polycrystalline NiTi alloys. J. Alloys Compd. 2021, 884, 161132. [Google Scholar] [CrossRef]
- Yang, G.Y. Mechanism and Control of Surface Crack Initiationand Propagation of Continuous Casting Beam Blank. Ph.D. Thesis, School of Metallurgical and Ecological Engineering, University of Science and Technology Beijing, Beijing, China, 2022. [Google Scholar]
- Guo, S.; Zhu, H.Y.; Zhou, J.; Dong, S.; Liang, Y. Effects of inclusions on stress field in low-densitysteel under compressive loading. Lron Steel 2022, 57, 63–72. [Google Scholar] [CrossRef]
- Khan, M.; Asif, M.; Khan, H.U.; Riaz, Z. Numerical study of the effect of different fillers on the mechanical and thermal properties of Silicone rubber polymer composite. In Proceedings of the International Bhurban Conference on Applied Sciences and Technologies (IBCAST), Islamabad, Pakistan, 12–16 January 2021; Volume 34, pp. 45–55. [Google Scholar]
- Zhang, W.; Jiang, W.; Li, H.; Song, M.; Yu, Y.; Sun, G.; Li, J.; Huang, Y. Effect of tensile overload on fatigue crack behavior of 2205 duplex stainless steel: Experiment and finite element simulation. Int. J. Fatigue 2019, 128, 105199. [Google Scholar] [CrossRef]
- Gu, C.; Lian, J.; Bao, Y.; Xiao, W.; Münstermann, S. Numerical Study of the Effect of Inclusions on the Residual Stress Distribution in High-Strength Martensitic Steels During Cooling. Appl. Sci. 2019, 9, 455. [Google Scholar] [CrossRef]


Disclaimer/Publisher’s Note: The statements, opinions and data contained in all publications are solely those of the individual author(s) and contributor(s) and not of MDPI and/or the editor(s). MDPI and/or the editor(s) disclaim responsibility for any injury to people or property resulting from any ideas, methods, instructions or products referred to in the content. |
© 2026 by the authors. Licensee MDPI, Basel, Switzerland. This article is an open access article distributed under the terms and conditions of the Creative Commons Attribution (CC BY) license.