Abstract
In this study, a Hastelloy C276 coating was fabricated on the surface of Q345B steel using high-velocity oxy-fuel (HVOF) spraying technology, and the corrosion behavior and mechanism of the coating in a simulated seawater environment were investigated through electrochemical measurements and immersion tests. Studies have shown that C276 coatings fabricated using HVOF technology exhibit dense microstructures and high microhardness. The corrosion rate of the coating initially increased and then decreased with prolonged immersion time, reaching a maximum at 720 h, followed by a reduction to 0.259 mm/year at 1440 h. Corrosion morphology analysis indicated that the decreased corrosion resistance of the C276 coating was primarily due to pitting initiation and propagation at the pores of the coating. With increasing immersion time, the corrosion products accumulated at the surface defects of the C276 coating, forming a dense covering layer that effectively hindered corrosion.
1. Introduction
Low-alloy high-strength structural steel is widely used in marine engineering structures, offshore platform support components, shipbuilding, coastal bridges, and other engineering fields exposed to seawater or marine atmospheric environments owing to its excellent mechanical properties and cost-effectiveness [1]. However, in corrosive environments with high concentrations of chloride ions (Cl−) [2], these materials are highly susceptible to corrosion. The protective passivation film formed on their surfaces is easily locally damaged by Cl− attack, which can trigger pitting and crevice corrosion. This severely threatens structural safety and service life and may even lead to significant economic losses and safety hazards. In comparison, nickel-based corrosion-resistant alloys, such as Inconel C276 (UNS N10276), demonstrate outstanding corrosion resistance in such harsh environments, offering greater reliability in their applications. However, the raw material costs of these steels are significantly higher than those of the low-alloy high-strength steels commonly used in engineering [3,4], which limits their large-scale adoption. Therefore, surface modification treatments are required to enhance the corrosion resistance of these materials in high-chlorine environments to balance their cost-effectiveness and corrosion resistance.
Commonly used surface engineering techniques include arc spraying, plasma spraying, and high-velocity oxy-fuel spraying (HVOF). Among these, arc spraying technology offers high coating efficiency and a wide range of applications; however, the coatings produced using this technology have the drawback of high porosity [5]. Plasma spray technology offers advantages such as a wide range of applicable materials, high process flexibility, and high coating density. However, it has disadvantages, including the coating uniformity being greatly affected by the spraying parameters, complex equipment, and high consumption of materials [6,7]. In contrast, coatings prepared using HVOF technology have a dense structure (with a porosity of less than 1%) and exhibit excellent corrosion resistance [8,9]. Therefore, applying a C276 coating onto a low-alloy, high-strength steel substrate using HVOF technology endows it with excellent corrosion resistance and ensures cost effectiveness.
Currently, there is a lack of research on the corrosion behavior and mechanisms of coatings prepared using HVOF technology in simulated seawater environments, particularly regarding the effect of the pore structures generated during the process. Therefore, in this study, HVOF technology was employed to prepare the C276 coatings. The corrosion behavior and mechanisms of the coating after immersion for different durations in a 3.5 wt.% NaCl solution were investigated through electrochemical measurements and immersion experiments. By combining the electrochemical characteristics with the microscopic characterization of the coatings, this study explored the corrosion behavior and mechanisms of coating pore structures induced by heterogeneity during HVOF preparation in simulated seawater environments. This study provides a theoretical basis and technical support for improving the corrosion resistance of carbon steel and selecting appropriate protective coating.
2. Materials and Methods
2.1. Coating Deposition
To facilitate material acquisition, a Q345B steel plate measuring 100 mm × 100 mm × 3 mm was selected as the substrate for this experiment. The compositions are presented in Table 1. The sprayed powder was a C276 alloy powder prepared by vacuum atomization, with a particle size of 25–45 μm. The specific compositions are listed in Table 2. Before spraying, the powder was examined using a scanning electron microscope (SEM), and the results showed that the powder particles were uniformly spherical, with few irregular particles. The particle size distribution of the C276 powder was analyzed using ImageJ software (1.53a), and it was found that the particle size was mainly distributed between 35–45 μm, meeting the design requirements (Figure 1). The HV8000 supersonic flame spraying system (Zhengzhou Lijia; Zhengzhou High-Tech Zone, Zhengzhou, China) was used, with kerosene as the fuel, oxygen as the oxidizer, and nitrogen as the powder feeding gas. The relevant spraying parameters are listed in Table 3.

Table 1.
Chemical Composition of Q345B Steel.
Table 2.
Chemical Composition of the C276 Powder.
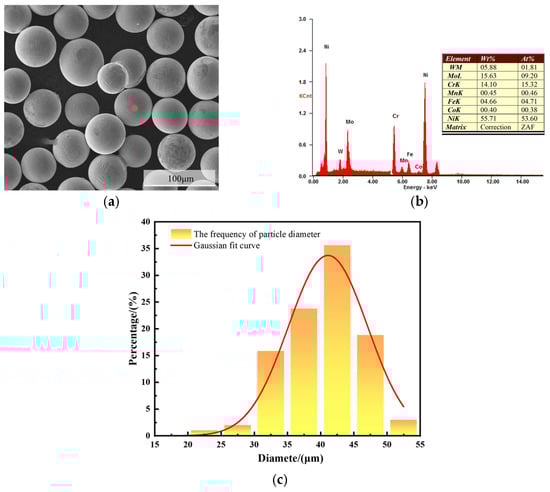
Figure 1.
SEM morphologies of C276 powder (a), EDS elemental composition analysis (b), and particle size distribution (c).
Table 3.
C276 Powder Spraying Parameters.
2.2. Coating Morphology Characterization
Three-dimensional laser confocal analysis was used to assess the surface roughness and three-dimensional morphology of the coating after spraying. The phase composition of the coating surface was analyzed using a Cu target X-ray diffractometer (XRD) with a scanning speed of 2°/min and a diffraction angle ranging from 20–90°. The porosity of the C276 coating was determined using the ImageJ image analysis software, and the coating porosity was calculated according to GB/T 11373-2008 [10]. The prepared samples were cut into test specimens measuring 10 mm × 10 mm × 3 mm. The sides of each specimen were sealed with K704 silicone (Guangdong Evergrande New Materials Technology Co., Ltd., Longfeng Dutian Industrial Zone, Huizhou, China), leaving only the section to be tested. After grinding and polishing to a surface roughness of approximately 0.5 μm, hardness measurements were taken along the coating thickness direction on the exposed section, from the coating to the substrate, at 50 μm intervals. Three groups of measurements were taken at each position, and the average was calculated to determine the variation pattern of the coating hardness with thickness. The surface and cross-sectional morphologies and chemical composition of the coating were analyzed using SEM and EDS.
2.3. Electrochemical Testing
Before testing, the back of the coated area of the sample was connected to a copper wire, and all other surfaces were sealed with silicone, exposing only 1 cm2 of the coating as the effective test area (for Q345B samples, the edges were simply sealed to expose 1 cm2 as the effective test area). The CS310M electrochemical workstation was used to test the coated samples soaked for different durations and the substrate samples in a 3.5 wt.% NaCl solution environment. All samples were immersed in 3.5 wt.% NaCl solution for 24 h, 720 h, and 1440 h, respectively. The experiment used a three-electrode system, which included a platinum sheet (counter electrode), saturated calomel electrode (reference electrode), and coated substrate sample (working electrode). Electrochemical impedance spectroscopy (EIS) tests were conducted on samples with various immersion durations, with a frequency range of 105–10−2 Hz and an AC excitation signal amplitude of 10 mV. Six parallel samples were prepared for each cycle to ensure the reproducibility of the data. Three samples were used for polarization curve testing after immersion in the electrolyte. The scanning range for the polarization curve test was ±600 mV relative to the open-circuit potential (OCP), with a scan rate of 0.5 mV/s.
2.4. Weightlessness Testing
The prepared coating samples and Q345B were sealed on all sides with K704 silicone, exposing only a 1 cm2 surface for corrosion testing. The samples were placed in a desiccator for 24 h to allow the silicone to cure and then weighed using an electronic balance with an accuracy of 0.0001 g. All samples were immersed in 3.5 wt.% NaCl solution for 24 h, 720 h, and 1440 h, respectively, and then, according to the GB/T 16545-2015 standard [11], corrosion products were removed and the corrosion rate calculation formula and relevant calculation parameters were selected. After soaking, the sample was placed in a solution composed of 500 mL of concentrated hydrochloric acid (ρ = 1.19 g/mL) and 5 g of hexamethylenetetramine and diluted to 1000 mL. The sample was cleaned via ultrasonic vibration for 1–3 min to effectively remove surface corrosion products. Ultrasonic cleaning was performed again in an alcohol solution for 10 min. Subsequently, the samples were dried in an oven at 105 °C for 2 h to ensure complete removal of moisture. After drying, the samples were immediately weighed using the same electronic balance, the changes in mass were recorded, and the corrosion rate (Equation (1)) was calculated based on relevant parameters such as the exposed area and immersion time. Three parallel specimens were prepared for each set of conditions to ensure the reproducibility of the data.
ΔM mass loss of the sample before and after corrosion (g). K is a unit conversion constant. S is the area of the sample exposed to the solution (cm2). T corrosion time (h). where ρ is the sample density (g/cm3). vcorr corrosion rate (mm/y).
3. Results
3.1. Microstructural Characterization of C276 Coating
The macroscopic morphology, SEM surface morphology, and EDS elemental distribution of the C276 coating prepared using HVOF technology are presented in Figure 2. It can be seen that the coating is relatively uniform and the surface is smooth, with no obvious cracks or pores observed on a macroscopic scale. The SEM results indicate that most of the powder particles on the coating surface existed in a splattered form, with some spreading out in a disk shape after complete deformation. In addition, some unmelted or partially melted non-rebonded particles can be observed on the surface [12,13,14,15]. The SEM results of the coating cross-section (Figure 3) indicate that there are some irregularly shaped pores scattered throughout the coating, and gaps are present around unmelted particles on the coating surface. The overall thickness of the coating was relatively uniform and tightly bonded to the substrate surface. EDS revealed a relatively uniform distribution of each element within the coating.
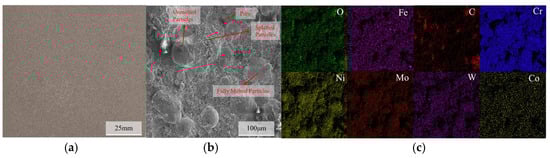
Figure 2.
Macroscopic morphology of the C276 coating (a), SEM microstructure (b), and EDS elemental distribution (c).
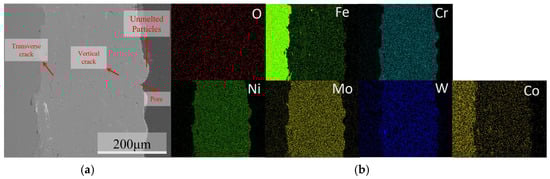
Figure 3.
Cross-sectional morphology of the C276 coating (a) and EDS elemental mapping (b).
3.2. Physical Properties of the Coating
According to GB/Z 45463-2025 [16], select the formula for calculating porosity is as follows:
where P is the coating porosity. Ap is the pixel area of the porous region (5177 × 331 pixels), and At is the total pixel area of the field of view (796,792). The porosity of the coating was approximately 0.65%, which is consistent with the characteristics of HVOF-sprayed coatings with a porosity of less than 1% [17,18]. This low porosity can effectively hinder the intrusion of aggressive ions, thereby providing strong support for the long-term protection offered by the coating [19,20].
Figure 4 shows the trend of microhardness variation from the Q345B substrate to the C276 coating. The hardness of the substrate varied slightly in different test areas, whereas the hardness distribution of the coating showed an upward trend, reaching a global peak at 100–250 μm. As the coating thickness continued to increase, the hardness decreased. Combined with Figure 3, this may be because the area near the substrate interface cools quickly, resulting in high porosity and, thus, lower hardness in this region. As the thickness increased, the cooling rate decreased, compressive residual stress accumulated, coating became denser, and hardness increased. As the coating continues to thicken, heat accumulation intensifies, oxidation and porosity increase, and hardness decreases somewhat [21,22,23]. Ultimately, it stabilizes at approximately 500 HV, which is approximately four times the hardness of Q345B (the hardness of Q345B is approximately 150 HV).
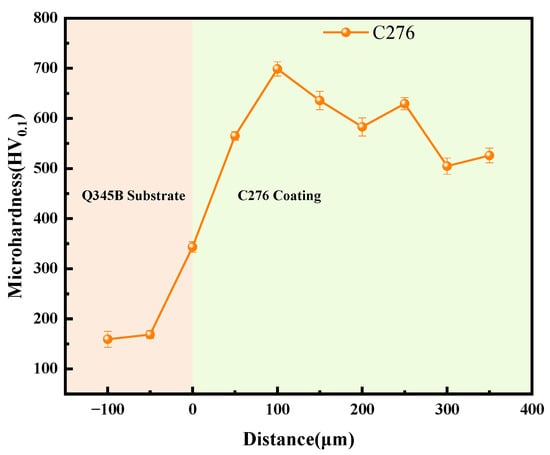
Figure 4.
The microhardness variation trend from the Q345B substrate to the C276 coating.
3.3. Electrochemical Testing Results
Figure 5 shows the polarization curves of the C276 coatings and Q345B samples immersed for different durations in 3.5 wt.% NaCl solution, from which the corresponding self-corrosion potential (Ecorr) and self-corrosion current density (icorr) were obtained. Ecorr represents the corrosion tendency of the metal, whereas icorr characterizes the corrosion rate of the material [24]. It can be seen that the coating at 0 h of immersion has a relatively most positive corrosion potential (−0.35 V), while after immersion for 24 h and 720 h, the corrosion potential decreases to −0.43 V and −0.62 V, respectively. However, at 1440 h, it increased slightly to −0.51 V, indicating that the corrosion tendency decreased when immersed for 1440 h. According to Table 4, icorr gradually increased from 2.85 × 10⁻⁷ A/cm2 at 0 h to 5.70 × 10⁻⁷ A/cm2 at 24 h and 3.72 × 10⁻⁶ A/cm2 at 720 h, indicating that the corrosion rate continued to increase for the first 720 h. At 1440 h, icorr decreased to 1.81 × 10⁻⁶ A/cm2, suggesting that the corrosion rate slowed after long-term immersion. In Table 4, βa and βc represent the anodic and cathodic Tafel slopes, respectively, which reflect the sensitivity of the anodic and cathodic reaction rates to changes in potential. It can be seen that at 24 h of immersion, |βc| > |βa|, indicating the cathodic reaction is suppressed and active dissolution occurs at the anode. At 720 h, |βc| ≈ |βa|; combined with icorr, the corrosion current density at this time should be at its maximum. At 1440 h, |βa| > |βc|, indicating that the anodic process was suppressed. Overall, among the three immersion periods, the corrosion tendency of the 720 h sample was the highest, whereas that of the 1440 h sample was the lowest. In comparison, the Ecorr of the Q345B substrate was generally kept below −0.75 V, and icorr was always greater than 1.84 × 10⁻⁶ A/cm2. Although βa and βc increase at some intervals, their overall corrosion resistance is noticeably inferior to that of the coating.
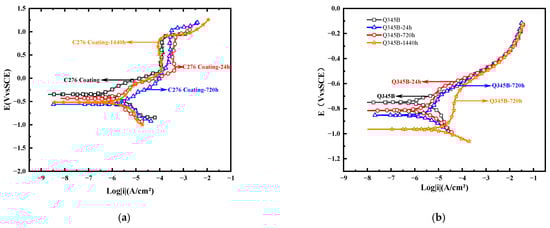
Figure 5.
Polarization curves of the C276 coating and Q345B soaked in 3.5 wt.% NaCl solution for different durations (a,b) (a new parallel working electrode was used for each curve).
Table 4.
The fitted Tafel curve values for the C276 coating and Q345B after immersion in 3.5 wt.% NaCl solution for different durations.
Figure 6 shows the Nyquist plots (a), (b) and Bode plots (c), (d) and (e), (f) of C276 coatings and Q345B after immersion in 3.5 wt.% NaCl solution for different periods of time. Overall, as the immersion time increased, the capacitive arc radius of the coating decreased gradually. However, at 1440 h, an increase was observed, indicating that the coating had a better overall corrosion resistance at this time. The arc radius at 720 h was the smallest, suggesting the strongest tendency for corrosion. The Bode plot (c) shows that the impedance modulus (|Z|) of each coating at the lowest frequency (0.01 Hz) [25] first decreased and then increased over time. In the Bode phase angle plot (d)), the C276 coating exhibits two time constant features at 0 and 24 h of immersion, which may be related to the presence of pores and microcracks on the surface [26]. When soaked for 720 and 1440 h, a single broad phase angle peak appeared, with the peak value at 1440 h being slightly higher than that at 720 h. Overall, the coating exhibited better protective performance at 1440 h, which is consistent with the results obtained from previous polarization curve measurements. According to Figure 6b,e,f, both the capacitive arc radius and the impedance modulus at the lowest frequency (|Z| 0.01 Hz) of Q345B show a decreasing trend over time, whereas the Bode phase angle plots display the characteristics of a single broad frequency peak for each soaked sample.
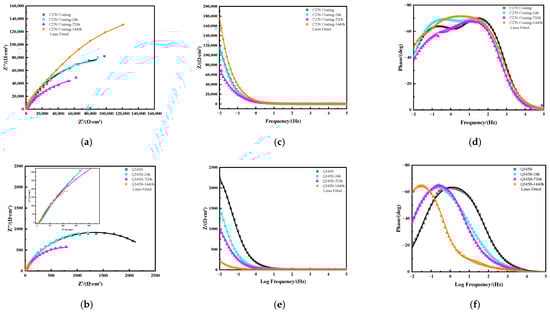
Figure 6.
Nyquist plots of the C276 coating and Q345B after immersion in 3.5 wt.% NaCl solution for different times (a,b), and Bode plots of C276 coating (c,d) and Q345B (e,f).
Figure 7 shows the fitted circuit diagrams of the C276 and Q345B coatings after immersion in 3.5 wt.% NaCl solution for different periods. In equivalent circuit (a), Rs represents the solution resistance, Rct is the charge transfer resistance, and Qdl is the double-layer capacitance corresponding to Rct. In equivalent circuit (b), Qf1 denotes the capacitance beneath the corrosion product film, Rpl is the resistance of the corrosion product film, and Rs, Rct, and Qdl have the same meanings as in (a). Table 5 shows the results obtained by fitting the equivalent circuit diagrams. For the coated samples at 0 and 24 h, two time constants were observed in the Bode phase angle diagrams (Figure 6d), which were presumed to be caused by the surface oxide film of the C276 coating and defects in the coating. At 720 and 1440 h, a relatively broad peak appeared over a wide frequency range, indicating that the appearance of corrosion products during long-term immersion led to the formation of a double-layer structure (i.e., an inner and outer rust layer). Therefore, for the coated samples, the equivalent circuit diagram (b) was used for fitting. For the Q345B samples, only a single time constant was observed within a narrow frequency range at 0 and 24 h of immersion in the Bode phase angle diagrams (Figure 6f), corresponding to a single charge transfer process at the working electrode surface. Thus, the equivalent circuit diagram (a) was used for fitting. When immersion reached 720 and 1440 h, corrosion products formed on the steel surface (double-layer structure); thus, the equivalent circuit diagram (b) was chosen. The total polarization resistance Rp comprehensively reflects the combined contributions of multiple parallel resistances [27]. Figure 8a,b show the trend of the total polarization resistance (Rp) for the C276 coating and Q345B. The Rp trend for the C276 coating displayed a “V”-shaped pattern, first decreasing and then increasing, indicating that its corrosion resistance first decreased and then improved. In contrast, the Rp of Q345B continuously decreased, demonstrating a continuous reduction in its corrosion resistance. This is consistent with the conclusions drawn from the polarization curves, Nyquist plots, and Bode plots. In summary, it can be reasonably inferred that the coating can maintain good corrosion resistance during long-term service in natural conditions.
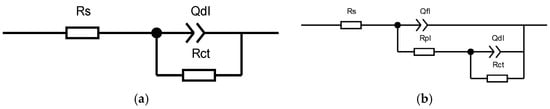
Figure 7.
Equivalent circuit diagram for EIS fitting of the C276 coating and Q345B after immersion for different durations. (a) is the equivalent circuit diagram used for fitting the short-term immersed Q345B specimen, and (b) is the equivalent circuit diagram used for fitting both the C276-coated specimen and the long-term immersed Q345B specimen.
Table 5.
Impedance fitting results of C276 coating and Q345B after immersion for different durations in 3.5 wt.% NaCl solution.
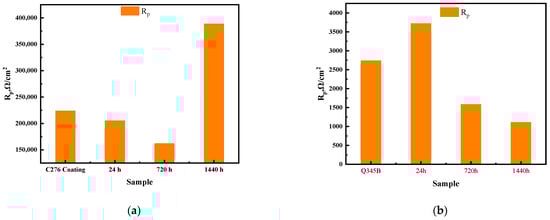
Figure 8.
Fitting trend of Rp for C276 coating and Q345B immersed in 3.5 wt.% NaCl solution for different durations (a,b).
3.4. The Immersion Test Results
Figure 9 shows the XRD patterns of the C276 coating after soaking in 3.5 wt.% NaCl solution for different durations. The surface of the coating soaked for 0 h is mainly composed of Cr and CoCr2O4 oxides, which is believed to result from the oxidation of the sprayed powder during the HVOF process [28]. After soaking for 24 h, the surface CoCr2O4 mixture disappeared and was replaced by Ni-Cr-Co-Mo and CrO2 oxides, indicating that CoCr2O4 decomposed during the subsequent soaking process, resulting in the formation of the Ni-Cr-Co-Mo phase. After soaking for 720 h, NiCr2O4 [29] and Ni2O3 appeared. After soaking for 1440 h, the Ni-Cr-Co-Mo phase peaks disappeared, and FeNi solid solution and Fe3O4 appeared. This may be related to the oxidation of a small amount of Fe in C276 alloy.
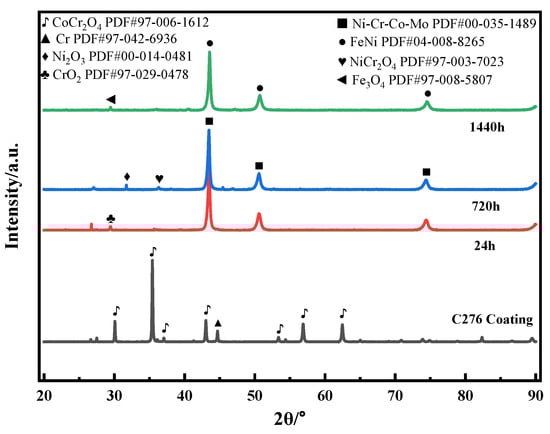
Figure 9.
XRD patterns of the C276 coating soaked in 3.5 wt.% NaCl solution for different durations.
The corrosion rates at each stage of the weight loss test are listed in Table 6. As the immersion time increased, the corrosion rate of the coating initially increased and then decreased, reaching a global minimum corrosion rate of 0.259 mm/y after 1440 h of immersion time. The corrosion rate of Q345B obtained in the weight loss test was higher than that of the C276 coating, and as the immersion time increased, the corrosion rate of Q345B showed an increasing trend, reaching 0.850 mm/y at 1440 h. Figure 10 and Table 7 show the 3D profiles and surface roughness of the C276 coating after immersion in 3.5 wt.% NaCl solution for different periods of time. Among them, Ra, the average roughness, is a key quantitative indicator used to characterize the degree of microscopic surface irregularities of a material. Rp is the height from the highest peak on the surface profile to the centerline. Rc is the average value of the contour unit height (Zt), and Rt is the total height difference between the highest peak and lowest valley within the entire assessment length of the profile. With the increase in soaking time, the average surface roughness Ra gradually increased, reaching a decrease at 1440 h, with values of 2.31, 2.52, 2.71, and 2.36 µm, respectively. At 0 h of soaking, depressions on the surface were observed. After 24 h of soaking, distinct regions of depression became interconnected and expanded (Figure 10b), indicating signs of corrosion. At 720 h, the number of depressed regions increased, and the corroded areas were connected with each other, showing an expansion trend. After 1440 h of soaking, the distribution of depressions became more concentrated.
Table 6.
The corrosion rates of the C276 coating and Q345B after immersion in 3.5 wt.% NaCl solution for different periods.
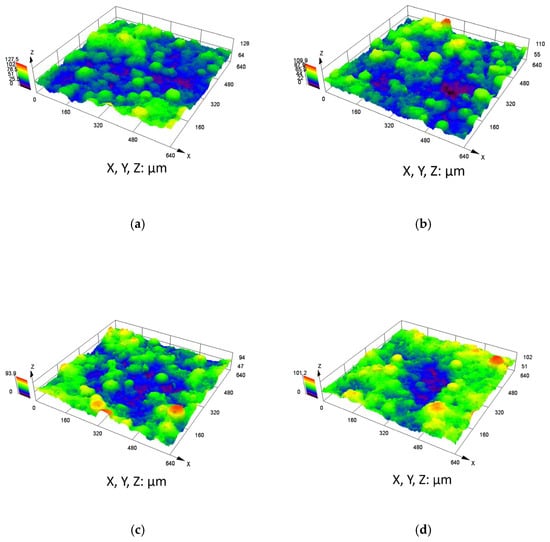
Figure 10.
Three-dimensional surface morphology of the C276 coating after immersion in 3.5 wt.% NaCl solution for different durations: (a) 0 h (b) 24 h (c) 720 h (d) 1440 h.
Table 7.
Statistical data on the roughness of the C276 coatings immersed in 3.5 wt.% NaCl solution for different durations.
Figure 11 shows the SEM surface morphology and EDS spectra of the C276 coating after immersion in 3.5 wt.% NaCl for various time periods. The results revealed the presence of semi-melted, unmelted, and spattered particles on the surface. The pores between unmelted particles and spatter particles may serve as preferential sites for pitting initiation [30,31]. After 24 h of immersion, no significant enrichment of O and Cl was observed on the coating surface. At immersion times of 720 and 1440 h, there was an enrichment of O and Fe in the pitting regions, with a large amount of Ni and Cr distributed around them. At 1440 h, the corrosion products at the defect sites were denser than those at 720 h.
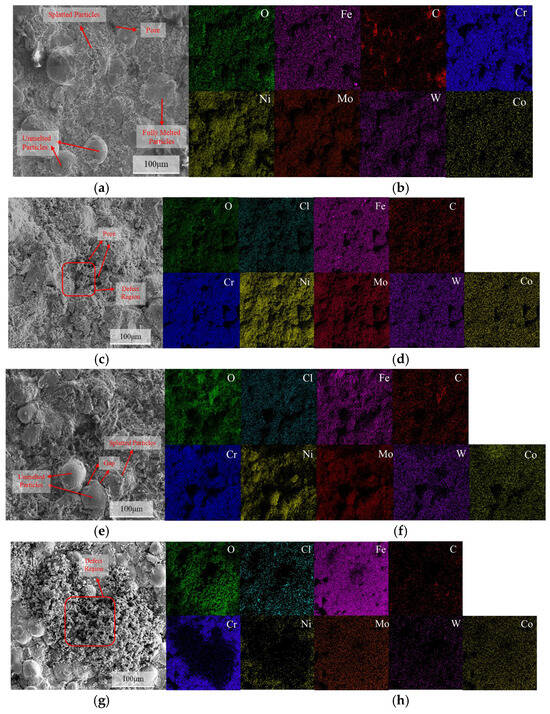
Figure 11.
The surface corrosion morphology of the C276 coating after immersion in 3.5 wt.% NaCl solution for different durations: (a) 0 h; (c) 24 h; (e) 720 h; (g) 1440 h, along with the corresponding energy dispersive spectroscopy (EDS) maps: (b) 0 h; (d) 24 h; (f) 720 h; (h) 1440 h.
Microscopic characterization of the sample surface after rust removal (Figure 12) revealed that with prolonged immersion, the corrosion damage to the coating intensified gradually. After soaking for 24 h, compared with the unsoaked state (Figure 11a), the surface pores were more pronounced, and microcracks appeared between the undissolved and molten particles, indicating that pitting and crevice corrosion had occurred. By 720 h, a large number of pores and cracks formed at the interface between the molten and splattered particles, and the overall porosity increased significantly. By 1440 h, crack propagation and a tendency for spalling were observed around the undissolved particles, whereas defect areas A and B began to merge owing to boundary corrosion.
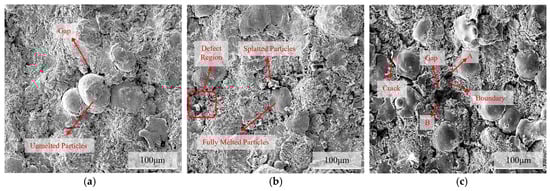
Figure 12.
Corrosion morphology of the C276 coating after rust removal on the surface immersed in 3.5 wt.% NaCl for different durations: (a) 24 h; (b) 720 h; (c) 1440 h.
After 24 h of immersion, the accumulation of corrosion products was observed in the crevices of the undissolved particles, as shown in Figure 13c, confirming that pitting corrosion had occurred in this region. Cross-sectional EDS analysis revealed no significant enrichment of oxygen and chlorine on the surface, whereas slight chromium enrichment was observed around undissolved particles, which may be associated with localized dissolution and initial passivation. As the immersion time increased to 720 h, the corrosion products gradually accumulated, primarily in the pitting defect regions. Composition analysis revealed that the coating comprised Cr, Fe, W, and O, indicating the continuous oxidation of the coating metal. When immersed for 1440 h, the corrosion products above the pores further increased and became more compact, and they were primarily composed of O, Fe, and Mo. The dense layer of corrosion products effectively hinders the further penetration of corrosive species, thereby suppressing the propagation of localized corrosion.
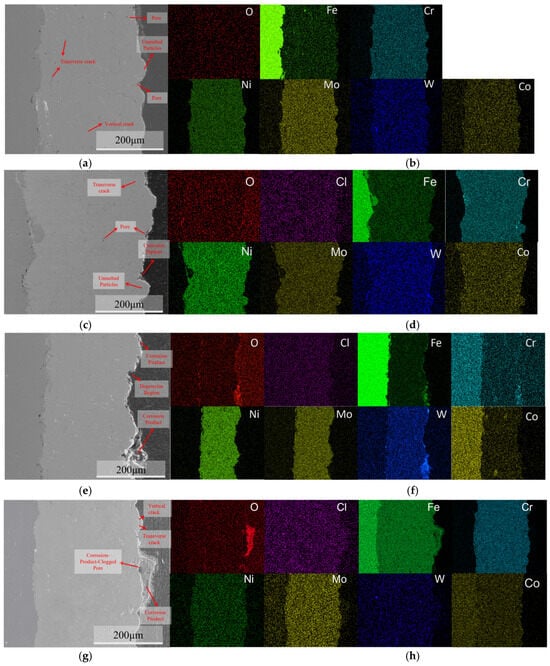
Figure 13.
Cross-sectional morphologies of the C276 coating after immersion in 3.5 wt.% NaCl solution for different durations: (a) 0 h; (c) 24 h; (e) 720 h; (g) 1440 h, and corresponding energy-dispersive spectroscopy (EDS) maps: (b) 0 h; (d) 24 h; (f) 720 h; (h) 1440 h.
4. Discussion
4.1. Coating Electrochemical Corrosion Mechanism
As is well known, in a NaCl solution environment, Cl− ions tend to accumulate preferentially at defect sites in the passivation film on the coating surface owing to their strong penetrability and adsorption capabilities. This accumulation undermines the stability of the passivation film and triggers pitting corrosion initiation. Through electrochemical synergistic effects, it further promotes anodic dissolution and cathodic reactions, ultimately leading to galvanic corrosion, stress corrosion cracking [32,33], or coating delamination failure, thereby accelerating the corrosion process of the substrate metal at the defect sites [34,35]. The prepared coating surface contained CoCr2O4 oxide, which reduced the transport rate of electrons and ions, thereby increasing the electrochemical inertness of the entire coating/solution interface [36,37]. At this point (0 h), the cathodic reaction is mainly depolarized by oxygen reduction, following the reaction:
At this time (0 h), it exhibited excellent corrosion resistance. After 24 h, owing to the corrosive effect of Cl−, the surface CoCr2O4 components dissolved, exposing fresh alloy regions. This causes the active metal and residual passive film to jointly form a heterojunction electrode structure similar to a “bare alloy-passive film” interface [29,38,39], which increases the driving force for localized corrosion.
As the anodic reaction area expanded, the electrochemical mixed potential shifted negatively, the corrosion current density increased significantly, and the radius of the capacitance arc decreased to some extent, indicating an overall enhancement in the corrosion driving force. Combining Figure 12a and Figure 13c, it can be seen that the corrosion process is at the pitting initiation stage and has not yet developed into metastable or stable pits. After soaking for 720 h, corrosion products were formed at the defects. Although these products are not dense, they make it somewhat more difficult for metal salt particles to migrate between the solutions inside and outside the pits. Consequently, the hydrolysis of metal salt particles decreases the pH inside the pits, further accelerating the corrosion of the coating [40]. At this point, the arc radius of the element is at its global minimum, the corrosion current density is at its global maximum, and the corrosion potential is at its most negative value. However, after soaking for 1440 h, the formation of dense Fe3O4 at defect sites led to the creation of occluded cell effects in micro-regions, resulting in local acidification. Therefore, the pitting areas continued to maintain a certain electrochemical corrosion driving force, causing the corrosion process to persist at the microscopic scale [41]. Although both Ecorr and icorr increased at 1440 h compared to 720 h, icorr did not return to the low level measured before immersion, indicating that while the corrosion inhibition effect strengthened, some corrosion activity remained.
4.2. The Influence of Pores and Corrosion Products on the Corrosion Behavior of Coatings
Using HVOF technology to prepare C276 coatings, thermodynamically stable CoCr2O4 oxides were detected on the surface. However, Cl− readily disrupts the Cr–O bonding network of the surface CoCr2O4 oxide, thereby weakening its protective function [42]. As a result, after 24 h of immersion, the surface CoCr2O4 dissolves, leading to pitting corrosion at defect sites on the coating after 24 h of immersion, which causes a reduction in corrosion resistance.
After soaking for 720 h, the dissolution of CoCr2O4 led to further exposure of the NiCr2O4 phase in the C276 powder, caused by thermal spraying. In theory, NiCr2O4 exists as a stable phase, which helps improve the oxidation resistance of the material [43]. However, by combining Figure 11e and Figure 13e, it can be seen that the pitting areas are covered by loose corrosion products. Simultaneously, Cl− in the solution can form soluble complexes with Ni2+, promoting the dissolution of nickel oxides [44], further weakening the surface’s protective capability and resulting in a decrease in the corrosion resistance of the coating.
After soaking for 1440 h, the XRD results indicated the presence of an FeNi solid solution and Fe3O4 on the coating surface. The existence of the FeNi phase is generally beneficial for enhancing the corrosion resistance of materials. Minqi Sheng and colleagues prepared Fe-Ni alloy layers on the surface of low-carbon steel using the thermal diffusion method. They found that when the Ni content exceeded 25 at.%, the resulting Fe-Ni solid solution significantly increased the self-corrosion potential and reduced the corrosion current density of the material in a 3.5 wt.% NaCl solution, demonstrating excellent corrosion resistance [45]. Fe3O4 has a certain degree of density and semiconductor properties, and the defect regions can hinder ion transport to some extent, slowing the further penetration of corrosive media into the interior of the coating [46]. Therefore, the corrosion rate increased during the initial and middle stages of immersion but slowed in the later stages. Therefore, the corrosion rate increased during the initial and middle stages of immersion but slowed in the later stages.
In summary, pitting corrosion primarily originates from defects, such as pores, on the coating surface. Therefore, future research should systematically optimize the spraying parameters to further reduce the formation of pores and microcracks in the coating, fundamentally enhancing its compactness of the coating structure.
5. Conclusions
- (1)
- Using HVOF technology, high-performance coatings with excellent corrosion resistance (compared to Q345B) and good economic efficiency can be successfully prepared on a Q345B steel substrate. The resulting C276 coating exhibited low porosity, few microcracks, and high microhardness values.
- (2)
- The corrosion rate of the coating initially increased, and then decreased during immersion. The corrosion resistance of the coating decreased after 24 h of immersion compared to that in the initial state, with the corrosion rate reaching a maximum at 720 h. However, when the immersion time was extended to 1440 h, the corrosion rate decreased, demonstrating optimal comprehensive corrosion resistance among the three immersion periods.
- (3)
- In the initial stage of immersion, the coating experienced pitting initiation, resulting in a decrease in corrosion resistance compared to that before immersion. As the soaking time increased, the corrosion products gradually accumulated at the defect sites to form a dense oxide layer, effectively blocking the corrosive medium from further penetrating the coating through the pores. Simultaneously, during the later stage of immersion, FeNi phases and dense Fe3O4 formed on the surface of the C276 coating, enhancing the stability of the surface passive film and thus exhibiting excellent long-term corrosion resistance.
Author Contributions
Conceptualization: Z.L. (Zhiyong Liu) and P.L.; methodology, L.Y. and C.D.; software, L.Y. and Z.L. (Zhong Li); validation, Z.C., Z.L. (Zhong Li) and C.D.; formal analysis, Z.L. (Zhong Li) and Z.C.; investigation, C.D. and H.M.; resources, Z.L. (Zhiyong Liu); data curation, L.Y. and P.L.; writing—original draft preparation, L.Y.; writing—review and editing, P.L. and Z.L. (Zhiyong Liu); visualization, Z.L. (Zhong Li); supervision, Z.C. and H.M.; project administration, H.M. and C.D.; funding acquisition, Z.L. (Zhiyong Liu). All authors have read and agreed to the published version of the manuscript.
Funding
This research was funded by National Science and Technology Resources Investigation Program of China (Grant No. 2021FY100602).
Data Availability Statement
The original contributions presented in this study are included in the article. Further inquiries can be directed to the corresponding authors.
Conflicts of Interest
The authors declare no conflicts of interest.
References
- Sun, B.; Pan, Y.; Yang, J.; Guo, J.; Zhao, B.; Liu, X.; Liu, Z.; Li, X. Microstructure evolution and SSCC behavior of strain-strengthened 304 SS pre-strained at room temperature and cryogenic temperature. Corros. Sci. 2023, 210, 110855. [Google Scholar] [CrossRef]
- Sun, B.; Wang, X.; Li, Y.; Huang, X.; Pan, Y.; Yan, L.; Zhang, Y.; Sun, M.; Lu, L.; Liu, Z.; et al. Investigating the environmental factors on corrosion and stress corrosion cracking behavior of Ti-6Al-3Nb-2Zr-1Mo alloy in simulated seawater. Corros. Sci. 2026, 259, 113487. [Google Scholar] [CrossRef]
- Little, B.J.; Blackwood, D.J.; Hinks, J.; Lauro, F.M.; Marsili, E.; Okamoto, A.; Rice, S.A.; Wade, S.A.; Flemming, H.C. Microbially influenced corrosion—Any progress? Corros. Sci. 2020, 170, 108641. [Google Scholar] [CrossRef]
- Shokri, A.; Sanavi Fard, M. Corrosion in seawater desalination industry: A critical analysis of impacts and mitigation strategies. Chemosphere 2022, 307, 135640. [Google Scholar] [CrossRef]
- Chen, J.; Liu, J.; Wang, H.; Li, B.; Hu, Q.; Shao, T.; Yang, R.; Wang, B.; Wan, Q.; Li, Z.; et al. Experimental Study on Neutral Salt Spray Accelerated Corrosion of Metal Protective Coatings for Power-Transmission and Transformation Equipment. Coatings 2023, 13, 480. [Google Scholar] [CrossRef]
- Guipont, V.; Fauvarque, J.P.; Beauvais, S.; Jeandin, M.; Le Guyader, H.; Lepresle, H.; Grolleau, A.M. Ceramic Coating of Alloy 625 using Controlled Atmosphere Plasma Spraying for Sea Water Corrosion Protection. Int. Therm. Spray Conf. 2003, 83638, 255–261. [Google Scholar] [CrossRef]
- Wielage, B.; Hofmann, U.; Steinhauser, S.; Zimmermann, G. Improving wear and corrosion resistance of thermal sprayed coatings. Surf. Eng. 1998, 14, 136–138. [Google Scholar] [CrossRef]
- Qin, Y.; Wu, Y.; Zhang, J.; Hong, S.; Guo, W.; Chen, L.; Liu, H. Optimization of the HOVF Spray Parameters by Taguchi Method for High Corrosion-Resistant Fe-Based Coatings. J. Mater. Eng. Perform. 2015, 24, 2637–2644. [Google Scholar] [CrossRef]
- Kawakita, J.; Kuroda, S.; Fukushima, T.; Kodama, T. Corrosion Resistance of HastelloyC Coatings Formed by an Improved HVOF Thermal Spraying Process. Mater. Trans. 2003, 44, 253–258. [Google Scholar] [CrossRef]
- GB/T 11373-2008; Thermal Spraying—Metallic and Non-Metallic Coatings—General Technical Requirements. Standards Press of China: Beijing, China, 2008.
- GB/T 16545-2015; Corrosion of Metals and Alloys—Removal of Corrosion Products from Corrosion Test Specimens. Standards Press of China: Beijing, China, 2015.
- Palanisamy, K.; Gangolu, S.; Mangalam Antony, J. Effects of HVOF spray parameters on porosity and hardness of 316L SS coated Mg AZ80 alloy. Surf. Coat. Technol. 2022, 448, 128898. [Google Scholar] [CrossRef]
- Sadeghimeresht, E.; Markocsan, N.; Nylén, P. A Comparative Study of Corrosion Resistance for HVAF-Sprayed Fe- and Co-Based Coatings. Coatings 2016, 6, 16. [Google Scholar] [CrossRef]
- Sadeghi, E.; Joshi, S. Chlorine-induced high-temperature corrosion and erosion-corrosion of HVAF and HVOF-sprayed amorphous Fe-based coatings. Surf. Coat. Technol. 2019, 371, 20–35. [Google Scholar] [CrossRef]
- Wang, Y.; Hao, E.; An, Y.; Hou, G.; Zhao, X.; Zhou, H. The interaction mechanism of cavitation erosion and corrosion on HVOF sprayed NiCrWMoCuCBFe coating in artificial seawater. Appl. Surf. Sci. 2020, 525, 146499. [Google Scholar] [CrossRef]
- GB/Z 45463-2025; Determination of Porosity of Thermal Spray Coatings. Standards Press of China: Beijing, China, 2025.
- Sharma, R.K.; Kumar, S.R. Comparative investigation of high-velocity oxy fuel and plasma coating process on mechanical and wear properties of iron alloy-based coating materials. Proc. Inst. Mech. Eng. Part E J. Process Mech. Eng. 2025. [Google Scholar] [CrossRef]
- Liu, C.; Mao, Z.; Xu, X. Research on the coating parameters and properties of Cr3C2-NiCr coating sprayed by HVOF. J. Phys. Conf. Ser. 2025, 2961, 12001. [Google Scholar] [CrossRef]
- Wang, Q.; Kainuma, S.; Yang, H.; Kim, A.; Nishitani, T. Durability and corrosion resistance of defective Zn- and Al-based thermal spray coatings on carbon steel plates in high-chloride environments. Results Eng. 2025, 28, 108206. [Google Scholar] [CrossRef]
- Singh, J.K.; Lee, H.-S. Enhanced corrosion resistance properties of 15Al-85Zn coating by post-treatment with sodium hexa-meta phosphate in saline solution. Corros. Sci. 2024, 226, 111684. [Google Scholar] [CrossRef]
- Khalid, A.; Abbas, M.; Zhang, Y.; Hyland, M.; Munroe, P.R. Microstructural study of Ni and Ni-20Cr particles plasma sprayed on stainless steel substrate at 300 °C. Appl. Surf. Sci. 2022, 592, 153320. [Google Scholar] [CrossRef]
- Gao, R.; Huang, Y.; Zhou, X.; Ma, G.; Jin, G.; Li, T.; Wang, H.; Liu, M. Material system and tribological mechanism of plasma sprayed wear resistant coatings: Overview. Surf. Coat. Technol. 2024, 483, 130758. [Google Scholar] [CrossRef]
- Zhang, L.; Luo, F.; Zhou, Y.; Cao, Y.; Zhang, Q.; Wang, C.; Li, Y.; Qing, Y. Enhanced thermal radiation blocking of plasma spraying thermal barrier coatings with a bimodal splat thickness distribution. J. Eur. Ceram. Soc. 2025, 45, 117068. [Google Scholar] [CrossRef]
- Yang, K.; Jiang, Z.; Chen, C.; Zhang, S.; Liu, X. Investigation on the microstructure, tribological performance and corrosion resistance of Ni–Mo coatings deposited by HVOF and APS methods. Vacuum 2022, 200, 111023. [Google Scholar] [CrossRef]
- Li, J.; Cui, J.; Yang, J.; Li, Y.; Qiu, H.; Yang, J. Reinforcement of graphene and its derivatives on the anticorrosive properties of waterborne polyurethane coatings. Compos. Sci. Technol. 2016, 129, 30–37. [Google Scholar] [CrossRef]
- Nayak, S.K.; Kumar, A.; Laha, T. Developing an Economical Wear and Corrosion Resistant Fe-Based Metallic Glass Composite Coating by Plasma and HVOF Spraying. J. Therm. Spray Technol. 2021, 31, 1317–1329. [Google Scholar] [CrossRef]
- Dhinakarraj, C.K.; Perumal, G.; Senthilkumar, N.; Deepanraj, B. Exploring the morphologies and corrosion performances of AZ31 alloy composites reinforced with silicon nitride. Results Surf. Interfaces 2024, 14, 100180. [Google Scholar] [CrossRef]
- Chen, Y.; Zhao, X.; Xiao, P. Effect of surface curvature on oxidation of a MCrAlY coating. Corros. Sci. 2020, 163, 108256. [Google Scholar] [CrossRef]
- Verma, R.; Kaushal, G.; Bala, N. Comparative Assessment on the Behavior of HVOF Sprayed Ni-Based Alloy Coatings on SA213-T22 Boiler Tube Steel in Actual Biomass Fired Boiler Environment. J. Therm. Spray Technol. 2023, 32, 918–935. [Google Scholar] [CrossRef]
- Shi, J.; Wu, M.; Ming, J. Degradation effect of carbonation on electrochemical behavior of 2304 duplex stainless steel in simulated concrete pore solutions. Corros. Sci. 2020, 177, 109006. [Google Scholar] [CrossRef]
- Kiourtsidis, G.E.; Skolianos, S.M. Pitting corrosion of artificially aged T6 AA2024/SiCp composites in 3.5wt.% NaCl aqueous solution. Corros. Sci. 2007, 49, 2711–2725. [Google Scholar] [CrossRef]
- Sun, B.; Huang, X.; Pan, Y.; Yan, T.; Zhang, Y.; Sun, M.; Liu, Z.; Fan, L.; Li, X. A comparative study on the passive film and SCC behavior of Ti-6Al-3Nb-2Zr-1Mo alloy at various test temperatures in simulated seawater. Corros. Sci. 2024, 233, 112066. [Google Scholar] [CrossRef]
- Sun, B.; Wang, Q.; Pan, Y.; Liu, Z.; Du, C.; Li, X. Understanding the non-steady electrochemical mechanism on SCC of 304 SS under applied polarization potentials. Corros. Sci. 2024, 227, 111686. [Google Scholar] [CrossRef]
- Wang, Z.; Seyeux, A.; Zanna, S.; Maurice, V.; Marcus, P. Chloride-induced alterations of the passive film on 316L stainless steel and blocking effect of pre-passivation. arXiv 2019. [Google Scholar] [CrossRef]
- Cui, Y.-W.; Chen, L.-Y.; Chu, Y.-H.; Zhang, L.; Li, R.; Lu, S.; Wang, L.; Zhang, L.-C. Metastable pitting corrosion behavior and characteristics of passive film of laser powder bed fusion produced Ti–6Al–4V in NaCl solutions with different concentrations. Corros. Sci. 2023, 215, 111017. [Google Scholar] [CrossRef]
- Zhao, W.; Zhang, L.; Zhao, H.; Yuan, C.; Yan, J.; Li, Z.; Xin, L.; Li, C.; Wu, F.; Ye, S.; et al. Anticorrosion behavior and enhanced wear resistance of Ni–P–GO–Y composite coating on the surface of NdFeB permanent magnet. J. Mater. Sci. 2024, 59, 11510–11532. [Google Scholar] [CrossRef]
- Wang, X.; Mercier, D.; Zanna, S.; Seyeux, A.; Perriere, L.; Laurent-Brocq, M.; Guillot, I.; Maurice, V.; Marcus, P. Effects of Chloride Ions on Passive Oxide Films Formed on Cr-Fe-Co-Ni(-Mo) Multi-Principal Element Alloy Surfaces. J. Electrochem. Soc. 2023, 170, 41506. [Google Scholar] [CrossRef]
- Zamani, P.; Valefi, Z. Characterization and Early-Stage Oxidation Behavior of CoNiCrAlY/Nano-Al2O3 Composite Coatings Using Satellited Powders Deposited by HVOF and LPPS Processes. J. Therm. Spray Technol. 2023, 32, 2525–2538. [Google Scholar] [CrossRef]
- Patel, P.; Munagala, V.N.V.; Sharifi, N.; Roy, A.; Alidokht, S.A.; Harfouche, M.; Makowiec, M.; Stoyanov, P.; Chromik, R.R.; Moreau, C. Influence of HVOF spraying parameters on microstructure and mechanical properties of FeCrMnCoNi high-entropy coatings (HECs). J. Mater. Sci. 2024, 59, 4293–4323. [Google Scholar] [CrossRef]
- Xu, Y.; Zhang, Q.; Chen, H.; Zhao, Y.; Huang, Y. Experimental study on erosion-corrosion of carbon steel in flowing NaCl solution of different pH. J. Mater. Res. Technol. 2022, 20, 4432–4451. [Google Scholar] [CrossRef]
- Zhang, P.; Zhang, H.; Hu, W.; Wang, Y.; Wu, X.; Zhang, Z.; Ren, Z.; Zhai, X.; Zeng, X.; Tang, M. Research on the Corrosion Behavior of Mo/C276 Coating Deposited by HVOF Method in Deep-Sea Cold Seep Environments. Coatings 2025, 15, 194. [Google Scholar] [CrossRef]
- Wang, K.; Hong, S.; Wei, Z.; Hu, N.; Cheng, J.; Wu, Y. Long-term corrosion behavior of HVOF sprayed Cr3C2–NiCr coatings in sulfide-containing 3.5 wt.% NaCl solution. J. Mater. Res. Technol. 2021, 15, 3122–3132. [Google Scholar] [CrossRef]
- Aghili, S.E.; Shamanian, M.; Amini Najafabadi, R.; Ashrafi, H.; Marzbanrad, E.; Mahmoodkhani, Y.; Toyserkani, E. Evaluation of Short-Term Oxidation Mechanism of Laser Cladded Ni–Cr–C Coating on Titanium Aluminide Substrate. High Temp. Corros. Mater. 2023, 99, 311–329. [Google Scholar] [CrossRef]
- Jiang, Z.; Ding, Y.; Chen, Z.; Zuo, B. Quantitative characterization of the interfacial failure of metallic coatings on epoxy substrates in salty atmospheres. Polym. J. 2025, 57, 1015–1023. [Google Scholar] [CrossRef]
- Sheng, M.Q.; Xu, J.F.; Wan, K.; Lv, C.K. Preparation and Corrosion Resistance Performance of Fe-Ni Alloy Coating on Surface of Mild Steel. Cailiao Yanjiu Xuebao/Chin. J. Mater. Res. 2013, 27, 183–188. [Google Scholar]
- Ni, J.; Ma, H.; Wei, W.; An, X.; Yu, M.; Hu, J. Novel Effect of Post-Oxidation on the Comprehensive Performance of Plasma Nitriding Layer. Coatings 2024, 14, 86. [Google Scholar] [CrossRef]


Disclaimer/Publisher’s Note: The statements, opinions and data contained in all publications are solely those of the individual author(s) and contributor(s) and not of MDPI and/or the editor(s). MDPI and/or the editor(s) disclaim responsibility for any injury to people or property resulting from any ideas, methods, instructions or products referred to in the content. |
© 2026 by the authors. Licensee MDPI, Basel, Switzerland. This article is an open access article distributed under the terms and conditions of the Creative Commons Attribution (CC BY) license.