Abstract
The hot deformation behavior of 6A82 aluminum alloy with a copper content of approximately 0.46 wt% was investigated by uniaxial compression tests in a temperature range of 320–530 °C and a strain rate range of 0.01–10 s−1. The effects of deformation heating and friction on flow stress were analyzed and corrected. The results revealed that the reduction in flow stress due to deformation heating is more pronounced at high strain rates (≥1 s−1) and low temperatures (≤390 °C) compared to other deformation conditions. The corrected data illustrated that deformation heating has a more significant influence on flow stress than friction. Hot deformation activation energy (Q) decreased from 322.63 to 236.22 kJ/mol with increasing strain. Based on the corrected flow stress, the evolution of processing maps and microstructural characterization were analyzed to evaluate workability and identify flow instabilities. It was found that strain has a slight effect on the efficiency of power dissipation, whereas the instability parameter varies considerably with increasing strain. The corresponding processing maps showed that the unstable regions undergo more complex variations than the stable regions throughout the hot deformation process. An optimum hot working domain was identified in the temperature range of 440–530 °C and strain rate of 0.01–0.37 s−1. Under these deformation conditions, fine grains and uniformly distributed particles are formed through extensive dynamic recrystallization and coarsening of second phase particles, which facilitate dislocation motion and promote the formation of a sub-grain boundary.
1. Introduction
Al–Mg–Si aluminum alloys have attracted considerable attention in the aerospace and automotive industry owing to their high strength, excellent corrosion resistance, and favorable plasticity [1]. Among these alloys, the 6082 aluminum alloy has achieved widespread commercial application in automotive body structures [2]. With the development of light vehicles, the forming performance of complex components made from 6082 aluminum alloy has presented a significant challenge. In order to provide the comprehensive mechanical properties of the materials, many studies were conducted on microstructure evolution and mechanical properties during the preparation and processing of aluminum materials based on alloy design [3,4,5]. Although previous studies established the correlations between hot deformation behavior and deformation parameter [6,7,8,9,10], the dynamic mechanical behavior of 6082 aluminum alloy with a high copper content has not been thoroughly investigated. Therefore, it is essential to systematically characterize the hot formability and corresponding microstructural evolution of 6A82 aluminum alloy with high copper content under dynamic loading conditions.
It has been well established that 6000 series aluminum alloys are primarily alloyed with Mg and Si. Among various strengthening mechanisms, precipitation hardening plays a critical role in these alloys and is strongly influenced by alloying elements. For example, the addition of Mn in 6082 aluminum alloy increases the activation energy for hot deformation and recrystallization resistance [11,12]. Er restricted Mg2Si growth and improved joint strengthening due to second phase strengthening [13]. However, in most literature, the Cu content in 6082 aluminum is relatively low, with a maximum chemical composition of 0.1% specified in its chemical composition standard [14,15,16,17,18]. In fact, the addition of Cu modifies the mechanical properties of 6xxx series alloys and alters the phase transformation sequence during aging [19,20]. This is attributed to the introduction of numerous equilibrium and metastable phases, such as θ phase (Al2Cu), T phase (Al2CuMg), and Q′ phase (Al5Cu2Mg8Si6), which significantly enhance mechanical performance [21,22]. Sonia Boczkal [23] reported a direct correlation between the copper content and the mechanical properties of Al–Mg–Si–(Cu) alloys. Specifically, when the Cu addition reaches 0.6 wt%, the formation of the Q′ phase increases the density and stability of precipitates, effectively retarding dislocation motion [24]. In contrast, Liu and Xiao [25,26] observed that adding 0.3–0.5 wt% Cu has no significant effect on the precipitation behavior of Al–Mg–Si alloys. Nevertheless, Cu-containing 6082 aluminum alloys exhibit higher flow stress and deformation activation energy than their Cu-free counterparts, indicating inferior workability [27]. Prasad et al. [28] constructed a processing map based on dynamic material modeling. In this approach, the work-piece is treated as a power dissipation system, in which the energy input is divided into two primary parts: plastic deformation-induced dissipation and microstructure transition-induced dissipation. The power dissipation efficiency (η), governed by microstructural evolution, is described by the following equation:
where m is the strain rate sensitivity. Generally, a higher η value indicates better hot workability of the material. However, the η value is not merely an indicator for evaluating the workability. The instability parameter can be expressed as follows:
The instability map is plotted based on the values of at various temperatures and strain rates. The processing map is obtained by superimposing the power dissipation map onto the instability map.
In this study, an ingot of 6A82 aluminum alloy containing 0.46 wt% Cu was employed. The flow stress considering deformation heating and friction effect, the processing map considering strain compensation, and the corresponding microstructure of 6A82 aluminum alloy were systematically investigated. The aim was to determine the hot workability and formability of the high-copper 6A82 aluminum alloy so as to provide a reference for subsequent alloy design and optimization of industrial hot deformation processes.
2. Experimental
In this work, an as cast 6A82 aluminum alloy with the chemical composition of Al-0.89 Mg-1.02 Si-0.46 Cu-0.15 Cr-0.12 Fe-0.5 Mn-0.01 Ni-0.02 Zn-0.05 Ti (wt%) was provided by Southwest Aluminum (Group) Co., Ltd., Chongqing, China. The ingot with a diameter of 160 mm was first homogenized at 540 °C for 6 h, after which cylindrical samples with dimensions Ø8 mm × 12 mm were machined from the homogenized sheet. At both ends of the sample, two grooves with a depth of 0.2 mm and a width of 0.4 mm were machined, as shown in Figure 1. The aim was to fill the lubricating fluid.
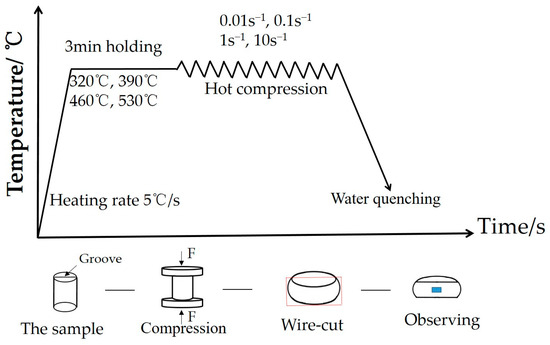
Figure 1.
Schematic diagram of hot compression tests.
Prior to hot compression, two thermocouples were welded onto the midpoint of the sample’s lateral surface. A lubricant mixture composed of 75% graphite, 20% engine oil, and 5% dimethyl phenyl phosphate was applied into the grooves at both ends of the sample to reduce friction between the sample and the pressure heads, as indicated by the arrows in the Figure 1. The sample was then mounted between the upper and lower pressure heads of the thermal simulation testing machine, and the direction of force application as indicated by the arrows in the Figure 1. The free ends of the thermocouples attached to the sample surface were connected to the temperature measurement equipment of the thermal simulation machine. Uniaxial compression tests were conducted on a Gleeble-1500 thermomechanical simulator system at temperatures ranging from 320 to 530 °C and strain rates between 0.01 and 10 s−1, as schematically illustrated in Figure 1. The samples were heated to target temperatures at a heating rate of 5 °C/s, held for 180 s to ensure uniform temperature distribution, and then subsequently deformed to a total true strain of ε = 1.2. After deformation, the samples were immediately quenched in water to preserve the microstructure. On the other hand, the deformation conditions such as temperature, strain, and strain rate were automatically controlled by the computer system. The acquisition of experimental data (load, time, stress, strain, temperature) was performed by the computer system. The true stress–true strain curves were subsequently plotted using Origin 8.0 software.
After the hot compression, the deformed sample was sectioned parallel to the compression axis along the direction of the centerline, as shown in the red rectangle of Figure 1. Microstructural characterization was carried out on the central deformation zone (as show in the blue rectangle in Figure 1) using scanning electron microscopy (SEM, Chongqing, China) and transmission electron microscopy (TEM, Chongqing, China). For SEM observation, the cut sample was sequentially ground on 800#, 1500#, and 4000# grit sandpapers. This was followed by electro-polishing in a solution of 10% HClO4 and 90% C2H5OH at −30 °C for 20 s. Back scattered electron (BSE) study was performed by a ZEISS AURIGA SEM (Oberkochen, Germany), operated at 15 kV. The BSE maps were acquired using a scanning speed of 7, a working distance of 8.0 mm, and an acceleration voltage of 10 kV. For TEM examination, the deformed sample was cut into 1 mm thin slices and subsequently ground to 60 μm foil using water-resistant sandpaper and metallographic sandpaper. The thin foils were twin-jet polished in a solution of 30% HNO3 and 70% CH3OH at −30 °C, operated at 15–20 V. The TEM observations were performed on a Zeiss Libra 200 FEI microscope operating at 200 kV.
3. Results and Discussion
3.1. Flow Stress
The stress–strain curves of 6A82 aluminum alloy are depicted in Figure 2. It can be seen that the flow stress increases with increasing strain rate and decreases with increasing temperature. At the initial stage of deformation, all stress–strain curves display a sharp peak immediately following yielding, indicating that work hardening remains the dominant deformation mechanism despite the onset of recrystallization. As deformation proceeds, the flow stress exhibits distinct morphological features under varying deformation conditions, which is attributed to the influence of dynamic softening behavior. At 320 °C, the flow stress for all strain rates decreases monotonically after the peak with increasing strain, suggesting that dynamic softening is sufficient to counteract work hardening. As the temperature increases, the flow stress after the peak stress gradually reaches a relatively stable state at 0.01–0.1 s−1, whereas it shows a slight upward trend at strain rates of 1–10 s−1. This observation suggests that dynamic softening and work hardening reach an approximately steady-state at low strain rates (≤0.1 s−1), whereas dynamic softening is insufficient to counteract work hardening at high strain rates (≥1 s−1). The variations of the stress–strain curves indicate that the flow stress is sensitive to strain rate, which is primarily associated with thermal softening and microstructural softening. Thermal softening is considered to originate from deformation heating. To analyze the effect of deformation heating on dynamic softening during hot deformation, the flow stress was corrected using the relationship proposed by Zhang [29,30]. The dots in Figure 2 represent the corrected flow stress. It can be seen that the corrected flow stresses show no significant difference compared to the experiment values at strain rates of 0.01–1 s−1, whereas they are higher than the experimental flow stresses at 320–390 °C with a strain rate of 10 s−1. This indicates that flow softening induced by adiabatic heating may be a key factor contributing to the progressive reduction in flow stress. Moreover, high strain rate significantly accelerates dislocation multiplication, which suppresses the development of dynamic recovery and dynamic recrystallization.
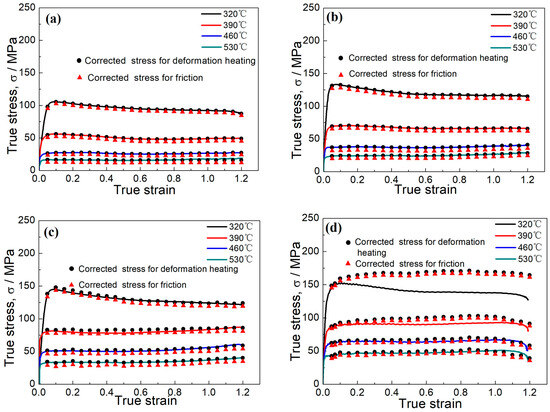
Figure 2.
True stress–strain curves of 6A82 aluminum alloy deformed under different conditions: (a) 0.01 s−1, (b) 0.1 s−1, (c) 1 s−1, and (d) 10 s−1.
As the deformation process progresses, the interface between the sample and dies increases with increasing strain, and the effect of friction cannot be neglected. Consequently, the sample exhibits a barreling phenomenon. As shown in Figure 3, H0 is the initial height of the sample before deformation, R0 is the initial radius, H is the height after deformation, RM is the maximum radius of the barrel, and RT is the radius at the two ends. To more accurately describe the flow behavior of materials, the friction coefficient μ can be calculated by the following equation:
where H and R are the height and radius of the deformed sample, respectively. b is the barrel parameter, , . In these equations, is the difference between the maximum and top radii, . is the difference in height between the initial sample and the deformed sample, . The flow stress for frictional effect is achieved as follows:
where P is the uncorrected flow stress, and C and K are given by Equations (5) and (6), respectively.
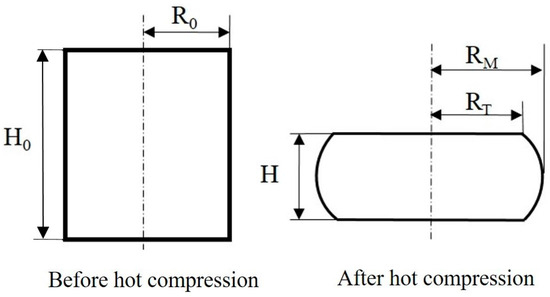
Figure 3.
The diagrams of the samples before and after hot compression.
By substituting the values of RM, RT and H at different strain levels into to the above equations, the friction coefficient exhibits scatter due to the measurement errors. However, it can be confirmed that K is equal to 1 when ε = 0. The sample is deformed to a total strain of ε = 1.2, the values of H, RM, and RT were measured, and the friction coefficient was 0.2132 and the value of K was 0.9458. Therefore, the relationship between K and ε is obtained from linear fitting based on two sets of data:
K = −0.04513ε + 1 (0 ≤ ε ≤ 1.2)
During hot compression, deformation heating and friction can occur simultaneously. The corrected flow stress for friction can be obtained based on the corrected flow stress for deformation heating, as illustrated by the triangle in Figure 2. It can be seen that the corrected flow stress for friction is slightly less than the flow stress before the correction, indicating that friction has a relatively minor influence on the flow stress compared to deformation heating.
3.2. Determination of Deformation Activation Energy
The hot deformation behavior can be described by the following equations [6,31]:
where is the strain rate, A is a material constant, is the flow stress under different strain level, n is the stress exponent, Q is the activation energy of hot deformation, R is the gas constant, T is the thermodynamic temperature, Z is the Zener–Hollomon parameter, and α stands for the stress multiplier [32].
According to the linear regression method [33], the activation energy of hot deformation can be calculated by Q = RnS, where n and S are the average slope of ln vs. ln[sinh(ασ)] and ln[sinh(ασ)]-1000/T, respectively. Figure 4 displays the variation of Q with strain. It can be seen that the Q value decreases monotonically with increasing strain, dropping from 322.63 to 236.22 kJ/mol. This indicates that the difficulty of plastic deformation decreases monotonically with increasing strain, with an average Q value of 256.81 kJ/mol. This value is comparable to the reported values for hot deformation of Al–Mg–Si–Cu–Zn alloy such as 256 kJ/mol in Al-0.9 Mg-0.7 Si-0.3 Cu-0.6 Zn alloy [32], 274 kJ/mol in Al–Mg–Si–Zr–Mn alloy [6], and the value of Q in the range of 260–400 kJ/mol in Al–Mg–Si alloys with 0.65–0.7 wt% Cu [34], while it is significantly higher than those reported for the low-copper 6xxx aluminum alloy such as 222.84 kJ/mol in solutionized 6082 aluminum alloy [17], 192 kJ/mol in Al-0.5 Mg-0.4 Si alloy [35], 194.86 in Al-0.5Mg-0.4Si alloy [36], the maximum value of 186.31 kJ/mol in Al–Mg–Si–Mn–Cr alloy [37] and 99–122 kJ/mol in homogenized 6082 aluminum alloy [38]. It was demonstrated that the hot workability of 6082 aluminum alloy deteriorates with higher copper content.
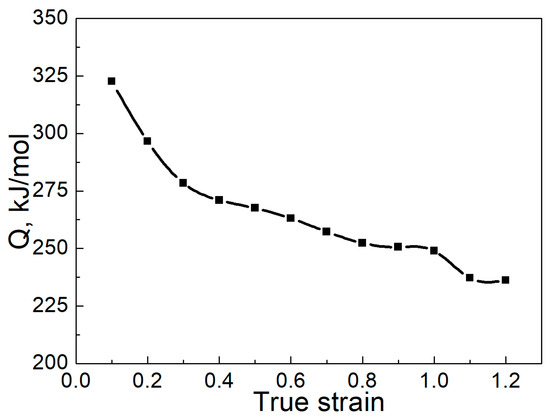
Figure 4.
Variation of Q with strain.
3.3. Processing Map
It has often been assumed that strain has a negligible effect on processing maps at elevated temperatures. Consequently, many studies have been made to define optimal hot working conditions for specific strain levels. However, recent research on materials such as Ti6Al4V alloy, nickel-based superalloy, Al–Mg–Si–Zr–Mn alloy, Al-0.5 Mg-0.4 Si alloy, and Al–Zn–Mg–Cu alloy has demonstrated that processing maps are in fact significantly affected by strain [39,40,41,42]. Given the inherent instability of metal deformation processes, incorporating strain is critical to accurately predict deformation parameters, which are reflected in the variations of the power dissipation efficiency (η) and instability parameter (ξ). The variation of η with strain is illustrated in Figure 5. At a strain rate of 0.01 s−1, the η values for the 390 °C and 530 °C samples first increase with increasing strain, then reach their maximum values (29.16% and 40.68%) at a strain of ε = 0.4, finally decreasing up to 21.45% and 28.71%, respectively. At 320 °C and 490 °C, η exhibits minor oscillations, varying within the ranges 13–25% and 22–31%, respectively (Figure 5a). As the strain rate increases, the η values at 460 °C and 530 °C are higher than those at 320 °C and 390 °C (Figure 5b,c), reflecting better workability at the medium to high temperature range. Moreover, η exhibits relatively plateau periods at temperatures above 390 °C, indicating a stable energy dissipation behavior. Notably, η values display pronounced oscillations across all temperatures at a strain rate of 10 s−1 (Figure 5d). These evolutions of η indicate that the combination of high temperature and medium-low strain rate enhances the stability of the metal deformation processes.
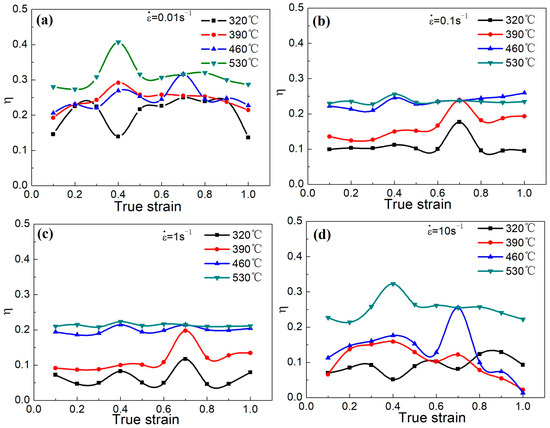
Figure 5.
Variation of η with strain under different conditions: (a) 0.01 s−1, (b) 0.1 s−1, (c) 1 s−1, and (d) 10 s−1.
Figure 6 presents the variation of the instability parameter (ξ) for 6A82 aluminum alloy under different deformation conditions. A negative ξ value is widely recognized as an indicator of unstable deformation tendency. At low strain rates (0.01–0.1 s−1), the ξ values for the 320 °C and 390 °C samples remain negative over most of the strain range, whereas those deformed at 460 °C and 530 °C maintain positive values (Figure 6a,b), reflecting poor workability at the low temperature range. As the strain rate increases, the ξ values for the 460 °C samples transform from positive to negative, indicating deformation instability under varying conditions (Figure 6c). According to Figure 6d, the variations of ξ with strain differ noticeably with temperature. At 320 °C, ξ fluctuates with increasing strain but remains positive over most of the strain range. For the 390 °C and 460 °C samples, ξ initially rises and then declines with increasing strain. At 530 °C, ξ retains positivity throughout the entire strain range and displays no obvious directional trend.
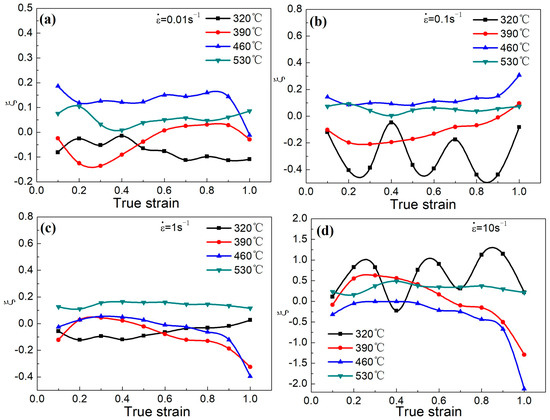
Figure 6.
Variation of ξ with strain under different conditions: (a) 0.01 s−1, (b) 0.1 s−1, (c) 1 s−1, and (d) 10 s−1.
Based on the results of the power dissipation efficiency and the instability parameter, the evolution of the processing map is illustrated in Figure 7. In this figure, contour values represent the power dissipation efficiency, while grey domains indicate flow instability regions. It can be seen that the minimum power dissipation efficiency occurs at low or high temperature combined with high strain rates, whereas the maximum power dissipation efficiency is located at the high temperature and low strain rate domain. However, the instability domains exhibit a clear dependence on strain, indicating that strain significantly affects the processing maps. At a strain of ε = 0.1, the instability domain extends from low temperature and low strain rate to high temperature and high strain rate, forming an S-shaped pattern on the processing map (Figure 7a). As the deformation proceeds, the instability domain at high temperature and high strain rate gradually shrinks and transitions to a stable domain by ε = 0.4, suggesting potential microstructural transitions under these deformation conditions (Figure 7b–d). By ε = 0.5, the instability domain shifts to span from the low temperature and low strain rate to the medium temperature and high strain rate domain, reflecting instability of workability (Figure 7e). As the strain increases from ε = 0.5 to ε = 0.6, the instability domain initially confined to 438–485 °C and 1.09–10 s−1 expands to a broader range of 377–507 °C and1.02–10 s−1 (Figure 7f). Additionally, the proportion of the instability domain increases with increasing strain, reaching a relatively steady state around ε = 0.8 (Figure 7f–h). A similar pattern persists at ε = 0.9, indicating improved deformation stability at medium to high strain levels (Figure 7i). It is worth noting that the influence of strain on the instability domain is less pronounced under the low temperature and low strain rate conditions compared to the high temperature and strain rate regimes. This discrepancy is likely attributable to deformation heating. Adiabatic heating at high strain rates introduces more complex deformation behavior than at low strain rates, leading to more intricate distributions of both power dissipation efficiency and instability parameters. To prevent microstructural defects, processing parameters should be selected from safe domains. Combining the evolution of the processing maps, the optimal hot deformation conditions are identified as 440–530 °C and 0.01–0.37 s−1.
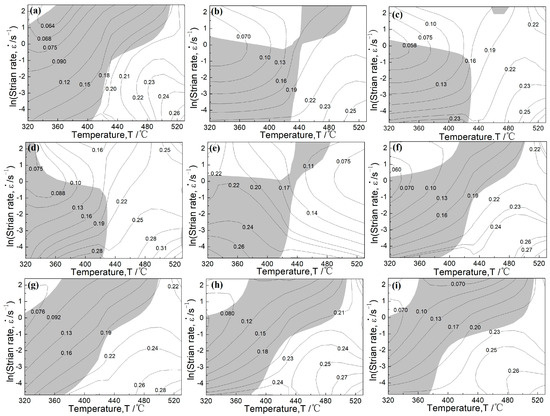
Figure 7.
Effect of strain on the processing maps of 6A82 aluminum alloy: (a) ε = 0.1, (b) ε = 0.2, (c) ε = 0.3, (d) ε = 0.4, (e) ε = 0.5, (f) ε = 0.6, (g) ε = 0.7, (h) ε = 0.8, and (i) ε = 0.9.
3.4. Microstructure
To clarify the microstructural characteristics in the safe and unstable domains, the corresponding microstructural evolution is presented in Figure 8. Loading direction of force is marked with red arrows in Figure 8. Undergoing deformation at 320 °C and 0.01 s−1, grains are elongated perpendicular to the compression axis. Fine precipitates are uniformly distributed within the deformed grains, while a small number of coarse, second phase particles are present along the grain boundaries (Figure 8a). A similar microstructure is observed after deformation at 320 °C and 10 s−1 (Figure 8b). Despite these conditions falling within instability domains on the processing map with average η values of 20.43% and 9.15%, respectively, no typical instability features are detected, suggesting that dynamic recovery is the main deformation mechanism under these conditions. In contrast, microstructures from the safe domains exhibit elongated grains accompanied by the majority of the newly recrystallized grains, indicating the occurrence of dynamic recrystallization (Figure 8c,d). Additionally, the sample deformed at 530 °C and 0.01 s−1 shows a higher fraction and larger average size of recrystallized grains compared to the one deformed at 460 °C and 0.1 s−1, implying greater consumption of stored energy. This is consistent with the higher power dissipation efficiency values (η = 23.42% and 31.13%, respectively) in these regions. The promoted DRX can be attributed to the elevated temperature, which accelerates recrystallization kinetics and nucleation, combined with the lower strain rate that allows more time for recovery and grain growth. Moreover, the average size and density of white second phase particles along the grain boundaries are greater in the safe domains than in the unstable zones. The average particles sizes in Figure 8c,d are about 3 μm and 4.8 μm, respectively, both exceeding the critical size required for particle stimulated nucleation. The presence of coarsened precipitates reduces the grain boundary pinning effect and facilitates the growth of recrystallized grains. Consequently, the safe domain demonstrated a higher dynamic recrystallization.
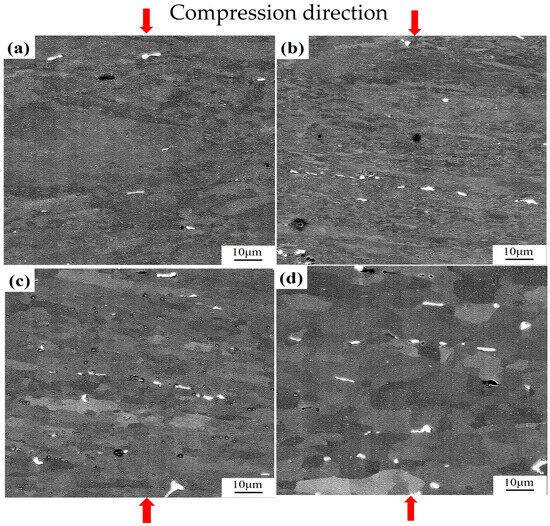
Figure 8.
SEM micrographs of 6A82 aluminum alloy under different conditions: (a) 320 °C, 0.01 s−1, (b) 320 °C, 10 s−1, (c) 460 °C, 0.1 s−1, and (d) 530 °C, 0.01 s−1.
In order to obtain more quantitative data, TEM characterization was employed to analyze the variations in substructure characteristics and second-phase particles. As shown in Figure 9a, the microstructure is composed mainly of elongated grains along with a majority of second phase particles, indicating the occurrence of dynamic recovery. It is of note that some grains exhibit high density dislocations, while others show almost no interior sub-grain structure, which is considered to have originated from the non-uniform distribution of multi-scale particles [43]. The presence of nanoscale dispersoids (Al(FeMn)Si), with an average diameter of about 19 nm, retard the dislocation motion and effectively suppress recovery. Conversely, the coarse particles (Al5Cu2Mg8Si6), ranging from 200 to 255 nm in diameter, are unevenly distributed within the grains. These larger particles have a limited grain boundary pinning effect, thereby promoting dislocation annihilation and leading to the formation of distinct substructures. As the strain rate increased, high density of dislocations and nanoscale dispersoids (Al(FeMn)Si) were observed. The coexistence of sub-grains and other sub-structural features suggests that dynamic softening is primarily associated with dynamic recovery (Figure 9b). After deformation at 460 °C and 0.1 s−1, a significant reduction in dislocation density and the formation of high angle grain boundaries indicate the occurrence of dynamic recrystallization. At the same time, the average sizes of lath-shaped particles (Al5Cu2Mg8Si6) and lamellar particles (Al(FeMn)Si) were approximately 0.7 μm and 80 nm, respectively, reflecting particle coarsening. The large lath-shaped particles are predominantly localized at grain boundaries, while the finer lamellar particles (Al(FeMn)Si) are dispersed throughout the grains (Figure 9c). Additionally, sub-grains and low-angle boundaries are observed. This microstructure suggests that dynamic softening is mainly dominated by particle coarsening, dynamic recovery, and dynamic recrystallization. At 530 °C and 0.01 s−1, the microstructure is dominated by high angle boundaries and a high density of particles (Figure 9d). The average size of lamellar particles increases to 125 nm, suggesting continued particle coarsening at elevated temperature and lower strain rate. Compared with Figure 9c, recrystallization is more pronounced, suggesting that the dominant softening mechanisms are dynamic precipitation coarsening and dynamic recrystallization.
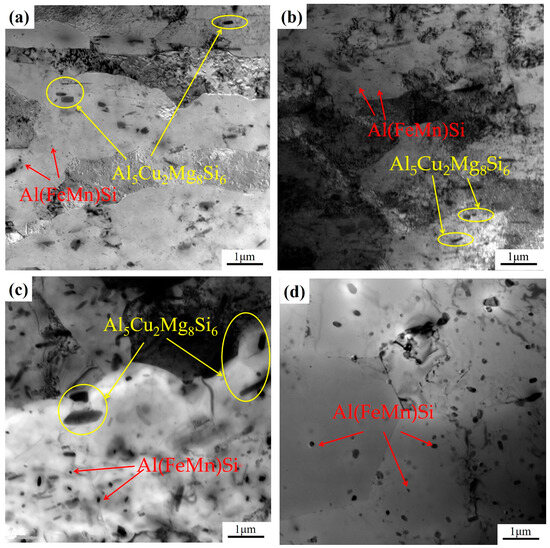
Figure 9.
TEM micrographs of 6A82 aluminum alloy under different conditions: (a) 320 °C, 0.01 s−1, (b) 320 °C, 10 s−1, (c) 460 °C, 0.1 s−1, and (d) 530 °C, 0.01 s−1. (The Al(FeMn)Si particles are marked with red arrows and the Al5Cu2Mg8Si6 particles are indicated by yellow circles).
4. Conclusions
In this study, the flow stress behavior, processing maps, and microstructure evolution of 6A82 aluminum alloy were investigated by isothermal compression tests over a temperature range of 320–530 °C with strain rates from 0.01 to 10 s−1. The main findings are summarized as follows:
- Deformation heating has a significant influence on the flow stress at low temperatures (T ≤ 390 °C) and high strain rates (≥1 s−1), while the frictional effect is relatively slight even at the high strain level. The activation energy of hot deformation was calculated from the corrected flow stress, ranging from 236.22 to 322.63 kJ/mol.
- Influence of strain on power dissipation efficiency is relatively minor at strain rates of 0.1–1 s−1, whereas the instability parameter exhibits significant strain dependence. In the processing maps, the instability domains first decrease and then increase with increasing strain, eventually reaching a relatively steady state. The optimal processing parameters were identified as temperatures between 440 and 530 °C and strain rates ranging from 0.01 to 0.37 s−1.
- Based on the processing maps, SEM and TEM observations under different conditions, it was confirmed that dynamic recovery is the main deformation mechanism in instability domains, whereas partial dynamic recrystallization and coarsening of second phase particles occur within the safe domains.
Author Contributions
Investigation, Data curation, and Writing—original draft, Q.Y. and G.L.; Project administration, Investigation, and Writing—revised, X.L. All authors have read and agreed to the published version of the manuscript.
Funding
This research was funded by the General Project of Chongqing Natural Science Foundation (cstc2021jcyjmsxmX0580).
Data Availability Statement
The original contributions presented in this study are included in the article. Further inquiries can be directed to the corresponding author.
Acknowledgments
The authors gratefully acknowledge the support provided by Chongqing University Electron Microscopy Center, Chongqing, China.
Conflicts of Interest
The authors declare no conflicts of interest.
References
- Lypchanskyi, O.; Chiu, C.-C.; Qayyum, F.; Korpała, G.; Guk, S.; Chao, C.-K.; Prahl, U. Temperature dependent deformation behavior and texture evolution in AA6082 aluminum alloy: An integrated experimental and crystal plasticity simulation approach. Int. J. Plast. 2024, 176, 103942. [Google Scholar] [CrossRef]
- Deng, L.; Zhang, H.-D.; Li, G.-A.; Tang, X.-F.; Yi, P.-S.; Liu, Z.; Wang, X.-Y.; Jin, J.-S. Processing map and hot deformation behavior of squeeze cast 6082 aluminum alloy. Trans. Nonferrous Met. Soc. China 2022, 32, 2150–2163. [Google Scholar] [CrossRef]
- Elgallad, E.M.; Liu, K.; Zhang, Z.; Chen, X.-G. Effect of transition elements on dispersoid formation and elevated-temperature mechanical properties in 6082 aluminum alloy. Philos. Mag. 2021, 29, 96–110. [Google Scholar] [CrossRef]
- Wang, X.M.; Khan, M.S.; Wells, M.A.; Poole, W.J.; Parson, N. Effect of Copper on Extrudability of High- Strength AA6082 Aluminum Alloys. Int. J. Mater. Manuf. 2025, 135, 1–22. [Google Scholar] [CrossRef]
- Plonka, B.; Żylka, K.; Remsak, K.; Rajda, M.; Zdunek, J.; Moszczyńska, D. Influence of copper content on the structure and properties of aluminium alloys. Arch. Civ. Mech. Eng. 2024, 24, 8. [Google Scholar] [CrossRef]
- Ghosh, A.; Elasheri, A.; Parson, N.; Chen, X.-G. Hot deformation behavior and processing maps for an Al-Mg-Si-Zr-Mn alloy. J. Alloys Metall. Syst. 2024, 6, 100077. [Google Scholar] [CrossRef]
- Zhao, Q.; Li, F.; Zhu, E.; Hashmi, A.; Niu, J.; Gopi, K.R. Understanding the isothermal compression behavior of Al-Mg-Si alloy based on hot deformation parameters and instability criteria. Mater. Today Commun. 2024, 40, 110074. [Google Scholar] [CrossRef]
- Rodriguez-Millan, M.; Garcia-Gonzalez, D.; Rusinek, A.; Arias, A. Influence of stress state on the mechanical impact and deformation behaviors of aluminum alloys. Metals 2018, 8, 520. [Google Scholar] [CrossRef]
- Zheng, J.-H.; Pruncu, C.; Zhang, K.; Zheng, K.; Jiang, J. Quantifying geometrically necessary dislocation density during hot deformation in AA6082 Al alloy. Mater. Sci. Eng. A 2021, 814, 141158. [Google Scholar] [CrossRef]
- Ye, T.; Xia, E.; Qiu, S.W.; Wang, Y.; Yue, H.Y.; Liu, J.; Wu, Y.Z. High-Temperature Tensile Mechanical Properties and Microstructure of Rolled 6082-T6 Aluminum Alloy Sheets. Metals 2023, 16, 7019. [Google Scholar] [CrossRef]
- Qian, X.; Parson, N.; Chen, X.-G. Effects of Mn addition and related Mn-containing dispersoids on the hot deformation behavior of 6082 aluminum alloys. Mater. Sci. Eng. A 2019, 764, 138253. [Google Scholar] [CrossRef]
- Li, C.; Liu, K.; Chen, X.-G. Improvement of elevated-temperature strength and recrystallization resistance via Mn-containing dispersoid strengthening in Al-Mg-Si 6082 alloys. J. Mater. Sci. Technol. 2019, 39, 135–143. [Google Scholar] [CrossRef]
- Wu, Y.H.; Zhang, Q.B.; Deng, A.L.; Yan, B.T.; Hu, Y.F.; Chen, H. The new insight into the effect of Er on microstructure and mechanical properties of laser welded 6082-T6 aluminum alloy. J. Mater. Res. Technol. 2025, 38, 6134–6147. [Google Scholar] [CrossRef]
- Sakkaeo, A.; Chantaramanee, S.; Muangjunburee, P.; Sungkhaphaitoon, P. Tensile Deformation Behavior of 6082-T6 Aluminum Alloy After Repair Welding by Metal Inert Gas Process. J. Mater. Eng. Perform. 2023, 32, 10204–10213. [Google Scholar] [CrossRef]
- Deng, Y.B.; Wang, G.; Zhu, T.X.; Pan, S.F.; Rong, Y.M. Dynamic Mechanical Behaviors of 6082-T6 Aluminum Alloy. Adv. Mech. Eng. 2013, 2013, 878016. [Google Scholar]
- Wang, P.L.; Jiang, H.T.; Zhang, R.J.; Huang, S.Y. Study of Hot Deformation Behavior of 6082 Aluminum Alloy. Mater. Sci. For. 2016, 877, 340–346. [Google Scholar] [CrossRef]
- Zhao, N.; Sun, Q.; Pang, Q.; Hu, Z.L. Comprehensive study of hot compression behaviors and microstructure evolution of solutionized 6082 aluminum alloy extruded bar. J. Alloys Compd. 2023, 931, 167541. [Google Scholar] [CrossRef]
- Xia, E.; Ye, T.; Wang, L.J.; Qiu, S.W.; Tian, Y.R.; Wu, C.P.; Luo, J.; Wu, Y.Z. Tensile Behavior and Microstructure of the 6082 Alloy Sheet with High-Temperature Aging Treatments. Metals 2014, 14, 963. [Google Scholar] [CrossRef]
- Gonçalves, R.; da Silva, M. Influence of copper content on 6351 aluminum alloy machinability. Procedia Manuf. 2015, 1, 683–695. [Google Scholar] [CrossRef]
- Singh, P.; Ramacharyulu, D.A.; Kumar, N.; Saxena, K.K.; Eldin, S.M. Change in the structure and mechanical properties of Al-Mg-Si alloys caused by the addition of other elements: A comprehensive review. J. Mater. Res. Technol. 2023, 27, 1764–1796. [Google Scholar] [CrossRef]
- Amado, M.N.; Daroqui, F. Revision of the solvus limit of Al-Mg2Si pseudo binary phase diagram. Procedia Mater. Sci. 2015, 8, 1079–1088. [Google Scholar] [CrossRef]
- Chakrabarti, D.J.; Laughlin, D.E. Phase relations and precipitation in Al-Mg-Si alloys with Cu additions. Prog. Mater. Sci. 2004, 49, 389–410. [Google Scholar] [CrossRef]
- Boczkal, S.; Korczak, P.; Żyłka, K.; Limanówka, K.; Płonka, B.; Remsak, K.; Szymański, W.; Leśniak, D. Effects of Copper content and thermo-mechanical treatment on microstructure and mechanical properties of AlMgSi(Cu) Alloys. Crystals 2014, 14, 1027. [Google Scholar] [CrossRef]
- Jin, M.; Li, J.; Shao, G. The effects of Cu addition on the microstructure and thermal stability of an Al-Mg-Si alloy. J. Alloys Compd. 2007, 437, 146–150. [Google Scholar]
- Liu, C.; Zhang, X.; Tang, J.; Liu, X.; Chen, L. Effects of copper on precipitation and baking hardening behavior of Al-Mg-Si alloys. Trans. Nonferrous Met. Soc. China 2014, 24, 2289–2294. [Google Scholar] [CrossRef]
- Xiao, Q.; Liu, H.; Yin, D.; Chen, Y.; Zhang, Y.; Wang, B. Effect of Cu content on precipitation and age-hardening behavior in Al-Mg-Si-xCu alloys. J. Alloys Compd. 2017, 695, 1005–1013. [Google Scholar] [CrossRef]
- Yang, Q.-Y.; Yang, D.; Zhang, Z.-Q.; Cao, L.-F.; Wu, X.-D.; Huang, G.-J.; Liu, Q. Flow behavior and microstructure evolution of 6A82 aluminium alloy with high copper content during hot compression deformation at elevated temperatures. Trans. Nonferrous Met. Soc. China 2016, 26, 649–657. [Google Scholar] [CrossRef]
- Prasad, Y.V.R.K.; Gegel, H.L.; Doraivelu, S.M.; Malas, J.C.; Morgan, J.T.; Lark, K.A.; Barker, D.R. Modeling of dynamic material behavior in hot deformation: Forging of Ti-6242. Metall. Trans. A 1984, 15, 1883–1892. [Google Scholar] [CrossRef]
- Zhang, J.; Di, H.; Wang, X.; Cao, Y.; Zhang, J.; Ma, T. Constitutive analysis of the hot deformation behavior of Fe-23Mn-2Al-0.2C twinning induced plasticity steel in consideration of strain. Mater. Des. 2013, 44, 354–364. [Google Scholar] [CrossRef]
- Yang, Q.Y.; Liu, X.Y.; Cheng, Y.S. Hot Deformation Behavior of 7085 Aluminum Alloy Based on Deformation Heating and Friction. Mater. Trans. 2020, 61, 318–325. [Google Scholar] [CrossRef]
- Liu, S.D.; You, J.H.; Zhang, X.M.; Deng, Y.L.; Yuan, Y.B. Influence of cooling rate after homogenization on the flow behavior of aluminum alloy 7050 under hot compression. Mater. Sci. Eng. A 2010, 527, 1200–1205. [Google Scholar] [CrossRef]
- Wei, T.; Wang, Y.D.; Tang, Z.H.; Xiao, S.F. he constitutive modeling and processing map of homogenized Al-Mg-Si-Cu-Zn alloy. Mater. Today Commun. 2021, 27, 102471. [Google Scholar] [CrossRef]
- Zhang, B.L.; Maclean, M.S.; Baker, T.N. Hot deformation behaviour of aluminium alloy 6061/SiCp MMCs made by powder metallurgy route. Mater. Sci. Technol. 2000, 16, 897–902. [Google Scholar] [CrossRef]
- Li, J.C.; Wu, X.D.; Liao, B.; Cao, L.F. Simulation of dynamic recrystallization in an Al-Mg-Si alloy during inhomogeneous hot deformation. Mater. Today Commun. 2021, 29, 102810. [Google Scholar] [CrossRef]
- Zhang, B.; Baker, T.N. Effect of the heat treatment on the hot deformation behaviour of AA6082 alloy. J. Mater. Process. Technol. 2004, 153–154, 881–885. [Google Scholar] [CrossRef]
- Ma, Z.; Shu, X.; Xu, H.; Wang, G.; Tong, F.; Li, Z.; Chen, K.; Li, G.; Li, B. Hot compression deformation behavior and microstructure evolution of Al-0.5Mg-0.4Si alloy. J. Alloys Compd. 2024, 1002, 175282. [Google Scholar] [CrossRef]
- Liu, S.H.; Pan, Q.L.; Li, H.; Huang, Z.Q.; Li, K.; He, X.; Li, X.Y. Characterization of hot deformation behavior and constitutive modeling of Al-Mg-Si-Mn-Cr alloy. Metals 2019, 54, 4366–4383. [Google Scholar] [CrossRef]
- Schindler, I.; Kawulok, P.; Očenášek, V.; Opěla, P.; Kawulok, R.; Rusz, S. Flow Stress and Hot Deformation Activation Energy of 6082 Aluminium Alloy Influenced by Initial Structural State. Metals 2019, 9, 1248. [Google Scholar] [CrossRef]
- Souza, P.M.; Beladi, H.; Singh, R.; Rolfe, B.; Hodgson, P.D. Constitutive analysis of hot deformation behavior of a Ti6Al4V alloy using physical based model. Mater. Sci. Eng. A 2015, 648, 265–273. [Google Scholar] [CrossRef]
- Liu, Y.; Ning, Y.; Yao, Z.; Guo, H.; Nan, Y. Effect of true strains on processing map for isothermal compression of Ni-20.0Cr-2.5Ti-1.5Nb-1.0Al Ni-base superalloy. J. Alloys Compd. 2014, 612, 56–63. [Google Scholar] [CrossRef]
- Ke, B.; Ye, L.; Tang, J.; Zhang, Y.; Liu, S.; Lin, H.; Dong, Y.; Liu, X. Hot deformation behavior and 3D processing maps of AA7020 aluminum alloy. J. Alloys Compd. 2020, 845, 156113. [Google Scholar] [CrossRef]
- Qin, C.-G.; Jiang, B.; Hu, M.-L.; Wang, Y.; Xu, H.-Y.; Guo, Y.; Ji, Z.-S. Study on hot deformation behavior and dynamic recrystallization mechanism of recycled Al-Zn-Mg-Cu alloy. J. Mater. Res. Technol. 2024, 33, 4725–4738. [Google Scholar] [CrossRef]
- Poorganji, B.; Sepehrband, P.; Jin, H.; Esmaeili, S. Effect of cold work and non-isothermal annealing on the recrystallization behavior and texture evolution of a precipitation-hardenable aluminum alloy. Scr. Mater. 2010, 63, 1157–1160. [Google Scholar] [CrossRef]


Disclaimer/Publisher’s Note: The statements, opinions and data contained in all publications are solely those of the individual author(s) and contributor(s) and not of MDPI and/or the editor(s). MDPI and/or the editor(s) disclaim responsibility for any injury to people or property resulting from any ideas, methods, instructions or products referred to in the content. |
© 2025 by the authors. Licensee MDPI, Basel, Switzerland. This article is an open access article distributed under the terms and conditions of the Creative Commons Attribution (CC BY) license.