Abstract
This study investigates the hot deformation behaviour and flow stress prediction of metastable β-Ti-15Mo alloy, a promising material for biomedical applications requiring strength–modulus optimisation and thermomechanical tunability. Isothermal compression tests were performed within the temperature range of 923–1173 K and at strain rates of 0.17, 1.72, and 17.2 to assess the material’s response under industrially relevant hot working conditions. The alloy showed significant sensitivity to temperature and strain rate, with dynamic recovery (DRV) and dynamic recrystallisation (DRX) dominating the softening behaviour depending on the conditions. A strain-compensated Arrhenius-type constitutive model was developed and validated, resulting in an apparent activation energy of approximately 234 kJ/mol. Zener–Hollomon parameter analysis confirmed a transition in deformation mechanisms. Although microstructural and diffraction data suggest possible contributions from nanoscale phase transformations, including ω-phase dissolution at high temperatures, these aspects remain to be fully elucidated. The model offers reliable predictions of flow behaviour and supports optimisation of thermomechanical processing routes for biomedical β-Ti alloys.
1. Introduction
Metastable β-titanium (β-Ti) alloys are the focus of extensive research due to their remarkable characteristics, which include outstanding formability, an impressive strength-to-weight ratio, a low Young’s modulus, and exceptional biocompatibility. These attributes render them highly suitable for various structural and biomedical applications, as evidenced in multiple studies [1,2,3]. Notably, Ti-15Mo has emerged as a prominent near-β alloy recognised for its advantageous properties, such as excellent hot workability, impressive corrosion resistance, and mechanical qualities that can be precisely tailored through the processes of thermomechanical treatment [4,5,6].
The β-phase stability at elevated temperatures, coupled with the potential for obtaining desirable microstructural transformations during cooling or mechanical deformation, positions Ti-15Mo as an ideal choice for hot forming techniques and manufacturing intricate biomedical components with high precision [7,8,9].
Nevertheless, the deformation behaviour of metastable β-alloys like Ti-15Mo is complex and influenced not only by elevated temperatures and varying strain rates but also by intricate microstructural phenomena, particularly the precipitation and evolution of the athermal and isothermal ω-phase [10,11,12,13]. The presence of the ω-phase plays a pivotal role in altering the mechanical response of the alloy; it enhances strength by obstructing dislocation movement, but it simultaneously decreases ductility. It can inhibit dynamic recovery or recrystallisation processes [14,15,16].
Moreover, the emergence of ω-phase precipitates has been associated with elevated flow stress levels and diminished workability during hot deformation processes, especially under low temperatures or high strain rates [17,18,19,20]. The interplay of these factors makes understanding the ω-phase’s influence crucial for optimising the mechanical performance of Ti-15Mo in practical applications.
A comprehensive understanding of the hot deformation mechanisms and the ability to accurately predict the flow stress behaviour of the titanium alloy Ti-15Mo requires the development of advanced constitutive models. These models must effectively account for the dynamic evolution of the microstructure and the associated mechanical responses during deformation processes. Numerous constitutive frameworks have been proposed for titanium alloys, broadly categorised into phenomenological models (such as the Arrhenius-type and Johnson–Cook models) and physically based models that explore the underlying mechanisms at play [21,22,23].
While popular and widely used in various applications, the Arrhenius-type model has limitations. Specifically, its effectiveness may diminish when critical aspects of microstructural changes—such as the evolution of the omega (ω) phase—are not integrated into its predictive capabilities [24,25,26]. This oversight can lead to inaccuracies in flow stress predictions under significant phase transformations.
Recent investigations on other metastable beta (β) titanium alloys have suggested alternative modelling strategies to enhance predictive accuracy. Notably, applying strain-compensated models has shown promise in better capturing the intricacies of thermally activated deformation behaviour. Furthermore, analysis based on the Zener–Hollomon parameter, which relates to the influence of temperature and strain rate on flow stress, has been demonstrated to improve model fidelity substantially. These advancements highlight the need for sophisticated approaches that embrace the complexities of microstructural evolutions to accurately reflect the mechanical behaviour of titanium alloys during hot deformation processes [27,28,29].
This study delves into the hot deformation behaviour of the Ti-15Mo alloy by conducting a series of compression tests over a diverse spectrum of temperatures (923 to 1173 K) and strain rates (0.17, 1.72, and 17.2 ). An innovative strain-compensated Arrhenius-type model was developed to accurately describe the flow stress behaviour of the material under these conditions. To analyse the deformation regimes of the alloy, the Zener–Hollomon (Z) parameter was employed, offering insights into the relationship between temperature, strain rate, and material response. A significant focus of the research is the influence of the ω-phase on dynamic restoration mechanisms during hot deformation. This phase, often critical in shaping the mechanical properties of titanium alloys, is examined in depth. Microstructural observations were performed using advanced techniques such as transmission electron microscopy (TEM), which allows for a detailed correlation between flow behaviour and the intrinsic physical processes occurring at the microstructural level. By integrating modelling with experimental observations, this research provides a comprehensive understanding of the hot workability of Ti-15Mo alloy. The findings contribute valuable insights that can aid in the development of optimised forming routes for β-Ti components. Such enhancements are particularly beneficial in biomedical applications, where the microstructure-sensitive properties of titanium alloys play a crucial role in determining their performance and reliability of medical implants and devices.
2. Materials and Methods
2.1. Material Composition and Heat Treatment
Cylindrical bars (12 mm in diameter) of Ti-15Mo alloy (ATI Metals, Dallas, DE, USA), conforming to ASTM F2066 specifications, were used as the starting material. The chemical composition, measured using optical emission spectroscopy (Varian ICP-OES Vista AX, Palo Alto, CA, USA) and a LECO ONH analyser (LECO, Geleen, The Netherlands), was 15.07 wt% Mo, 0.04 wt% Fe, 0.009 wt% C, 0.15 wt% O, <0.002 wt% N, and <0.001 wt% H, with titanium as the balance. The as-received material exhibited significant mechanical twinning, which was eliminated by β-phase solution treatment at 1173 K for 2 h in an air furnace, followed by water quenching to promote extensive β-phase recrystallisation and eliminate the inherited twinned structure.
2.2. Specimen Preparation and Hot Compression Test
Cylindrical compression specimens (6 mm in diameter and 9 mm in height; Figure 1a) were machined using wire electrical discharge machining (EDM). Representative machined samples are shown in Figure 1b. Isothermal hot compression tests were performed using a Gleeble® 3800 thermomechanical simulator (Dynamic Systems Inc., Poestenkill, NY, USA) at the Brazilian Nanotechnology National Laboratory (LNNano, CNPEM, Campinas, Brazil). The experiments were conducted at temperatures ranging from 923 K to 1173 K in 50 K increments and at constant true strain rates of 0.172, 1.72, and 17.2 .
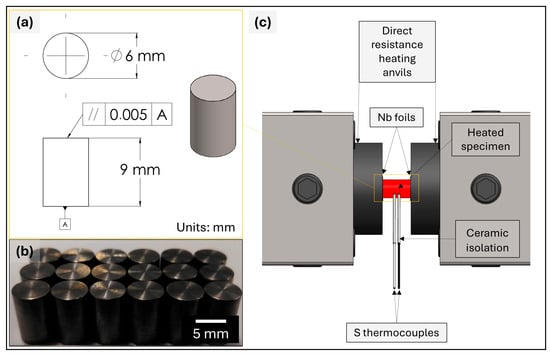
Figure 1.
Configuration of the specimens used in the hot compression test: (a) geometry used, (b) specimens machined using wire electrical discharge machining (EDM), and (c) schematic drawing of the heated specimen being tested, where the Joule-heated specimen, the location of the ceramic-coated S-type thermocouples, and the position of Nb foil used to reduce friction during hot deformation can be observed.
To minimise friction at the specimen–die interface, 0.127 mm-thick niobium foils (Alfa Aesar, Haverhill, MA, USA) 99.8% metal basis were punched into 15 mm-diameter discs and placed between the specimen ends and the compression anvils. A high-temperature anti-seize lubricant (Thred Gard-FedPro, Cleveland, OH, USA—nickel- and graphite-based; rated up to 1700 K) was applied between the foils and specimen surfaces to reduce interfacial friction further.
Temperature monitoring during deformation was performed using type S thermocouples (SP10R-008), with signal polarity distinguished by black (TF-BK-30) and white (TF-W-30) insulation. The thermocouples were spot-welded to the specimen’s mid-height before testing using a resistance and impact welding unit. The thermocouple leads were sheathed in ceramic protection tubes to avoid thermal degradation of the polymeric insulation during high-temperature exposure. The whole test setup, including Joule heating and thermocouple placement, is depicted in Figure 1c.
Before each experiment, the compression chamber was evacuated and backfilled with high-purity argon gas to ensure an inert testing atmosphere and prevent oxidation.
Prior to testing, samples were pre-heated to 1173 K at 100 K , held for 30 s to homogenize the temperature, and cooled to the test temperature at 50 K . Deformations were performed at constant strain rates up to a true strain of ~1.0, followed by rapid cooling to retain the deformed microstructure. The system’s automatic grip cooling was sufficient to achieve high quenching rates (approximately 500 K/s), effectively preserving the microstructure for further analysis.
Compression barreling effects were corrected using instantaneous diameter measurements based on the method described by Ettouney and Hardt [30]. The adiabatic temperature rise during compression was estimated using Equation (1) [31], considering a constant heat capacity () of 500 and a density () of 5.4 , as typically reported for Ti-15Mo alloys. However, it is important to acknowledge that and are thermophysical properties that may vary with temperature and alloying content. In particular, tends to increase with temperature in metallic systems due to enhanced phonon activity, which may slightly overestimate or underestimate the real adiabatic heating if assumed constant. Although the chosen values provide a reasonable approximation within the studied temperature range (923–1173 K), future models could benefit from incorporating temperature-dependent thermophysical data for greater accuracy, especially when simulating highly transient thermomechanical processes or extrapolating results to other alloy compositions.
where, ΔT is the adiabatic temperature increase, is the heat capacity, is alloy’s density, is the strain-dependent factor, which is assumed to be 0.2, 0.4, 0.6, and 0.8 for strain rates of 0.001, 0.01, 0.1, and 1 , respectively, is the true stress, is the true strain, and 0.9 presents the amount of mechanical work converted into heat. From the above relation, the equivalent stress was estimated using and .
The values adopted for the adiabatic correction factor in Equation (1) were selected according to the applied strain rates in this study—0.172, 1.72, and 17.2 —and reflect the progressive shift from partially isothermal to predominantly adiabatic conditions. Specifically, was set to 0.6, 0.8, and 0.9 for each respective strain rate. These choices were guided by extrapolations from values reported by Dieter et al. [31] and are consistent with recent findings for titanium alloys deformed at high rates, such as those presented in [32], where ≈ 0.9 was reported under similar thermomechanical conditions.
2.3. Constitutive Modelling Methodology
The methodology used to determine the parameters of the phenomenological constitutive models is detailed in [33]. The flow curves were fitted using the modified Johnson–Cook, Zerilli–Armstrong, and strain-compensated Arrhenius-type equations to assess their predictive capabilities under the investigated thermomechanical conditions.
2.4. Microstructural Characterisation
The average grain size of the as-received material was determined following the comparison chart method described in ASTM E112-12. Deformed specimens were sectioned parallel to the compression axis and prepared for microstructural analysis via conventional metallographic procedures. Optical microscopy (OM) was conducted using an AxioCam ERc 5s (Zeiss, Oberkochen, Germany) coupled to a LEITZ Laborlux 12 ME microscope (LEITZ, Oberkochen, Germany). High-contrast backscattered electron (BSE) imaging was performed on a FEI Inspect S50 scanning electron microscope (FEI, Eindhoven, The Netherlands) after vibratory polishing with a 0.05 μm colloidal silica suspension.
For microstructural analysis of both the as-received material and the deformed specimens, initial surface preparation involved manual grinding using a sequential series of SiC abrasive papers with grit sizes of 80, 120, 240, 320, 400, 600, 1200, 1500, 2000, and 2500, aiming to minimise surface deformation and avoid artefacts that could affect microstructural interpretation. Final polishing was performed using a suspension containing 0.3 μm alumina mixed with 3% hydrofluoric acid (HF) and 3% nitric acid (HNO3). This acidic polishing medium acted simultaneously as a mechanical and chemical agent, effectively revealing grain boundaries without requiring additional chemical etching using Kroll’s reagent.
Thin foils for TEM analysis were first manually ground to a thickness of ~0.045 mm. Final thinning to electron transparency was carried out using a Gatan Precision Ion Polishing System (PIPS, model 691). Transmission electron microscopy (TEM, FEI, Eindhoven, The Netherlands) was then performed for selected area diffraction (SAD) analysis, which revealed the presence and distribution of the ω-phase.
2.5. X-Ray Diffraction
X-ray diffraction measurements were carried out at room temperature (298 K) using a Bruker D8 Advance ECO diffractometer (Bruker, Billerica, MA, USA) operating with Cu Kα radiation (λ = 0.15406 nm) in Bragg–Brentano geometry. Data were collected over a 2θ range of 5° to 90°, with a step size of 0.02° and an acquisition time of 0.5 s per step.
3. Results
3.1. Initial Material Characterisation
Figure 2 shows the microstructural evolution of the Ti-15Mo alloy. In Figure 2a, the as-received Ti-15Mo alloy microstructure displays equiaxed grains containing a high density of lenticular deformation twins formed during mechanical processing of the alloy bars, with an average grain size of 115 ± 15 µm.
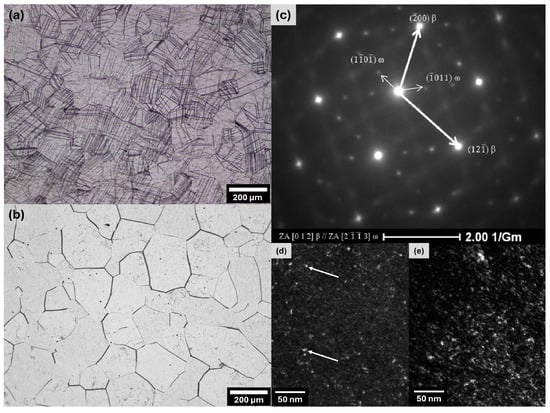
Figure 2.
Optical microscopy metallographic microstructure of Ti-15Mo: (a) as received and (b) solution treated conditions; (c) [012]β SAED pattern of the solution-treated condition; dark-field images of (d) athermal ω-phase distribution (indicated by arrows) and (e) beta-phase distribution.
After β solution treatment at 1173 K (β-transus temperature of ~1047 K for Ti-15wt%Mo, as reported in the alloy manufacturer’s datasheet [ATI 15Mo™—1047 ± 14 K]), a predominantly recrystallised β-phase microstructure was observed (Figure 2b), with no evidence of prior twinning. Figure 2c displays the [012]β SAED pattern obtained from the solution-treated condition, confirming the presence of a body-centred cubic β-phase structure. This diffraction pattern provides insight into the crystal orientation and stability of the β-phase under subsequent deformation.
Dark-field imaging further clarifies the phase distribution. Figure 2d highlights the athermal ω-phase, which is known to form during rapid cooling and affects mechanical properties by acting as a strengthening phase. The fine dispersion of the athermal ω-phase suggests its potential role in hindering dislocation motion. Conversely, Figure 2e shows the β-phase distribution, where the matrix remains mainly β-phase with a uniform morphology, indicative of effective solution treatment.
These microstructural observations are essential for understanding the deformation mechanisms and flow stress behaviour of Ti-15Mo under hot working conditions. The interaction between β and ω phases significantly influences the alloy’s mechanical response, affecting strain hardening and dynamic recovery during thermomechanical processing.
Figure 3 shows the X-ray diffractograms of the Ti-15Mo alloy in its as-received state and after β-solution treatment at 1173 K for 2 h. The as-received Ti-15Mo bar exhibits a strong crystallographic texture, with two intense peaks corresponding to the (110)β and (002)β planes, suggesting a preferential grain orientation and the presence of deformation twins. Following heat treatment—aimed at dissolving mechanical twins and promoting chemical homogenisation—a reorganisation of the crystallographic texture was observed. Although the intensity values are not directly comparable between conditions due to their expression in arbitrary units, the (110)β peak became the most prominent in the treated condition. In contrast, the (002)β peak was substantially reduced, reaching intensities similar to those of the newly discernible (112)β and (022)β reflections, all of which displayed relatively low intensities. These changes indicate partial dissolution of the initial texture, likely due to twin elimination and recrystallisation processes active during annealing.
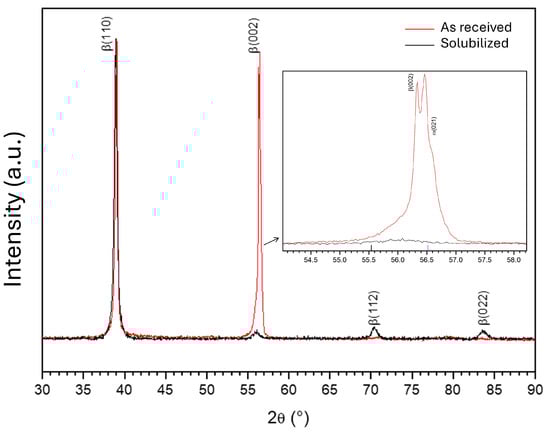
Figure 3.
X-ray diffractograms of the Ti-15Mo alloy in the as-received condition and after β-solution treatment at 1173 K for 2 h.
Additionally, the (002)β peak of the as-received bar sample showed a doublet (see inset in Figure 3), indicating a possible β2 → β1 phase transformation via spinodal decomposition during manufacturing. This peak splitting is also linked to mechanical twinning. The doublet disappears after heat treatment, indicating a reversal of the spinodal decomposition via the solution treatment. This behaviour is consistent with the loss of peak splitting and the disappearance of the twinned structure observed earlier in metallographic analysis. This further suggests that the transformation is deformation-assisted, playing a key role in the process.
TEM analysis of the as-received Ti-15Mo alloy condition is shown in Figure 4. Figure 4a displays a high-resolution image acquired along the [110]β zone axis, revealing light regions corresponding to the β1 phase and dark regions representing the β2 phase, with approximately equal proportions (50% each). This phase distribution is evidenced by the measured interplanar spacings of approximately 0.22985 nm and 0.23086 nm, respectively. Figure 4b presents a selected-area diffraction (SAD) pattern from a larger region than in Figure 4a, acquired using the smallest available aperture. White arrows indicate the location where Figure 4c shows a line profile across a 002β spot (white line in Figure 4b). The intensity peaks in the line profile correspond to β-phase reflections, with the lower-intensity peak marked by an arrow. This clearly demonstrates two partially overlapping spots with slight separation, confirming the coexistence of both phases.
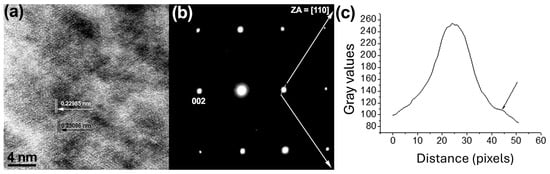
Figure 4.
TEM analysis of phase separation. (a) High-resolution image obtained along the [110]β zone axis, showing interplanar spacing measurements for each phase (white: β1; dark: β2). (b) Selected-area diffraction pattern from a larger region than in (a), with white arrows indicating the locations where (c) a Gray-value line profile was acquired across a 002β spot (white line indicated in (b)).
3.2. Compressive Flow Stress Curves
The thermal response observed during hot compression of the Ti-15Mo alloy (Figure 5) demonstrates a clear dependence on strain rate and testing temperature. At lower strain rates and higher temperatures, especially above 1023 K, the temperature profiles during hot compression showed irregular oscillations characterised by initial transient rises followed by a gradual decline. While these fluctuations were initially linked to thermal instability, their cause is probably multifaceted. One factor may be the latent heat linked to microstructural changes, such as the dynamic precipitation or dissolution of the ω-phase, which can affect the thermal balance locally. Moreover, at temperatures nearing the β-transus, the interplay between strain hardening and softening mechanisms like dynamic recovery and recrystallisation adds further complexity. Localised strain distribution may also lead to uneven heat generation and dissipation. Although a thorough thermodynamic and kinetic analysis of these effects exceeds this study’s scope, their presence emphasises the complex interaction between thermal and microstructural responses during hot deformation.
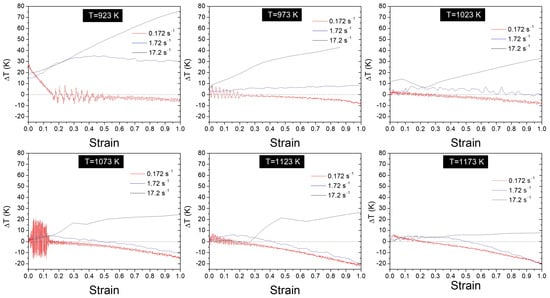
Figure 5.
Temperature variation as a function of strain recorded by a surface thermocouple on Ti-15Mo alloy specimens during isothermal hot compression testing at different strain rates and test temperatures.
The temperature data acquired using S-type thermocouples (shown in Figure 5) were subsequently used in Equation (1) to correct the true stress–strain flow curves presented in Figure 6. This correction accounts for adiabatic heating effects and ensures a more accurate representation of the isothermal flow behaviour.

Figure 6.
Corrected stress–strain curves of hot-deformed Ti-15Mo alloy at different temperatures and strain rates. Grey curves represent experimental data after correction, while black curves are obtained via data interpolation. (a) 923 K, (b) 973 K, (c) 1023 K, (d) 1073 K, (e) 1123 K, and (f) 1173 K.
Conversely, at the highest strain rate investigated (17.2 ), a consistent temperature increase was observed, with the extent of thermal rise becoming more pronounced at lower testing temperatures. This pattern aligns with expectations, since lower deformation temperatures require higher flow stresses, which in turn increase the mechanical work performed on the material. Consequently, a larger proportion of this energy is converted into heat, amplifying adiabatic heating effects. This finding supports the well-known proportional relationship between flow stress, strain rate, and temperature rise under adiabatic conditions, emphasising the influence of strain rate in balancing thermal softening and strain hardening through mechanisms such as dynamic recovery and ω-phase precipitation.
Figure 6a–f presents the stress–strain curves after correction for adiabatic heating and barreling effects. For polynomial fitting purposes, the initial elastic region up to a strain of 0.02 was excluded, along with data corresponding to plastic strains above 0.8. A representative subset of data points near the onset of plastic deformation was retained to ensure an accurate fit. Subsequently, a 9th-order polynomial fitting was applied using the Origin software (version OriginPro 8.5) to generate descriptive equations of the material’s flow behaviour. The raw experimental data (in grey) and the corresponding fitted curves (in black) are shown.
3.3. Constitutive Equation Derivation
The Arrhenius-type model describes the relationship between stress, strain, deformation temperature, and deformation rate of the material during deformation at high temperatures. The constitutive model is expressed using Equation (2) [34]:
where , , , , , , and are material constants (not related to temperature), is the activation energy for hot deformation (J mol−1), and R is the universal gas constant (8.314 J mol−1 K−1). The , , and are related by . The Zener–Hollomon parameter is expressed as Equation (3) [35]:
By combining the above relations, an explicit form of stress is obtained, given in Equation (4):
The Arrhenius equation is used. Thus, researchers like Lin et al. [12] have modified the equation to better describe the behaviour of alloys through deformation compensation and deformation rate. Therefore, the values of , , , and must be expressed using polynomial functions that vary with the evolution of strain. Here, the relationship among , , , , and strain can be described using a ninth-order polynomial, as shown in Figure 6a,b. The coefficients of Equations (5)–(8) are presented in Table 1. As a result, the values of , , , and can be determined for any deformation temperature and strain rate. The flow stress value can be calculated according to Equation (4).

Table 1.
Coefficients of the polynomial equations.
The experimental (continuous lines) and predicted (dots) stresses obtained via Equations (5)–(8), using coefficients presented in Table 1, can be seen in Figure 7a,b.
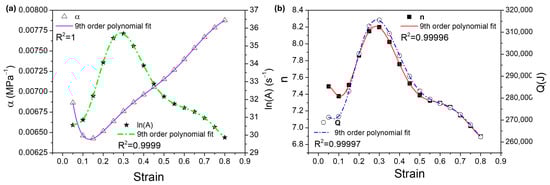
Figure 7.
Relationship between the values and true strains: (a) and ; (b) and .
The original Johnson–Cook model is expressed using Equation (9) [36]:
where is the equivalent flow stress, is the equivalent plastic strain, is the yield stress at the reference (temperature and strain rate), is the strain hardening coefficient, is the strain hardening exponent, and and are material constants representing the coefficient of strain rate hardening and thermal softening exponent, respectively. Additionally, is the dimensionless strain rate (where is the strain rate and is the reference strain rate), is the homologous temperature, expressed as .
Lin et al. proposed the following modified Johnson–Cook expression, Equation (10) [37]:
where , , , , , and are material constants, and the remaining constants have the same meaning as in the original model. To better describe the flow stress behaviour with regard to the applied strain, the first term of the equation was modified to a third-degree polynomial form, as this change offers a more accurate representation of the flow stress for this alloy. The reference temperature and strain rate that resulted in the lowest deviation between experimental and predicted stress were 1023 K and 0.172 , respectively. Equation (11) describes the behaviour of the Ti-15Mo alloy.
Figure 8d–f shows the experimental (lines) and predicted stresses (dots) obtained using Equation (11).

Figure 8.
Comparison of experimental values and predicted values at different strain rates: strain compensated Arrhenius equation model at (a) 0.172 , (b) 1.72 , and (c) 17.2 ; modified Johnson–Cook model at (d) 0.172 , (e) 1.72 , and (f) 17.2 ; modified Zerilli–Armstrong model at (g) 0.172 , (h) 1.72 , and (i) 17.2 . Comparison between experimental and predicted data for models: (j) Arrhenius-type model, (k) modified Johnson–Cook model, and (l) modified Zerilli–Armstrong model.
Samantaray et al. proposed a modification of the Zerilli–Armstrong equation, as shown in Equation (12) [38].
In this equation, , where T and Tref are current and reference temperatures, respectively, , and have the same meaning as used in the modified JC equation. , , , , , , and are material constants. In the present work, the first term of Equation (12), related to the strain hardening component, was modified to a 3rd-order polynomial equation, as in the modified JC equation, to fit the predicted flow stress better.
The obtained constitutive Equation (13), considering Tref = 973 K and = 1.72 is
Figure 8g–i show the experimental (lines) and predicted stresses (dots) obtained using Equation (13).
To quantify the predictive power of the constitutive equations, the adjusted R-squared coefficient () and the average absolute relative error () were calculated. The first one provides information on the accuracy and effectiveness of the linear relationship between experimental and predicted values, and the serves as a universal statistical parameter for measuring the predictability of numerical models. The corresponding Equations (14) and (15) are
where, is the experimental stress, the equations predicting stress, and is the total sample data. The higher the AARE value, the less the model can predict stress values.
Figure 8j–l shows the proximity of the experimental and predicted values from the three developed constitutive models. The adjusted R-squared coefficients for the strain-compensated Arrhenius-type model, modified Johnson–Cook, and modified Zerilli–Armstrong models were 0.95, 0.95, and 0.93, respectively. The corresponding average absolute relative errors were 5%, 7.2%, 4.8%, respectively. By comparing the models, the mJC model showed inferior accuracy compared to the others, and the differences between the mZA model and the Arrhenius-type model were found to be very small. The Arrhenius-type model has the advantage that its constants have some physical equivalence and can be useful to predict the type of dislocation movement occurring during hot deformation (climb in this case). Therefore, it is concluded that this is the most appropriate model to predict the flow behaviour of Ti-15Mo alloy in the studied conditions.
These findings demonstrate that the strain-compensated Arrhenius model provides the most robust framework for predicting the hot deformation behaviour of Ti-15Mo alloy, achieving good accuracy ( 0.95, 5%) while maintaining physical interpretability of dislocation climb mechanisms. The model’s superiority stems from its strain-dependent activation energy formulation, Equations (5)–(8), and its ability to capture the complex interplay between microstructural evolution (ω-phase strengthening and β-phase recovery) and thermomechanical processing parameters. While the modified Zerilli–Armstrong model showed comparable predictive capability (0.93, = 4.8%), its empirical nature limits the physical insight it provides compared to the Arrhenius approach. The modified Johnson–Cook model, though mathematically robust ( 0.95), exhibited higher deviations ( 7.2%), particularly at extreme strain rates and temperatures. Crucially, the Arrhenius model’s performance correlates directly with the observed microstructural transitions—from deformation twinning dominance at 923 K to dynamic recovery prevalence at 1173 K—validating its capacity to bridge atomic-scale mechanisms with macroscopic flow behaviour.
Despite the satisfactory agreement between experimental and predicted flow stress values, each constitutive model presents specific limitations that must be considered when selecting the appropriate formulation for different processing scenarios. The modified Johnson–Cook model, while computationally efficient and widely implemented in finite element softwares, showed reduced accuracy at elevated temperatures and extreme strain rates, likely due to its empirical nature and limited ability to reflect dynamic microstructural changes such as twinning or recovery. The modified Zerilli–Armstrong model offered slightly better predictive performance, yet its strain- and temperature-dependent terms remain largely phenomenological, with limited correlation to specific physical mechanisms. In contrast, the strain-compensated Arrhenius-type model incorporates a physically meaningful representation of activation energy and dislocation mobility, but its complexity and requirement for high-fidelity experimental fitting make it less straightforward to implement in industrial process design tools. Therefore, while the Arrhenius model emerges as the most robust framework within the studied conditions, its applicability outside the calibrated domain or under non-isothermal, multiaxial loading paths remains to be validated.
These considerations align with the observed influence of metastable ω-phase precipitates, whose dissolution at elevated temperatures facilitates enhanced dislocation mobility and dynamic softening. Although not explicitly included as a model variable, the presence and progressive reduction of ω-phase particles with increasing temperature contribute to the strain-rate and temperature sensitivity captured by the Arrhenius formulation. Consequently, the strain-compensated Arrhenius-type model not only provides accurate predictions but also reflects key thermally activated mechanisms governing the hot deformation of the Ti-15Mo alloy.
3.4. Post Deformation Microstructure Characterisation
At the lowest strain rate and temperature evaluated (Figure 9a), optical microscopy revealed the exclusive presence of mechanical twinning. As the temperature increased to 1173 K (Figure 9b), dynamic recrystallisation became evident, particularly in regions with a high density of deformation twins, which acted as preferential nucleation sites for new grains. Under high strain rates and lower temperatures (17.2 at 923 K), a fine network of mechanical twins was observed (Figure 9c). This behaviour indicates the absence of significant softening mechanisms under these conditions. Although the absence of dynamic recovery was macroscopically evident at 923 K and 17.2 , it is important to note that this condition corresponds to a regime with extremely limited time for diffusional rearrangements. Furthermore, the presence of fine athermal ω-phase precipitates—evidenced in the initial microstructure and inferred from XRD profiles—may act as strong barriers to dislocation motion, thus retarding recovery kinetics. The combined effect of high strain rate, limited diffusion, and strong short-range order phenomena likely explains the suppression of visible recovery features under these conditions, despite the significant energy input during deformation. Conversely, at the highest strain rate and temperature analysed (Figure 9d), clear signs of recovery were observed in twinned regions, suggesting the operation of dynamic recovery. In contrast, dynamic recrystallisation was suppressed—likely due to insufficient time for diffusion-controlled processes to occur.

Figure 9.
Optical micrographs of Ti-15Mo alloy specimens deformed under different isothermal hot compression conditions: (a) 923 K at 0.172 , showing the presence of mechanical twinning without signs of recovery or recrystallisation; (b) 1173 K at 0.172 , with dynamic recrystallisation observed in regions of high twin density; (c) 923 K at 17.2 , exhibiting a refined twinned microstructure with no evidence of dynamic recovery; (d) 1173 K at 17.2 , showing pronounced dynamic recovery of twinned regions and absence of recrystallisation due to limited time for diffusional mechanisms. All images were taken in a plane parallel to the compression axis.
High-contrast backscattered electron (BSE) imaging using scanning electron microscopy (SEM) was conducted to further examine recrystallisation phenomena. In Figure 10a, only mechanical twins are visible, supporting the optical microscopy observations in Figure 9a. Conversely, the sample shown in Figure 10b displays distinct stretch marks next to recrystallised regions. These features indicate crystallographic misorientation and imply the occurrence of micrometre-scale mechanical twinning within grain interiors in the sample deformed at 1173 K and 0.172 . Due to severe deformation, EBSD analysis was not feasible, as poor pattern quality prevented reliable indexing. Nonetheless, the BSE images provide valuable qualitative insight into the occurrence of dynamic recrystallisation at high temperature and low strain rate.
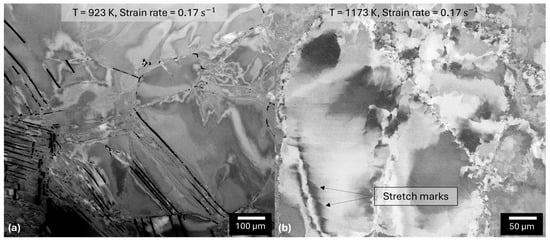
Figure 10.
Backscattered electron (BSE) micrographs of Ti-15Mo alloy specimens deformed at 0.172 under (a) 923 K, where only mechanical twinning is visible, confirming the optical microscopy results from Figure 9a; (b) 1173 K, highlighting the presence of stretch marks adjacent to recrystallised zones, indicating crystallographic misorientation likely associated with mechanical twinning within grains.
The thermal response recorded during deformation (Figure 5) further supports the microstructural observations presented in Figure 9 and Figure 10. Transient temperature peaks followed by gradual declines were observed at low strain rates and high temperatures (e.g., 1173 K and 0.172 ), aligning with the occurrence of dynamic recrystallisation in regions of high twin density. This suggests that thermally activated softening mechanisms such as dynamic recovery and recrystallisation effectively dissipated stored deformation energy. Conversely, at high strain rates and low temperatures (e.g., 923 K and 17.2 ), the temperature rose steadily throughout deformation, with no decline, which is consistent with the predominance of mechanical twinning and the absence of recovery features—indicating that athermal mechanisms dominated, storing energy as internal strain rather than releasing it through diffusional processes. These correlations reinforce the hypothesis that the nature of thermal evolution during hot compression is governed by the competition between energy storage and dissipation, which in turn depends on the active deformation mechanisms and the thermal stability of phases present during processing.
3.5. Structural Analysis
The X-ray diffraction (XRD) spectra of the Ti-15Mo alloy subjected to isothermal compression at different temperatures are displayed in Figure 11a,b for strain rates of 0.172 and 17.2 , respectively. These spectra clearly demonstrate the effect of deformation temperature on the preferential enhancement of specific β-phase reflection peaks, particularly the (110)β plane at higher temperatures. The β-phase diffraction peaks exhibit duplicity, most notably at the (002)β diffraction plane, indicating a potential occurrence of spinodal decomposition of the β-phase under certain conditions, especially at intermediate to high temperatures. Nonetheless, confirming such phase separation would require high-resolution techniques like HRTEM or APT, as conventional XRD does not possess the spatial and chemical resolution needed to identify nanoscale compositional modulations.
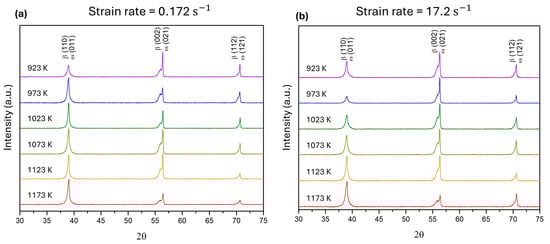
Figure 11.
X-ray diffraction patterns of the Ti-15Mo alloy after isothermal compression tests at temperatures ranging from 923 to 1173 K and strain rates of (a) 0.172 and (b) 17.2 .
No diffraction peaks corresponding to the α-phase were observed, supporting the stability of the β-phase throughout the deformation process under the tested conditions. Likewise, no isolated ω-phase peaks were identified at locations different from those of the β-phase, probably due to peak overlap or the nanometric scale of ω-phase precipitates, which impedes their detection using conventional XRD techniques.
The literature shows that twinning activity is expected to decrease with increasing temperature. In this context, the observed increase in the right-hand shoulder of the (002)β doublet with rising deformation temperature further supports the formation of metastable β1 and ω phases. This microstructural evolution, in turn, correlates with the mechanical response and flow softening behaviour identified during high-temperature deformation of the Ti-15Mo alloy.
Compared to the as-solution-treated condition (Figure 3), the deformed specimens revealed a significant intensification of preferred crystallographic orientations, indicating strong deformation-induced texture. This texture development is consistent with the activation of mechanical twinning at lower temperatures (923 K), which gradually transitions to dislocation glide and dynamic recovery at higher temperatures (1173 K). The changes in peak intensity and position support the hypothesis of substructural evolution within the β matrix, where phase separation phenomena—such as spinodal decomposition—may lead to the emergence of compositional modulations. These modulations promote the formation of coherent β1 and β2 domains, enhancing flow stress through increased resistance to dislocation motion.
Although subtle in conventional diffraction, the influence of spinodal decomposition becomes relevant when considering the elevated work hardening rates observed at early stages of deformation. This behaviour can be attributed to the dynamic pinning of dislocations by nanoscale fluctuations in Mo concentration and remnants of athermal ω-phase. These features collectively impede dislocation mobility, resulting in a pronounced initial strain hardening response.
Furthermore, the absence of peak broadening at half-maximum intensity in the XRD patterns indicates that dynamic recrystallisation was either absent or very limited under the tested conditions. This apparent contradiction with microstructural evidence from optical and BSE microscopy—where recrystallised grains were observed at 1173 K—may stem from the inherent differences in sensitivity between the techniques. While light microscopy and SEM show morphological and topological changes, conventional XRD detects subgrain formation and internal stress relaxation only when they reach a critical scale. It is therefore plausible that partial or initial recrystallisation occurred, insufficient to cause peak broadening detectable using XRD. These findings emphasise the importance of combining complementary techniques to accurately interpret complex microstructural evolutions during hot deformation.
In addition, the slight peak shifts toward higher angles in deformed samples, relative to the fully recrystallised state, may also indicate residual lattice strain or twinning-related lattice reorientation. Twinning contributes not only to texture evolution but also to additional strain accommodation, thereby improving deformability under low to moderate temperatures.
The microstructural observations throughout this work provide a physical basis for interpreting the constitutive model parameters derived in Section 3.3. For example, the elevated values of the stress exponent n and activation energy in the strain-compensated Arrhenius model can be explained by the microstructural presence of nanoscale obstacles, such as athermal ω precipitates and modulations, that hinder dislocation glide and require dislocation climb mechanisms. These coherent phases raise the energy barrier for plastic flow, directly impacting the constitutive model’s strain rate sensitivity and thermal activation elements. Therefore, combining flow stress modelling with microstructural evidence supports the model’s physical validity and predictive strength.
The presence of dispersed ω-phase precipitates, spinodal modulation of the β matrix, and twinning mechanisms provide a microstructural basis for the high flow stress sensitivity captured by the constitutive modelling. These mechanisms also justify the elevated values of the Arrhenius parameters and , which reflect the energetic barriers associated with dislocation interactions with coherent obstacles during hot deformation of the Ti-15Mo alloy.
4. Discussion
A complex interplay of microstructural mechanisms, phase stability, and the effects of strain rate and temperature governs the hot deformation behaviour of the metastable β-Ti-15Mo alloy. As shown in the flow stress curves (Figure 6), the alloy exhibits features associated with dynamic restoration, primarily in the form of dynamic recovery (DRV) and dynamic recrystallisation (DRX), depending on the specific thermomechanical conditions.
At low temperatures (T = 923–973 K), all strain rates (0.172–17.2 ) produce a distinct peak in flow stress followed by a slight decrease or plateau, indicating work hardening followed by DRV. The absence of marked softening or grain refinement under these conditions suggests that thermal activation is insufficient to initiate DRX, in line with previous studies on β and near-β titanium alloys [4,14,38]. At these temperatures, deformation is governed by dislocation glide and climb, with recovery limited by the presence of athermal ω-phase precipitates. This effect is particularly evident at 923 K and 17.2 (Figure 9c), where a dense network of mechanical twins is observed without signs of DRV or DRX, reflecting the combined influence of high strain rate, low temperature, and suppressed diffusional mobility.
As the temperature rises to 1023 K, a shift in the deformation mechanism begins to appear. At lower strain rates (0.172 ), the flow curves display a peak followed by gradual softening, indicating the onset of DRX, likely occurring continuously. Meanwhile, higher strain rates (1.72–17.2 ) still exhibit characteristics of DRV, suggesting that both time and thermal energy are necessary to initiate significant recrystallisation. This transition becomes more evident at 1073 K, where flow softening is more pronounced at 0.172 and 1.72 , signalling progressive DRX with high-angle boundary formation and subgrain rotation contributing to microstructural recovery, supported by microstructural evidence (Figure 9b), which reveals recrystallised grains nucleated near deformation twins.
While temperature clearly influences the magnitude of flow stress, the shape of the flow curves is more strongly governed by the strain rate. At high strain rates (1.72–17.2 ), even with increasing temperature, the curves predominantly exhibit sharp peaks followed by limited softening, characteristic of dynamic recovery (DRV). This indicates that despite sufficient thermal energy, the short deformation time restricts the onset of dynamic recrystallisation (DRX). In contrast, at lower strain rates (0.172 ), the curves begin to show gradual flow softening beyond the peak, particularly at and above 1023 K, suggesting the initiation and progression of DRX. This transition becomes increasingly evident at 1073 K, where features such as high-angle grain boundaries and subgrain rotation are expected to contribute to microstructural refinement. These interpretations are supported by microstructural observations: at 1173 K and 17.2 (Figure 9d), signs of DRV are present, but DRX is suppressed, likely due to insufficient time for diffusion-driven rearrangements. Conversely, at 1173 K and 0.172 (Figure 9b and Figure 10b), recrystallised grains are evident near regions rich in deformation twins, which act as preferential nucleation sites.
The observed increase in DRX activity with both temperature and decreased strain rate is also influenced by the suppression or dissolution of athermal ω-phase precipitates, which are known to hinder both DRV and DRX by acting as strong obstacles to dislocation movement and by pinning grain boundaries [7,8]. These results are consistent with earlier reports on Ti–Mo and Ti–V systems, where the ω-phase is destabilised above 973–1073 K, enhancing hot workability and microstructural recovery [5,9].
The flow stress modelling using a strain-compensated Arrhenius-type constitutive equation agreed well with the experimental data. The apparent activation energy determined () falls within the expected range for β-Ti alloys undergoing DRV and DRX [12,14,16]. Analysis using the Zener–Hollomon parameter (Z) further supports transition in deformation mechanisms: at high Z (low T, high ), deformation is governed by dislocation accumulation and ω-phase interaction; at low Z (high T, low ), dynamic softening by DRX becomes dominant. These findings are consistent with recent literature that links ω precipitation and dynamic softening suppression in β alloys such as Ti-15Mo, Ti-5553, and Ti-B12 [10,15,17].
The enhanced softening observed at 1173 K and 0.172 , more pronounced than at 1.72 s−1, highlights the importance of time-dependent mechanisms such as ω-phase dissolution, polygonization, and subgrain coalescence, all of which contribute to microstructural refinement. These results reinforce the importance of strain compensation in constitutive models for β-Ti alloys: neglecting strain dependence can lead to overestimated flow stresses, particularly in regimes where the microstructure evolves rapidly during deformation [12,13].
These findings have practical implications for the thermomechanical processing of β-Ti alloys, particularly in biomedical applications where microstructure-sensitive properties such as elastic modulus, strength, fatigue resistance, and biocompatibility are critical. Processing windows that promote ω-phase suppression and controlled DRX—especially at T ≥ 1073 K and ≤ 0.172 —are key to optimising the final microstructure. The results presented here also provide a valuable basis for future development of physically based models incorporating variables such as grain size, dislocation density, ω-phase fraction, and grain boundary character to more accurately predict processing–property relationships.
5. Conclusions
This study investigated the hot deformation behaviour and constitutive modelling of the metastable β-Ti-15Mo alloy using isothermal compression tests conducted between 923 K and 1173 K at strain rates of 0.17, 1.72, and 17.2 . The main conclusions are as follows:
- Microstructural evolution during deformation showed that softening mechanisms like DRV and DRX became more active at higher temperatures and lower strain rates. Although the presence of nanoscale obstacles—potentially including ω-phase precipitates—may affect dislocation mobility and recovery, further imaging evidence would be needed to confirm their specific role in this process.
- Using the experimental flow data, a strain-compensated Arrhenius-type constitutive model was successfully developed and calibrated. The model predicts flow stress evolution with good accuracy and yields an apparent activation energy of approximately 234 kJ/mol, consistent with DRV/DRX-controlled mechanisms in β-Ti alloys.
- The Zener–Hollomon (Z) parameter analysis effectively captured the deformation regime transitions, with high-Z conditions potentially associated with ω-phase formation and the resulting strengthening effect, whereas low-Z conditions favoured dynamic softening processes.
- X-ray diffraction (XRD) analysis evidenced the dissolution of the ω-phase during high-temperature deformation, validating the model predictions and explaining the observed stress–strain responses. High-contrast BSE imaging revealed morphological features indicative of recrystallisation, particularly at elevated temperatures and low strain rates. These microstructural observations, together with characteristic flow softening in the stress–strain curves, support the occurrence of dynamic recrystallisation (DRX) under specific thermomechanical conditions. However, in the absence of crystallographic orientation data, the interpretation remains indirect, and further work is needed to confirm the underlying mechanisms.
- These findings provide a physical basis for optimising the thermomechanical processing of β-Ti-15Mo alloys, particularly for biomedical applications. Controlling deformation temperature and strain rate is key to suppressing ω-phase formation and promoting dynamic restoration mechanisms that enhance hot workability and final properties.
Author Contributions
Conceptualization, C.B. and A.M.J.J.; methodology, A.d.B.G.; investigation, A.d.B.G., G.Y.K., A.M.J.J. and C.B.; writing—original draft preparation, A.d.B.G.; writing—review and editing, A.d.B.G. and G.Y.K.; supervision, A.M.J.J. and C.B.; project administration, C.B.; funding acquisition, C.B. All authors have read and agreed to the published version of the manuscript.
Funding
This research was supported by LNNano (STC—21989)—Brazilian Nanotechnology National Laboratory, CNPEM/MCTIC, and financed in part by the Coordenação de Aperfeiçoamento de Pessoal de Nível Superior—Brasil (CAPES)—Finance Code 001.
Data Availability Statement
The original contributions presented in this study are included in the article. Further inquiries can be directed to the corresponding author.
Acknowledgments
The authors are grateful to the National Centre for Research in Energy and Materials (CNPEM) for allowing the use of their facilities, to Thaís Cristina Alonso for technical assistance, and to the Coordenação de Aperfeiçoamento de Pessoal de Nível Superior/CAPES (Finance code 001). A.M.J.J. acknowledges CNPq (Brazil) under the grant CNPq # 306622/2021-1. The authors would also like to thank the Laboratory of Structural Characterisation (LCE/DEMa/UFSCar) for the general facilities.
Conflicts of Interest
The authors declare no conflicts of interest. The funders had no role in the study’s design; in the collection, analysis, or interpretation of data; in the writing of the manuscript; or in the decision to publish the results.
References
- Geetha, M.; Singh, A.K.; Asokamani, R.; Gogia, A.K. Ti Based Biomaterials, the Ultimate Choice for Orthopaedic Implants–A Review. Prog. Mater. Sci. 2009, 54, 397–425. [Google Scholar] [CrossRef]
- Froes, F. Titanium: Physical Metallurgy, Processing, and Applications; ASM International: Novelty, OH, USA, 2015. [Google Scholar]
- Semiatin, S.; Bieler, T. The Effect of Alpha Platelet Thickness on Plastic Flow during Hot Working of TI–6Al–4V with a Trans-formed Microstructure. Acta Mater. 2001, 49, 3565–3573. [Google Scholar] [CrossRef]
- Takemoto, Y.; Shimizu, I.; Sakakibara, A.; Hida, M.; Mantani, Y. Tensile Behavior and Cold Workability of Ti-Mo Alloys. Mater. Trans. 2004, 45, 1571–1576. [Google Scholar] [CrossRef]
- Lee, W.-S.; Lin, C.-F.; Chen, T.-H.; Hwang, H.-H. Effects of Strain Rate and Temperature on Mechanical Behaviour of Ti–15Mo–5Zr–3Al Alloy. J. Mech. Behav. Biomed. Mater. 2008, 1, 336–344. [Google Scholar] [CrossRef]
- Zardiackas, L.D.; Mitchell, D.W.; Disegi, J.A. Characterization of Ti-15Mo Beta Titanium Alloy for Orthopaedic Implant Applications. In Medical Applications of Titanium and Its Alloys: The Material and Biological Issues; ASTM International: West Conshohocken, PA, USA, 1996; STP1272-EB. [Google Scholar]
- Ballor, J.; Li, T.; Prima, F.; Boehlert, C.J.; Devaraj, A. A Review of the Metastable Omega Phase in Beta Titanium Alloys: The Phase Transformation Mechanisms and Its Effect on Mechanical Properties. Int. Mater. Rev. 2023, 68, 26–45. [Google Scholar] [CrossRef]
- Matsumoto, H.; Kitamura, M.; Li, Y.; Koizumi, Y.; Chiba, A. Hot Forging Characteristic of Ti–5Al–5V–5Mo–3Cr Alloy with Single Metastable β Microstructure. Mater. Sci. Eng. A 2014, 611, 337–344. [Google Scholar] [CrossRef]
- Jablokov, V.R.; Nutt, M.J.; Richelsoph, M.E.; Freese, H.L. The Application of Ti–15Mo Beta Titanium Alloy in High Strength Structural Orthopaedic Applications. J. ASTM Int. 2005, 2, 1–18. [Google Scholar] [CrossRef]
- Wang, J.; Zhao, Y.; Zhou, W.; Zhao, Q.; Huang, S. In-Situ Investigation on Tensile Deformation and Fracture Behaviors of a New Metastable β Titanium Alloy. Mater. Sci. Eng. A 2021, 799, 140187. [Google Scholar] [CrossRef]
- Sun, F.; Zhang, J.Y.; Marteleur, M.; Gloriant, T.; Vermaut, P.; Laillé, D.; Castany, P.; Curfs, C.; Jacques, P.J.; Prima, F. Investiga-tion of Early Stage Deformation Mechanisms in a Metastable β Titanium Alloy Showing Combined Twinning-Induced Plasticity and Transformation-Induced Plasticity Effects. Acta Mater. 2013, 61, 6406–6417. [Google Scholar] [CrossRef]
- Yao, K.; Min, X. Static and Dynamic Hall—Petch Relations in {332}<113> TWIP Ti–15Mo Alloy. Mater. Sci. Eng. A 2021, 827, 142044. [Google Scholar] [CrossRef]
- Zhang, S.; Min, X.; Li, Y.; Wang, W.; Li, P.; Li, M. Effects of Deformation and Phase Transformation Microstructures on Springback Behavior and Biocompatibility in β-Type Ti–15Mo Alloy. Acta Metall. Sin. (Engl. Lett.) 2022, 35, 621–635. [Google Scholar] [CrossRef]
- Chen, W.; Cao, S.; Kou, W.; Zhang, J.; Wang, Y.; Zha, Y.; Pan, Y.; Hu, Q.; Sun, Q.; Sun, J. Origin of the Ductile-to-Brittle Transi-tion of Metastable β-Titanium Alloys: Self-Hardening of ω-Precipitates. Acta Mater. 2019, 170, 187–204. [Google Scholar] [CrossRef]
- Wang, W.; Zhang, X.; Mei, W.; Sun, J. Role of Omega Phase Evolution in Plastic Deformation of Twinning-Induced Plasticity β Ti–12V–2Fe–1Al Alloy. Mater. Des. 2020, 186, 108282. [Google Scholar] [CrossRef]
- Gupta, A.; Khatirkar, R.; Singh, J. A Review of Microstructure and Texture Evolution during Plastic Deformation and Heat Treatment of β-Ti Alloys. J. Alloys Compd. 2022, 899, 163242. [Google Scholar] [CrossRef]
- Wang, X.L.; Li, L.; Mei, W.; Wang, W.L.; Sun, J. Dependence of Stress-Induced Omega Transition and Mechanical Twinning on Phase Stability in Metastable β Ti–V Alloys. Mater. Charact. 2015, 107, 149–155. [Google Scholar] [CrossRef]
- Hanada, S.; Yoshio, T.; Izumi, O. Effect of Plastic Deformation Modes on Tensile Properties of Beta Titanium Alloys. Trans. Jpn. Inst. Met. 1986, 27, 496–503. [Google Scholar] [CrossRef]
- Banerjee, D.; Williams, J.C. Perspectives on Titanium Science and Technology. Acta Mater. 2013, 61, 844–879. [Google Scholar] [CrossRef]
- Zhao, X.; Niinomi, M.; Nakai, M.; Hieda, J. Effect of Deformation-Induced ω Phase on the Mechanical Properties of Metastable β-Type Ti-V Alloys. Mater. Trans. 2012, 53, 1379–1384. [Google Scholar] [CrossRef]
- Wang, F.; Shen, J.; Zhang, Y.; Ning, Y. A Modified Constitutive Model for the Description of the Flow Behavior of the Ti-10V-2Fe-3Al Alloy during Hot Plastic Deformation. Metals 2019, 9, 844. [Google Scholar] [CrossRef]
- Shokry, A. Modified Fields-Backofen and Zerilli-Armstrong Constitutive Models to Predict the Hot Deformation Behavior in Titanium-Based Alloys. Sci. Rep. 2024, 14, 8359. [Google Scholar] [CrossRef]
- Li, C.M.; Huang, L.; Li, C.L.; Hui, S.X.; Yu, Y.; Zhao, M.J.; Guo, S.Q.; Li, J.J. Research Progress on Hot Deformation Behavior of High-Strength β Titanium Alloy: Flow Behavior and Constitutive Model. Rare Met. 2022, 41, 1434–1455. [Google Scholar] [CrossRef]
- Li, Z.; Wang, Q.; Du, X.; Yang, C.; Wang, K. Thermal Deformation Behavior and Microstructural Evolution Mechanism of TC4 Titanium Alloy Based on Hot Processing Map. JOM 2024, 76, 5233–5246. [Google Scholar] [CrossRef]
- Ghosh, S.; Hamada, A.; Patnamsetty, M.; Borek, W.; Gouda, M.; Chiba, A.; Ebied, S. Constitutive Modeling and Hot Defor-mation Processing Map of a New Biomaterial Ti–14Cr Alloy. J. Mater. Res. Technol. 2022, 20, 4097–4113. [Google Scholar] [CrossRef]
- Li, Y.; Chen, H.; Du, L.; Yang, F.; Zhang, Y.; Li, D. Characterization and Unified Modelling of Creep and Viscoplasticity De-formation of Titanium Alloy at Elevated Temperature. Int. J. Plast. 2024, 173, 103892. [Google Scholar] [CrossRef]
- Wang, L.; Fan, X.G.; Zhan, M.; Chen, Q. Experimental Characterization and Physical Modeling of Strain Path Dependent Mi-crostructure Evolution: A Case Study of Primary Hot Working of Titanium Alloy. Int. J. Plast. 2022, 158, 103450. [Google Scholar] [CrossRef]
- Fan, X.G.; Yang, H. Internal-State-Variable Based Self-Consistent Constitutive Modeling for Hot Working of Two-Phase Tita-nium Alloys Coupling Microstructure Evolution. Int. J. Plast. 2011, 27, 1833–1852. [Google Scholar] [CrossRef]
- Park, C.W.; Choi, M.S.; Lee, H.; Yoon, J.; Javadinejad, H.R.; Kim, J.H. High-Temperature Deformation Behavior and Micro-structural Evolution of as-Cast and Hot Rolled Β21S Alloy during Hot Deformation. J. Mater. Res. Technol. 2020, 9, 13555–13569. [Google Scholar] [CrossRef]
- Ettouney, O.; Hardt, D.E. A Method for In-Process Failure Prediction in Cold Upset Forging. J. Eng. Ind. 1983, 105, 161–167. [Google Scholar] [CrossRef]
- Dieter, G.E.; Kuhn, H.A.; Semiatin, S.L. Handbook of Workability and Process Design; ASM International: Novelty, OH, USA, 2003. [Google Scholar]
- Sela, A.; Ortiz-de-Zarate, G.; Soler, D.; Germain, G.; Gallegos, L.; Arrazola, P.J. Adiabatic Self-Heating Determination for Ti6Al4V at Different Temperatures. Int. J. Heat Mass Transf. 2023, 204, 123747. [Google Scholar] [CrossRef]
- Guerra, A.P.d.B.; Jorge, A.M.; Roche, V.; Bolfarini, C. Hot Deformation Behavior of a Beta Metastable TMZF Alloy: Micro-structural and Constitutive Phenomenological Analysis. Metals 2021, 11, 1769. [Google Scholar] [CrossRef]
- Mirzadeh, H.; Najafizadeh, A. Flow Stress Prediction at Hot Working Conditions. Mater. Sci. Eng. A 2010, 527, 1160–1164. [Google Scholar] [CrossRef]
- Zener, C.; Hollomon, J.H. Effect of Strain Rate Upon Plastic Flow of Steel. J. Appl. Phys. 1944, 15, 22–32. [Google Scholar] [CrossRef]
- Johnson, G.R.; Cook, W.H. Fracture Characteristics of Three Metals Subjected to Various Strains, Strain Rates, Temperatures and Pressures. Eng. Fract. Mech. 1985, 21, 31–48. [Google Scholar] [CrossRef]
- Wang, Y.; Zhou, Y.; Xia, Y. A Constitutive Description of Tensile Behavior for Brass over a Wide Range of Strain Rates. Mater. Sci. Eng. A 2004, 372, 186–190. [Google Scholar] [CrossRef]
- Samantaray, D.; Mandal, S.; Borah, U.; Bhaduri, A.K.; Sivaprasad, P.V. A Thermo-Viscoplastic Constitutive Model to Predict El-evated-Temperature Flow Behaviour in a Titanium-Modified Austenitic Stainless Steel. Mater. Sci. Eng. A 2009, 526, 1–6. [Google Scholar] [CrossRef]
Disclaimer/Publisher’s Note: The statements, opinions and data contained in all publications are solely those of the individual author(s) and contributor(s) and not of MDPI and/or the editor(s). MDPI and/or the editor(s) disclaim responsibility for any injury to people or property resulting from any ideas, methods, instructions or products referred to in the content. |
© 2025 by the authors. Licensee MDPI, Basel, Switzerland. This article is an open access article distributed under the terms and conditions of the Creative Commons Attribution (CC BY) license (https://creativecommons.org/licenses/by/4.0/).