Article

Multi-Parameter Optimization and Corrosion Behavior of FeCoNiCrAl HEA Coatings via Laser Cladding

1
School of Metallurgy Engineering, Jiangsu University of Science and Technology, Zhangjiagang 215600, China
2
Jiangsu Province (Shagang) Iron and Steel Research Institute, Zhangjiagang 215600, China
3
School of Engineering, The University of Western Australia, M050, 35 Stirling Highway, Crawley, Perth, WA 6009, Australia
*
Author to whom correspondence should be addressed.
Metals 2025, 15(4), 406; https://doi.org/10.3390/met15040406
Submission received: 9 March 2025 / Revised: 30 March 2025 / Accepted: 1 April 2025 / Published: 4 April 2025
(This article belongs to the Special Issue Advances in Corrosion and Protection of Materials (Third Edition))

Abstract

In this study, FeCoNiCrAl high-entropy alloy (HEA) coatings were fabricated on Q235 steel surfaces using laser cladding (LC) to enhance corrosion resistance in harsh environments. The laser processing parameters (laser power, defocus distance, and scanning speed) were optimized using response surface methodology (RSM), establishing a mathematical model to guide the process. The optimized coatings demonstrated strong metallurgical bonding to the substrate, with a microstructure comprising Al-Ni-rich B2 phases and Cr-Fe-rich BCC phases. Elemental segregation was effectively mitigated as energy density decreased, leading to significant improvements in corrosion resistance. Electrochemical tests in 3.5 wt.% NaCl and 0.5 mol/L H2SO4 solutions showed that the optimized coating (laser power: 800 W, scanning speed: 450 mm/min, defocus: −15 mm) exhibited exceptionally low corrosion current densities of 1.78 × 10⁻⁷ A/cm2 and 1.07 × 10⁻⁵ A/cm2, respectively. The passive film on the optimized coating surface consisted of stable oxides, with low oxygen vacancy densities of 1.937 × 1023 cm−3 in NaCl and 4.967 × 1021 cm−3 in H2SO4, significantly enhancing its resistance to localized and uniform corrosion. These results demonstrate the effectiveness of RSM-based optimization in producing HEA coatings with superior corrosion resistance suitable for applications in highly corrosive environments.

1. Introduction

Q235 steel is widely used in modern industrial fields such as bridges, ships, and machinery manufacturing due to its low cost and excellent machinability. However, its application is limited under harsh conditions, such as corrosive wear and immersion corrosion, necessitating the use of coating technologies to enhance its surface performance.
High entropy alloys (HEAs) represent a novel class of alloy systems composed of five or more metallic elements, yielding a high configurational entropy [1,2,3]. Due to the pronounced atomic disorder within these alloys, HEAs achieve elevated entropy levels and predominantly form simple solid solution structures, such as face-centered cubic (FCC) and body-centered cubic (BCC) phases [4,5,6]. Thermodynamically, HEAs exhibit significant high-entropy effects [7]; structurally, they undergo pronounced lattice distortion; and kinetically, they display sluggish diffusion behavior [8]. Furthermore, the “cocktail effect” arising from the multiple elemental combinations markedly influences their physical and chemical properties [9]. As an emerging alloy material, HEAs leverage unique compositional design and a multicomponent alloy system to achieve remarkable mechanical properties, wear resistance, and corrosion resistance. These exceptional attributes position HEAs as ideal protective coating materials for critical applications in advanced engineering alloys [10].
Laser cladding (LC) is an advanced surface modification technology that utilizes a high-energy laser beam to melt and deposit specific materials onto a substrate, enhancing its surface properties [11,12]. Compared to traditional coating techniques, such as magnetron sputtering [13], plasma spraying [14], and physical vapor deposition [15], laser cladding offers the capability to produce large-scale coatings while also enabling partial remelting of the substrate, promoting robust metallurgical bonding between the substrate and coating [16,17]. For instance, Ren et al. [18] applied laser cladding to fabricate a highly wear-resistant NbMoTaWTi refractory HEA coating on TC4 alloy surfaces. Similarly, Liu et al. [19] developed a corrosion-resistant AlCoCrFeNiTi HEA coating on AISI 1045 steel, featuring a combination of disordered solid solution (Fe-Cr) and ordered solid solution (Al-Ni) phases. Laser cladding has gained traction as a research tool due to its advantages, including high cooling rates, minimal heat-affected zones, strong bonding strength, and reduced environmental impact. It is well established that processing parameters—such as laser power, scanning speed, powder feed rate, and gas flow rate—significantly influence the geometry and properties of the cladding layer. Through optimized parameter combinations, coatings with controllable microstructures and performance characteristics can be achieved [20]. For example, Ma et al. [21] established a regression model correlating processing parameters with response variables, optimizing these parameters via a multi-objective particle swarm optimization algorithm. Their findings highlighted scanning speed as the most critical factor affecting coating width, height, dilution rate, and microhardness ratio. Khorram et al. [22] employed response surface methodology (RSM) to investigate the influence of process parameters—laser frequency, pulse width, and scanning speed—on the macroscopic morphology (width, height, contact angle), dilution rate, and microhardness of the cladding layer. Their results demonstrated that pulse width had the most significant impact on all responses. Additionally, Gao et al. [23] employed LC to fabricate a novel MoNbZrTi refractory HEA coating on a Ti6Al4V substrate. Using RSM, they developed a predictive model for dilution, porosity, and microhardness, further analyzing the effects of individual parameters (laser power, scanning speed, and powder feed rate) on coating geometry, dilution, porosity, and microhardness.
It is evident that optimizing laser processing parameters to achieve high-performance high-entropy alloy (HEA) coatings through response surface methodology (RSM) has become a widely adopted approach. Compared to orthogonal experiments, neural networks, and other optimization methods, RSM provides a more intuitive analysis of variance (ANOVA) for established mathematical models and achieves greater accuracy in predicting objective responses. In laser cladding, dilution is almost inevitable as the powder filler and substrate partially mix in the laser-induced melt pool, forming a metallurgical bond. However, dilution can adversely impact coating properties, including hardness, corrosion resistance, and the solid-solution forming ability of the HEA. Thus, effectively controlling the dilution rate during the laser cladding process is crucial for fabricating HEA coatings with strong metallurgical bonding and superior mechanical properties.
Based on this, the present study utilizes RSM to establish a mathematical model correlating laser power, scanning speed, defocus distance, and dilution rate. A multi-objective parameter optimization approach is employed to minimize dilution, optimizing the laser processing parameters accordingly. Using laser cladding, an FeCoNiCrAl HEA coating was designed and fabricated on the surface of Q235 steel, with the electrochemical corrosion behavior of the coating investigated under different environmental conditions. X-ray photoelectron spectroscopy (XPS) was employed to analyze the influence of elemental composition on the passivation film characteristics formed on the HEA surface, elucidating the corrosion mechanisms of the HEA in both neutral and acidic media. The study evaluates the corrosion resistance of the HEA coating across varied environments and explores its corrosion mechanism in neutral and acidic media.

2. Experimental Procedure

2.1. Material and Coating Preparation

A Q235 steel plate (Jiangsu Shagang Group Co., Ltd., Zhangjiagang, China) with dimensions of 50 mm × 50 mm × 10 mm was selected as the substrate (chemical composition: C 0.22%, Si 0.35%, Mn 0.30–0.70%, P 0.045%, S 0.045%). Before the experiment, the substrate surface was polished using a grinding wheel to remove the oxide layer, followed by cleaning with anhydrous ethanol to eliminate any surface oil residues. The cleaned substrate was then placed in a drying oven for 30 min to ensure a fully dry surface. Commercial FeCoNiCrAl HEA powder (Jiangsu Shagang Group Co., Ltd., Zhangjiagang, China) with nominal composition was used as the coating material, featuring an average particle size of 48.6 μm. The particle morphology and size distribution of the powder are illustrated in Figure 1. Prior to the laser cladding process, the alloy powder was pre-placed on the substrate surface using a mold. The powder was mixed with a certain amount of alcohol, which was added dropwise using a dropper, and stirred with a glass rod to ensure an even distribution. Once the mixture was thoroughly prepared, it was applied to the substrate surface. The entire assembly was then preheated to 200 °C, and, after the alcohol evaporated, the laser cladding experiment was conducted. The LC process was performed on an RFL–C3300W-type fiber laser machine (Wuhan Raycus Fiber Laser Technologies Co., Ltd., Wuhan, China), as shown in Figure 1c. To prevent oxidation of the powder during the cladding process, an argon gas shield was applied throughout. The laser system, infrared sensors, and work platform were activated to maintain a controlled environment, ensuring the integrity of the powder and promoting high-quality coating formation.

2.2. Phase Composition and Microstructure

The samples were polished with SiC sandpaper, followed by diamond spray polishing on a P-2G metallographic polishing machine (Suzhou Huanair Automation Technology Co., Ltd. (Suzhou, China)) to achieve a mirror-like finish. The microstructure of the samples was observed using a JSM-6510LA scanning electron microscope (SEM) (JEOL Ltd., Tokyo, Japan). Phase composition analysis was conducted with an X-ray diffractometer (XRD, Thermo Scientific K-Alpha), with a diffraction angle range from 20° to 80° and a scanning speed of 5°/min. EBSD tests on the HEA coatings were performed using an Apreo S Hivac field emission scanning electron microscope (FE-SEM) (Thermo Fisher Scientific Inc., Waltham, MA, USA) equipped with a C-Swift EBSD unit in steps of 1 μm. To investigate the composition of the surface film and the chemical states of alloy elements that directly influence electrochemical performance, the samples were immersed in NaCl and H2SO4 solutions under potentiostatic polarization at the passivation potential. High-resolution X-ray photoelectron spectroscopy (XPS, Thermo Scientific K-Alpha X (Thermo Fisher Scientific Inc., Waltham, MA, USA)) was employed to analyze the surface film composition and to determine the chemical states of the alloying elements.

2.3. Electrochemical Test

To evaluate the corrosion resistance of the coating, the coated substrate was cut into rectangular samples measuring 10 mm × 10 mm × 10 mm, and the coating surface was polished. Electrochemical performance testing of the FeCoNiCrAl high-entropy alloy (HEA) coating was conducted using a three-electrode system on a DH7003-2 electrochemical workstation (Hangzhou Donghua Testing Technology Co., Ltd., Hangzhou, China) at room temperature. In this setup, a platinum electrode with a working area of 1 cm2 served as the counter electrode, while a saturated calomel electrode (SCE) was used as the reference electrode. The electrochemical tests began with an open-circuit potential (OCP) measurement of the samples, which was conducted for 900 s. The parameters for Tafel polarization testing were as follows: a scan rate of 0.1 mV/s and a potential range from −0.5 V to 2 V (vs. OCP). To prevent the passivation phenomenon of the material during Tafel polarization testing, we set the current density limit to below 0.1 A/cm2. Electrochemical impedance spectroscopy (EIS) was performed with an amplitude of 1 mV over a frequency range from 0.01 Hz to 100 kHz. To ensure data accuracy, each test was repeated three times per sample group. For Mott–Schottky testing, the initial potential was set at −0.8 V (vs. SCE), terminating at 0 V (vs. SCE), with a scan rate of 0.05 mV/s. The measurement was conducted at a frequency of 1000 Hz with an amplitude of 10 mV.

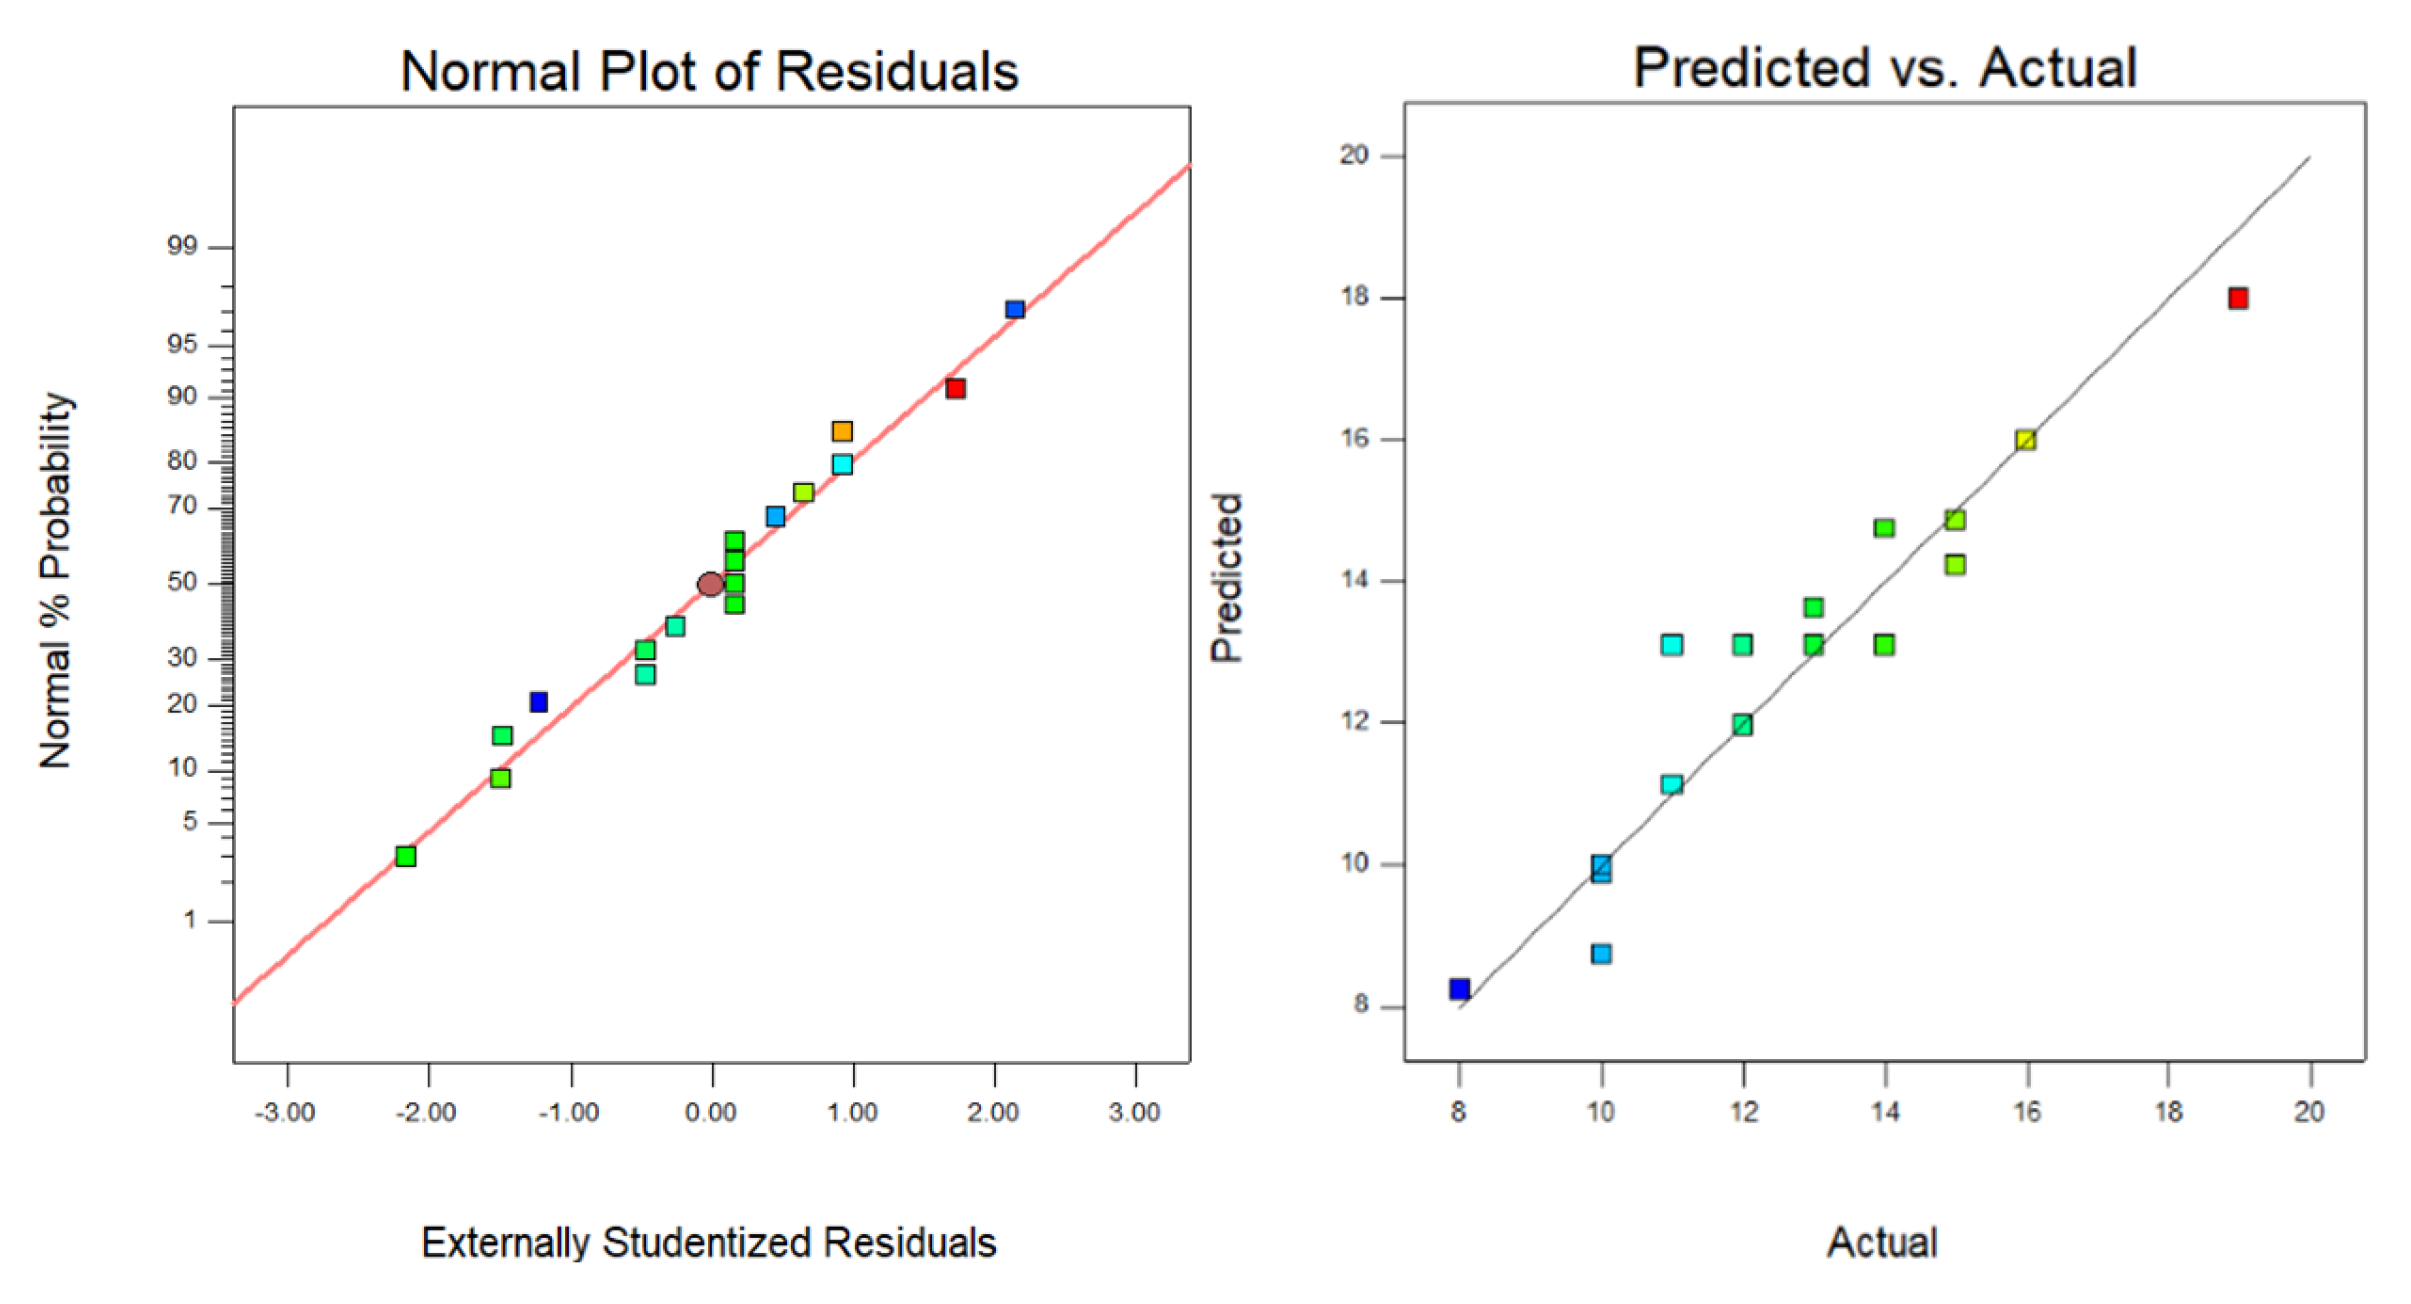
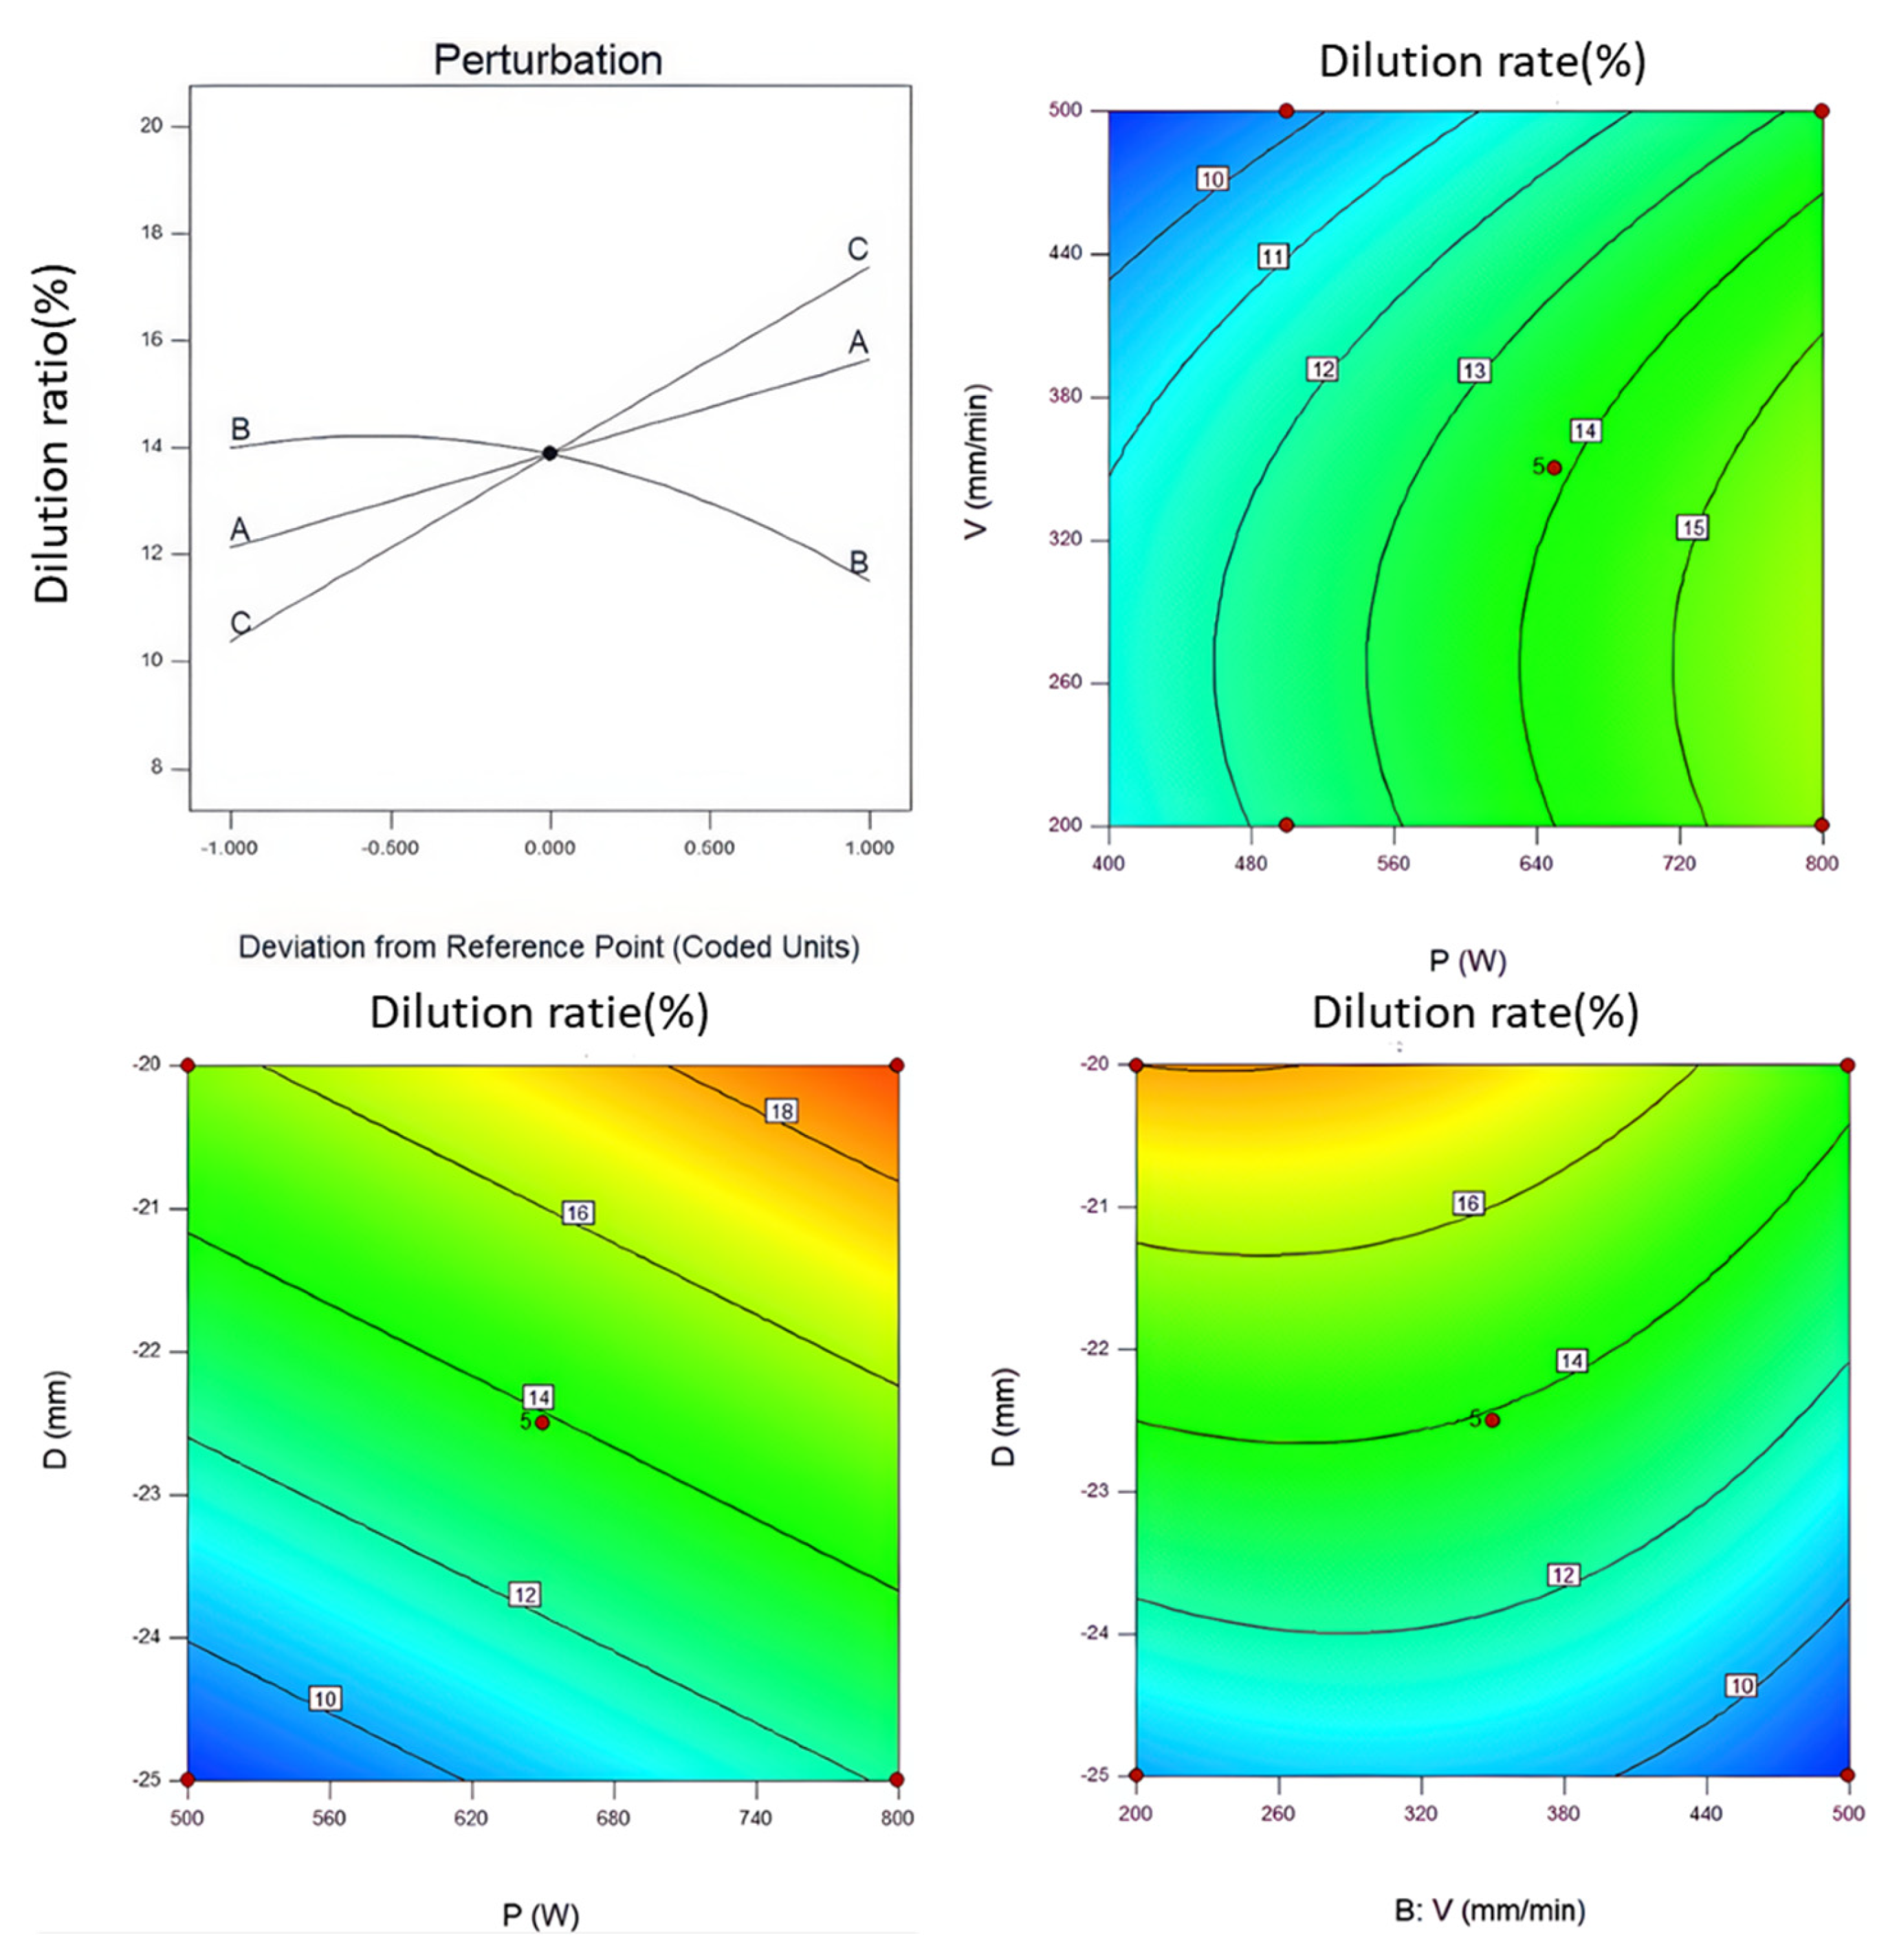
2.4. Experimental Design and Analysis Method

In this experiment, laser power (LP), scanning speed (SS), and defocus amount (DA) were selected as adjustable parameters, with appropriate parameter ranges established based on preliminary experiments. The initial stage focused on optimizing the macroscopic morphology of the coating, and a series of experiments were conducted within initial parameter ranges to identify suitable values: laser power between 600 and 800 W, scanning speed between 200 and 400 mm/min, and defocus amount from −15 mm to 10 mm. Coatings prepared using these laser processing parameters showed no significant signs of balling (incomplete melting) or surface burn-through (excessive overheating). Using these parameter ranges, response surface methodology (RSM) was employed to establish an empirical model correlating laser power, scanning speed, and defocus amount with the optimization target—the dilution rate. Here, the defocus amount is used to control the laser spot diameter, defined as the distance between the laser emission lens and the focal point. The laser-induced dilution rate refers to the degree of compositional change in the cladding layer caused by elemental mixing from the substrate due to substrate melting during laser cladding. A cross-sectional view of a single-pass cladding layer is shown in Figure 2. Typically, the dilution rate is calculated using a geometric method, as outlined in the following formula.
η = h 2 h 1 + h 2
In the dilution rate calculation, h2 represents the substrate penetration depth, while h1 indicates the height of the cladding layer. To ensure a metallurgical bond between the cladding layer and the substrate, a certain degree of substrate melting is necessary, leading to the inevitable mixing of substrate elements into the cladding layer. Generally, it is recommended that the dilution rate be maintained between 8% and 15% to achieve an optimal balance [24].
Response surface methodology (RSM) employs multivariate regression equations to approximate the relationship between input factors and response values, providing a close approximation to the actual function. Following the Box–Behnken design principles, three levels were assigned to each of the three laser processing parameters, as shown in Table 1 and Table 2. By measuring the dilution rate of a single-pass cladding layer, the functional relationship between process parameters and dilution rate was established, and the model’s accuracy was verified using variance analysis. The process parameter scheme that meets the target dilution rate was identified. Coatings were then prepared based on these optimized parameters, and by analyzing the coating morphology and element distribution, the optimal process parameters were determined.
By employing response surface methodology (RSM) to design the experiments, a relationship was established between the laser processing parameters and the response variable, namely, the dilution rate. This relationship was represented using a second-order polynomial equation as follows:
y = A + i = 1 k B i X i + i = 1 k B i i X i 2 + i = 1 k j = 1 k B i j X i X j + ε i = 1 n X i 2
In the equation, y represents the response target to be optimized, A is a constant, and Xi and Xj are the processing parameters. The terms Bi, Bii, and Bij denote the linear, quadratic, and interaction regression coefficients, respectively, while ε represents the statistical error term. The results of the analysis of variance (ANOVA) for the experimental data are shown in Table 3. Using ANOVA, the F- and p-values provide insights into the significance of the model and its coefficients. A larger F-value and a smaller p-value indicate a more reliable model. As seen in the table, the F-value of the experimental model is 78.21, and the p-value is less than 0.0001, indicating the model’s high significance. Additionally, the p-values for each laser processing parameter are all below 0.05, confirming that each parameter has a statistically significant effect on the experiment’s outcome.
From the table, it can be observed that the model’s precision value is 12.57, which represents the signal-to-noise ratio. A precision value greater than 4 generally indicates a well-constructed model. Additionally, the difference between R2 and adjusted R2 is less than 0.2, suggesting a good fit of the model to the experimental data. The impact of each processing parameter on the dilution rate of the high-entropy alloy (HEA) coating is significant, with laser power and defocus amount having the most pronounced effects. Using DesignExpert software 10.0, a functional model was established, as expressed by the following formula:
y = 17.43673 + 0.012500 P + 0.018735 V + 1.2 D 3.2716 E 5 V 2
Figure 3 illustrates the relationship between the normal probability distribution and the internally studentized residuals. In this plot, all data points are closely distributed around the fitted line, which verifies the model’s stability. Additionally, the predicted values and experimental values are evenly distributed along the 45° line, indicating that the established model accurately represents the relationship between process parameters and the dilution rate. This alignment of predicted and experimental values confirms the model’s reliability and predictive capability, supporting the model’s use for optimizing laser cladding parameters to control the dilution rate effectively in high-entropy alloy coatings.
As shown in Figure 4, the perturbation plot of each laser processing parameter’s influence on the dilution rate indicates that both scanning speed and defocus amount contribute to an increase in dilution rate. The defocus amount controls the laser’s effective radius: a larger defocus amount corresponds to a larger laser radius, resulting in a greater laser interaction area. Conversely, a smaller defocus amount reduces the laser interaction area. Under a constant laser power, differences in the laser interaction area lead to variations in laser energy density, which, in turn, significantly affect the coating dilution rate. When the scanning speed reaches 350 mm/min, there is a marked change in the dilution rate of the coating. During the cladding process, due to the high cooling rates and large thermal gradients, localized heating of the coating is complex. This impacts the temperature distribution and element diffusion within the melt pool, potentially resulting in the formation of some metastable phases, which, in turn, can affect the phase stability of the coating [25]. Specifically, coating preparation is primarily influenced by the specific energy density. Although a low dilution rate in the coating is desirable, a high specific energy density may cause substrate elements to diffuse into the coating, altering its alloy composition and diminishing coating quality and performance. If the specific energy density is too low, weak bonding between the substrate and coating is likely, and a small amount of amorphous phase may even form [25]. The specific energy density is closely related to the parameters used in the cladding process, as shown in the following equation [26]:
K = P D v
In this context, P represents the laser power during the cladding process, D is the laser spot diameter, and v is the scanning speed. By setting a target range for the dilution rate, the optimization process aimed to minimize dilution, resulting in three experimental schemes with a dilution rate of 12% each, as determined using DesignExpert software, as shown in Table 4. These three schemes were used to perform multi-pass cladding on the substrate surface, with a 30% overlap rate between passes. For ease of analysis, these schemes were designated as S-600, S-700, and S-800, corresponding to the three respective parameter sets. Each cladding scheme was evaluated based on its effect on coating quality, microstructure, and elemental distribution, allowing for a comparative analysis of how variations in laser power and other parameters influenced the final coating properties.

3. Results and Discussion

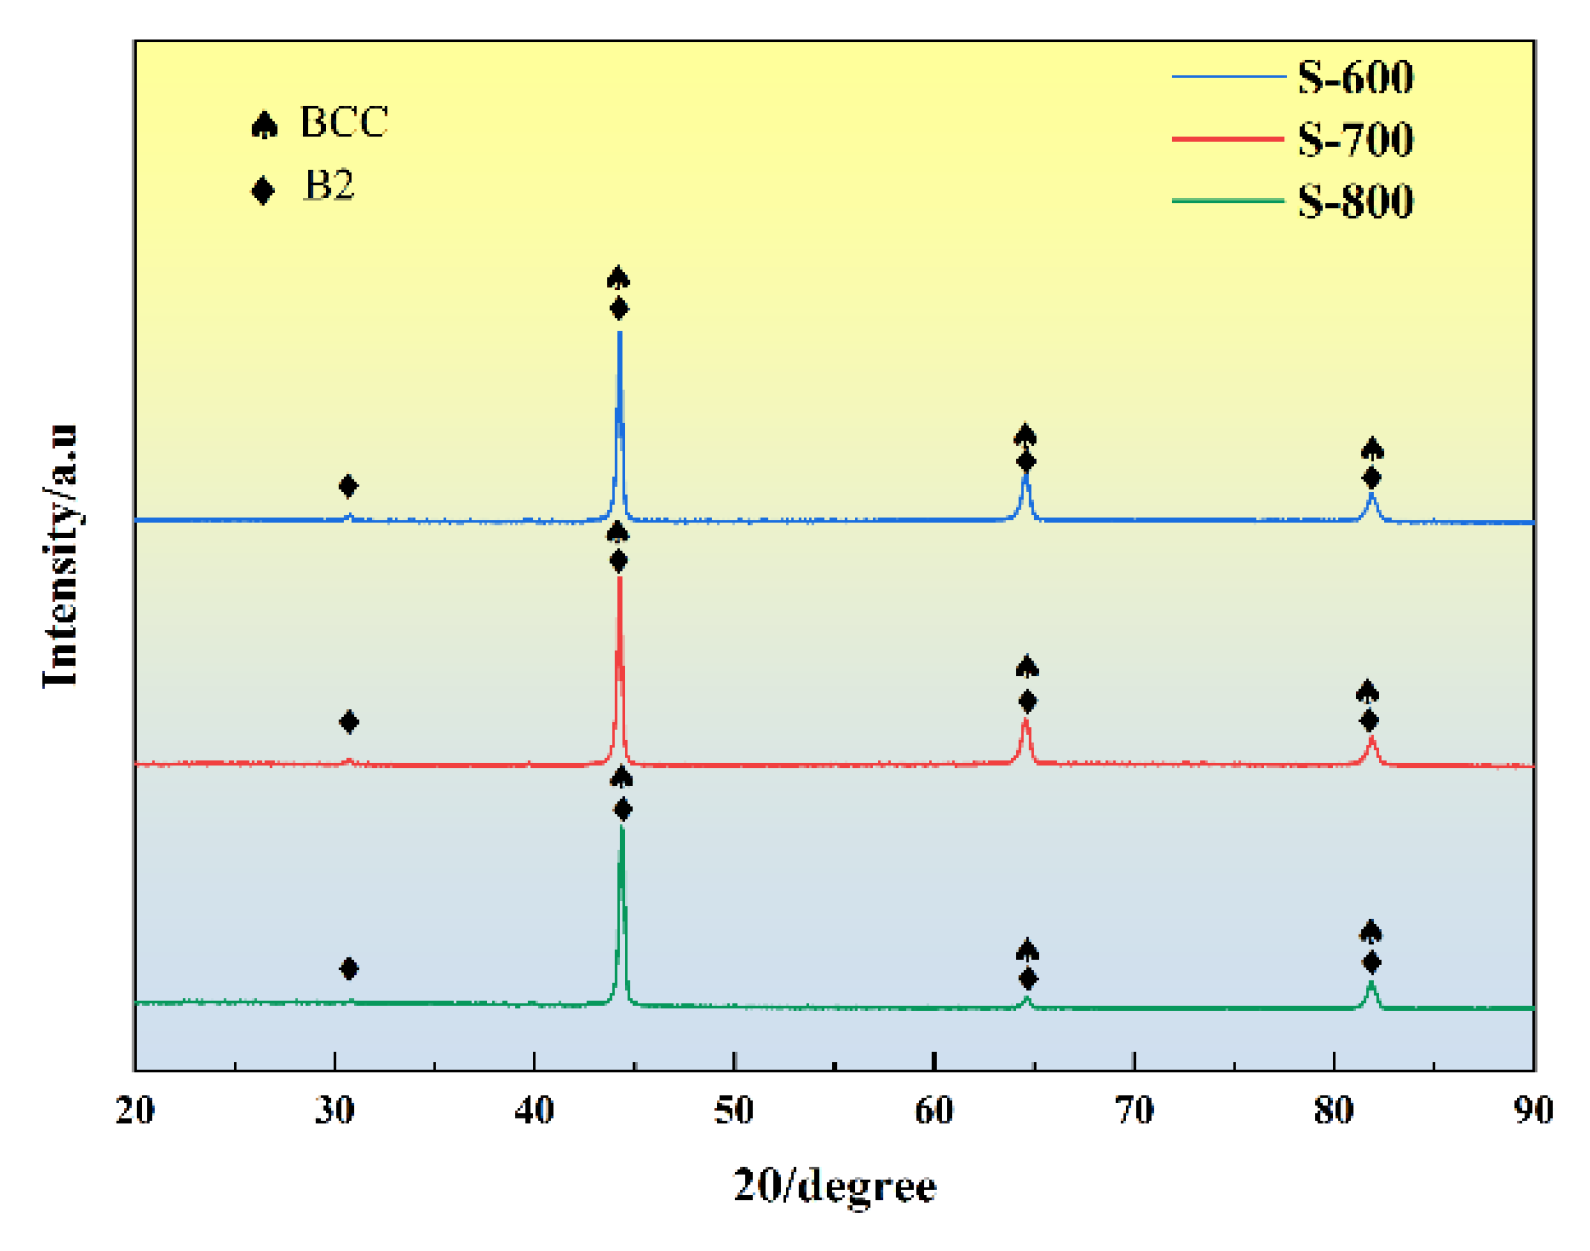
3.1. Phase Structure of Coating

To determine the phase composition of the HEA coating optimized through multi-objective response surface methodology, XRD analysis was conducted on the prepared HEA coatings. Figure 5 shows the XRD diffraction patterns for coatings produced under the three sets of process parameters. Valence electron concentration (VEC) is a factor influencing the stability of binary solid solutions [27]. Guo et al. [5] used VEC as a criterion for the stability of BCC or FCC phases, concluding that higher VEC values (≥8) favor the formation of FCC solid solutions, while lower VEC values (<6.87) support BCC solid solutions. According to the Hume–Rothery rules [28], the VEC of the FeCoNiCrAl high-entropy alloy coating is calculated to be 7.2, which falls between 6.87 and 8, suggesting a tendency toward forming a BCC phase.
The CoCrFeNi alloy itself exhibits a single-phase FCC structure; however, the addition of Al alters the crystal structure to a BCC configuration. As shown in Figure 5, diffraction peaks associated with the BCC solid solution appear at approximately 2θ = 44.68°, 65.02°, and 82.33°, aligning with the diffraction peaks of Fe (PDF 99–0064). Due to the larger atomic radius of Al, its incorporation into the lattice results in significant lattice distortion and expansion, shifting the BCC diffraction peaks in the AlCoCrFeNi cladding layer slightly to the left. Additionally, the presence of Al promotes the formation of nanoscale B2 phases. The extra diffraction peaks indicated by black arrows in Figure 5 are assigned to the (100) and (111) lattice planes of the BCC superlattice (B2). The high-temperature melting process of the HEA powder during coating preparation preserves the typical phase characteristics of high-entropy alloys, demonstrating the stability of the HEA’s BCC-dominated phase structure.
To further investigate the grain orientation and arrangement in the HEA coatings prepared under different processing conditions, electron backscatter diffraction (EBSD) analysis was conducted along the normal direction (ND) of the coating surface. The results are shown in Figure 6(a1–a3), where it is evident that the FeCoNiCrAl high-entropy alloy coatings primarily consist of the BCC phase (accounting for over 95%), consistent with the XRD results. Quantitative analysis yielded average grain sizes of 11.03 μm, 24.48 μm, and 12.24 μm for S-600, S-700, and S-800, respectively. Among these, the grain size distribution in the S-800 coating follows a more normal distribution, with a more uniform grain size. Figure 6(b1–b3) display the inverse pole figure (IPF) maps for S-600, S-700, and S-800 coatings in the <001>, <101>, and <111> crystal orientations. The surfaces of the S-600 and S-700 coatings are composed of both equiaxed and columnar grains, with the columnar grains in the cladding layer aligning vertically to the substrate, reflecting a consistent orientation with the cladding direction. In contrast, the S-800 coating predominantly consists of equiaxed grains with no pronounced texture orientation. The cooling rate is a critical factor influencing the formation of columnar versus equiaxed grains [29]. Faster cooling rates typically promote the formation of columnar grains, while slower rates favor equiaxed grains. The more uniform grain structure and absence of strong texture in the S-800 coating suggest a relatively slower cooling rate, resulting in a more homogenous microstructure that may enhance coating properties. A lower cooling rate favors the formation of columnar grains, while a higher cooling rate promotes the formation of finer and equiaxed grains. Laser power and scanning speed have contrasting effects on the cooling rate. In this study, S-600 used low power and low scanning speed, S-700 applied moderate power and speed, and S-800 employed high power and high scanning speed. By effectively balancing laser power and scanning speed, it is possible to control the microstructure of the coating and thus optimize the properties of the cladding layer. Figure 6(c1–c3) shows the inverse pole figures (IPFs) for the three HEA coatings, illustrating the grain orientation and random distribution of BCC phase polycrystalline grains, representing the texture state of the coatings. The results indicate that only a relatively small amount of hybrid texture forms in each of the three HEA coatings. The volume energy density (VED) has a significant effect on the preferred orientation of grains [30]. For instance, S-600 displays a distinct preferred orientation in the <001> direction along the Y-axis projection, indicating a strong alignment in this crystallographic direction, while other orientations are relatively weaker. In contrast, S-700 and S-800 exhibit a more dispersed crystal orientation, with no clear preferred orientation, resulting in a higher degree of randomness and disorder in their microstructures. This variation in grain orientation and distribution highlights the influence of VED and cooling rates on microstructural development, where higher power and scanning speed (as in S-800) contribute to a more random, isotropic grain orientation, potentially enhancing the uniformity of mechanical properties across the coating. Figure 6(d1–d3) displays the pole figures (PFs) for the S-600, S-700, and S-800 coatings, respectively. In all three HEA coating samples, the maximum texture index is observed along the {111} crystal axis. This indicates that, compared to the {110} and {100} crystal axes, the {111} orientation serves as the preferred growth direction for grain aggregation within the HEA coating, exhibiting a stronger growth texture. This preferred orientation suggests that multiple grains are more likely to align and cluster along the {111} crystal axis, resulting in a somewhat statistically uneven distribution. The maximum texture indices for the {111} orientation in the coatings prepared with S-600, S-700, and S-800 are 2.09, 4.64, and 1.91, respectively. This variation implies that the S-700 coating exhibits the highest degree of preferential orientation along {111}, while S-600 and S-800 show comparatively lower levels of texture alignment. This enhanced {111} alignment in the S-700 coating could result in unique mechanical or physical properties, as crystallographic texture often influences hardness, strength, and wear resistance. The observed differences in texture intensity among the three coatings are likely due to the specific process parameters, such as power and scanning speed, which affect the cooling rate and microstructural evolution during the cladding process.

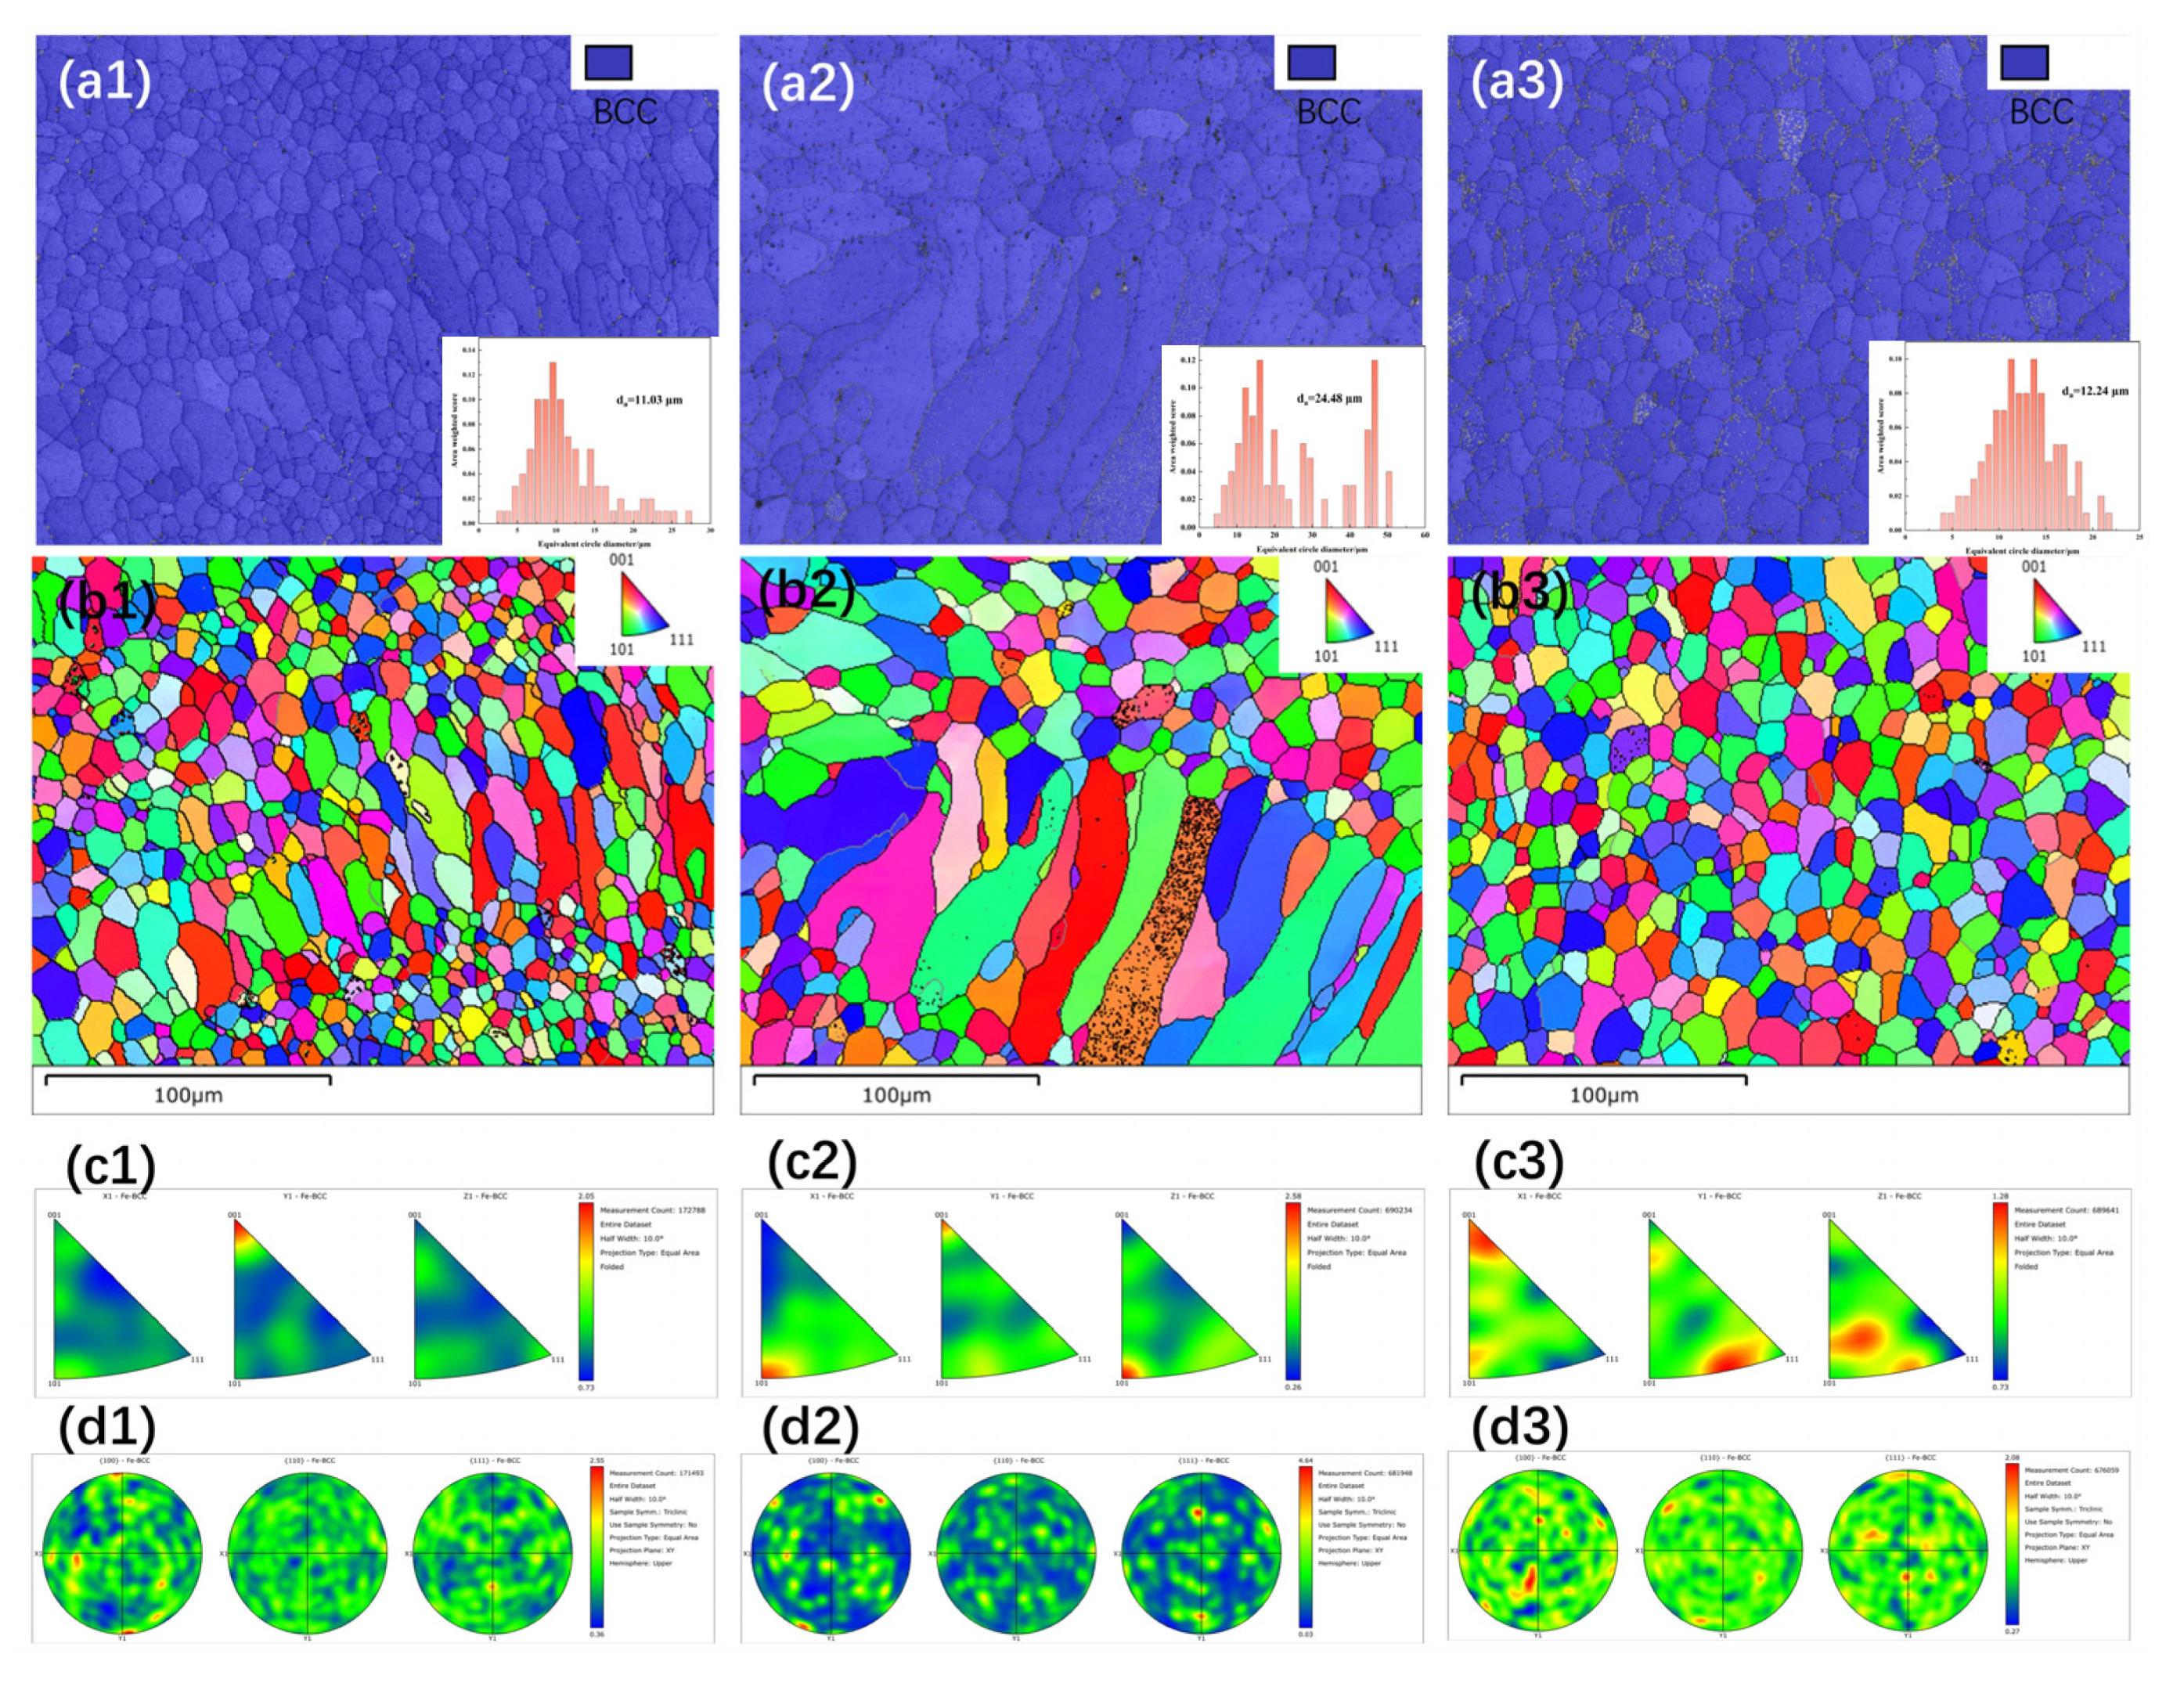
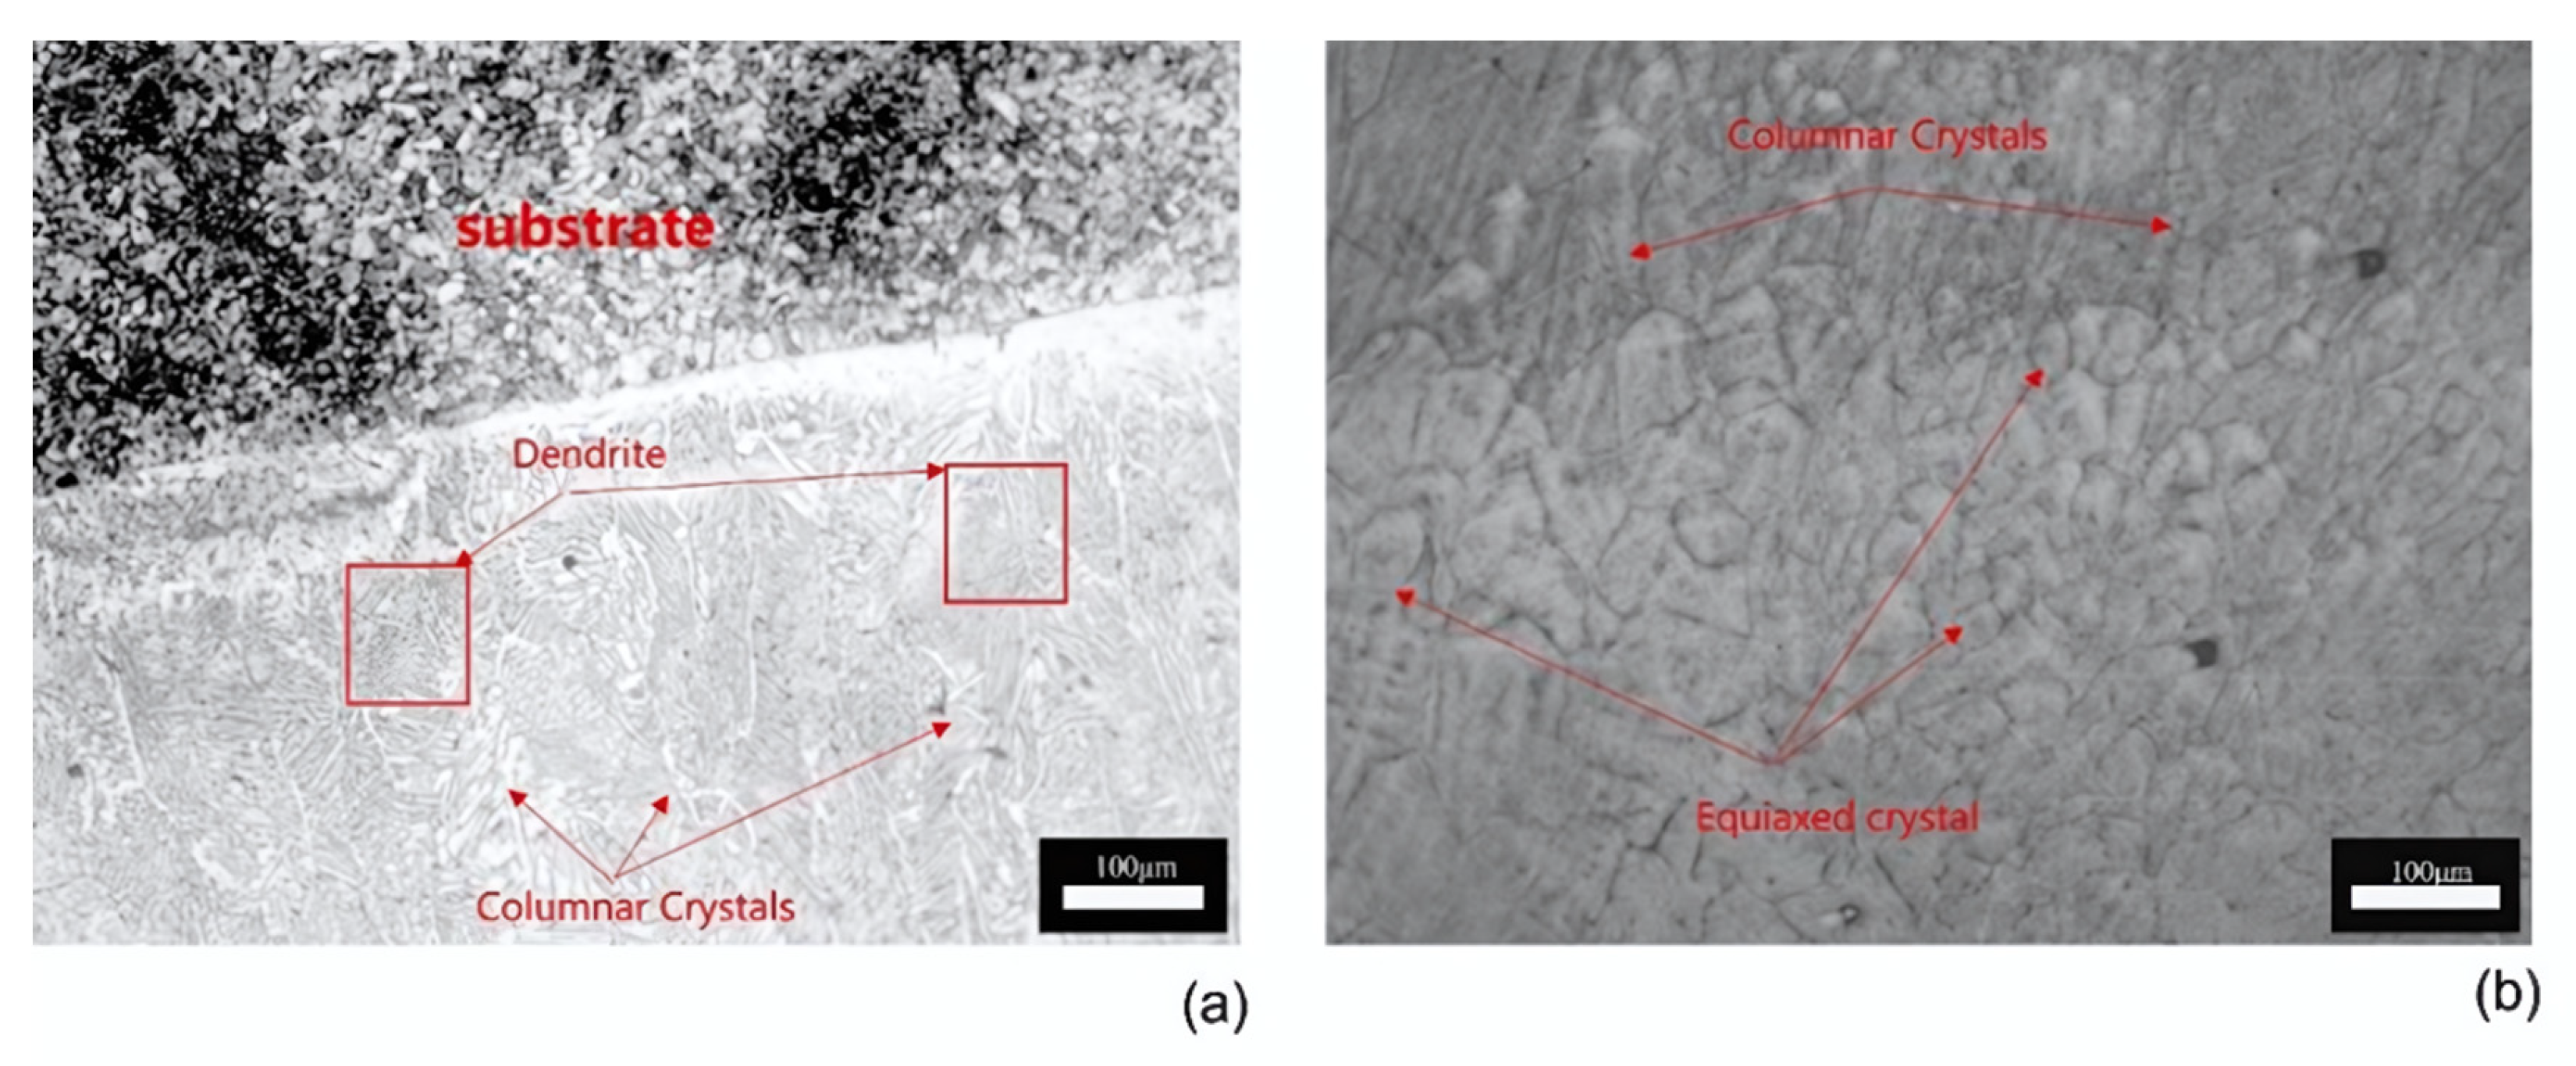
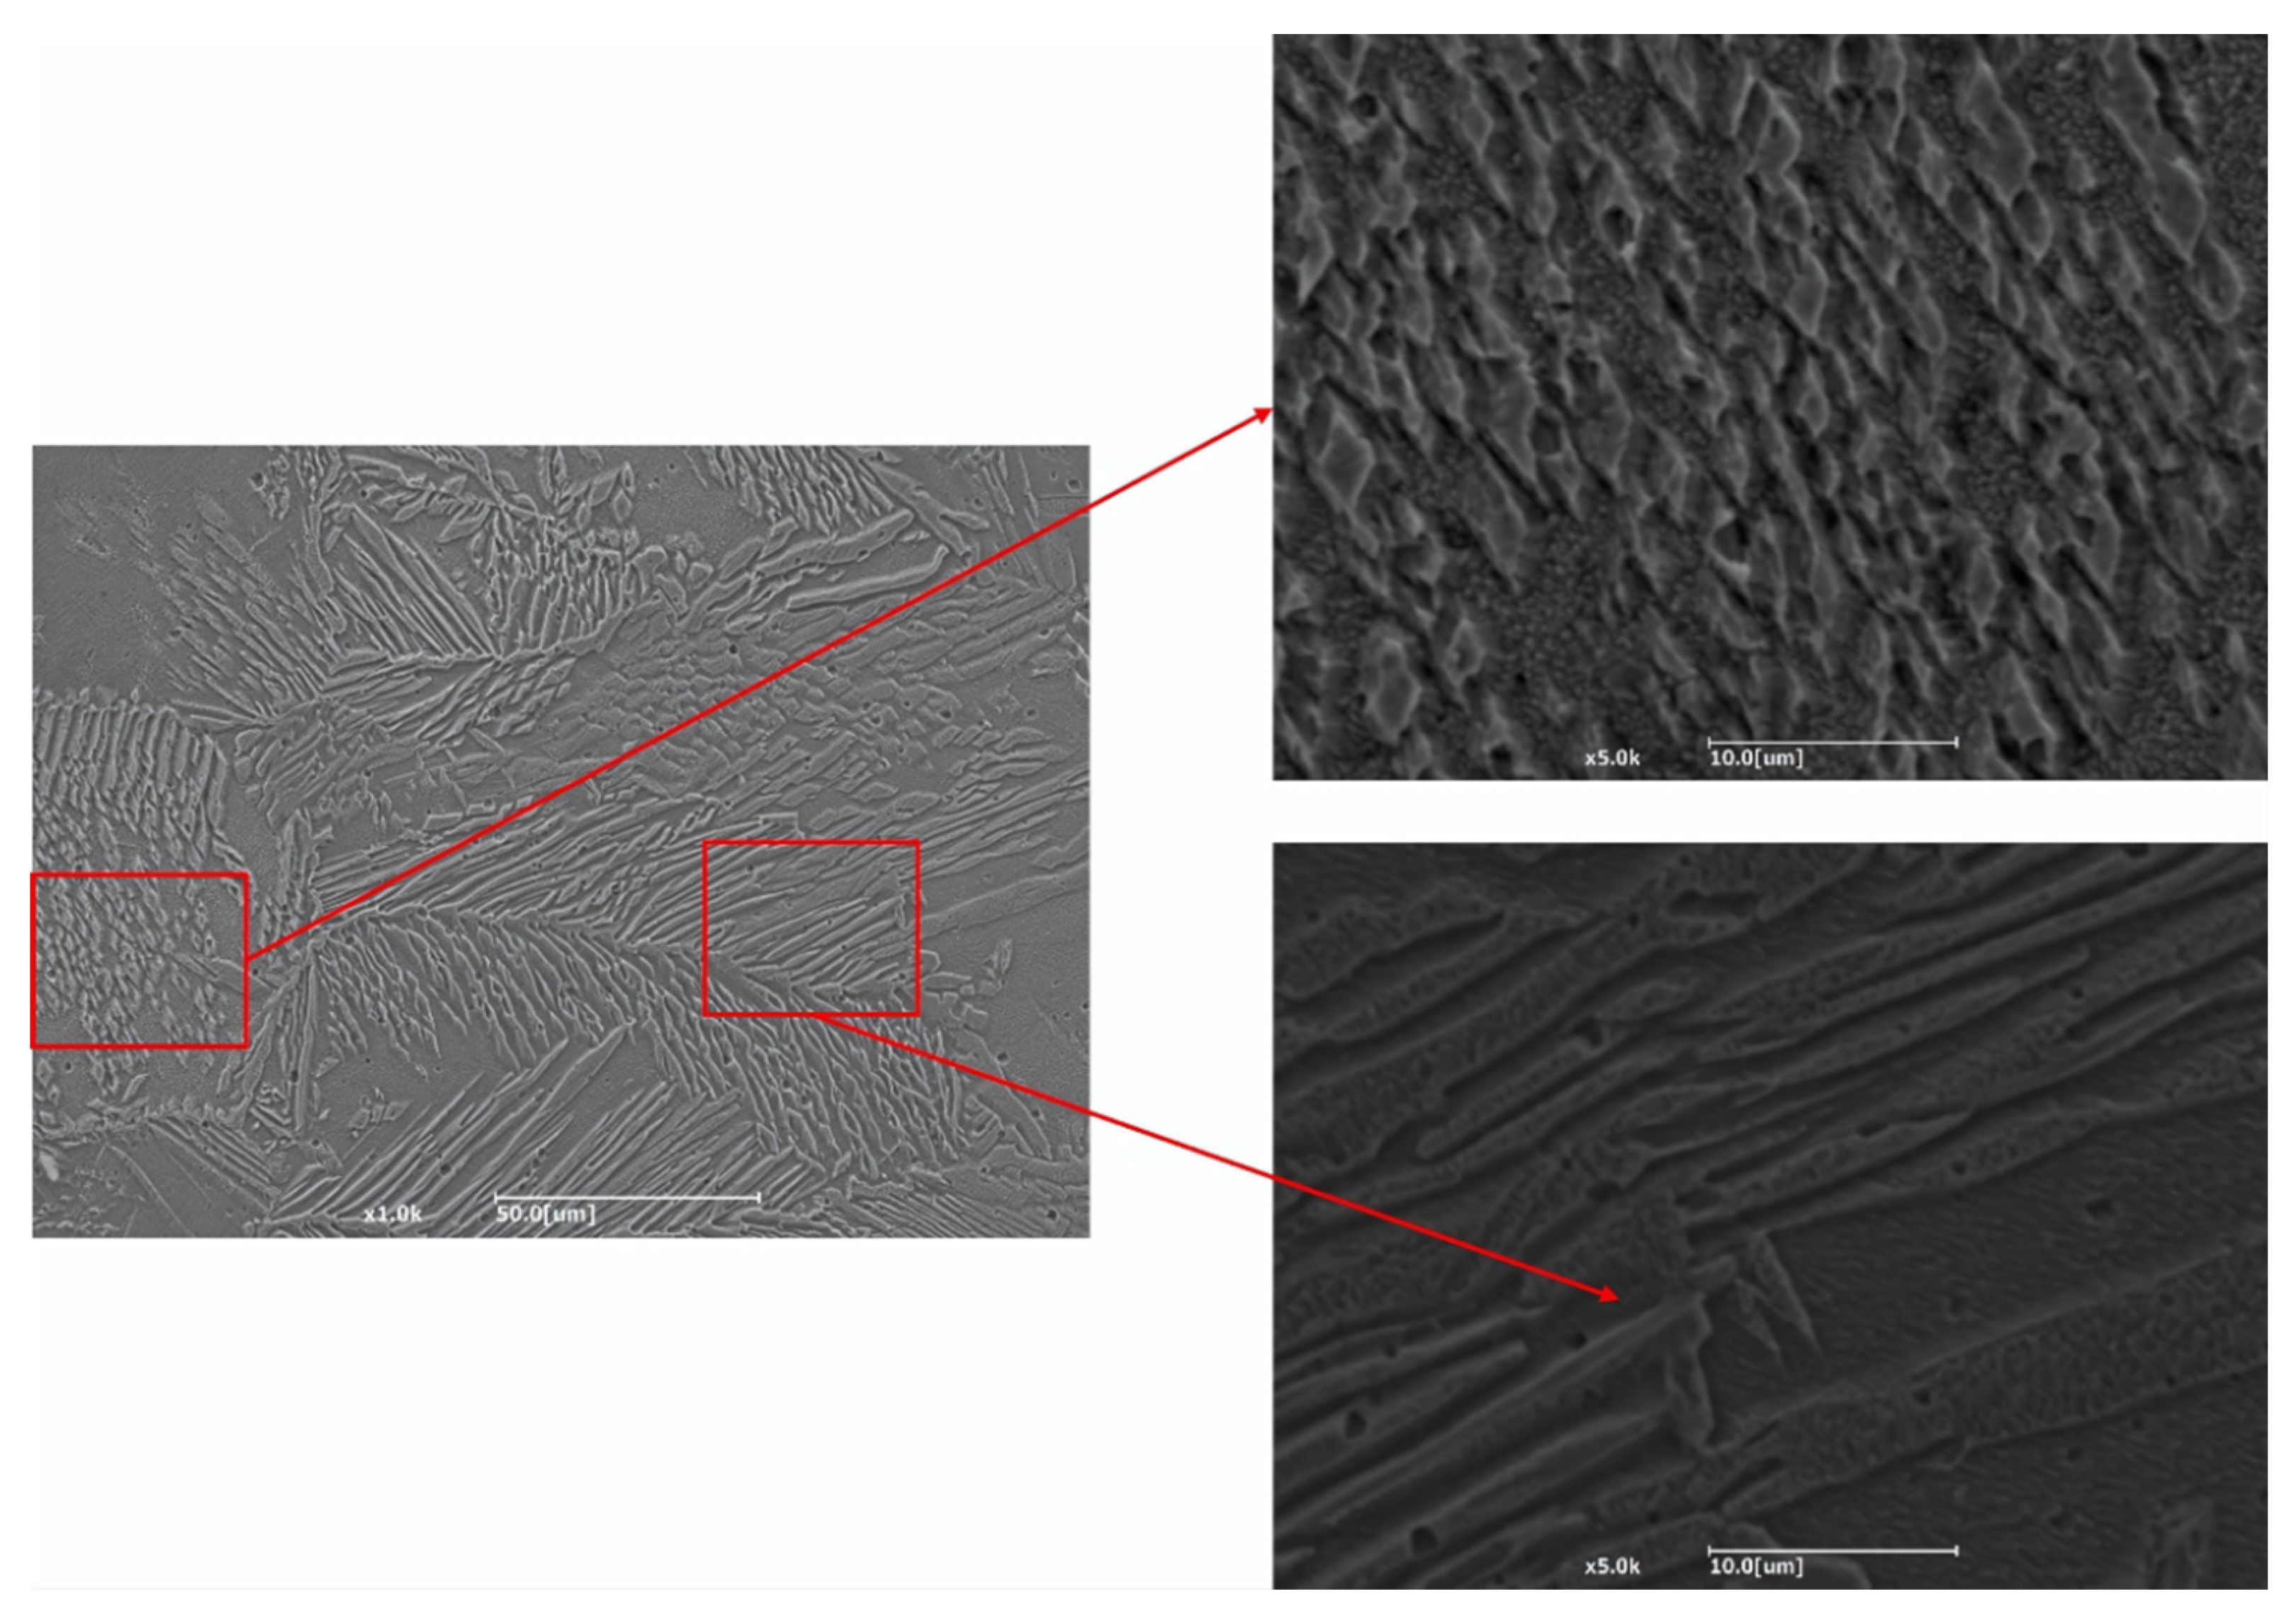
3.2. Microstructure of Coating

Figure 7 shows the cross-sectional morphology of the laser cladding layer under an optical microscope. A distinct bonding line can be observed between the coating and the substrate, indicating a strong metallurgical bond. The coating base is primarily composed of planar crystals, which gradually transition into columnar crystals as the distance from the substrate increases. In the middle region of the coating, the structure predominantly consists of columnar and cellular crystals, while the top of the coating layer is mainly composed of columnar and equiaxed crystals. Figure 8 presents the surface morphology of the coating, where grains on the coating surface exhibit a dendritic distribution. The main crystal structure along the dendrite stems comprises elongated plate-like crystals and needle-like crystals, while finer, scale-like grains are distributed away from the dendrite regions. The elongated plate-like crystals contain a relatively low concentration of Al, whereas the scale-like grains show a higher Al content.
Figure 9 shows the cross-sectional views of the coatings prepared under three different sets of process parameters: (a) S-600, (b) S-700, and (c) S-800. The coatings are divided into three distinct regions: top layer (A), middle layer (B), and bottom layer (C). No significant defects, such as cracks or pores, are visible on the surface or in the cross-section of the cladding layers. A clear fusion line can be observed between the cladding layer and the substrate, indicating a strong metallurgical bond. The coatings prepared using the S-700 and S-800 parameter sets show distinct multi-pass cladding contours at the bonding interface with the substrate, whereas the S-600 coating exhibits a more merged interface contour, suggesting a greater thermal effect from the laser. Energy-dispersive X-ray spectroscopy (EDS) analysis was conducted on the top, middle, and bottom regions of each coating to examine the elemental composition across different layers. The EDS results are summarized in Table 5, providing insights into the distribution of key elements within the cladding layer.
Table 5 reveals a noticeable increase in the Fe content in the lower region of the coating, with corresponding decreases in the other four elements’ concentrations. The closer the layer is to the substrate, the higher the Fe content, which is largely unavoidable. This occurs for two main reasons. First, Fe has a relatively low enthalpy of mixing with the other four elements in the HEA coating, making it less likely to form intermetallic compounds and more prone to segregate at grain boundaries, resulting in a higher mass proportion of Fe [31]. Second, due to the substantial Fe content in the Q235 steel substrate, the coating is influenced by melt pool convection during the cladding process. Consequently, a significant amount of Fe from the Q235 steel diffuses into the coating, resulting in higher Fe concentrations near the substrate.
The closer the coating is to the substrate, the greater the effect of melt pool convection, leading to an increased proportion of Fe. Aside from Fe, the proportions of Co, Ni, Cr, and Al remain relatively consistent across the coating. In the S-800 coating, Fe content is comparatively lower, and the distribution of elements is more balanced. This is attributed to the lower specific energy density in the S-800 process, which reduces elemental segregation. As a result, the S-800 coating exhibits a more uniform elemental distribution, enhancing its structural and performance consistency.

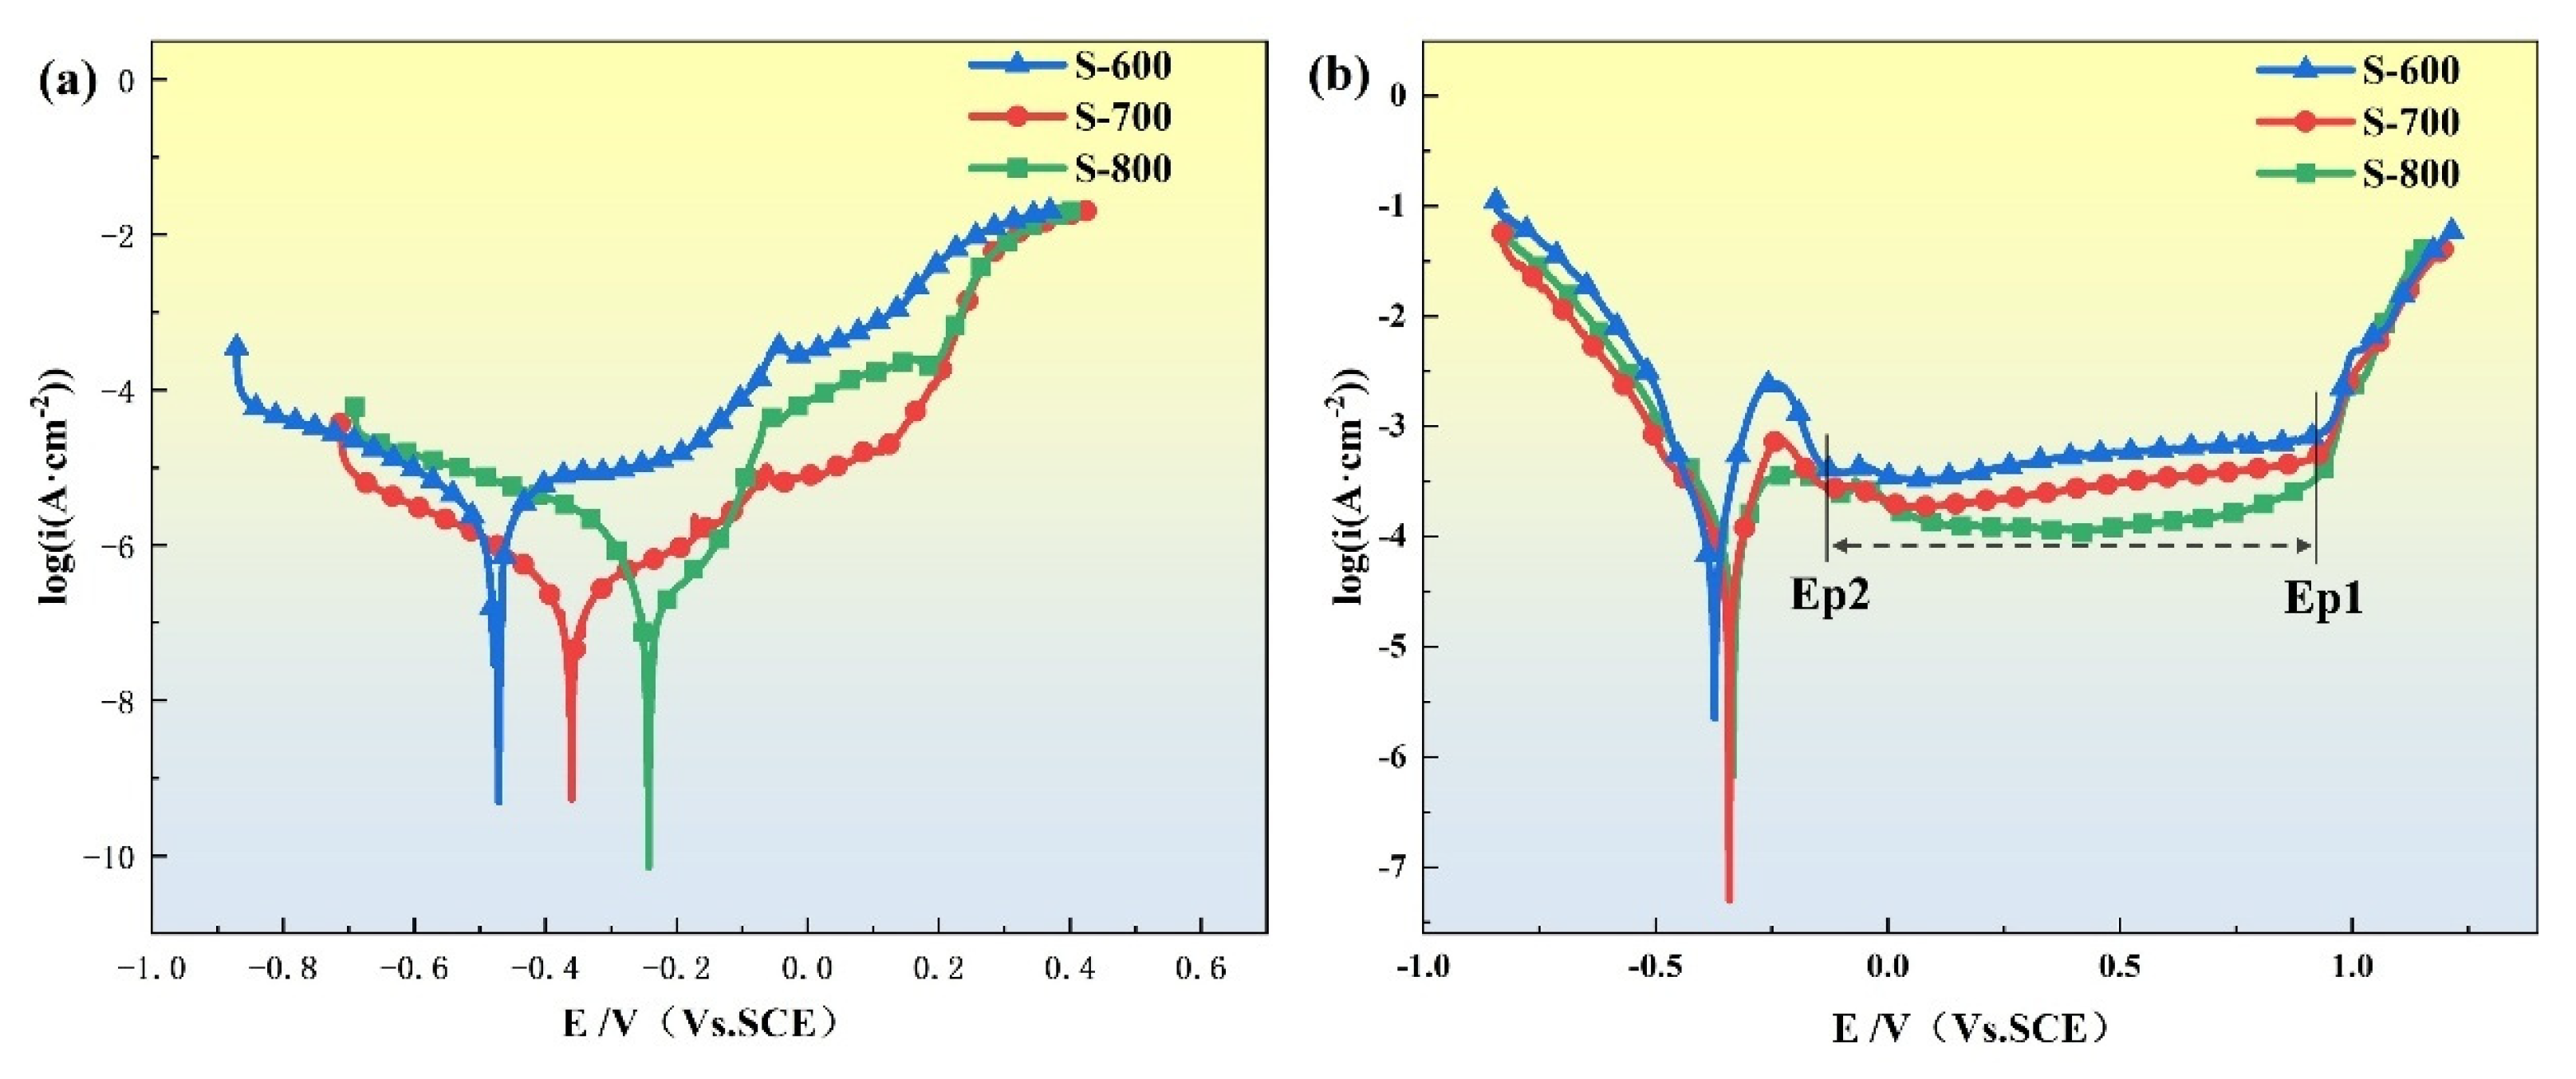
3.3. Analysis of Dynamic Potential Polarization Test Results

To evaluate the corrosion resistance of the FeCoNiCrAl high-entropy alloy coatings in different environments, the coatings prepared under the three parameter sets were immersed in 3.5 wt.% NaCl solution and 0.5 M H2SO4 solution for testing. Figure 10 shows the potentiodynamic polarization curves for the three samples. The polarization curve is segmented into four distinct regions: active dissolution, transitional passivation, stable passivation, and transpassive regions. As shown in Figure 10, the key electrochemical parameters, summarized in Table 6, are derived from the polarization curves. The corrosion potential Ecorr represents the potential at which the polarization current density is zero, marking the onset of corrosion. The corrosion current density icorr, corresponding to the current density at the corrosion potential, serves as an indicator of the overall corrosion rate. The passive current density Ipp denotes the critical current density during the active dissolution–passivation transition, while the passivation potential Epp marks the potential at which passivation initiates. Additionally, the breakdown potential Eb represents the potential at which the polarization curve transitions from the passivation to the transpassive region, where the passive film begins to dissolve, resulting in a sharp increase in current density. The range of the passivation region potential, denoted as ΔE, provides an indication of the stability of the passivation layer. A higher corrosion potential combined with a lower corrosion current density typically indicates enhanced corrosion resistance, while a wider passivation potential range (ΔE) suggests greater stability of the passivation layer. These electrochemical parameters allow for a comprehensive comparison of each coating’s corrosion resistance under neutral (NaCl) and acidic (H2SO4) conditions, elucidating the effect of various processing parameters on the HEA coatings’ corrosion behavior.
The potentiodynamic polarization curve in Figure 10a illustrates that the FeCoNiCrAl high-entropy alloy (HEA) exhibits activation–passivation–transpassivation behavior in the 3.5 wt.% NaCl solution without showing a distinct activation–passivation transition region. This suggests that the FeCoNiCrAl HEA can spontaneously form a passivation film in 3.5 wt.% NaCl solution. The breakdown potential Eb among the three process schemes shows little variation; yet, the passivation range ΔE for S-800 is broader than that of the other schemes, indicating a higher stability of the passivation film formed under the S-800 conditions. In contrast, Figure 10b shows that in 0.5 M H2SO4 solution, the FeCoNiCrAl HEA demonstrates a prominent passivation range approaching nearly 1 V, indicating that the passivation film generated in H2SO4 solution is more stable. The breakdown potential Eb and passivation range ΔE follow a similar trend to those observed in the NaCl solution, with S-800 exhibiting superior passivation stability. The passivation behavior of FeCoNiCrAl HEA differs significantly between the two solutions. Compared to the behavior in 0.5 M H2SO4 solution, the passivation range in 3.5 wt.% NaCl solution is notably narrower, and the breakdown potential Eb decreases, indicating that the passivation film is more susceptible to degradation in chloride-containing environments. This suggests that the presence of Cl ions in NaCl solution compromises the integrity of the passivation film, making it more prone to localized corrosion.
In potentiodynamic polarization curves, the corrosion potential Ecorr generally correlates positively with corrosion resistance, while the corrosion current density icorr correlates negatively. Table 6 presents the electrochemical parameters corresponding to the polarization curves of the coatings in both solutions. In 3.5 wt.% NaCl solution, the Ecorr for S-800 is −242 mV, showing a positive shift of 234 mV and 118 mV compared to S-600 and S-700, respectively, and its icorr is an order of magnitude lower than that of S-600. Similarly, in 0.5 M H2SO4 solution, S-800 exhibits superior corrosion resistance with more favorable Ecorr and icorr values, indicating its enhanced ability to resist corrosion in both neutral and acidic environments.
Relevant literature suggests that the susceptibility of surfaces to pitting corrosion is largely influenced by the crystal orientation of planes parallel to the surface [32,33,34]. Different preferred orientations within grains exhibit distinct electrochemical potentials, resulting in varied corrosion performance. As shown in Figure 11 and Table 7, statistical analysis of grain orientations—(100), (101), and (111)—indicates that the alloy with the best corrosion resistance (S-800) has the smallest proportion of the (111) orientation plane, at 6.39%, while the alloy with the poorest electrochemical performance (S-600) has the largest (111) orientation plane proportion, at 11.91%. For the BCC-structured FeCoNiCrAl high-entropy alloy, corrosion resistance in both neutral and acidic environments appears to correlate with the proportion of the (100) orientation plane.
EDS analysis further reveals that the Fe content within the S-800 coating is relatively low compared to the other coatings, while Cr is distributed uniformly throughout the coating. According to high-entropy alloy design strategies, the inclusion of Cr enhances corrosion resistance, implying that the proportion of Cr significantly influences the coating’s corrosion performance. Thus, the S-800’s improved corrosion resistance can be attributed to its lower Fe content and the uniform distribution of Cr, which promotes the formation of a stable, protective oxide layer.

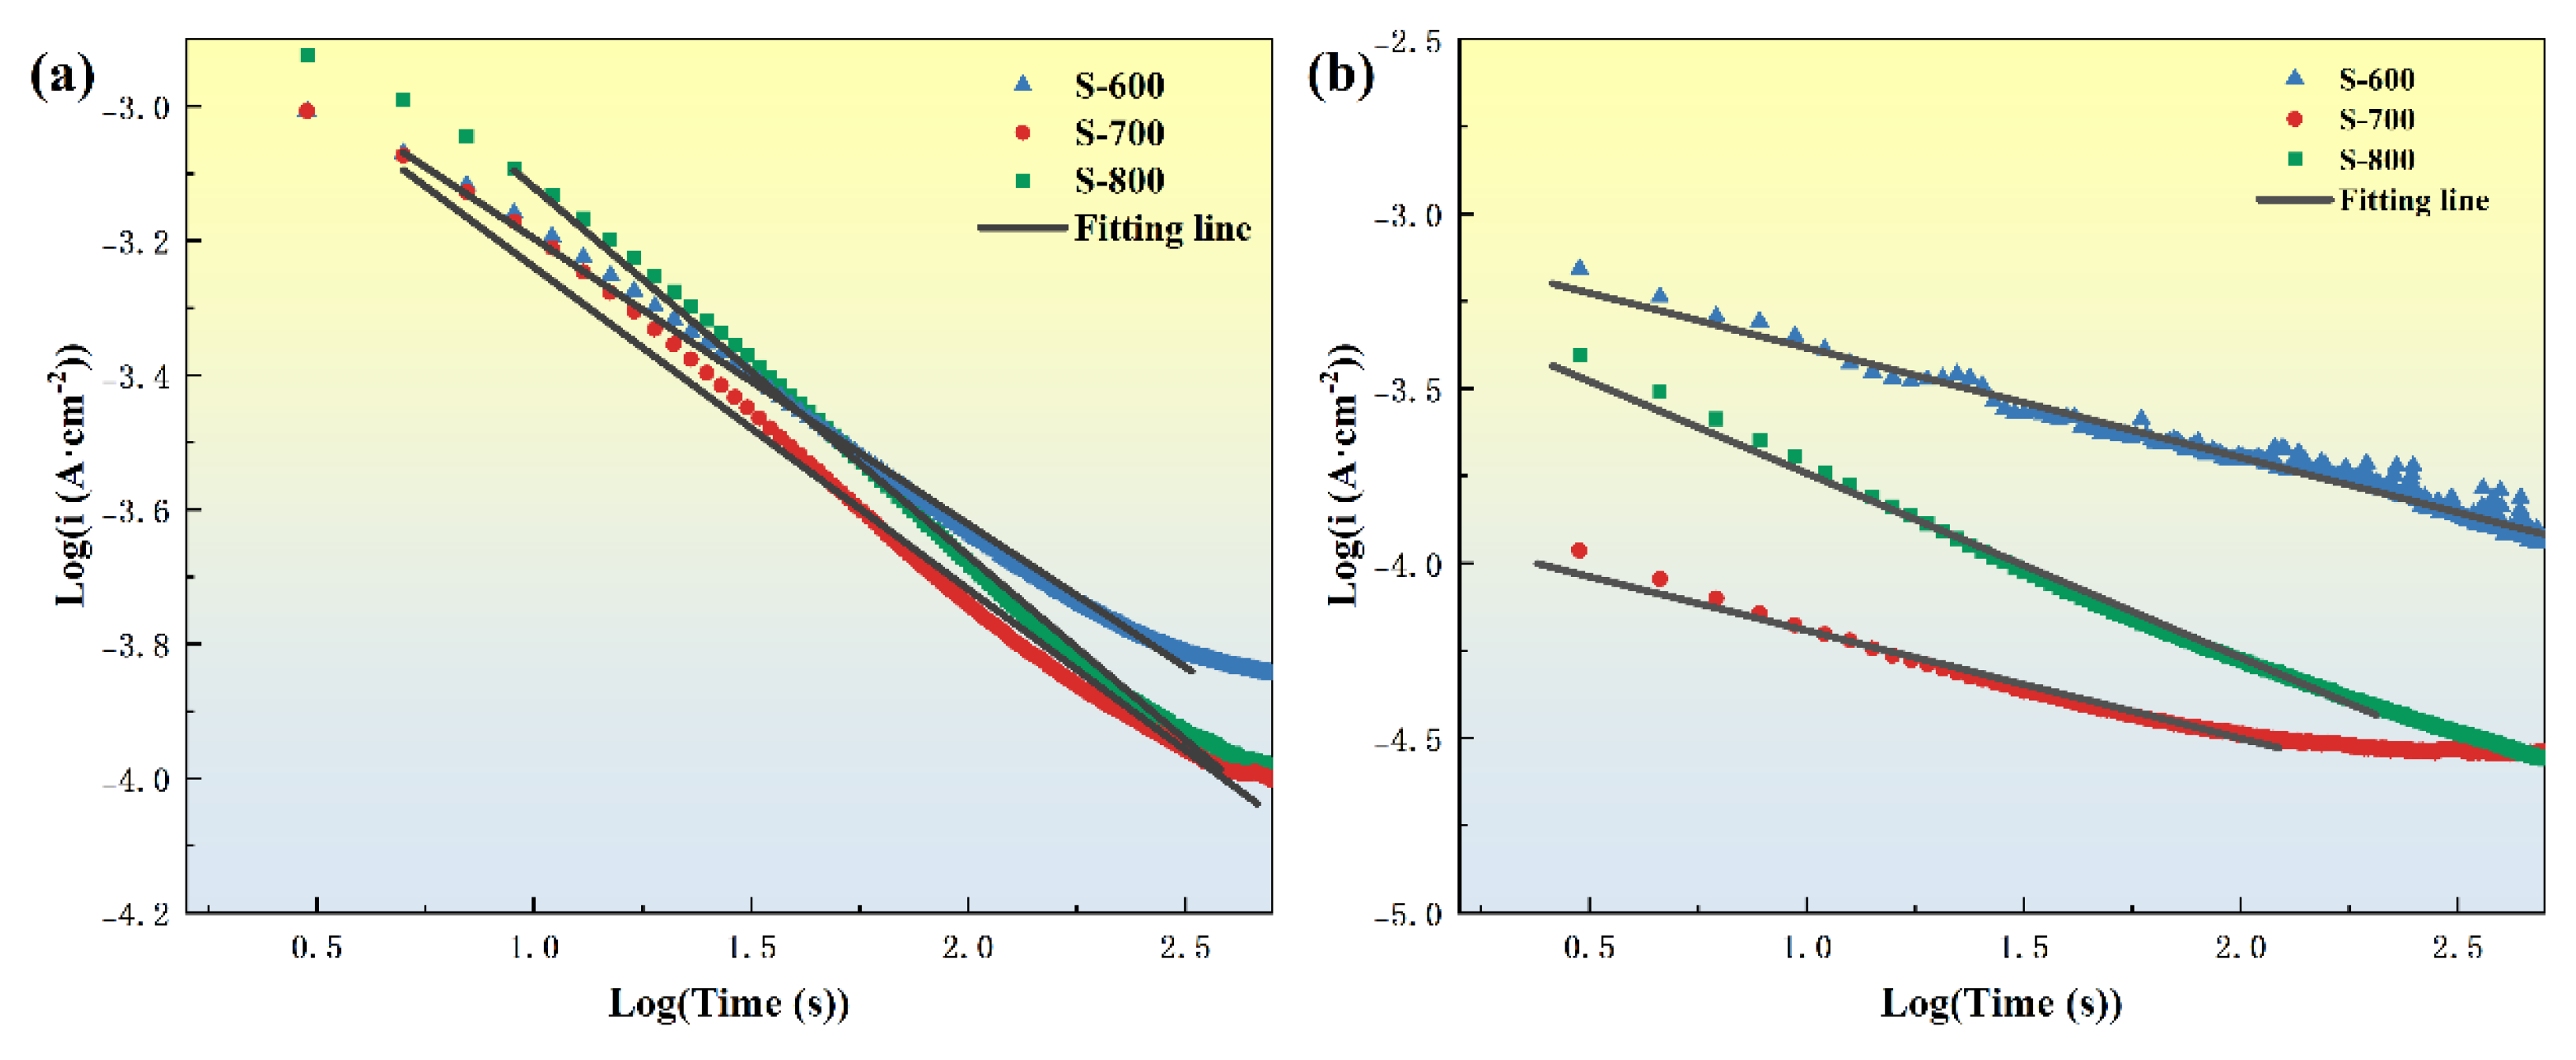
3.4. Constant Potential Polarization Analysis

Figure 12a,b show the i–t curves of the FeCoNiCrAl high-entropy alloy under potentiostatic polarization at 0 V (vs. SCE) for 30 min in 3.5 wt.% NaCl and 0.5 M H2SO4 solutions, respectively. At the onset of potentiostatic polarization, the current density decreases rapidly with time due to the rapid formation of a passive film. Subsequently, the current density gradually stabilizes, indicating that the dissolution and formation of the passive film on the alloy have nearly reached an equilibrium state, resulting in a stable passivation layer. In Figure 12b, the curve displays small peaks, suggesting slight irregularities likely due to the initiation, growth, and subsequent repassivation of unstable corrosion pits. This indicates that the protective capability of the passive film on the metal surface during corrosion is influenced by the film’s density and integrity.
According to previous studies, the decay kinetics of the passive film formed on the metal surface follow the Macdonald model [35]. The relationship between current density and time can be described by the following equation [36]:
l o g i = l o g A n l o g T
In this model, i represents the current density, A is a constant, n is the passivation index, and T is time. The passivation index n is determined by linear fitting of the logi-logT plot and indirectly reflects the passivation rate of the passive film [37]. As shown in Figure 13, in 3.5 wt.% NaCl solution, the passivation indices for S-600, S-700, and S-800 are 0.424, 0.478, and 0.548, respectively. In 0.5 M H2SO4 solution, the passivation indices for S-600, S-700, and S-800 are 0.313, 0.308, and 0.526, respectively. A passivation index n closer to 1 indicates a denser passive film. Thus, in both neutral and acidic environments, the S-800 sample exhibits the densest and most protective passive film, followed by S-700, while S-600 shows the least protective film. This trend suggests that the S-800 coating’s passive film provides superior corrosion protection, likely due to a more stable and compact passive layer formation, enhancing its durability and resistance to environmental degradation.

3.5. Analysis of the Composition and Structure of Passive Films

The passive film formed on the alloy surface plays a crucial role in enhancing the alloy’s corrosion resistance, with the composition and structure of the passive film directly determining its protective capability in corrosive media. To further investigate the composition of the passive films on FeCoNiCrAl high-entropy alloy (HEA) coatings in different environments, two sets of coating samples were subjected to potentiostatic polarization at 0 V (vs. SCE) for 30 min in 3.5 wt.% NaCl solution and 0.5 M H2SO4 solution, respectively. XPS analysis was then performed on the coating surfaces to identify the passive film components. The results are shown in Figure 14, with Figure 14a–f illustrating the deconvoluted XPS spectra for Fe 2p3/2, Co 2p3/2, Ni 2p3/2, Cr 2p3/2, Al 2p, and O 1s. The XPS spectrum for Al 2p reveals two peaks corresponding to metallic Al (Al0) and Al2O3, with Al2O3 being the predominant form of Al in the passive film, indicating its role in enhancing film stability. In NaCl solution, the XPS spectrum for Co 2p3/2 is divided into four component peaks—metallic Co (Co0), CoO, Co3O4, and Co(OH)2—while in H2SO4 solution, Co is present primarily as Co0 and Co(OH)O. This suggests that Co oxides and hydroxides constitute the main forms of Co in the passive films in both environments. Fe appears in several forms within the passive film, including Fe2O3, Fe3O4, Fe(OH)2, and Fe(OH)O, with hydroxides being the predominant species in the S-800 coating, further contributing to passivation stability.
The XPS spectrum for Ni 2p3/2, as shown in Figure 14c, includes peaks corresponding to metallic Ni (Ni0), Ni(OH)2, and a satellite peak (NiSAT). Previous studies often overlooked Ni due to its typically low content in alloy systems; however, in FeCoNiCrAl HEAs, Ni is present in substantial amounts. Research has shown that metallic Ni often localizes at the metal–passive film interface, where it contributes to corrosion resistance. The Cr 2p3/2 XPS spectrum, shown in Figure 14d, reveals three peaks associated with metallic Cr (Cr0), Cr2O3, and Cr(OH)3. Cr2O3 and Cr(OH)3 are the primary forms of Cr in the passive film, consistent with previous studies on high-entropy alloy passivation films [38,39]. In the O 1s spectrum of the coating surface, three component peaks are observed: one associated with O2− in metal oxides on the passive and corrosion product films, a second peak indicating the formation of metal hydroxides, and a third peak corresponding to bound water within the passive and corrosion product films. The relative intensities of these component peaks suggest that metal oxides and hydroxides are the main constituents of the passive film on the coating surface, providing robust protection against corrosion.
A combined analysis of the high-resolution spectra in Figure 14a–f and the relative compound distribution in Figure 14g indicates that in 3.5 wt.% NaCl solution, the passive film is primarily composed of Cr oxides and hydroxides, followed by Ni oxides, with the smallest proportion being Al compounds. Similarly, in 0.5 M H2SO4 solution, Cr oxides and hydroxides again dominate the passive film, while Al compounds are the least prevalent. The high stability of Cr2O3 contributes to the film’s density and integrity, enhancing its protective ability. In contrast, the porous nature of Al2O3 can increase the passivation film’s porosity, potentially reducing its corrosion resistance. The FeCoNiCrAl HEA coating produced under S-800 conditions exhibits a passive film with a high Cr and low Al content in both neutral and acidic media. This high Cr and low Al characteristic of the passive film likely accounts for the superior corrosion resistance of the S-800 coating, as the Cr-rich layer provides a robust barrier against corrosive agents, while minimized Al content reduces structural porosity in the protective layer.

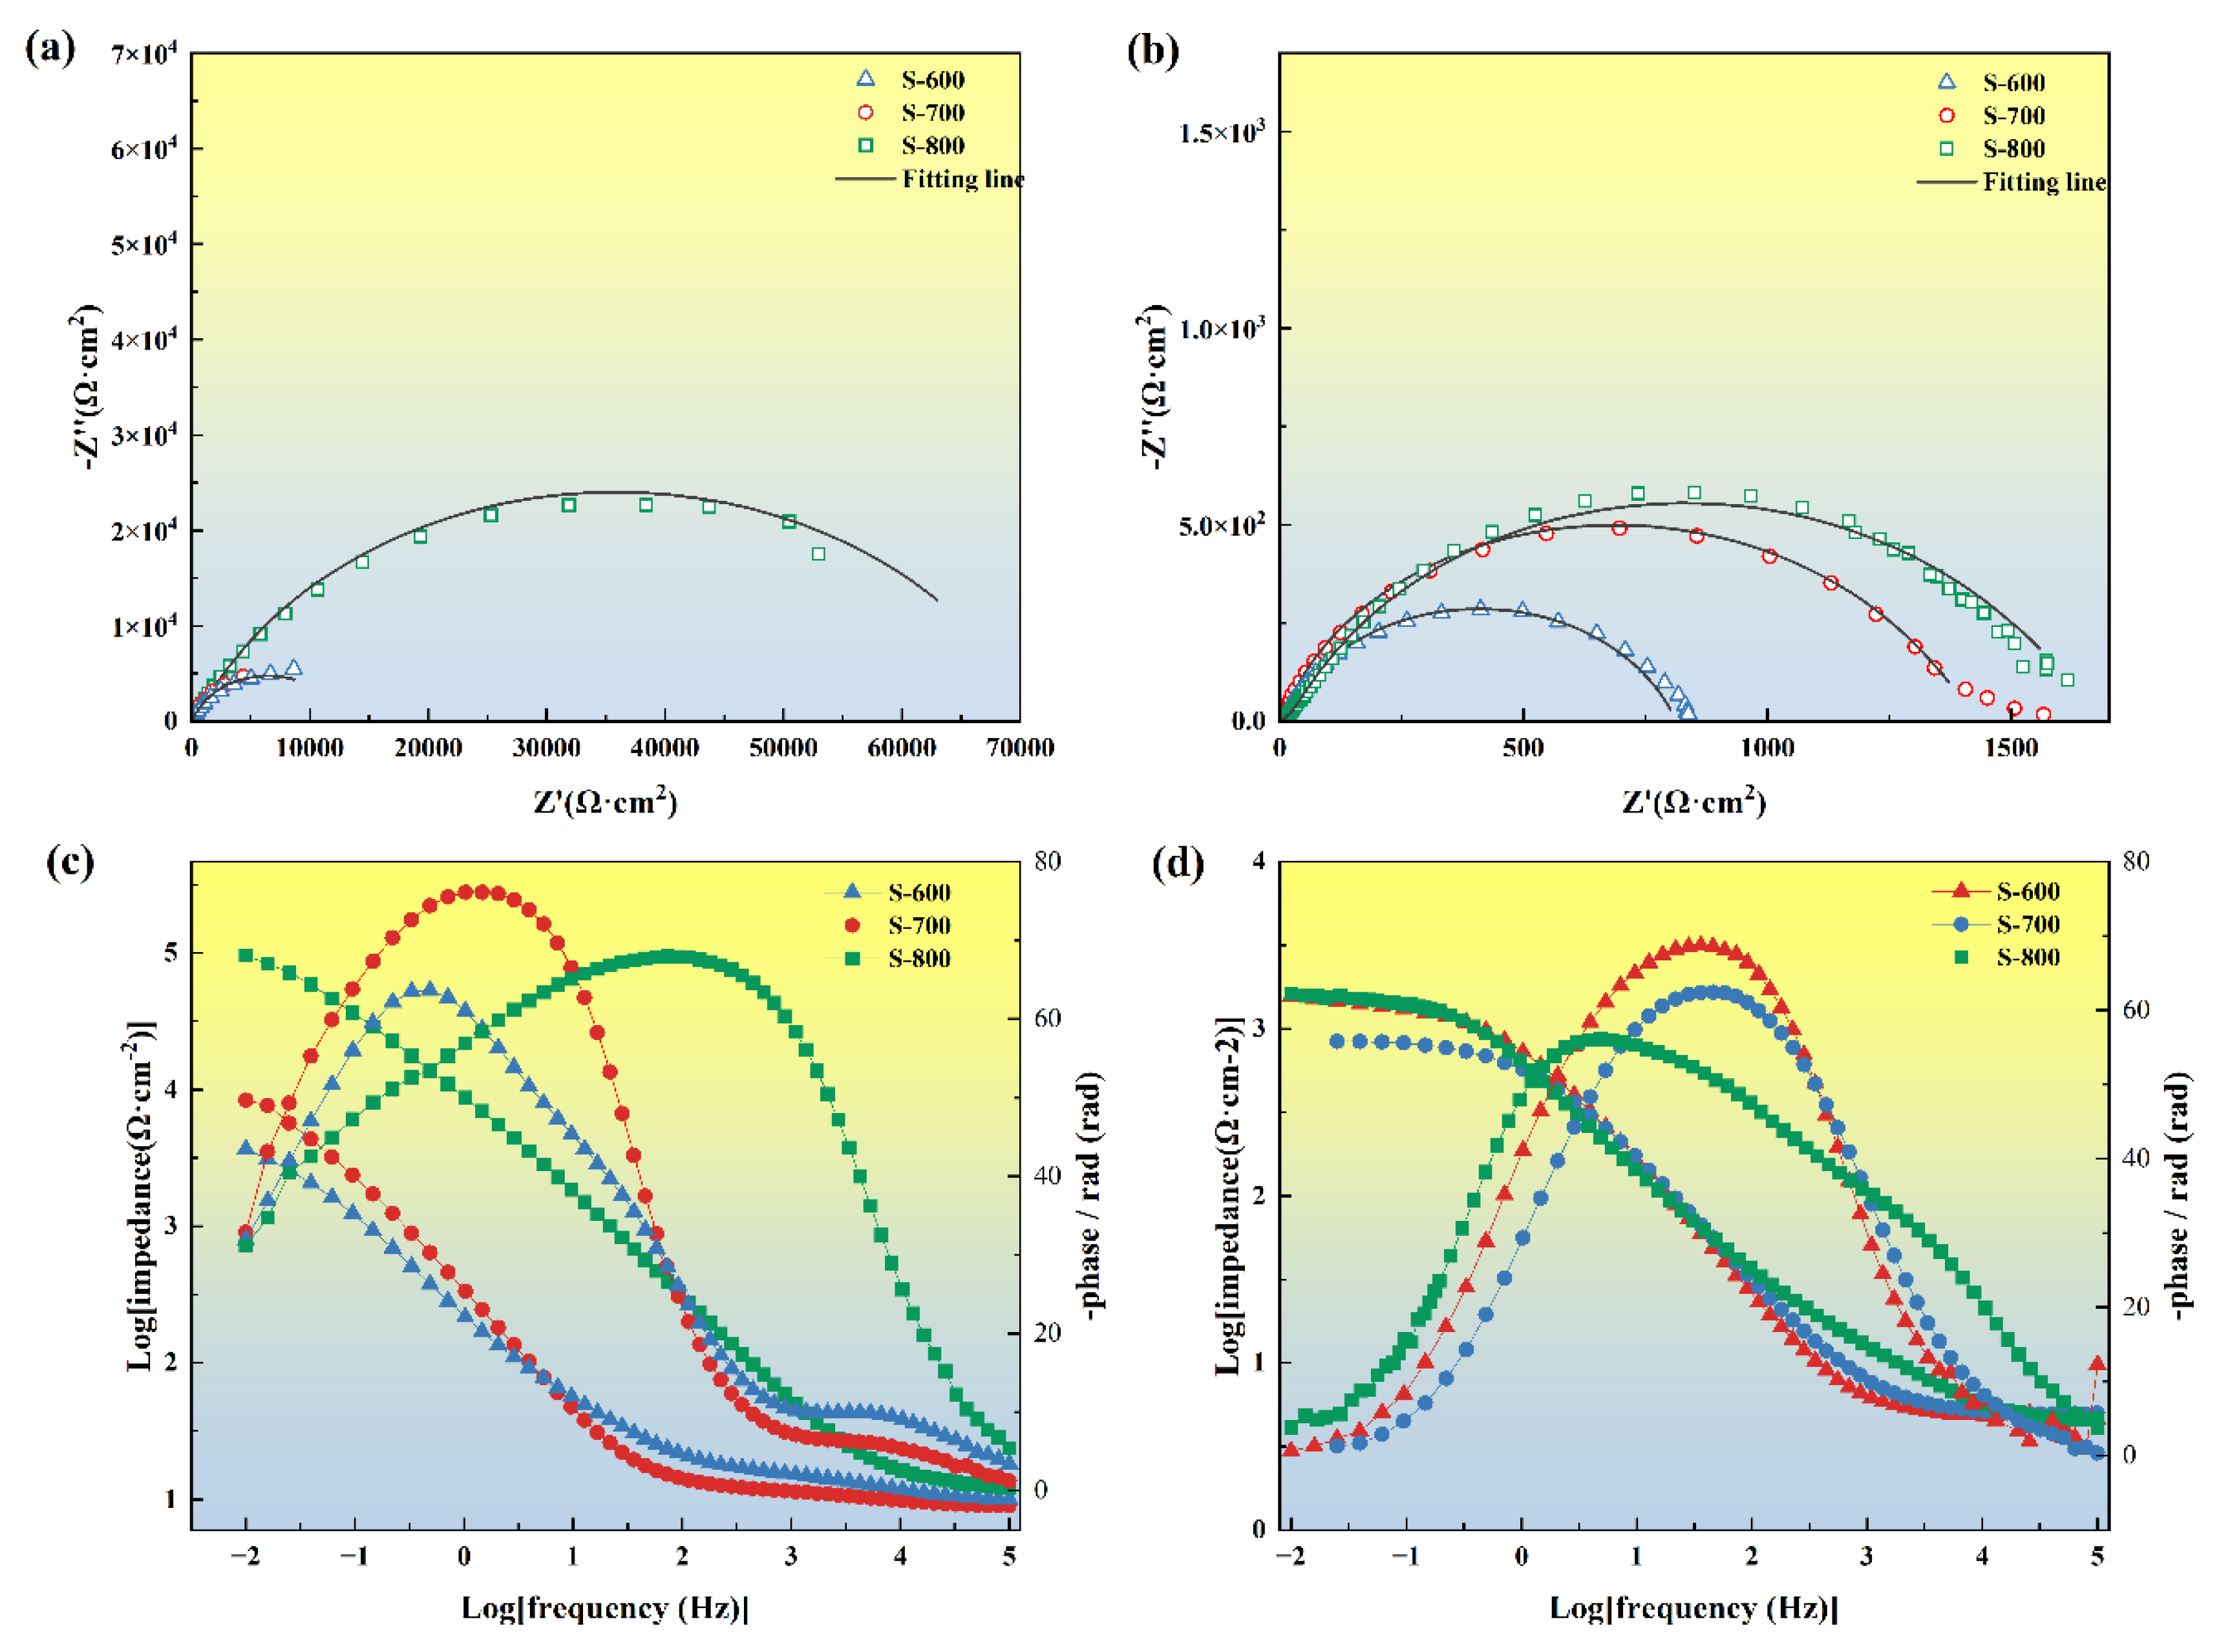
3.6. Analysis of EIS Test and Mott–Schottky Test of Passive Films

In corrosive media, the passive film formed on the alloy surface isolates the alloy substrate from the environment, thereby protecting it from corrosion. Figure 15a,b shows the Nyquist plots for the passive films formed on the FeCoNiCrAl high-entropy alloy in different environments, specifically in 3.5 wt.% NaCl and 0.5 M H2SO4 solutions. Both Nyquist curves display semicircular shapes, indicating charge transfer processes occurring at the heterogeneous interface between the corrosive solution and the electrode [40]. The size of the capacitive arc in the Nyquist plot reflects the impedance of the alloy’s passive film, with the capacitive arc radius of the S-800 coating being significantly larger than that of the S-600 coating. A larger capacitive arc diameter corresponds to higher passive film impedance, suggesting superior corrosion resistance of the passive film in corrosive media [41,42]. In the Bode plots, the high-frequency region (105 Hz) represents the impedance of the test solution, while the low-frequency region (10−2 Hz) indicates the impedance of the corrosion reaction [43]. As shown in Figure 15c,d, the impedance values for S-800 in the low-frequency region are consistently higher than those of the other samples, indicating that this coating offers better corrosion resistance in both solutions. In the phase-frequency curves of the Bode plots, the peak value of the phase angle correlates with the quality of the passive film. A larger phase angle peak indicates a higher voltage required to break down the passive film, signifying the stronger protective capability of the passive film on the coating surface [44]. To further interpret the electrochemical impedance spectroscopy (EIS) data, equivalent circuit fitting was performed, and the fitted equivalent circuit diagram is displayed in Figure 16. In the equivalent circuit diagram, Rs represents the solution resistance, while R1 and R2 correspond to the outer and inner layer resistances of the passive film, respectively. The constant phase element (CPE) is used in place of an ideal capacitor Q to account for the inhomogeneity of the electrode surface. The parameter Y denotes the admittance of the CPE, where a high Y value implies an increased rate of charge exchange at the electrode surface, thus accelerating the dissolution of the passive film. The exponents n1 and n2 represent the dispersion coefficients for CPE1 and CPE2, respectively; the closer n is to 1, the more the CPE resembles an ideal capacitor. Fitting data are presented in Table 8. Studies have shown that the effective capacitance Ceff of the passive film, and, consequently, its thickness δ, can be estimated using the Helmholtz model [45]. The effective capacitance Ceff can be calculated as follows:
C e f f = Q 1 n R s 1 n n
where Q represents the impedance of the CPE and Rs represents the resistance of the passive film. The relationship between passive film capacitance and thickness is given as follows:
C e f f = ε ε 0 A / δ
where ε is the vacuum permittivity (8.854 × 10⁻¹⁴ F·cm−1), ε0 is the dielectric constant of the passive film (15.6 for this material), A is the effective surface area of the sample, and d is the thickness of the passive film. By combining the equations, the thickness d of the passive film can be expressed as follows:
δ = ε ε 0 A Q 1 n R s n 1 n
The thickness of the passive film is a critical factor in determining its corrosion resistance. Table 8 indicates that, in a neutral environment, the passive film thickness for S-800 is significantly greater than that of the other samples, whereas in an acidic environment, the passive film thicknesses are relatively similar. Generally, a larger charge transfer resistance R corresponds to a slower reaction rate at the alloy/solution interface, suggesting that electron or ion transfer across the passive film and metal surface is impeded. The charge transfer resistance R1 for S-800 is an order of magnitude higher than that of the other samples in both neutral and acidic environments, indicating the formation of a highly protective and stable passive film on the alloy surface. This film effectively impedes the penetration of corrosive ions, preventing them from reaching the metal substrate, a finding that aligns with the results obtained from polarization curve testing.
Studies have suggested that the pitting resistance of coatings may be related to the electronic structure of the surface passive film, as the formation and dissolution of the passive film are influenced by the accumulation and migration of point defects, which are themselves dependent on the electronic properties of the passive film [46]. In other words, the passive film on the coating surface exhibits semiconductor characteristics, which affect charge transfer in the solution. It is, therefore, essential to study semiconductor behavior on the passive film surface. As shown in Figure 17, the Mott–Schottky plots for the FeCoNiCrAl high-entropy alloy in different potentials and solutions display similar patterns, each consisting of two distinct regions. The region with a positive slope represents the n-type semiconductor nature of the passive film, indicating that the main defects within the film are cation interstitials or oxygen vacancies, corresponding to the donor density ND of charge carriers. The region with a negative slope represents p-type semiconductor characteristics, indicating that cation vacancies are the primary defects, and the charge carrier density, in this case, is the acceptor density NA. The presence of a p-n junction in the passive film helps to block the diffusion of metal cations from the substrate into the corrosive medium while simultaneously hindering the infiltration of corrosive ions from the solution into the metal substrate. The appearance of regions with both positive and negative slopes indicates that the passive film exhibits p-n heterojunction semiconductor characteristics. The donor density ND can be calculated from the slope of the linear region in the Mott–Schottky plot using Equation (8), with the results presented in Table 9. This p-n heterojunction structure within the passive film plays a crucial role in enhancing the coating’s resistance to corrosion by effectively controlling ion transport, thus maintaining a stable protective barrier on the alloy surface.
1 C 2 = 2 eN D ε ε 0 A 2 E E fb kT e
In the Mott–Schottky analysis, e represents the elementary charge of an electron (1.602 × 10⁻¹⁹ C), ε is the permittivity of free space (8.854 × 10⁻¹⁴ F·cm−1), ε0 is the dielectric constant of the passive film (taken as 15.6 for this material), A is the effective surface area of the sample, and Efb is the flat-band potential, which can be determined by extrapolating the slope of the Mott–Schottky plot. T and k represent the thermodynamic temperature and Boltzmann constant (1.38 × 10⁻²³ J/K), respectively. The donor density ND reflects the defect concentration within the passive film; a higher ND value corresponds to an increased accumulation in oxygen vacancies, indicating a higher defect concentration within the passive film. This higher defect density generally correlates with poorer protective performance, making the film more vulnerable to attack by corrosive ions. In 3.5 wt.% NaCl solution, the ND values for the three samples are relatively similar, all on the order of 1023 cm−3. However, in 0.5 M H2SO4 solution, the ND value for the S-800 sample is an order of magnitude lower than those of S-600 and S-700. This suggests that, in a neutral environment, the passive film formed on the FeCoNiCrAl HEA coatings is comparatively less dense, leading to higher defect density and greater susceptibility to localized corrosion. By contrast, in an acidic environment, the S-800 coating exhibits a much lower oxygen vacancy density, resulting in fewer surface defects, a reduced likelihood of pitting, and enhanced corrosion resistance. This lower ND value indicates a more stable, defect-free passive layer, which significantly improves the durability of the S-800 coating under acidic conditions.

3.7. Experimental Analysis of Corrosion Immersion

The corrosion morphology of high-entropy alloys provides a clear and direct indication of their corrosion resistance. Figure 18 shows the morphology of the S-800 FeCoNiCrAl HEA after immersion for 15 days at room temperature in 3.5 wt.% NaCl and 0.5 M H2SO4 solutions. As illustrated in Figure 18a, the surface of the coating immersed in NaCl solution displays random pits and voids on a delaminated outer layer, with parts of the “surface layer” peeling off, revealing an underlying porous surface. In a sulfuric acid solution, the alloy experiences severe corrosion after 15 days, as evidenced by visible grain boundaries and corrosion pits, suggesting selective corrosion on the surface. A similar selective dissolution pattern may also occur in NaCl solution. Comparative point EDS analyses of areas inside and outside the corrosion pits, as shown in Figure 18b,c,e,f, are summarized in Table 10. In 3.5 wt.% NaCl solution, the selective dissolution of Ni, Fe, and Al was more pronounced, whereas Co and Cr showed significantly less dissolution. The coating primarily consists of a Cr-Fe-rich BCC phase with a minor Al-Ni-rich B2 phase, suggesting that the B2 phase corrodes preferentially to the BCC phase [35]. In the H2SO4 solution, the selective dissolution of Al and Ni is more pronounced, while Cr maintains a stable concentration, and the increase in O content suggests the formation of substantial Cr-based oxides. These observations confirm the hypothesis of a selective dissolution of elements, where the stable Cr oxides contribute to enhanced passivation, particularly in acidic environments, effectively inhibiting further corrosion of the alloy.

3.8. Corrosion Mechanism Analysis

The FeCoNiCrAl high-entropy alloy (HEA) cladding layer forms a passive film spontaneously in 3.5 wt.% NaCl solution; however, the presence of Cl ions compromises the integrity of this film, hindering its self-healing ability and promoting pitting, as shown in Figure 19a. In neutral chloride environments, the B2 and BCC phases exhibit different corrosion behaviors, primarily due to their distinct atomic structures and electronic properties. The Al-Ni-rich B2 phase, characterized by a higher level of atomic ordering and the presence of larger Al atoms, experiences significant lattice distortion, which impacts both internal stress distribution and passive film stability. While such lattice distortions can help form more robust amorphous oxide layers that potentially slow down the corrosion process, they also make the B2 phase more susceptible to localized Cl attacks, leading to micro-pitting. Additionally, the B2 phase’s relatively lower electron density makes it easier for aggressive ions to disrupt its passive film.
In contrast, the Cr-rich BCC phase has a more uniform lattice structure, which is conducive to forming stable Cr-based oxides, particularly Cr2O3, that significantly enhance the passive film’s durability and corrosion resistance. Chromium’s strong affinity for oxygen allows it to form dense and adherent oxide layers that are less prone to localized pitting than the Al-rich B2 phase. The differential behaviors of these phases are further influenced by micro-galvanic interactions between the Cr-rich BCC regions and the Al-Ni-rich B2 regions. The Cr-rich regions act as cathodic sites, while the Al-rich regions are anodic, leading to the accelerated corrosion of the B2 phase due to galvanic coupling. This effect is particularly pronounced in chloride environments, where local concentration cells can form, further enhancing the anodic dissolution of the B2 phase. These mechanisms collectively result in the preferential corrosion of the B2 phase, as Cl ions accumulate in these areas, forming interconnected micro-pits that eventually cause cracking and delamination of the coating surface, thereby exposing deeper metal layers.
As shown in Figure 19a, in acidic environments, such as 0.5 M H2SO4 solution, a different corrosion mechanism is observed, largely driven by the formation of Al and Ni complexes with (OH) and SO42− ions, which lead to the rapid dissolution of the B2 phase [47]. The B2 phase is particularly susceptible to initial attacks by H+ ions due to its lower electron density and the weaker bonding strength of its oxide film compared to the BCC phase. As corrosion progresses, the passive film on the B2 phase undergoes uniform degradation. The Cr-rich BCC phase, on the other hand, maintains greater stability due to its strong Cr-based oxides, which serve as a cathodic barrier, thus accelerating anodic dissolution of the adjacent Al-rich B2 phase. This selective corrosion mechanism highlights the vulnerability of the B2 phase, while the BCC phase acts as a more stable passive barrier that significantly contributes to the alloy’s overall corrosion resistance.
Furthermore, the electronic properties of the passive films play a critical role in determining corrosion behavior. The BCC phase forms a passive film with a p-n heterojunction structure, which effectively impedes the migration of aggressive ions, thereby creating a more stable passivation layer compared to that of the B2 phase. This semiconductor characteristic of the passive film is particularly important in acidic environments, where fewer defects and enhanced stability are necessary to prevent corrosion. The literature has consistently supported these findings, indicating that Cr-rich phases exhibit superior corrosion resistance due to their ability to form continuous and protective Cr2O3 layers, which are highly effective in blocking the penetration of aggressive ions. In summary, the differential performance between the B2 and BCC phases in both neutral and acidic environments can be attributed to differences in lattice distortion, atomic structure, and the formation of stable oxide films, which collectively influence the corrosion resistance of the FeCoNiCrAl HEA coatings.

4. Conclusions

Using laser cladding technology, FeCoNiCrAl high-entropy alloy (HEA) coatings were successfully fabricated on Q235 steel. Process parameters were optimized through a response surface methodology (RSM), yielding FeCoNiCrAl HEA coatings with robust metallurgical bonding to the substrate, low dilution rates, and excellent corrosion resistance. This study further investigates the corrosion mechanisms of these coatings in various corrosive media, with key findings summarized as follows:
  • The RSM-optimized laser cladding process produced FeCoNiCrAl HEA coatings with a multi-phase solid solution structure, primarily composed of an Al-Ni-rich disordered B2 phase and a Cr-Fe-enriched ordered BCC phase.
  • The cooling rate emerged as the critical factor affecting phase transformation and grain refinement, with laser power and scanning speed having the most substantial influence on the cooling rate. A balanced adjustment of laser power and scanning speed facilitated the formation of equiaxed grains and promoted grain refinement. Additionally, reducing specific energy density effectively mitigated elemental segregation, contributing to enhanced corrosion resistance.
  • Under conditions of 12% dilution, high laser power, high scanning speed, and low specific energy density, the S-800 HEA coating displayed a fine, uniformly distributed equiaxed grain structure with minimal elemental segregation, exhibiting optimal corrosion resistance, which may be attributed to a higher proportion of (100)-oriented planes in the coating.
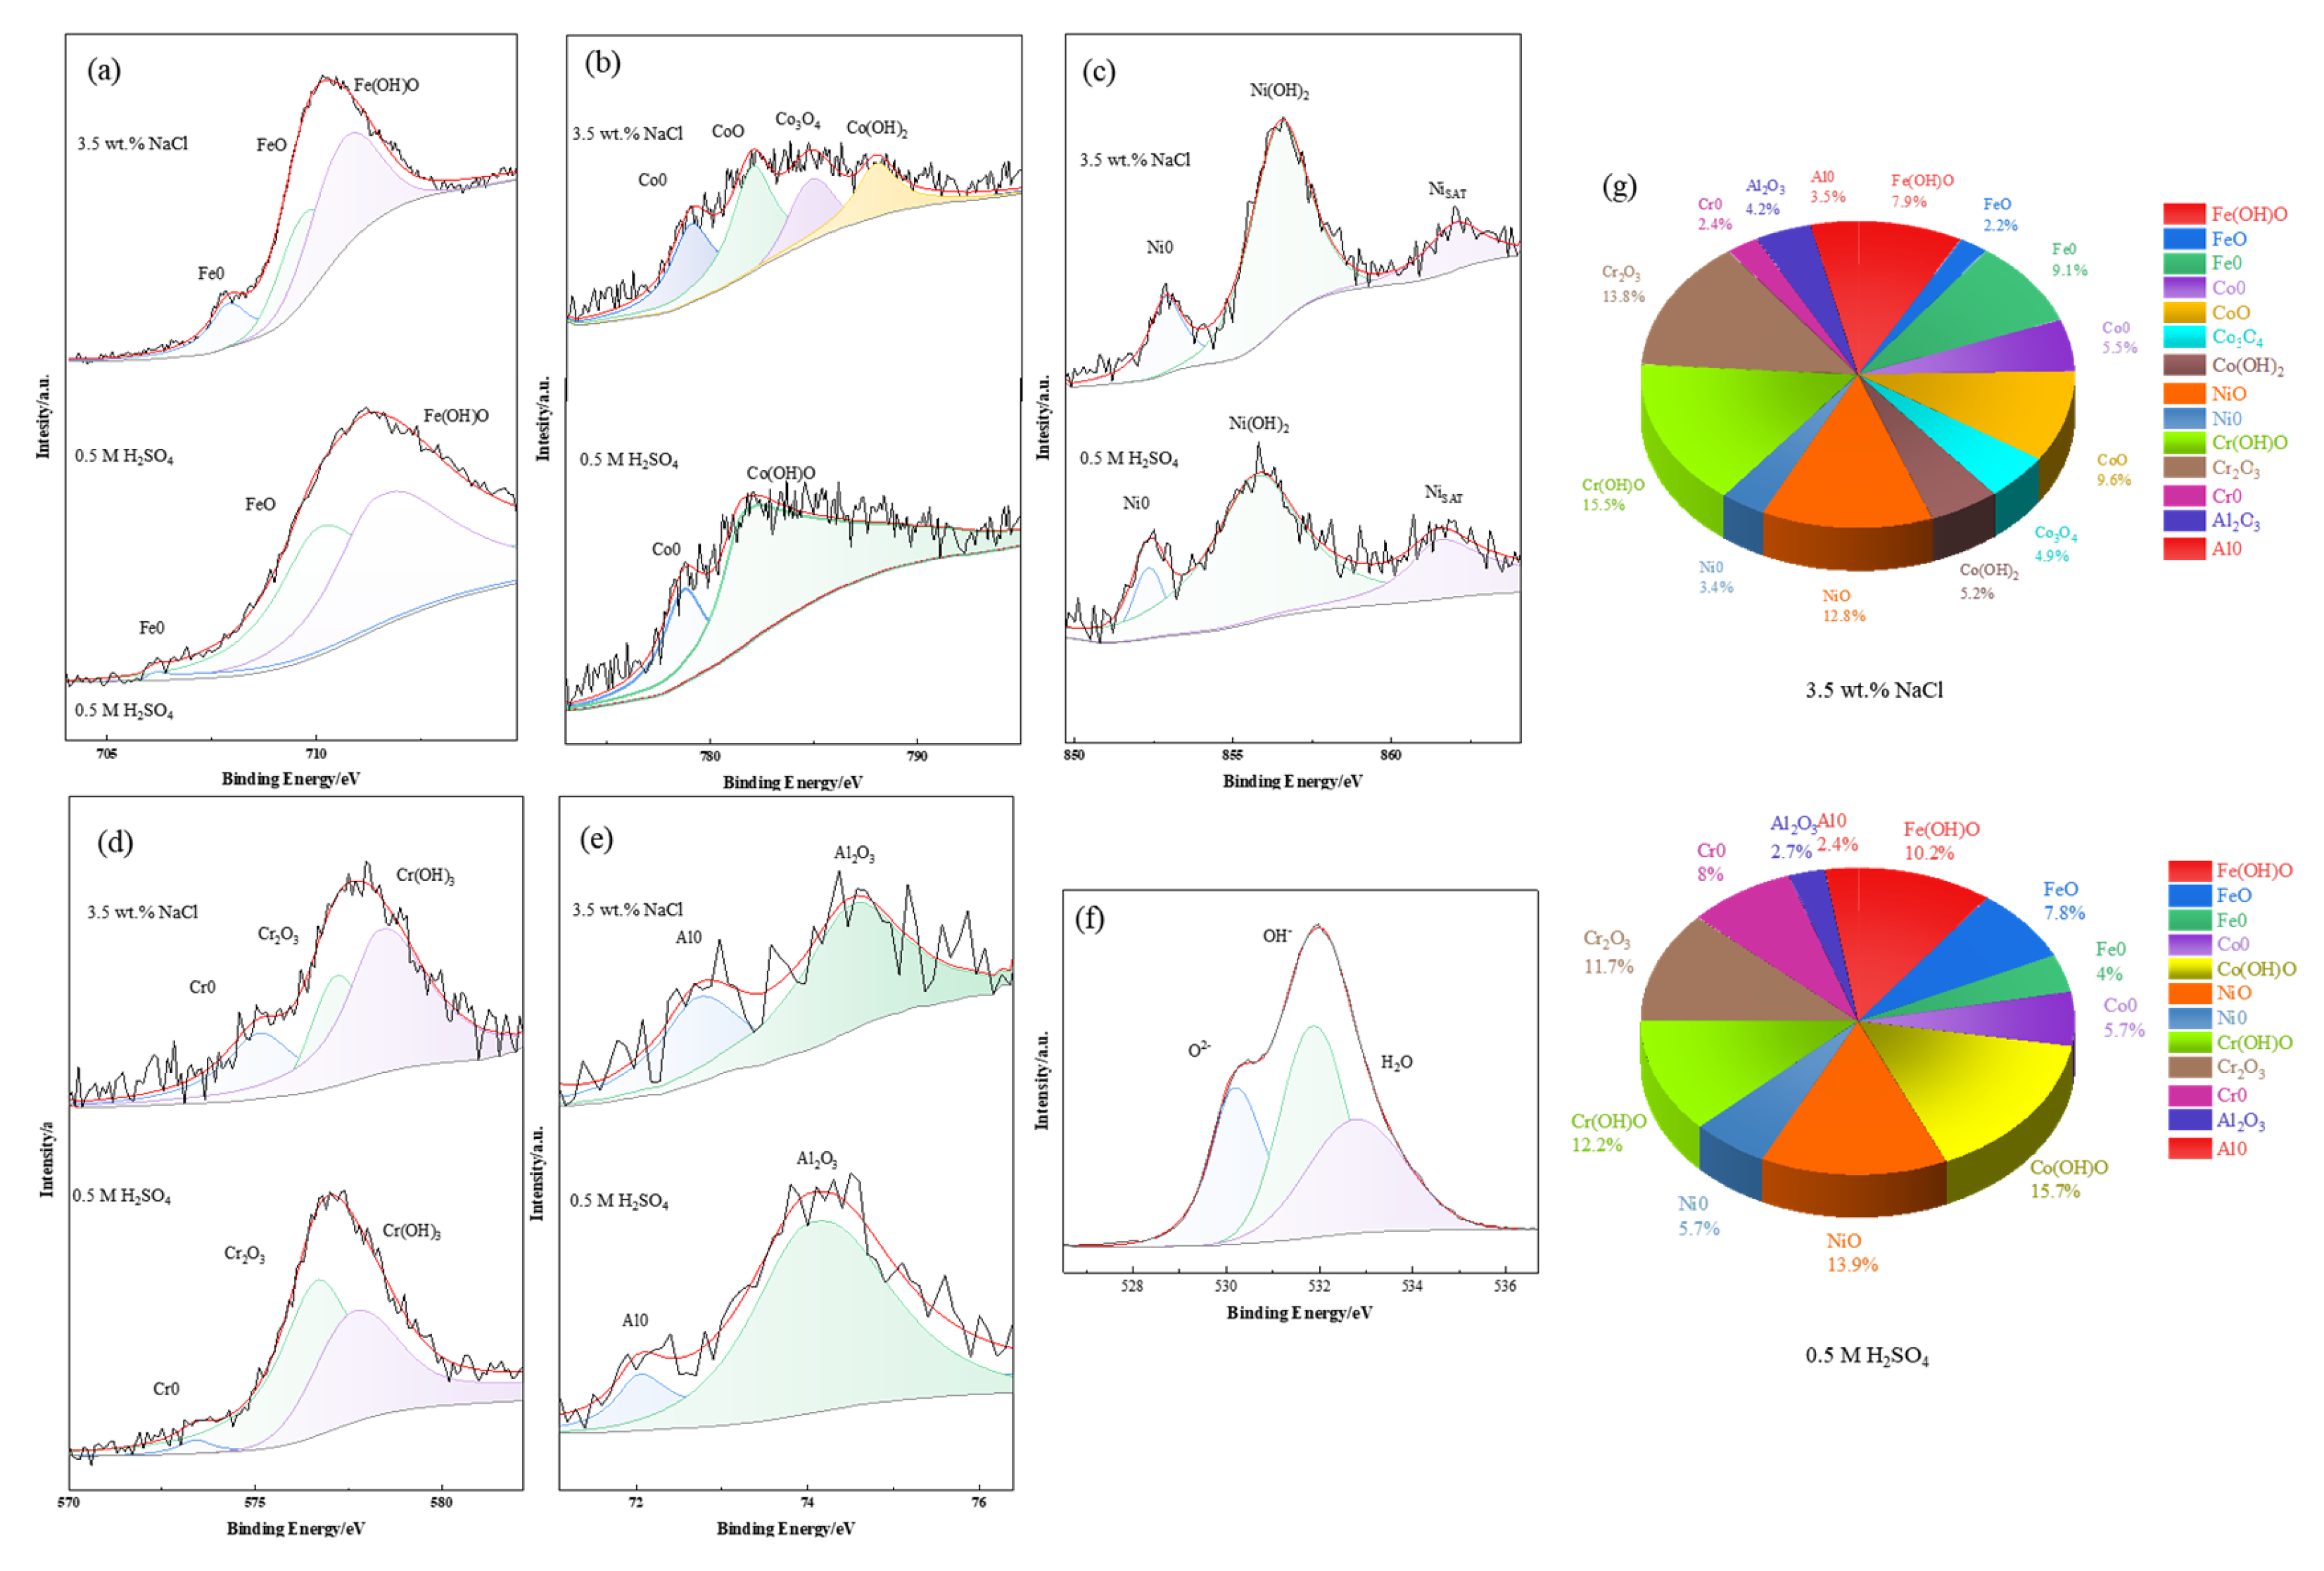
  • In neutral and acidic corrosive environments, FeCoNiCrAl HEA coatings developed a dense, stable passive film via electrochemical passivation, significantly enhancing corrosion resistance. XPS analysis revealed that the passive film primarily comprised Cr oxides and hydroxides, while the resultant p-n heterojunction semiconductor characteristics of the film effectively blocked the migration of corrosive ions, further stabilizing the passive layer. The high Cr and low Al content in the S-800 coating contributed to reduced defect and oxygen vacancy densities in the passive film, effectively inhibiting pitting and uniform corrosion in acidic environments, thus playing a pivotal role in its superior corrosion resistance.
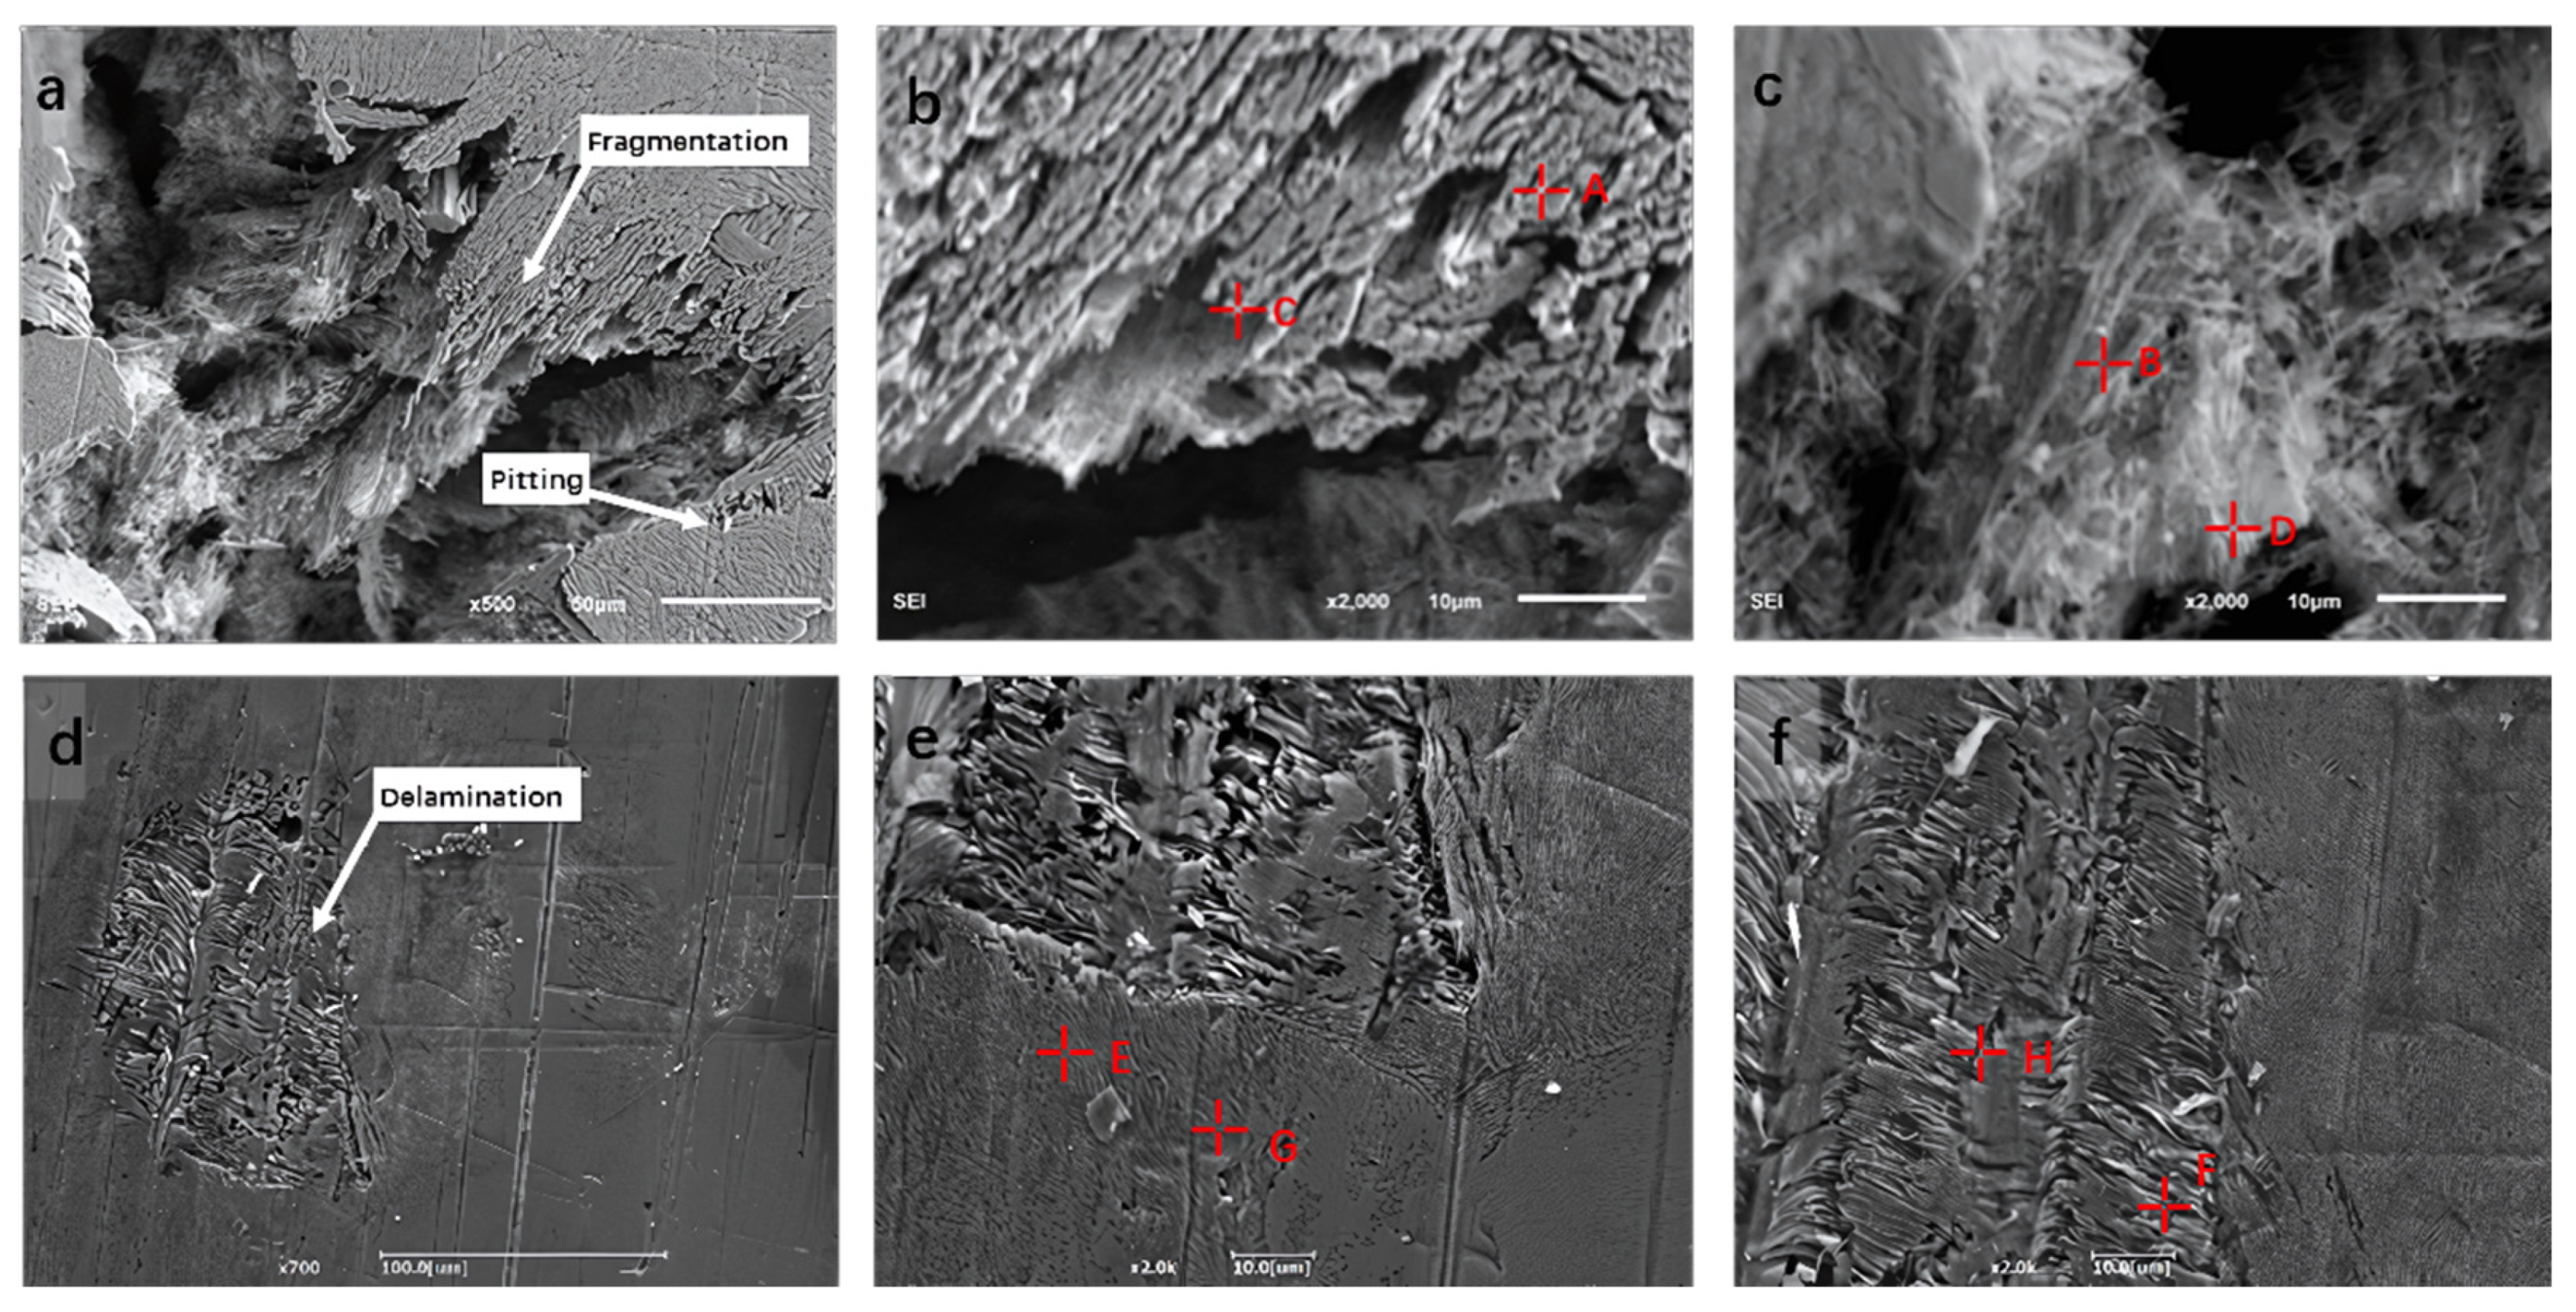
  • In immersion tests, FeCoNiCrAl HEA coatings showed selective dissolution of Al and Ni. In neutral environments, the Al-Ni-rich B2 phase was preferentially corroded due to Cl accumulation, leading to localized pitting. In acidic media, the B2 phase experienced uniform corrosion, while micro-galvanic interactions between the Cr-rich BCC and B2 phases further accelerated B2 dissolution.
These findings demonstrate that RSM-optimized laser cladding significantly enhances the microstructure and corrosion resistance of FeCoNiCrAl HEA coatings, offering a reliable strategy for high-entropy alloy coatings in corrosive environments.

Author Contributions

Conceptualization, R.C., C.Z. and H.M.; Methodology, R.C., C.Z. and J.W.; Software, J.W.; Validation, R.C. and G.Y.; Formal analysis, J.Z. and J.W.; Investigation, R.C., C.Z. and D.J.; Resources, C.Z. and X.H.; Data curation, R.C.; Writing—original draft, R.C.; Writing—review and editing, C.Z. and J.W.; Visualization, R.C. All authors have read and agreed to the published version of the manuscript.

Funding

This research received no external funding.

Data Availability Statement

The original contributions presented in this study are included in the article. Further inquiries can be directed to the corresponding author.

Conflicts of Interest

Authors Jiming Zhang and Xianjun Hu were employed by Jiangsu Province (Shagang) Iron and Steel Research Institute. The remaining authors declare that the research was conducted in the absence of any commercial or financial relationships that could be construed as a potential conflict of interest.

References

  1. Cantor, B.; Chang, I.T.H.; Knight, P.; Vincent, A.J.B. Microstructural development in equiatomic multicomponent alloys. Mater. Sci. Eng. A 2004, 375–377, 213–218. [Google Scholar] [CrossRef]
  2. Miracle, D.B.; Senkov, O.N. A critical review of high entropy alloys and related concepts. Acta Mater. 2017, 122, 448–511. [Google Scholar] [CrossRef]
  3. Yeh, J.W.; Chen, S.K.; Lin, S.J.; Gan, J.Y.; Chin, T.S.; Shun, T.T.; Tsau, C.H.; Chang, S.Y. Nanostructured high-entropy alloys with multiple principal elements: Novel alloy design concepts and outcomes. Adv. Eng. Mater. 2004, 6, 299–303. [Google Scholar] [CrossRef]
  4. Zhang, H.; Pan, Y.; He, Y.; Jiao, H. Microstructure and properties of 6FNiCoSiCrAlTi high-entropy alloy coating prepared by laser cladding. Appl. Surf. Sci. 2011, 257, 2259–2263. [Google Scholar] [CrossRef]
  5. Guo, S.; Liu, C.T. Phase stability in high entropy alloys: Formation of solid-solution phase or amorphous phase. Prog. Nat. Sci. Mater. Int. 2011, 21, 433–446. [Google Scholar] [CrossRef]
  6. Guo, S.; Ng, C.; Lu, J.; Liu, C.T. Effect of valence electron concentration on stability of fcc or bcc phase in high entropy alloys. J. Appl. Phys. 2011, 109, 103505. [Google Scholar] [CrossRef]
  7. Li, Z.; Zhao, S.; Ritchie, R.O.; Meyers, M.A. Mechanical properties of high-entropy alloys with emphasis on face-centered cubic alloys. Prog. Mater. Sci. 2019, 102, 296–345. [Google Scholar] [CrossRef]
  8. Tsai, K.-Y.; Tsai, M.-H.; Yeh, J.-W. Sluggish diffusion in Co–Cr–Fe–Mn–Ni high-entropy alloys. Acta Mater. 2013, 61, 4887–4897. [Google Scholar] [CrossRef]
  9. Ranganathan, S. Alloyed pleasures: Multimetallic cocktails. Sci. C 2003, 85, 1404–1406. [Google Scholar]
  10. Gludovatz, B.; Hohenwarter, A.; Catoor, D.; Chang, E.H.; George, E.P.; Ritchie, R.O. A fracture-resistant high-entropy alloy for cryogenic applications. Science 2014, 345, 1153–1158. [Google Scholar] [CrossRef]
  11. Dehm, G.; Bamberger, M. Laser cladding of Co-based hardfacing on Cu substrate. J. Mater. Sci. 2002, 37, 5345–5353. [Google Scholar] [CrossRef]
  12. Li, C.; Yu, Z.; Gao, J.; Zhao, J.; Han, X. Numerical simulation and experimental study of cladding Fe60 on an ASTM 1045 substrate by laser cladding. Surf. Coat. Technol. 2019, 357, 965–977. [Google Scholar] [CrossRef]
  13. Chen, T.-K.; Wong, M.-S.; Shun, T.-T.; Yeh, J.-W. Nanostructured nitride films of multi-element high-entropy alloys by reactive DC sputtering. Surf. Coat. Technol. 2005, 200, 1361–1365. [Google Scholar] [CrossRef]
  14. Meghwal, A.; Anupam, A.; Murty, B.S.; Berndt, C.C.; Kottada, R.S.; Ang, A.S.M. Thermal spray high-entropy alloy coatings: A review. J. Therm. Spray Technol. 2020, 29, 857–893. [Google Scholar] [CrossRef]
  15. Gao, M.C.; Yeh, J.-W.; Liaw, P.K.; Zhang, Y. High-Entropy Alloys; Springer: Berlin/Heidelberg, Germany, 2016. [Google Scholar]
  16. Wang, X.; Liu, S.S.; Zhao, G.L.; Zhang, M. Fabrication of in-situ TiN ceramic particle reinforced high entropy alloy composite coatings by laser cladding processing. J. ASME J. Tribol. 2022, 144, 031402. [Google Scholar] [CrossRef]
  17. Chen, X.; Ivanov, Y.F.; Gromov, V.E.; Efimov, M.O.; Konovalov, S.V.; Shlyarov, V.V.; Panchenko, I.A. High-Entropy FeCoCrNiMn and FeCoNiCrAl Alloys Coatings Structure and Properties. Izv. Altai State Univ. 2023, 4, 11–19. [Google Scholar] [CrossRef]
  18. Ren, Z.Y.; Hu, Y.L.; Tong, Y.; Cai, Z.H.; Liu, J.; Wang, H.D.; Liao, J.Z.; Xu, S.; Li, L.K. Wear-resistant NbMoTaWTi high entropy alloy coating prepared by laser cladding on TC4 titanium alloy. Tribol. Int. 2023, 182, 108366. [Google Scholar] [CrossRef]
  19. Liu, J.; Liu, H.; Chen, P.; Hao, J. Microstructural characterization and corrosion behaviour of AlCoCrFeNiTix high-entropy alloy coatings fabricated by laser cladding. Surf. Coat. Technol. 2019, 361, 63–74. [Google Scholar] [CrossRef]
  20. Kumar, S.; Mandal, A.; Das, A.K. The effect of process parameters and characterization for the laser cladding of cBN based composite clad over the Ti6Al4V alloy. Mater. Chem. Phys. 2022, 288, 126410. [Google Scholar] [CrossRef]
  21. Ma, M.Y.; Xiong, W.J.; Lian, Y.; Han, D.; Zhao, C.; Zhang, J. Modeling and optimization for laser cladding via multi-objective quantum-behaved particle swarm optimization algorithm. Surf. Coat. Technol. 2020, 381, 125129. [Google Scholar] [CrossRef]
  22. Khorram, A.; Jamaloei, A.D.; Paidar, M.; Cao, X. Laser cladding of Inconel 718 with 75Cr3C2 + 25(80Ni20Cr) powder: Statistical modeling and optimization. Surf. Coat. Technol. 2019, 378, 124933. [Google Scholar] [CrossRef]
  23. Gao, Q.; Liu, H.; Chen, P.; Liu, X.; Yang, H.; Hao, J. Multi-objective optimization for laser cladding refractory MoNbTiZr high-entropy alloy coating on Ti6Al4V. Opt. Laser Technol. 2023, 161, 109220. [Google Scholar] [CrossRef]
  24. Shrivastava, A.; Mukherjee, S.; Chakraborty, S.S. Addressing the challenges in remanufacturing by laser-based material deposition techniques. Opt. Laser Technol. 2021, 144, 107404. [Google Scholar] [CrossRef]
  25. Lou, L.-Y.; Liu, K.-C.; Jia, Y.-J.; Ji, G.; Wang, W.; Li, C.-J.; Li, C.-X. Microstructure and properties of lightweight Al0.2CrNbTiV refractory high entropy alloy coating with different dilutions deposited by high speed laser cladding. Surf. Coat. Technol. 2022, 447, 128873. [Google Scholar] [CrossRef]
  26. Chen, Z.; Ren, X.; Wang, P.; Wang, W.; Wang, Y.; Ge, C. Microstructure, corrosion resistance and high temperature oxidation properties of AlCrFeNiCu high-entropy alloy coating by high-speed laser cladding. Surf. Coat. Technol. 2024, 49, 131159. [Google Scholar] [CrossRef]
  27. Yang, S.; Lu, J.; Xing, F.; Zhang, L.; Zhong, Y. Revisit the VEC rule in high entropy alloys (HEAs) with high-throughput CALPHAD approach and its applications for material design-A case study with Al–Co–Cr–Fe–Ni system. Acta Mater. 2020, 192, 11–19. [Google Scholar] [CrossRef]
  28. Calvo-Dahlborg, M.; Brown, S.G.R. Hume-Rothery for HEA classification and self-organizing map for phases and properties prediction. J. Alloys Compd. 2017, 724, 353–364. [Google Scholar] [CrossRef]
  29. Kurz, W.; Bezençon, C.; Gäumann, M. Columnar to equiaxed transition in solidification processing. Sci. Technol. Adv. Mater. 2001, 2, 185–191. [Google Scholar] [CrossRef]
  30. Kim, Y.S.; Gokcekaya, O.; Matsugaki, A.; Ozasa, R.; Nakano, T. Laser energy-dependent processability of non-equiatomic TiNbMoTaW high-entropy alloy through in-situ alloying of elemental feedstock powders by laser powder bed fusion. Materialia 2024, 38, 102241. [Google Scholar] [CrossRef]
  31. Ren, X.; Sun, W.; Tian, S.; Zhu, C.; Qin, M.; Yang, Y.; Wu, W. Tribological and electrochemical behaviors of FeCoNiCrMox HEA coatings prepared by internal laser cladding on 316L steel tube. Mater. Charact. 2024, 211, 113906. [Google Scholar] [CrossRef]
  32. Davis, B.W.; Moran, P.J.; Natishan, P.M. Metastable pitting behavior of aluminum single crystals. Corros. Sci. 2000, 42, 2187–2192. [Google Scholar] [CrossRef]
  33. Kruger, J. Influence of Crystallographic Orientation on the Pitting of Iron in Distilled Water. J. Electrochem. Soc. 1959, 106, 736. [Google Scholar]
  34. Shahryari, A.; Szpunar, J.A.; Omanovic, S. The influence of crystallographic orientation distribution on 316LVM stainless steel pitting behavior. Corros. Sci. 2009, 51, 677–682. [Google Scholar] [CrossRef]
  35. Hasannaeimi, V.; Mukherjee, S. Galvanic corrosion in a eutectic high entropy alloy. J. Electroanal. Chem. 2019, 848, 113331. [Google Scholar] [CrossRef]
  36. Escriva-Cerdan, C.; Blasco-Tamarit, E.; Garcia-Garcia, D.M.; Garcia-Anton, J.; Akid, R.; Walton, J. Effect of temperature on passive film formation of UNS N08031 Cr-Ni alloy in phosphoric acid contaminated with different aggressive anions. Electrochim. Acta 2013, 111, 552–561. [Google Scholar] [CrossRef]
  37. Fernandez-Domene, R.M.; Blasco-Tamarit, E.; Garcia-Garcia, D.M.; Garcia-Anton, J. Repassivation of the damage generated by cavitation on UNS N08031 in a LiBr solution by means of electrochemical techniques and Confocal Laser Scanning Microscopy. Corros. Sci. 2010, 52, 3453–3464. [Google Scholar] [CrossRef]
  38. Luo, H.; Li, Z.; Mingers, A.M.; Raabe, D. Corrosion behavior of an equiatomic CoCrFeMnNi high-entropy alloy compared with 304 stainless steel in sulfuric acid solution. Corros. Sci. 2018, 134, 131–139. [Google Scholar] [CrossRef]
  39. Hashimoto, K.; Asami, K.; Teramoto, K. An X-ray photo-electron spectroscopic study on the role of molybdenum in increasing the corrosion resistance of ferritic stainless steels in HC1. Corros. Sci. 1979, 19, 3–14. [Google Scholar] [CrossRef]
  40. Bommersbach, P.; Alemany-Dumont, C.; Millet, J.P.; Normand, B. Formation and behaviour study of an environment-friendly corrosion inhibitor by electrochemical methods. Electrochim. Acta 2005, 51, 1076–1084. [Google Scholar] [CrossRef]
  41. Ningshen, S.; Mudali, U.K.; Amarendra, G.; Gopalan, P.; Dayal, R.K.; Khatak, H.S. Hydrogen effects on the passive film formation and pitting susceptibility of nitrogen containing type 316L stainless steels. Corros. Sci. 2006, 48, 1106–1121. [Google Scholar] [CrossRef]
  42. Zhang, Z.-C.; Lan, A.-D.; Zhang, M.; Qiao, J.-W. Effect of Ce on the pitting corrosion resistance of non-equiatomic high-entropy alloy Fe40Mn20Cr20Ni20 in 3.5wt% NaCl solution. J. Alloys Compd. 2022, 909, 164641. [Google Scholar] [CrossRef]
  43. Maurice, V.; Yang, W.P.; Marcus, P. X-ray photoelectron spectroscopy and scanning tunneling microscopy study of passive films formed on (100) Fe-18Cr-13Ni single-crystal surfaces. J. Electrochem. Soc. 1998, 145, 909–920. [Google Scholar] [CrossRef]
  44. Yang, W.P.; Costa, D.; Marcus, P. Resistance to pitting and chemical-composition of passive films of a FE-17-PERCENT-CR alloy in chloride-containing acid-solution. J. Electrochem. Soc. 1994, 141, 2669–2676. [Google Scholar] [CrossRef]
  45. Zinola, C.F.; Luna, A.M.C. The inhibition of Ni corrosion in H2SO4 solutions containing simple non-saturated substances. Corros. Sci. 1995, 37, 1919–1929. [Google Scholar] [CrossRef]
  46. Szklarska-Smialowska, Z. Pitting corrosion of aluminum. Corros. Sci. 1999, 41, 1743–1767. [Google Scholar] [CrossRef]
  47. Kao, Y.-F.; Lee, T.-D.; Chen, S.-K.; Chang, Y.-S. Electrochemical passive properties of AlxCoCrFeNi (x = 0, 0.25, 0.50, 1.00) alloys in sulfuric acids. Corros. Sci. 2010, 52, 1026–1034. [Google Scholar] [CrossRef]
Figure 1. (a) SEM image of FeCoNiCrAl powder; (b) powder particle size distribution map; (c) the experimental process with LC processing of FeCoNiCrAl HEA.
Metals 15 00406 g001
Figure 2. Cross-section of single-pass cladding layer.
Metals 15 00406 g002
Figure 3. The relationship between normal probability distribution and internalized T residuals.
Metals 15 00406 g003
Figure 4. Perturbation diagram of laser process parameters with respect to dilution rate (A: laser power; B: scanning speed; C: defocus amount).
Metals 15 00406 g004
Figure 5. XRD diffraction.
Metals 15 00406 g005
Figure 6. EBSD analysis of the coatings: (a1d1) phase image, IPF maps, IPFs and PF of S-600; (a2d2) phase image, IPF maps, IPFs and PF of S-700; (a3d3) phase image, IPF maps, IPFs and PF of S-800.
Metals 15 00406 g006
Figure 7. Cross-sectional microstructure of the coating: (a) midsection of the coating; (b) top section of the coating.
Metals 15 00406 g007
Figure 8. Microstructure and morphology of coating surface.
Metals 15 00406 g008
Figure 9. Cross-sectional morphology of coatings prepared by different schemes: (a) S-600, (b) S-700, (c) S-800. The coatings are divided into three distinct regions: top layer (A), middle layer (B), and bottom layer (C).
Metals 15 00406 g009
Figure 10. Corrosion resistance of S-600, S-700, and S-800 HEA coatings in 3.5 wt.% NaCl solutions (a) and in 0.5 M H2SO4 solutions (b).
Metals 15 00406 g010
Figure 11. Inverse pole figure (IPF) mapping of grains in different orientations of S-600, S-700, and S-800 HEA coatings.
Metals 15 00406 g011
Figure 12. Current–time curves of S-600, S-700, and S-800 HEA coatings in 3.5 wt.% NaCl solutions (a) and in 0.5 M H2SO4 solutions (b) at 0 V vs. SCE.
Metals 15 00406 g012
Figure 13. logi–logT curves of S-600, S-700, and S-800 HEA coatings in different solutions and linear fitted line: (a) 3.5 wt.% NaCl solutions; (b) 0.5 M H2SO4 solutions.
Metals 15 00406 g013
Figure 14. XPS test results of passivation film composition of FeCoNiCrAl HEA coatings in different environments: (a) Fe2p3/2, (b) Co2p3/2, (c) Ni2p3/2, (d) Cr2p3/2, (e) Al2p, (f) O1s. (g) The atomic ratio of each metal element in the passivation film formed by FeCoNiCrAl HEA coatings in 3.5 wt.% NaCl solution and 0.5 M H2SO4 solution.
Metals 15 00406 g014
Figure 15. Nyquist and Bode plots of FeCoNiCrAl HEA coatings in 3.5 % NaCl solution (a,c) and 0.5 M H2SO4 solution (b,d).
Metals 15 00406 g015
Figure 16. Equivalent circuit diagram.
Metals 15 00406 g016
Figure 17. (a) Mott–Schottky curve of FeCoNiCrAl HEA coating in 3.5 wt.% NaCl solution; (b) Mott–Schottky curve of FeCoNiCrAl HEA coating in 0.5 mol/L H2SO4 solution.
Metals 15 00406 g017
Figure 18. (ac) Surface morphology of S-800 HEA coating after 15 days of immersion in 3.5 wt.% NaCl solution; (df) surface morphology of S-800 HEA coating after 15 days of immersion in 0.5 M H2SO4 solution.
Metals 15 00406 g018
Figure 19. A schematic diagram of the corrosion processes of FeCoNiCrAl HEA coatings in 3.5 wt.% NaCl solution (a) and 0.5 M H2SO4 solution (b) at room temperature.
Metals 15 00406 g019
Table 1. Response surface experimental design.
FactorLevel
−101
Laser Power/W600700800
Scanning Speed/(mm/min)200350500
Defocus Amount/mm−15−12.5−10
Laser Spot Diameter (mm)54.54
Table 2. Laser process parameter design and results.
SchemeProcess VariableOptimization Object
Laser Power
P (W)
Scanning Speed V (mm/min)Defocus Amount
D (mm)
Laser Spot
Diameter (mm)
Dilution Rate
μ (%)
1800350−10420
2650350−12.54.514
3650350−12.54.513
4650350−12.54.514
5500500−12.54.510
6650200−10418
7650200−10411
8650500−10414
9800350−15512
10800200−12.54.515
11650500−1559
12650350−12.54.514
13500350−10416
14800500−12.54.513
15650350−12.54.514
16500350−1558
17500200−12.54.512
Table 3. Variance analysis of the effect of laser process parameters on dilution rate.
Sum of SquaresdfRoot Mean SquareF-Valuep-Value
Model140.49435.1278.21<0.0001Significant
p22.50124.5054.56<0.0001
v13.50112.5027.840.0002
d97.00198.00218.23<0.0001
V25.4915.4912.230.0044
Residual5.39120.45
Lack of fit4.5980.57 Not significant
Pure error0.8040.202.87
Total145.8816
Std. dev.0.67 R20.9631
Mean13.35 Adjusted R20.9445
C.V.%5.02 PredictedR20.9067
Press12.57
Table 4. Laser process plan with coating dilution rate of 12%.
Laser Power (w)Scanning Speed (mm/min)Defocus Amount (mm)Laser Spot Diameter (mm)K (J/mm2)
Scheme 1600250−10436
Scheme 2700400−134.622.82
Scheme 3800450−15521.33
Table 5. EDS analysis of coating cross-section.
AreaFeCoNiCrAl
S-600A34.1313.5317.7719.4215.15
B36.4116.2513.816.815.74
C38.2315.6217.8217.7110.62
S-700A32.5318.1619.3416.7613.21
B33.7214.0112.7423.0816.45
C34.6116.2313.224.8311.13
S-800A25.3117.5118.8420.6217.72
B30.5115.3517.4320.0116.7
C31.212.1415.7419.5621.36
Table 6. Electrochemical parameters of S-600, S-700, and S-800 HEA coatings from the polarization curves.
3.5 wt.% NaCl0.5mol·L−1 H2SO4
S-600S-700S-800S-600S-700S-800
Ecorr (mV)−476−360−242−373−335−319
icorr (A·cm−2)2.45 × 10−65.2 × 10−71.78 × 10−73.02 × 10−52.84 × 10−51.07 × 10−5
Epp (mV)///−252.5−236.5−203
Ipp (A·cm−2)///6.07 × 10−41.83 × 10−48.89 × 10⁻⁵
Eb (mV)154.37109101913.75951939
E (mV)70.8871.1574.12792.75811837.75
Table 7. Grain statistics of S-600, S-700, and S-800 HEA coatings with (100), (101), and (111) orientations.
S-600S-700S-800
1003.88%3.44%5.31%
1017.76%14.11%14.11%
11111.91%8.62%6.39%
Table 8. Equivalent circuit fitting results for the passive films of S-600, S-700, and S-800 HEA coatings.
SolutionSampleRs (Ω·cm2)CPE1R1 (Ω·cm2)CPE2R2 (Ω·cm2)Δ (nm)
Y1−1·cm−2·Sn)n1Y2−1·cm−2·Sn)n2
3.5 wt.% NaClS-6002.381.26 × 10−40.8864.82 × 1043.44 × 10−40.7821.41 × 10410.962
S-7001.011.02 × 10−30.8855.27 × 1042.41 × 10−20.6081.57 × 1041.354
S-80014.33.44 × 10−50.7837.4 × 1056.13 × 10−50.7824.86 × 10340.151
0.5 M H2SO4S-6003.231.28 × 10−40.8791.43 × 1031.04 × 10−40.581.7410.79
S-7003.121.83 × 10−40.7611.54 × 1031.39 × 10−40.78533.37.547
S-8004.861.57 × 10−40.7851.44 × 1042.45 × 10−40.7828118.797
Table 9. Donor densities in passive films of S-600, S-700, S-800 FeCoNiCrAl HEA coating.
3.5 w.t% NaCl0.5 M H2SO4
ND (cm−3)S-600S-700S-800S-600S-700S-800
3.321 × 10232.223 × 10231.937 × 10239.221 × 10221.001 × 10224.967 × 1021
Table 10. EDS analysis of the surface of samples.
AreaAl (wt%)Co (wt%)Cr (wt%)Fe (wt%)Ni (wt%)O (wt%)
3.5 wt.% NaClA17.3111.3328.0720.6512.0910.55
B12.3113.9427.2115.988.9721.59
C15.5714.4528.0817.2814.4210.22
D11.5312.3227.3813.7910.4124.57
0.5 M H2SO4E8.6122.8426.620.9822.6818.29
F1.1616.8725.7617.638.3730.21
G5.9120.4925.3820.9418.748.54
H0.9815.9423.9518.4214.4336.29
Disclaimer/Publisher’s Note: The statements, opinions and data contained in all publications are solely those of the individual author(s) and contributor(s) and not of MDPI and/or the editor(s). MDPI and/or the editor(s) disclaim responsibility for any injury to people or property resulting from any ideas, methods, instructions or products referred to in the content.

