Article

Effect of Heat Treatment on Microstructure and Residual Stress of a Nickel-Cobalt-Based Superalloy Produced by Laser Powder Bed Fusion

1
Department of Nuclear Physics, China Institute of Atomic Energy, Beijing 102400, China
2
Beijing Key Laboratory of High-Temperature Alloy New Materials, Beijing Gaona Materials and Technology Co., Ltd., Central Iron and Steel Research Institute, Beijing 100081, China
*
Author to whom correspondence should be addressed.
These authors contributed equally to this work.
Metals 2025, 15(4), 405; https://doi.org/10.3390/met15040405
Submission received: 30 January 2025 / Revised: 6 March 2025 / Accepted: 17 March 2025 / Published: 4 April 2025

Abstract

:
This study comprehensively evaluates a non-weldable nickel-cobalt-based superalloy fabricated using laser powder bed fusion (LPBF) technology. The investigation systematically examined the impact of heat treatment, specifically solution treatment and solution treatment followed by aging treatment, on the microstructural characteristics and the evolution of residual stress within the alloy. The findings indicated that the as-built Ni-Co-based superalloy predominantly consists of equiaxed crystals and epitaxial columnar crystals, with no formation of the γ′ phase observed. After the solution treatment, the alloy experienced equiaxed columnar crystallization, recrystallization, and grain refinement. Additionally, a significant quantity of γ′ phases within the alloy exhibited a specific arrangement and precipitation. Following the aging treatment, there was an observed increase in the average dimensions of both the γ′ phase and the grains within the alloy. The evolution of residual stress distribution perpendicular to the construction direction in the alloy, both before and following heat treatment, was assessed using the contour method. The results showed that heat treatment progressively diminished the residual stress levels within the alloy. Furthermore, this study discusses the interrelationship between residual stress and the microstructural evolutions of nickel-cobalt-based superalloys throughout the heat treatment process.

1. Introduction

Ni-based superalloys are utilized extensively in the aerospace and nuclear industries, as well as in high-end civil equipment, due to their outstanding high-temperature mechanical properties, oxidation resistance, and microstructural stability [1,2,3,4]. However, the practical application of Ni-based superalloys frequently necessitates their design for diverse purposes, incorporating intricate and sophisticated structures, which is undoubtedly an insurmountable challenge for conventional manufacturing techniques such as forging, casting, and welding. Additive manufacturing (AM), also known as 3D printing, is an advanced manufacturing technique based on the layer-by-layer stacking of materials to construct components [5,6]. This technique makes up for the shortcomings of conventional manufacturing processes and enables the integrated formation of complicated components. AM also enables the consolidation of multiple assembled components into a single entity, thereby facilitating component integration. This integrated capability offers numerous advantages, including a reduction in overall weight, manufacturing time, processing steps, cost, and complexity. Due to these advantages, AM technology, as an emerging manufacturing process, completely overturns the traditional Ni-based superalloy manufacturing process and design practice, thereby promoting innovation in its engineering applications.
At present, nearly all metal AM processes are capable of fabricating Ni-based superalloys. However, in comparison to other AM technologies, laser powder bed fusion (LPBF) is particularly well-suited for the fabrication of highly dense components with high-resolution features, intricate internal structures, and a relatively smooth surface finish. Consequently, LPBF is regarded as a prospective technique for the fabrication of Ni-based superalloy components; a substantial number of investigations have therefore been conducted on the technique, such as IN718 [7,8], Hastelloy-X [9], and IN625 [10]. As with welding, the fabrication of components through fusion-based LPBF involves complex melt flow with extreme thermal history, and the layer-by-layer iterative scanning method can affect the bonding between the subsequent layers or tracks. Hence, the machinability of Ni-based superalloys using LPBF can be assessed by their weldability. Generally, when the total content of Al and Ti in Ni-based superalloys exceeds 4.0 wt.%, the alloy is considered non-weldable and has a high tendency to crack during LPBF fabrication [11]. Recently, substantial research has aimed at improving the feasibility of alloy LPBF fabrication by optimizing LPBF parameters [12,13] and scanning strategies [14,15]. However, non-weldable nickel-based superalloys require precise control of LPBF parameters (e.g., scanning speed and laser power) during the LPBF process to regulate heat input and prevent cracking, which constrains the potential for optimizing alloy microstructure and properties through LPBF parameter adjustments. Although Liu et al. [16] mitigated cracking issues in non-weldable nickel-based superalloys during laser metal deposition (LMD) through substrate preheating, this approach remained insufficient to effectively reduce the high residual stress levels within the alloy. Consequently, post-treatment processes (heat treatment, hot isostatic pressing, etc.) are essential for optimizing the structure and properties of LPBF non-weldable Ni-based superalloys [17]. On the other hand, the inhomogeneous cooling rates and substantial thermal gradients that accompany repeated rapid heating and cooling during LPBF typically result in the formation of high levels of residual stress and distinctive microstructures in the materials being fabricated. Therefore, post-heat treatment is usually necessary to homogenize the structure and relieve the residual stress, ensuring the desired microstructural and mechanical properties.
The material utilized in this study is a new non-weldable nickel-cobalt-based superalloy (Al + Ti > 4.0 wt.%), in which a substantial quantity of the Co element has been incorporated to enhance the solid solution strengthening capacity and process performance of the alloy. The residual stress and microstructure of the LPBF Ni-Co-based superalloy were optimized through the implementation of a heat treatment process, comprising both a solution treatment and an aging treatment. The effects of heat treatment on residual stress and microstructure were analyzed using the contour method in conjunction with microstructural characterization techniques. Additionally, the parallel and perpendicular organizational structures to the construction direction were characterized and examined.

2. Materials and Methods
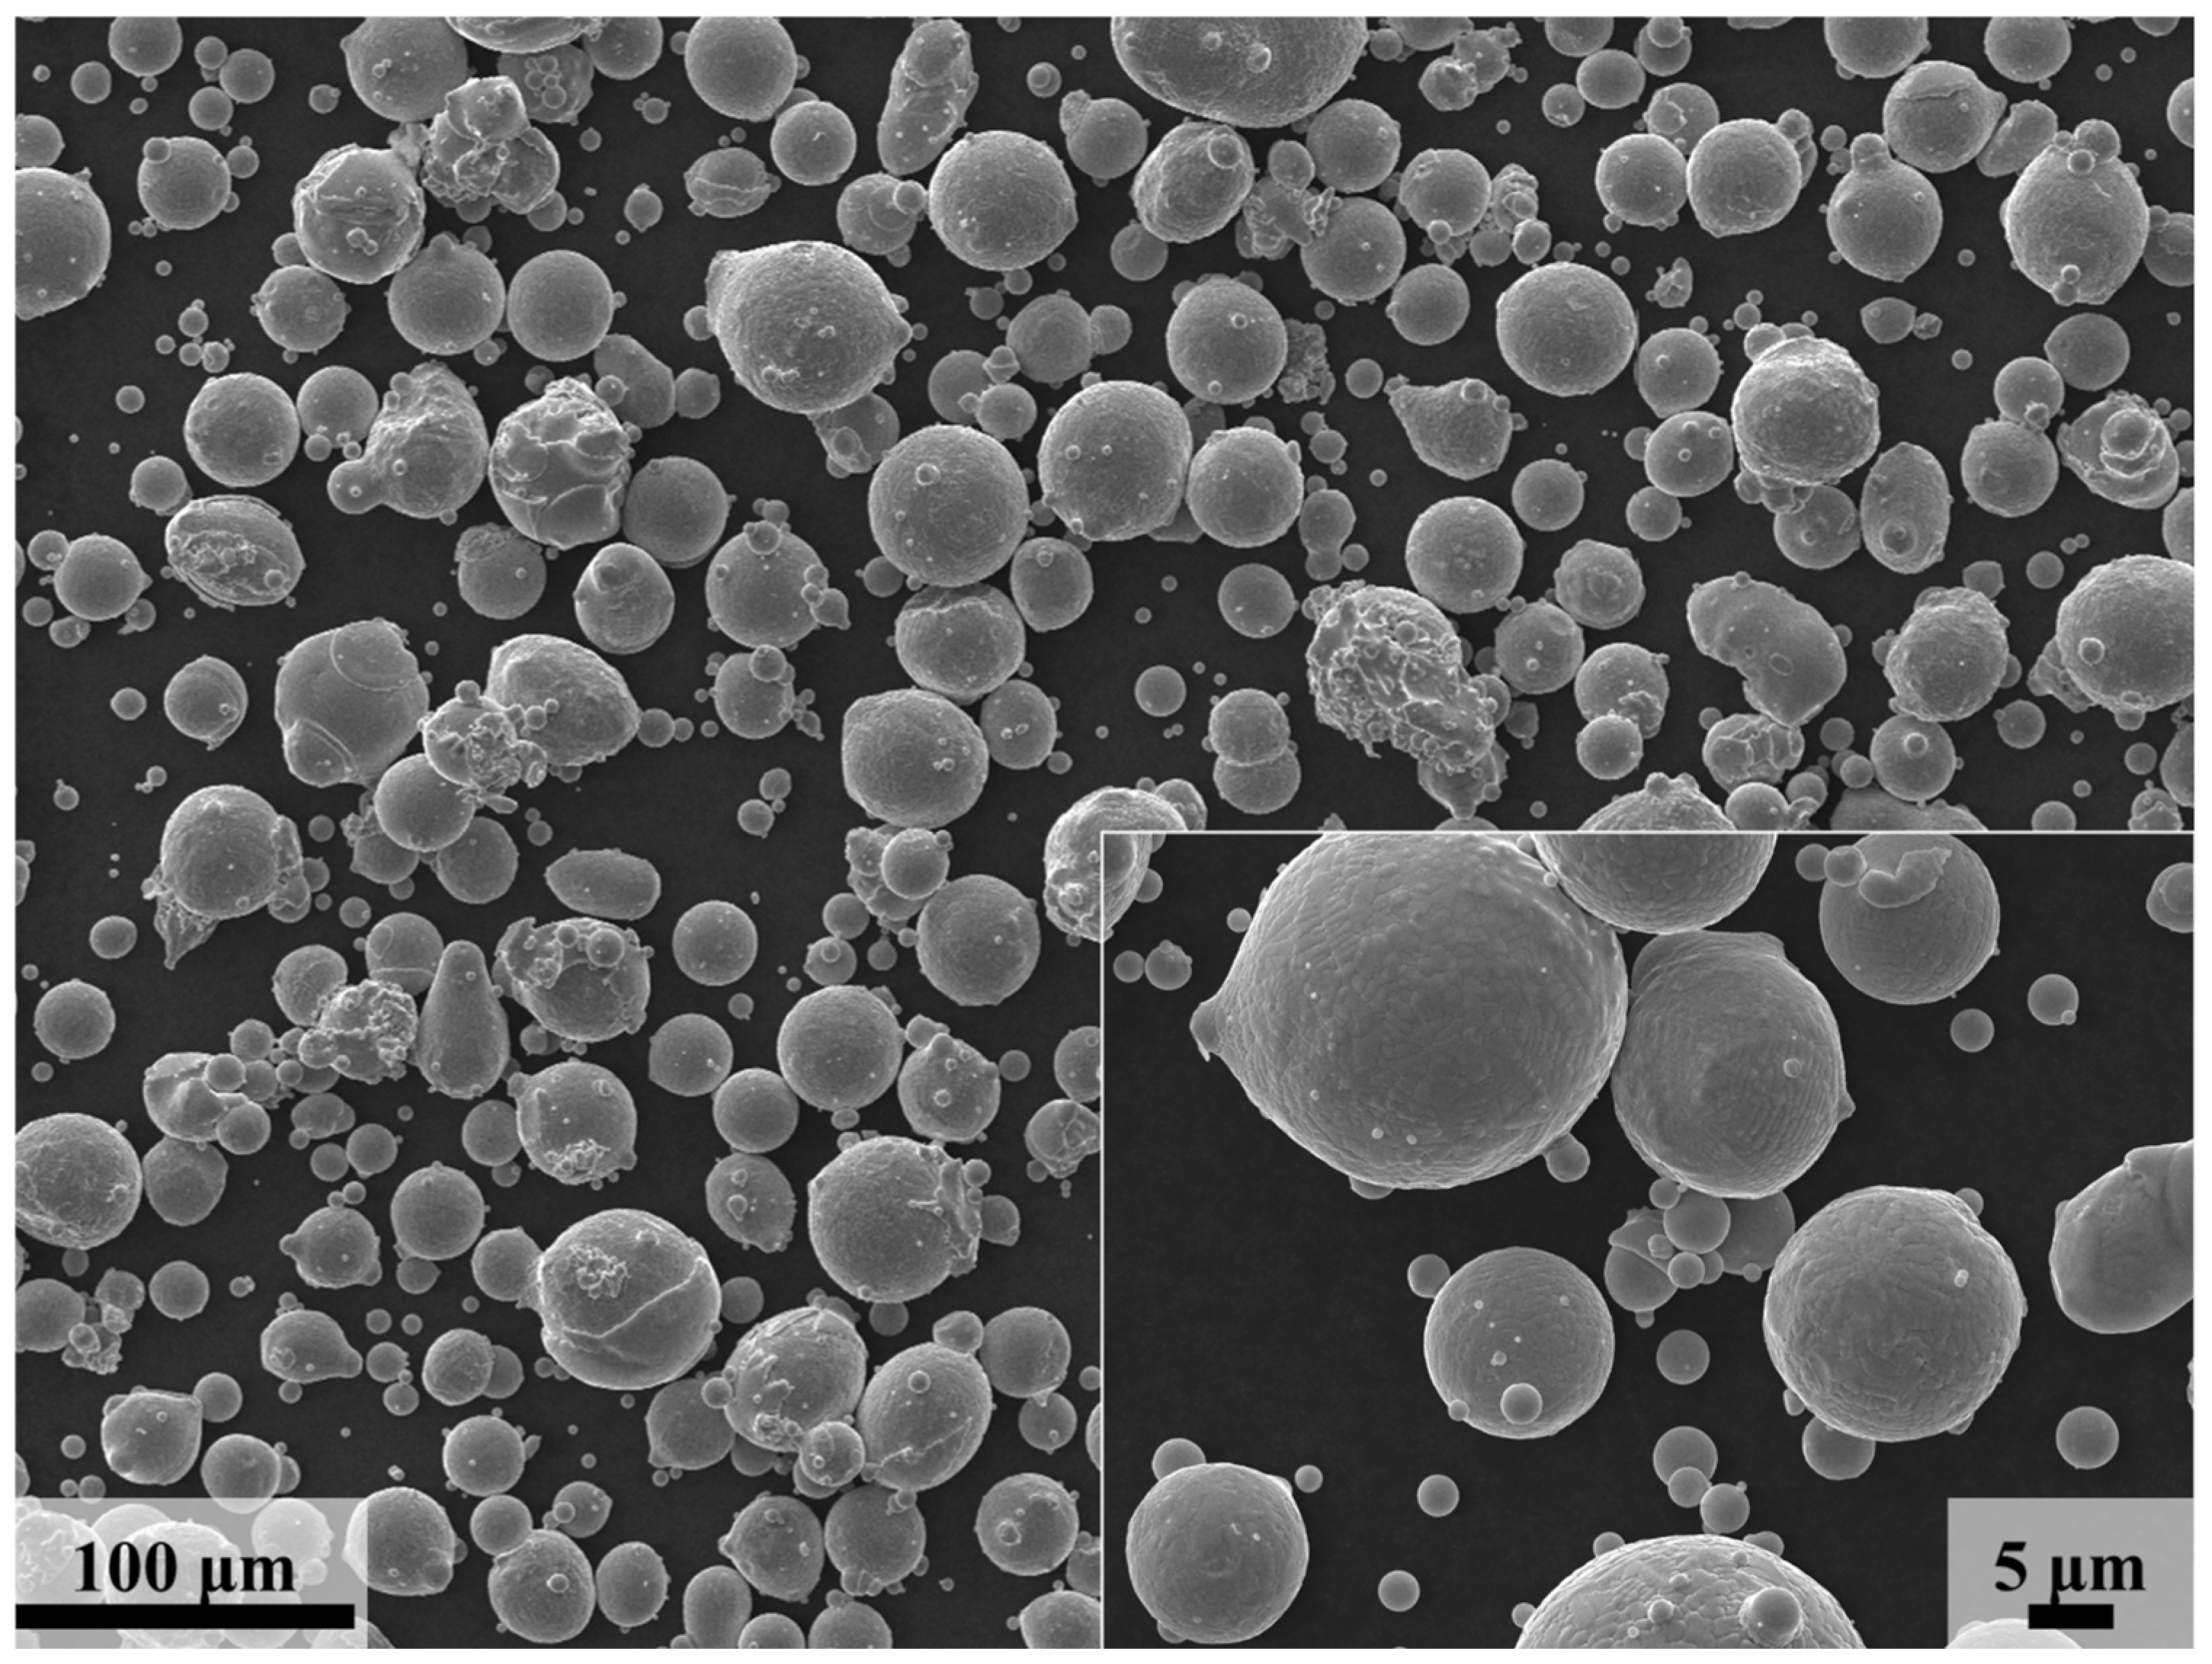
2.1. Materials

The material investigated is a non-weldable Ni-Co-based superalloy, and the nominal composition of the pre-alloyed powder is detailed in Table 1. A micrograph of the powder is shown in Figure 1, and the average powder particle diameter was measured to be 38.95 ± 1.12 μm. The Ni-Co-based superalloy was constructed on a 316 stainless steel substrate preheated to 200 °C in advance. The laser power (P) was 200 W during the printing process, while the scanning speed and layer thickness were 1100 mm/s and 0.03 mm, respectively. The laser scanning strategy adopts strip scanning for high density and low crystallographic texture, while the laser scanning spacing is 0.08 mm with a 67° rotation of the stripe pattern between two adjacent layers to reduce the residual stresses in the printed part. The size of the Ni-Co-based superalloys constructed is 70 × 17 × 70 mm3 (x-y-z; z is the build direction (BD)) (Figure 2a).
Different heat treatment processes were carried out on the as-built Ni-Co-based superalloy to reduce the internal residual stress of the alloy, and three different states of the alloy were obtained. According to the sample state and treatment type, the samples in the three states are recorded as as-built (AB), solution treatment (ST), and solution treatment followed by aging treatment (ST + AT), respectively. The different treatments applied to the specimens are detailed in Table 2. A standard solution treatment was conducted at a temperature of 1070 °C for a duration of 4 h, followed by air cooling. Subsequently, an aging treatment was performed at 760 °C for 16 h, also followed by air cooling.

2.2. Measurements of Residual Stresses

Two-dimensional full-image residual stress measurements were conducted on the AB, ST, and ST + AT LPBF Ni-Co-based superalloy specimens, respectively, employing the contour method (CM). The contour method is a destructive residual stress testing method initially proposed by Prime [18], which is based on Bueckner’s principle of elastic superposition [19]. CM is founded upon the cutting of the sample to facilitate the redistribution of residual stress and deformation within the cutting surface. Subsequently, the normal residual stress distribution of the cutting surface is determined through the measurement of the surface morphology of the cut surface, which is utilized as the boundary condition of the linear elastic model. The fundamental assumption of CM is that the deformation morphology of the cutting surface is a consequence of the purely elastic release of residual stress and that the cutting process will not result in the generation of additional stress.
In this investigation, CM was used to evaluate the vertical distribution of internal stress at x = 35 mm in the yoz mid-plane of the specimen (Figure 2b), denoted as σ A x , y , z (Figure 3a). The cutting of the specimens is critical to the residual stress measurement results. Therefore, the specimens were cut using low-speed wire cut electrical discharge machining (WEDM-LS), as this non-contact technique results in negligible residual stresses due to material removal by spark erosion. All samples were cut using a Sodick SN400A machine (Tokyo, Japan) with a 200 μm diameter brass wire as the electrode wire, with a cutting speed of 0.025 mm/s. The entire processing procedure was conducted in a deionized water bath to accelerate the temperature reduction at the cutting site, thereby minimizing the error resulting from the thermal deformation of the samples. Furthermore, to ensure that the assumption of plane cutting is met, the fixture is employed to symmetrically clamp both sides of the sample throughout the cutting process while avoiding the introduction of clamping stress. The cutting surface is shown in Figure 4a.
The surface deformation of the samples following the cutting process is measured using the Hexagon GLOBAL S (Stockholm, Sweden) coordinate measuring machine (CMM) with a scanning speed of 3 mm/s (Figure 4b), and the stress state is subsequently noted as σ B x , y , z (Figure 3b). The manufacturer of the CMM reports a measurement accuracy of (1.7 + L/1000) μm, where L represents the measurement span. The measurement accuracy for this specimen is approximately 1.715 to 1.77 μm, which fulfills the requisite test accuracy standards. The measurements were conducted in a temperature-controlled metrology laboratory, with an air temperature of approximately 21 °C to minimize the effect of temperature on the measurement accuracy. The mean distance between adjacent test points in the y-direction (y = 17.0 mm) is 0.5 mm, while the mean distance between neighboring test points in the z-direction (z = 70.0 mm) is 0.25 mm. Thus, approximately 9520 data points are obtained on each surface. The Bueckner superposition principle is based on the assumption that the behavior of a material undergoing residual stress relaxation can be described by linear elasticity. Consequently, it is essential to apply a load in the opposite direction of the deformation ( σ C ( x , y , z ) ) that superimposes the deformed surface measured after WEDM-LS cut back to its original planar state (Figure 3c). Accordingly, the residual stress distribution of the original specimen can be expressed by the following formula:
σ A x , y , z = σ B x , y , z + σ C ( x , y , z )
Upon cutting the specimen along the cutting surface, the stress release causes deformation of the cutting surface. As a result, both the displacement boundary condition and the stress boundary condition on the cutting surface are equal to zero, leading to the conclusion that σ B x , y , z = 0 . Furthermore, as the measurement of the surface deformation is constrained to the direction perpendicular to the cutting surface (x-direction), the underlying assumptions and approximations are made, and the formulation of Equation (1) is simplified as follows:
σ x A ( x , y , z ) = σ x C ( x , y , z )
The measured discrete data points on the specimen cut surface were filtered to eliminate the noise of the CMM inspection process. To eliminate the influence of antisymmetric errors on the calculations of residual normal stress, the contour data from the two test surfaces for each sample were averaged. For the contour data after the averaging process, it is necessary to perform smoothing to eliminate the background noise error. In this paper, the binary quartic polynomial fitting is used for data smoothing. It is known that the coordinates of a point P i x i , y i , z i on the contour satisfy the surface equation:
x i = f y i , z i
A binary quartic polynomial function F y i ^ , z i ^ is constructed to approximate the surface equation f y i , z i by fitting, and Equation (4) is obtained.
x i ^ = F y i ^ , z i ^ = m = 1 5 n = 1 5 a m n y i ^ m 1 z i ^ n 1
After the smoothing process, the coordinates of point P i x i , y i , z i are P i ^ x i ^ , y i ^ , z i ^ .
The finite element model of the material was constructed using ABAQUS software (v2021) [20], and the Young’s modulus (E = 210 GPa) and the Poisson’s ratio (ν = 0.30) of the material were assigned [21]. The mesh type was selected to be a second-order approximate integral hexahedral cell (C3D8R), which was used to calculate the residual stress distribution in the specimen. The initial contour of the three-dimensional geometric model was defined by the end face and, subsequently, the inverse fitting contour was employed as the displacement boundary condition. Subsequently, the displacement in the x and y directions was constrained at the two intersection points of the end face and the outer wall of the three-dimensional geometric model. The rotational degree of freedom in the z direction of the whole model was constrained to suppress the rigid body motion of the three-dimensional geometric model. A structural static analysis of the finite element model was performed after applying displacement boundary conditions. This analysis was conducted to obtain the stress distribution required for the test piece section to change from the initial contour to the fitted contour. The fitted contour was the yoz-normal residual stress distribution of the surface to be tested, as shown in Equation (2).

2.3. Microstructural Characterization

In order to investigate the microstructure evolution of Ni-Co-based superalloys during heat treatment, three states of Ni-Co-based superalloys were sampled, respectively, with each sample measuring 5 × 5 × 5 mm3, as illustrated in Figure 2b. For microstructure analysis, a scanning electron microscope (SEM) equipped with an electron backscatter diffraction (EBSD) unit was used to observe the horizontal (XY) and vertical (YZ) reference faces of the cubic specimens.
The surfaces of all specimens for electron backscatter diffraction (EBSD) were electropolished at 25 V for 25 s to observe the grain structure using a mixture comprising 10% perchloric acid and 90% alcohol solution that served as the electrolytic polishing agent. A mixed solution with a ratio of phosphoric acid:sulfuric acid:nitric acid of 3:12:10 was used as an etchant to etch the surface of all scanning electron microscope (SEM) samples at a voltage of 3 V for 8 s.
The scanning electron microscope (SEM) was carried out on the JSM-IT800 produced by JEOL (Tokyo, Japan) working at 15 kV using a secondary electron (SE2) detector. All SEM imaging conditions were kept constant (accelerating voltage, brightness/contrast, working distance, etc.). Automated image analysis was performed using the Image-Pro Plus 6.0 software.

3. Results

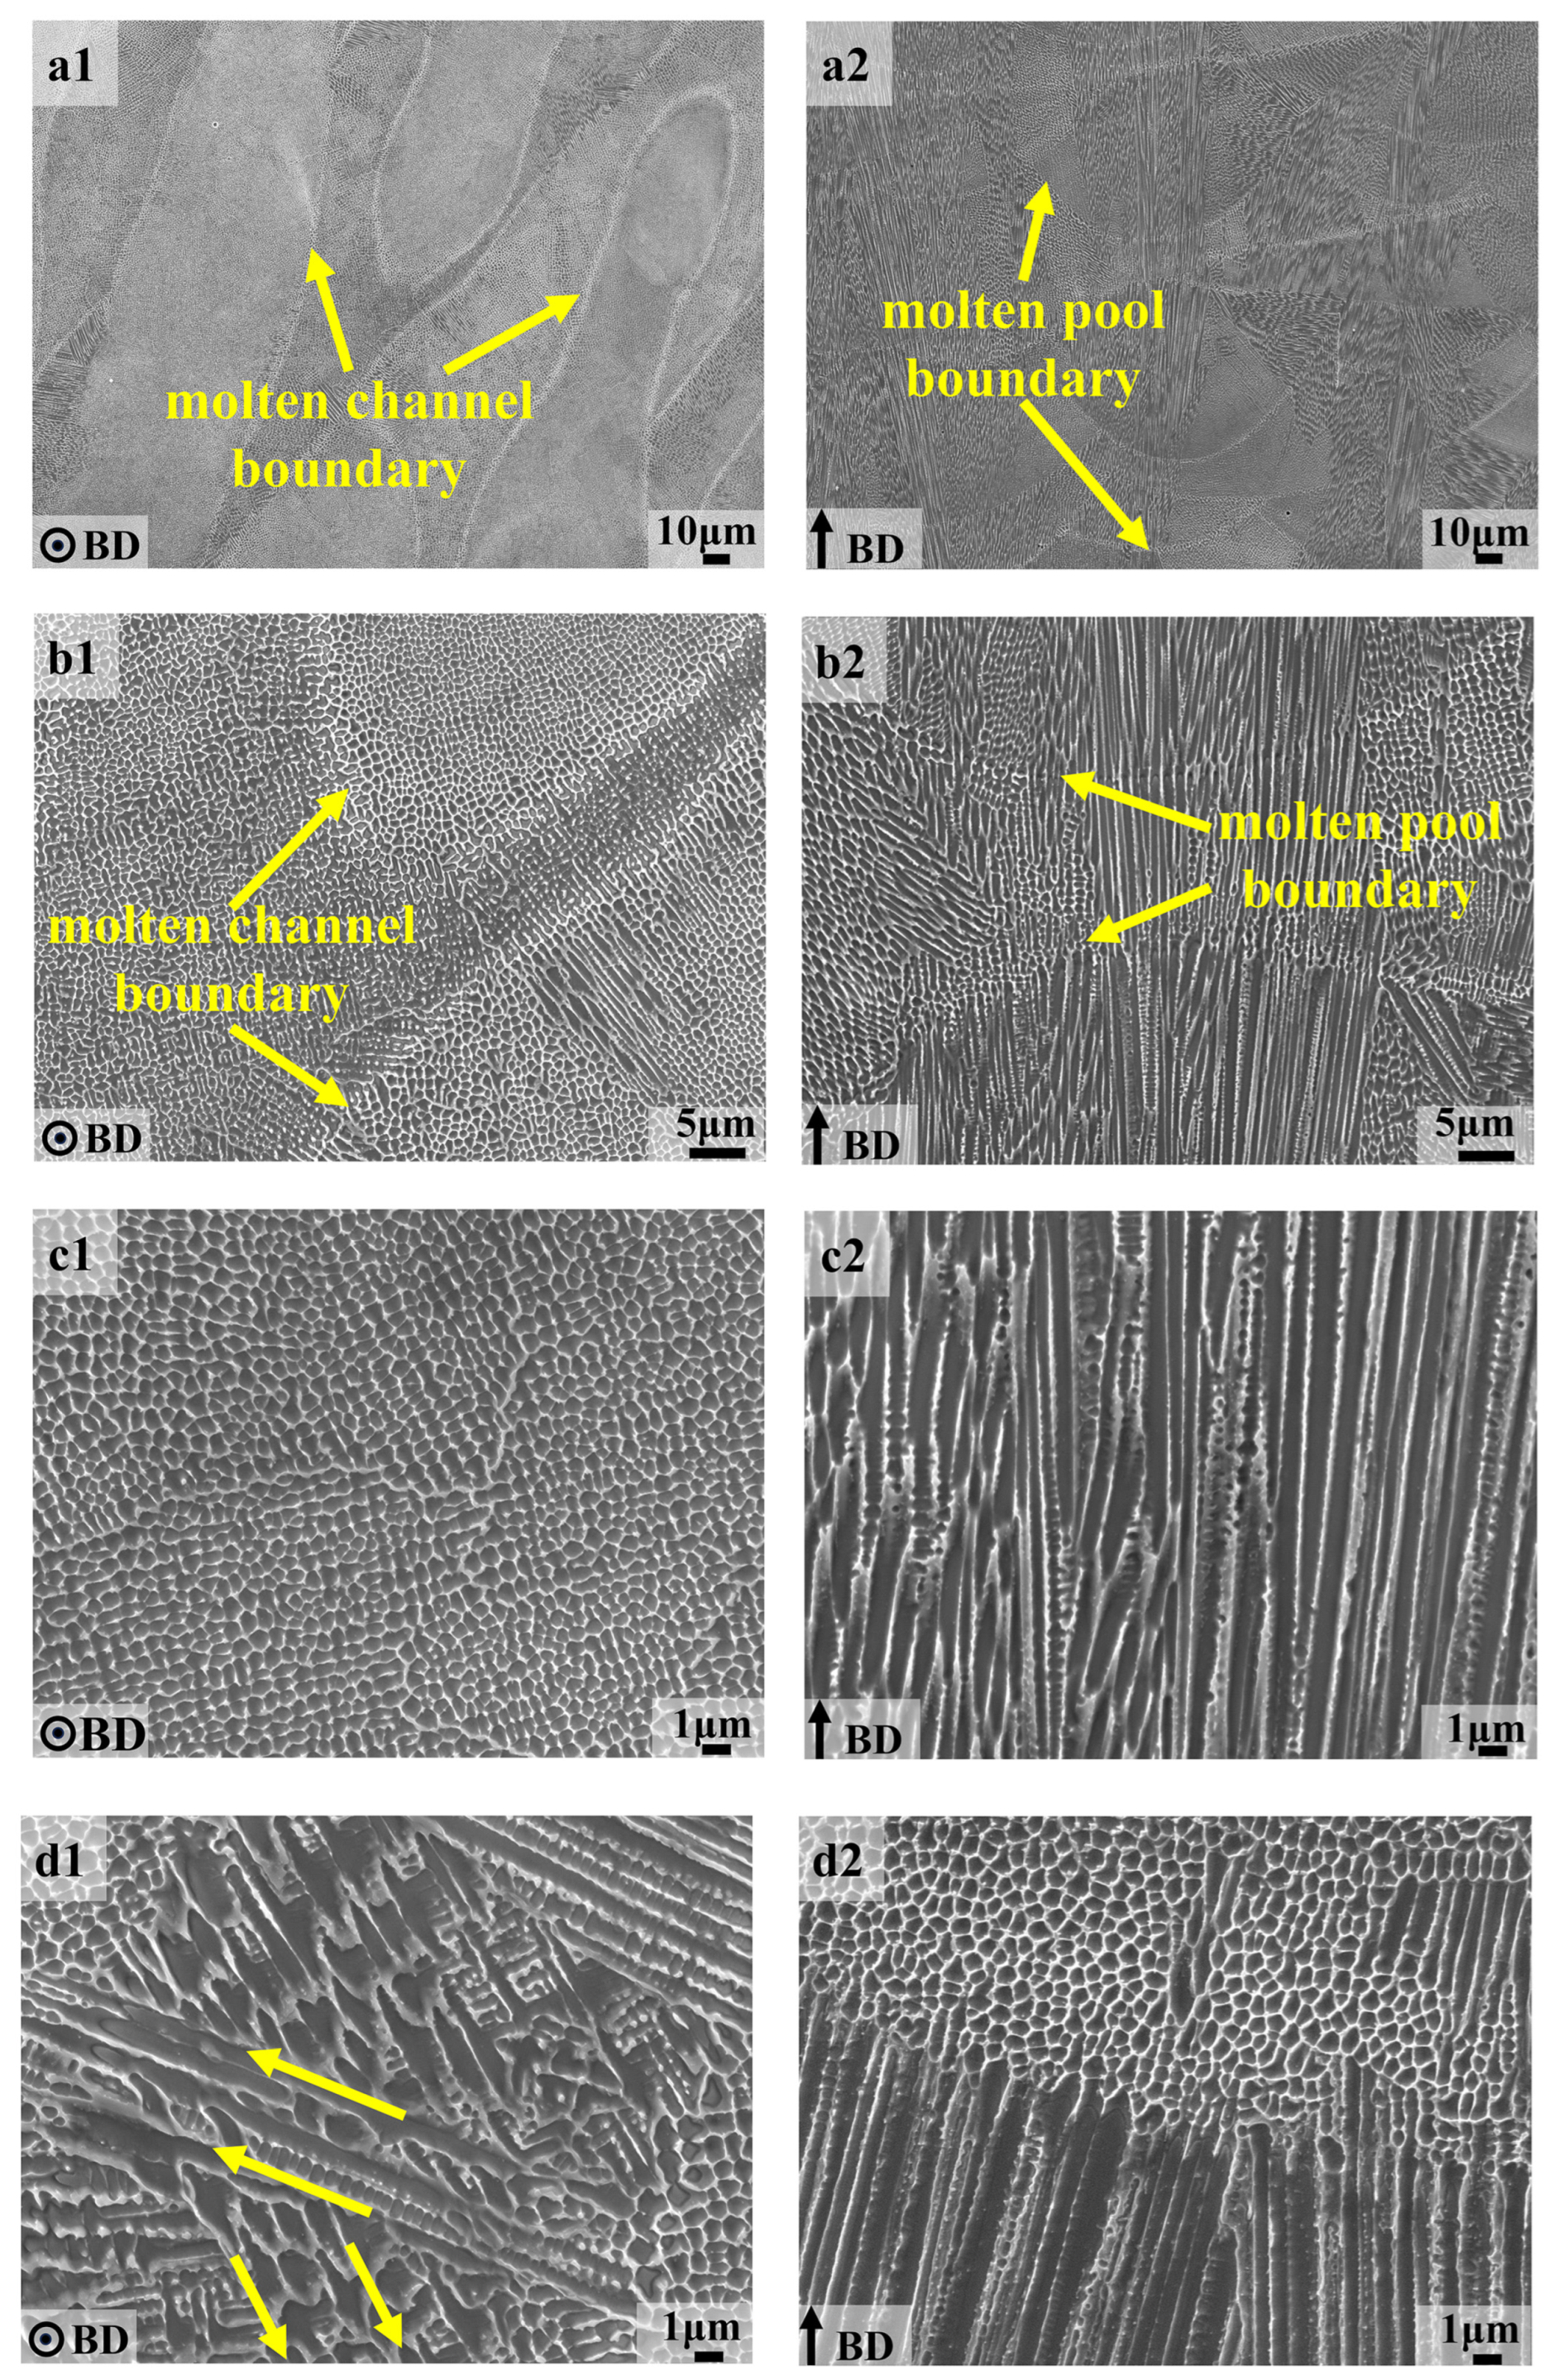
3.1. Microstructural Analysis

In AM techniques based on fusion welding, the cooling rate is generally between 103 and 108 K/s, which is significantly greater than that in welds or castings [22]. The complex thermal history of the LPBF process, which involves repeated heating and rapid cooling, is responsible for forming the distinctive microstructure observed in the Ni-Co-based superalloy. Figure 5 shows the SEM images of the microstructure for sample AB in the vertical (YZ) and horizontal (XY) sections, where (a1)–(d1) are different parts of the horizontal section and (a2)–(d2) are different parts of the vertical section. For the as-built samples, Figure 5(a1,a2) shows overlapped, bowl-shaped melt pool contours in the vertical section (YZ) and interlocking strips of melt channels within the horizontal section (XY). Typical sub-grain microstructures, including cellular and columnar structures [23,24], were observed in both the horizontal and vertical sections shown in Figure 5(c1,c2). As illustrated in Figure 5(b1,b2), the formation of melt pool and melt channel boundaries does not impede the growth of cellular and columnar sub-grain microstructures. In other words, the sub-grain microstructures have the potential to grow epitaxially at the boundaries of the melt pool and the melt channel. Additionally, discrepancies in size and shape were evident for the cellular and columnar substructures across diverse regions. Illustrative of this were the observations on the edge of the intersection between adjacent molten pools or melt channels, wherein the substructure dimensions were found to exceed those within the interior regions (Figure 5(b1,b2)). The overlap between the adjacent molten pool and the nearby molten channel may explain this phenomenon. As a result of this overlap, the substructure in that area was found to be larger, which is a consequence of the repeated heating process. Furthermore, due to various factors, such as different heating temperatures caused by the laser irradiation angle and repeated melting at the overlap of the melting pool and melting channel, the growth direction of the cellular and columnar sub-grain microstructures is constantly changing, resulting in a wide range of different site-specific distributions (Figure 5(d1,d2)).
After solution heat treatment and aging heat treatment, the microstructure of the LPBF Ni-Co-based superalloy undergoes significant changes. Figure 6 presents SEM micrographs of horizontal and vertical cross-sections for ST and ST + AT samples. Specifically, Figure 6(a1,b1) displays vertical cross-sections of the ST sample, while Figure 6(c1,d1) shows its horizontal cross-sections. Correspondingly, Figure 6(a2,b2) illustrates vertical cross-sections of the ST + AT sample, with Figure 6(c2,d2) depicting its horizontal cross-sections. As is evident in Figure 6, the melt pool boundaries, melt channel boundaries, and cellular and columnar sub-grain microstructures observed in the horizontal and vertical cross-sections of the as-built Ni-Co superalloy are no longer discernible. Instead, a vast multitude of γ′ phases with irregular morphology are precipitated (Figure 6(a1,a2)). It is noteworthy that Figure 6(b1,b2,c1,c2) illustrates a specific orientation of the γ′ phase in both the vertical and horizontal sections of the ST and ST + AT. This phenomenon is due to the dissolution of grain boundaries and sub-grains with different orientations in the as-cast Ni-Co-based superalloy into the matrix during heat treatment.

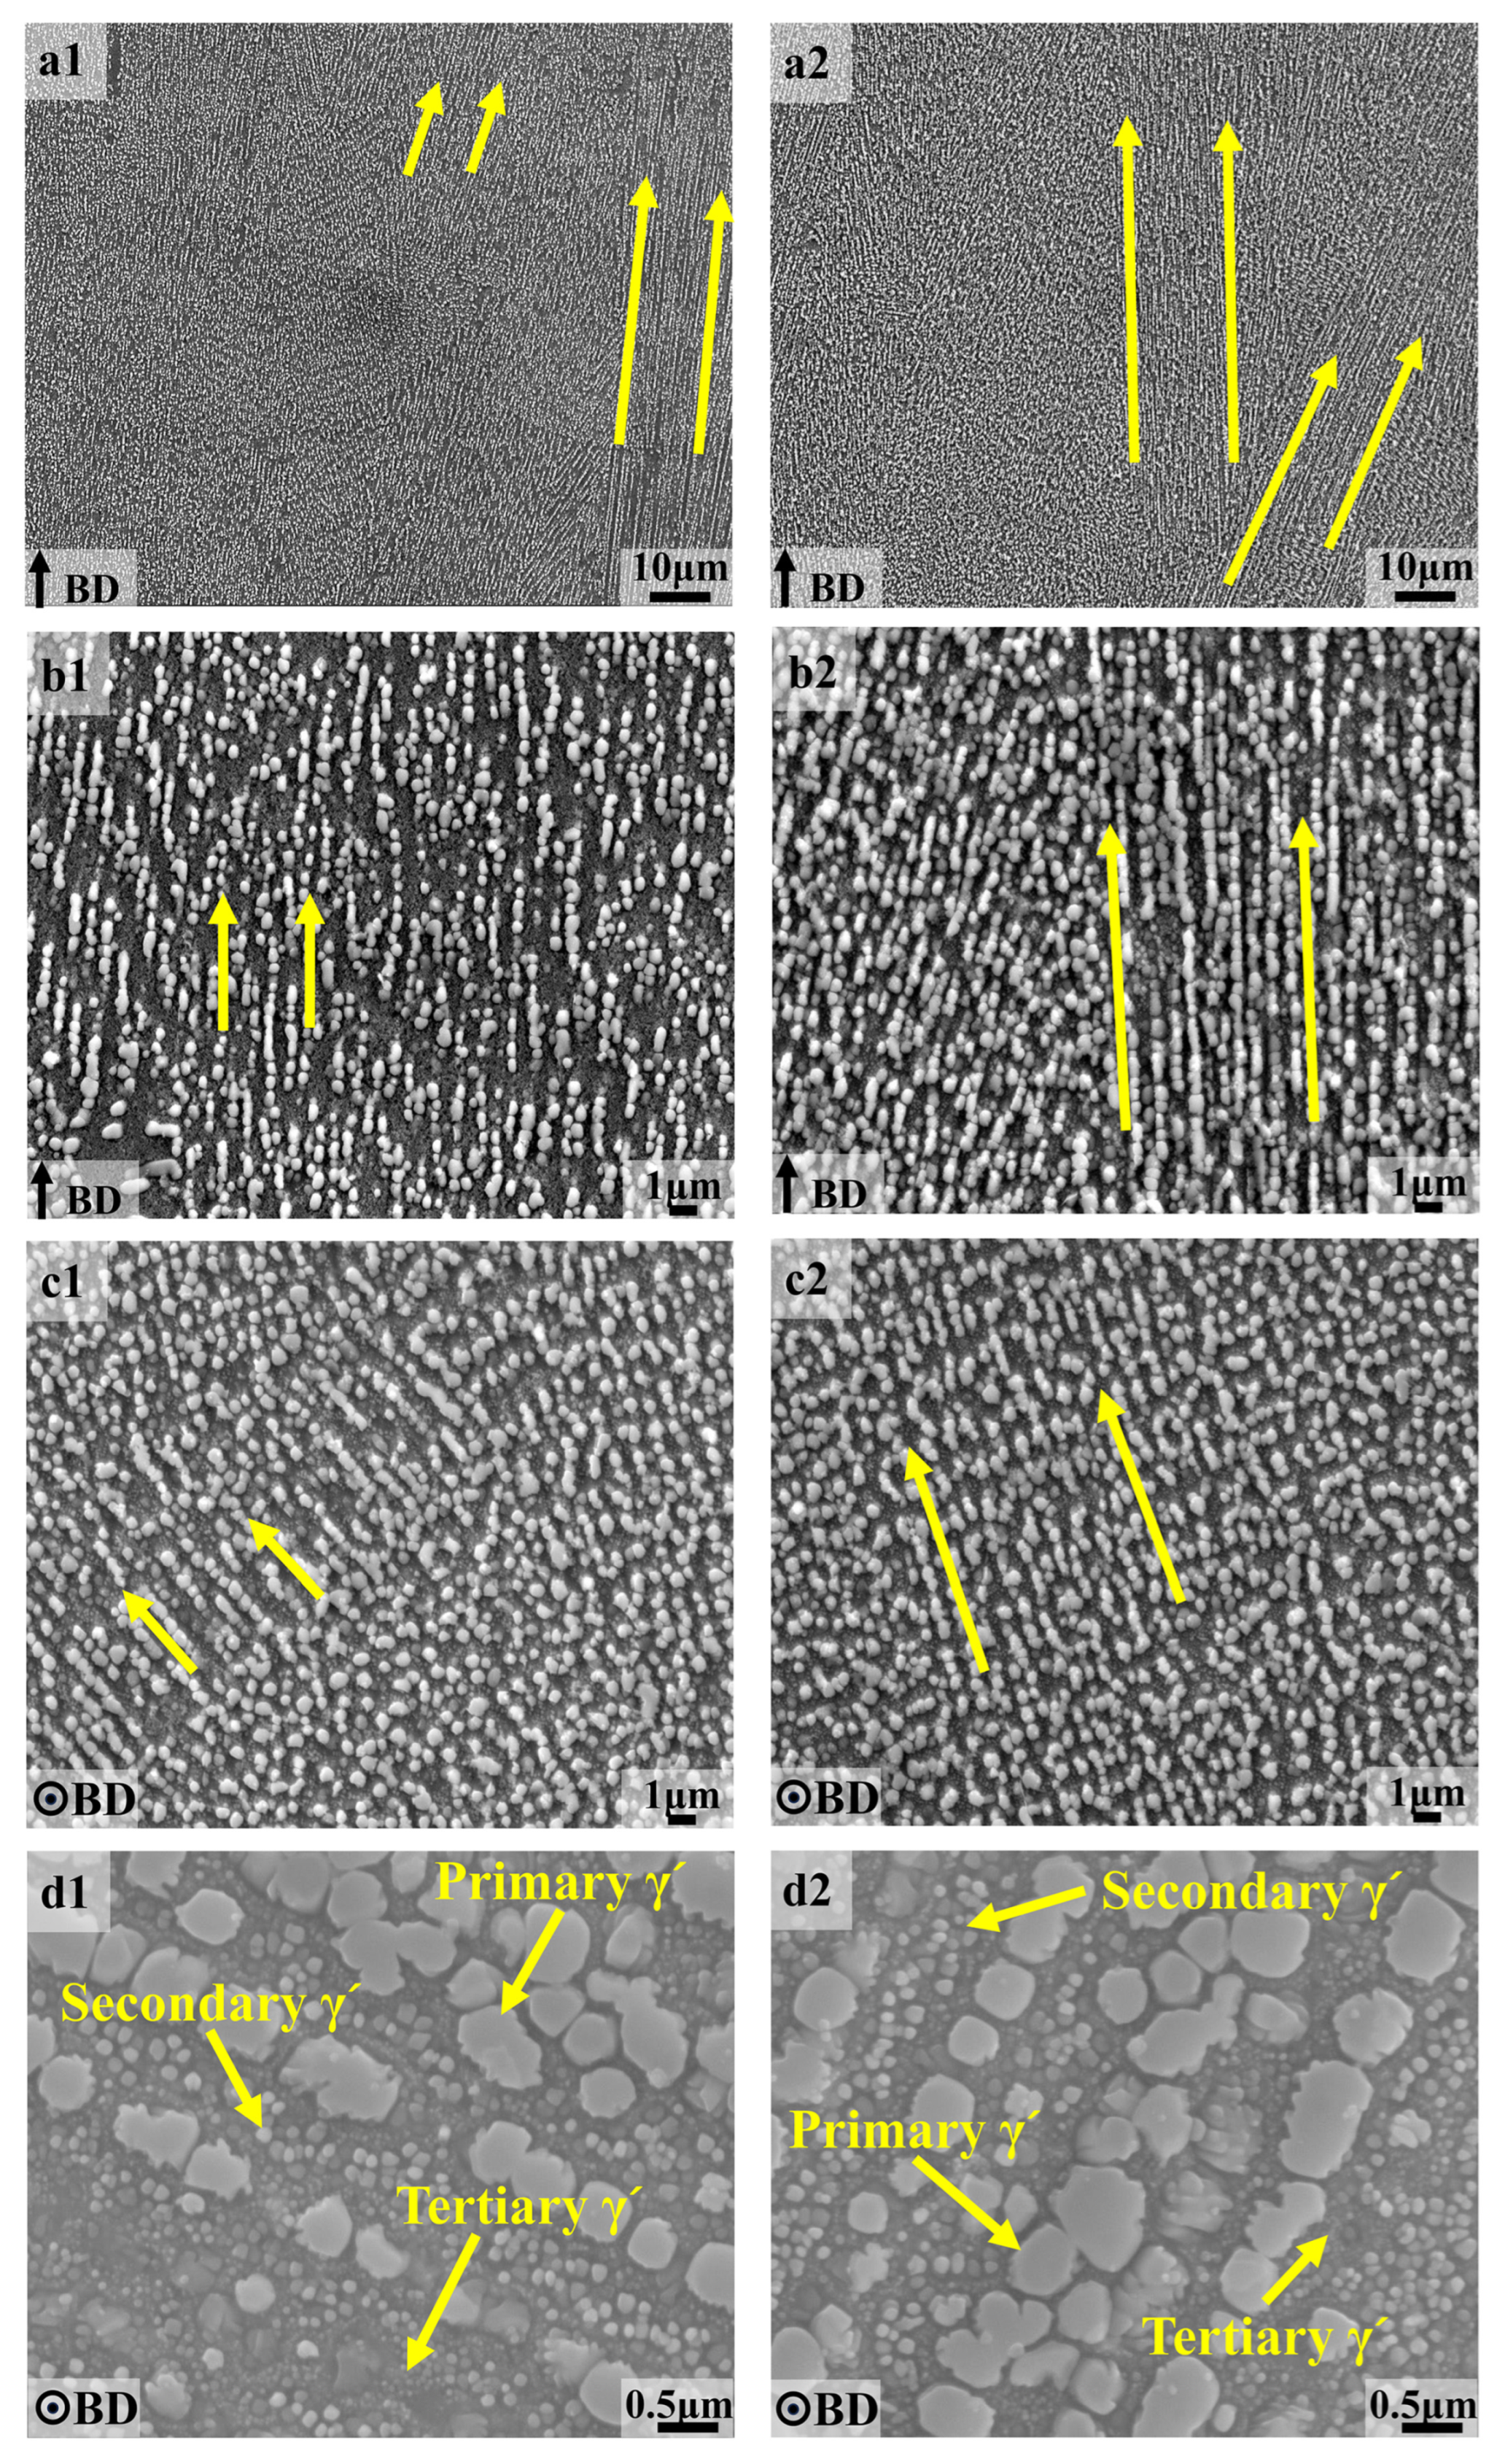
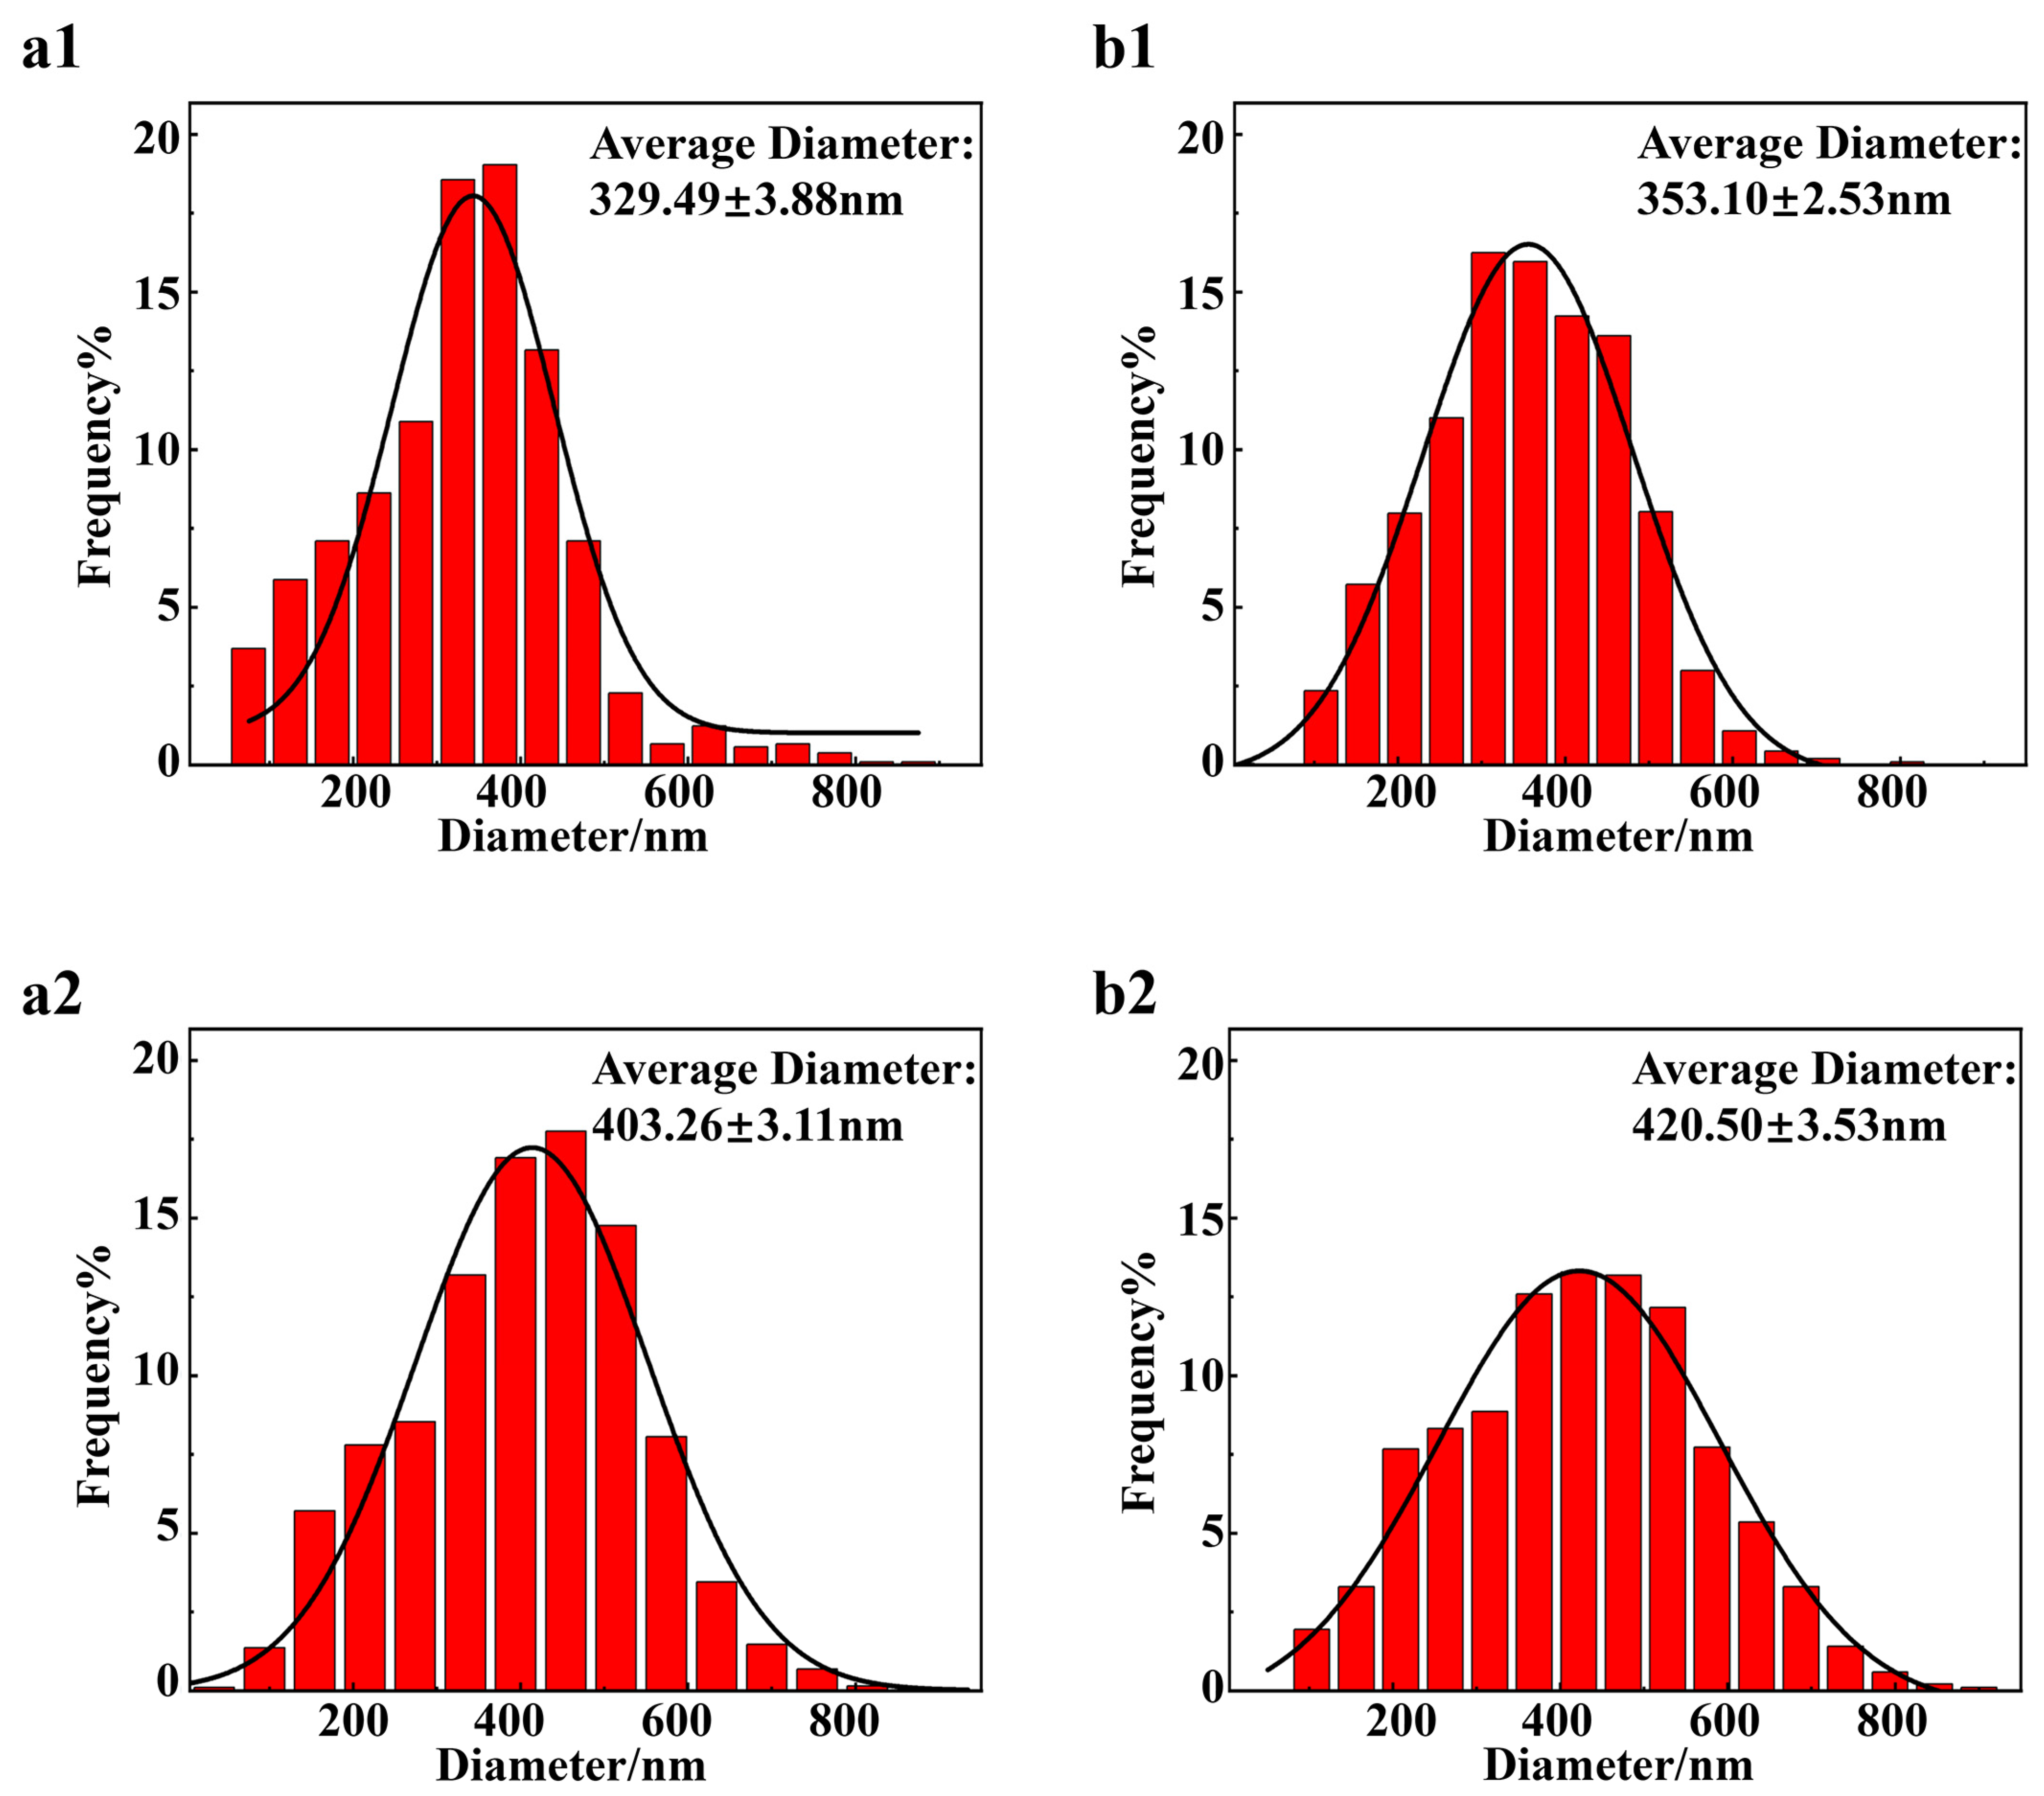
3.2. γ′ Phase Characteristics

The horizontal and vertical sections of the AB samples were examined using high-power scanning electron microscopy (SEM). Observations revealed only cellular and columnar sub-grain microstructures, without evidence of the γ′ phase. This absence can be attributed to the rapid cooling rate during the printing process, which created insufficient conditions for the precipitation of the γ′ phase. As illustrated in Figure 6(d1,d2), the solution and aging heat treatment result in three scales of γ′ phase precipitation in the ST and ST + AT samples. The primary γ′ phase is irregular in shape and has the largest average size compared to the other phases. The secondary γ′ phase manifests as either square or spherical shapes, with its average size falling between that of the primary and tertiary γ′ phases. The tertiary γ′ phase is predominantly found in a spherical distribution between the primary and secondary γ′ phases, and it has the smallest average size of all the phases. The mean diameter of the γ′ phase particles was calculated in both the horizontal and vertical sections of the ST and ST + AT samples using statistical software (Image-Pro Plus 6.0) designed for analyzing precipitated phases [25]. A comparison of the statistical results shown in Figure 7 demonstrates that, after the aging treatment, the mean particle size of the γ′ phase in both the horizontal and vertical sections of the ST + AT sample is larger than that of the ST sample. Notably, the mean particle size of the γ′ phase increased from 329.49 μm (Figure 7(a1)) to 403.26 μm (Figure 7(a2)) in the horizontal section and from 353.10 μm (Figure 7(b1)) to 420.50 μm (Figure 7(b2)) in the vertical section. Additionally, the particle size distribution of the γ′ phase in the horizontal and vertical sections of the ST + AT sample (Figure 7(b1,b2)) exhibits a broader range than that of the ST sample (Figure 7(a1,a2)). This phenomenon arises from the elevated thermal activation energy during aging treatment, which promotes solute diffusion, thereby facilitating the continued growth of nucleated γ′ phases through solute element redistribution.

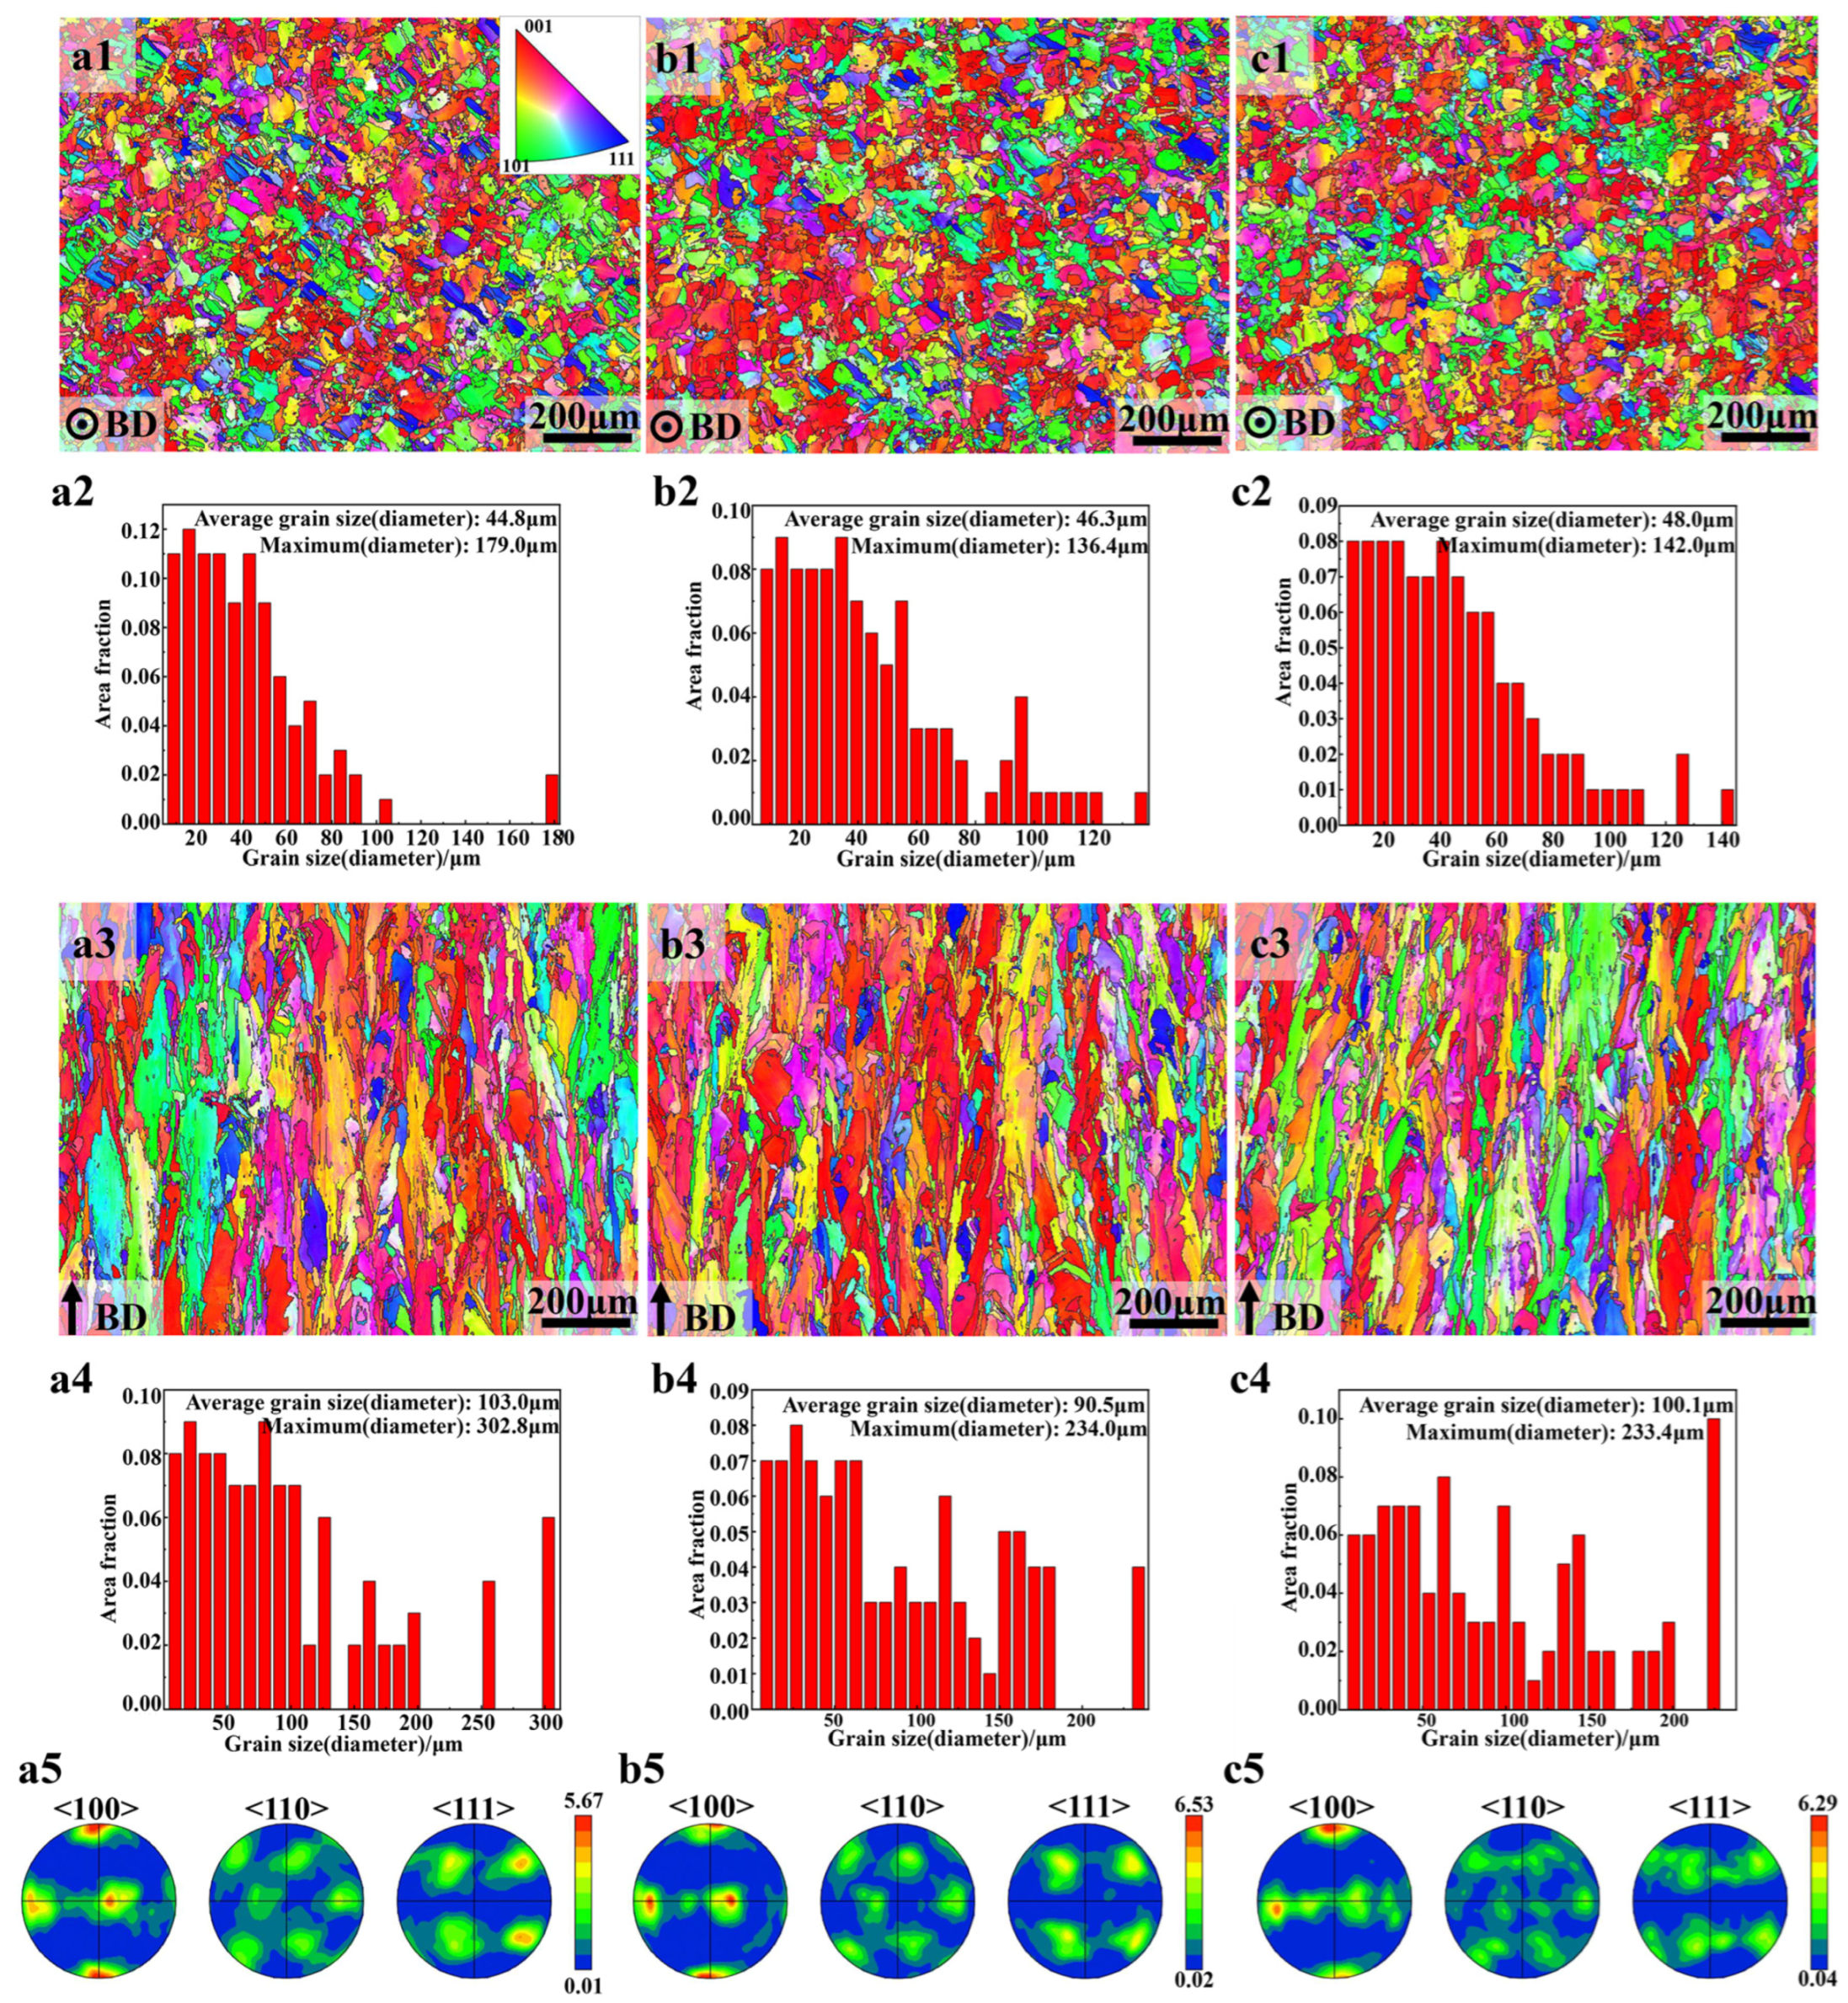
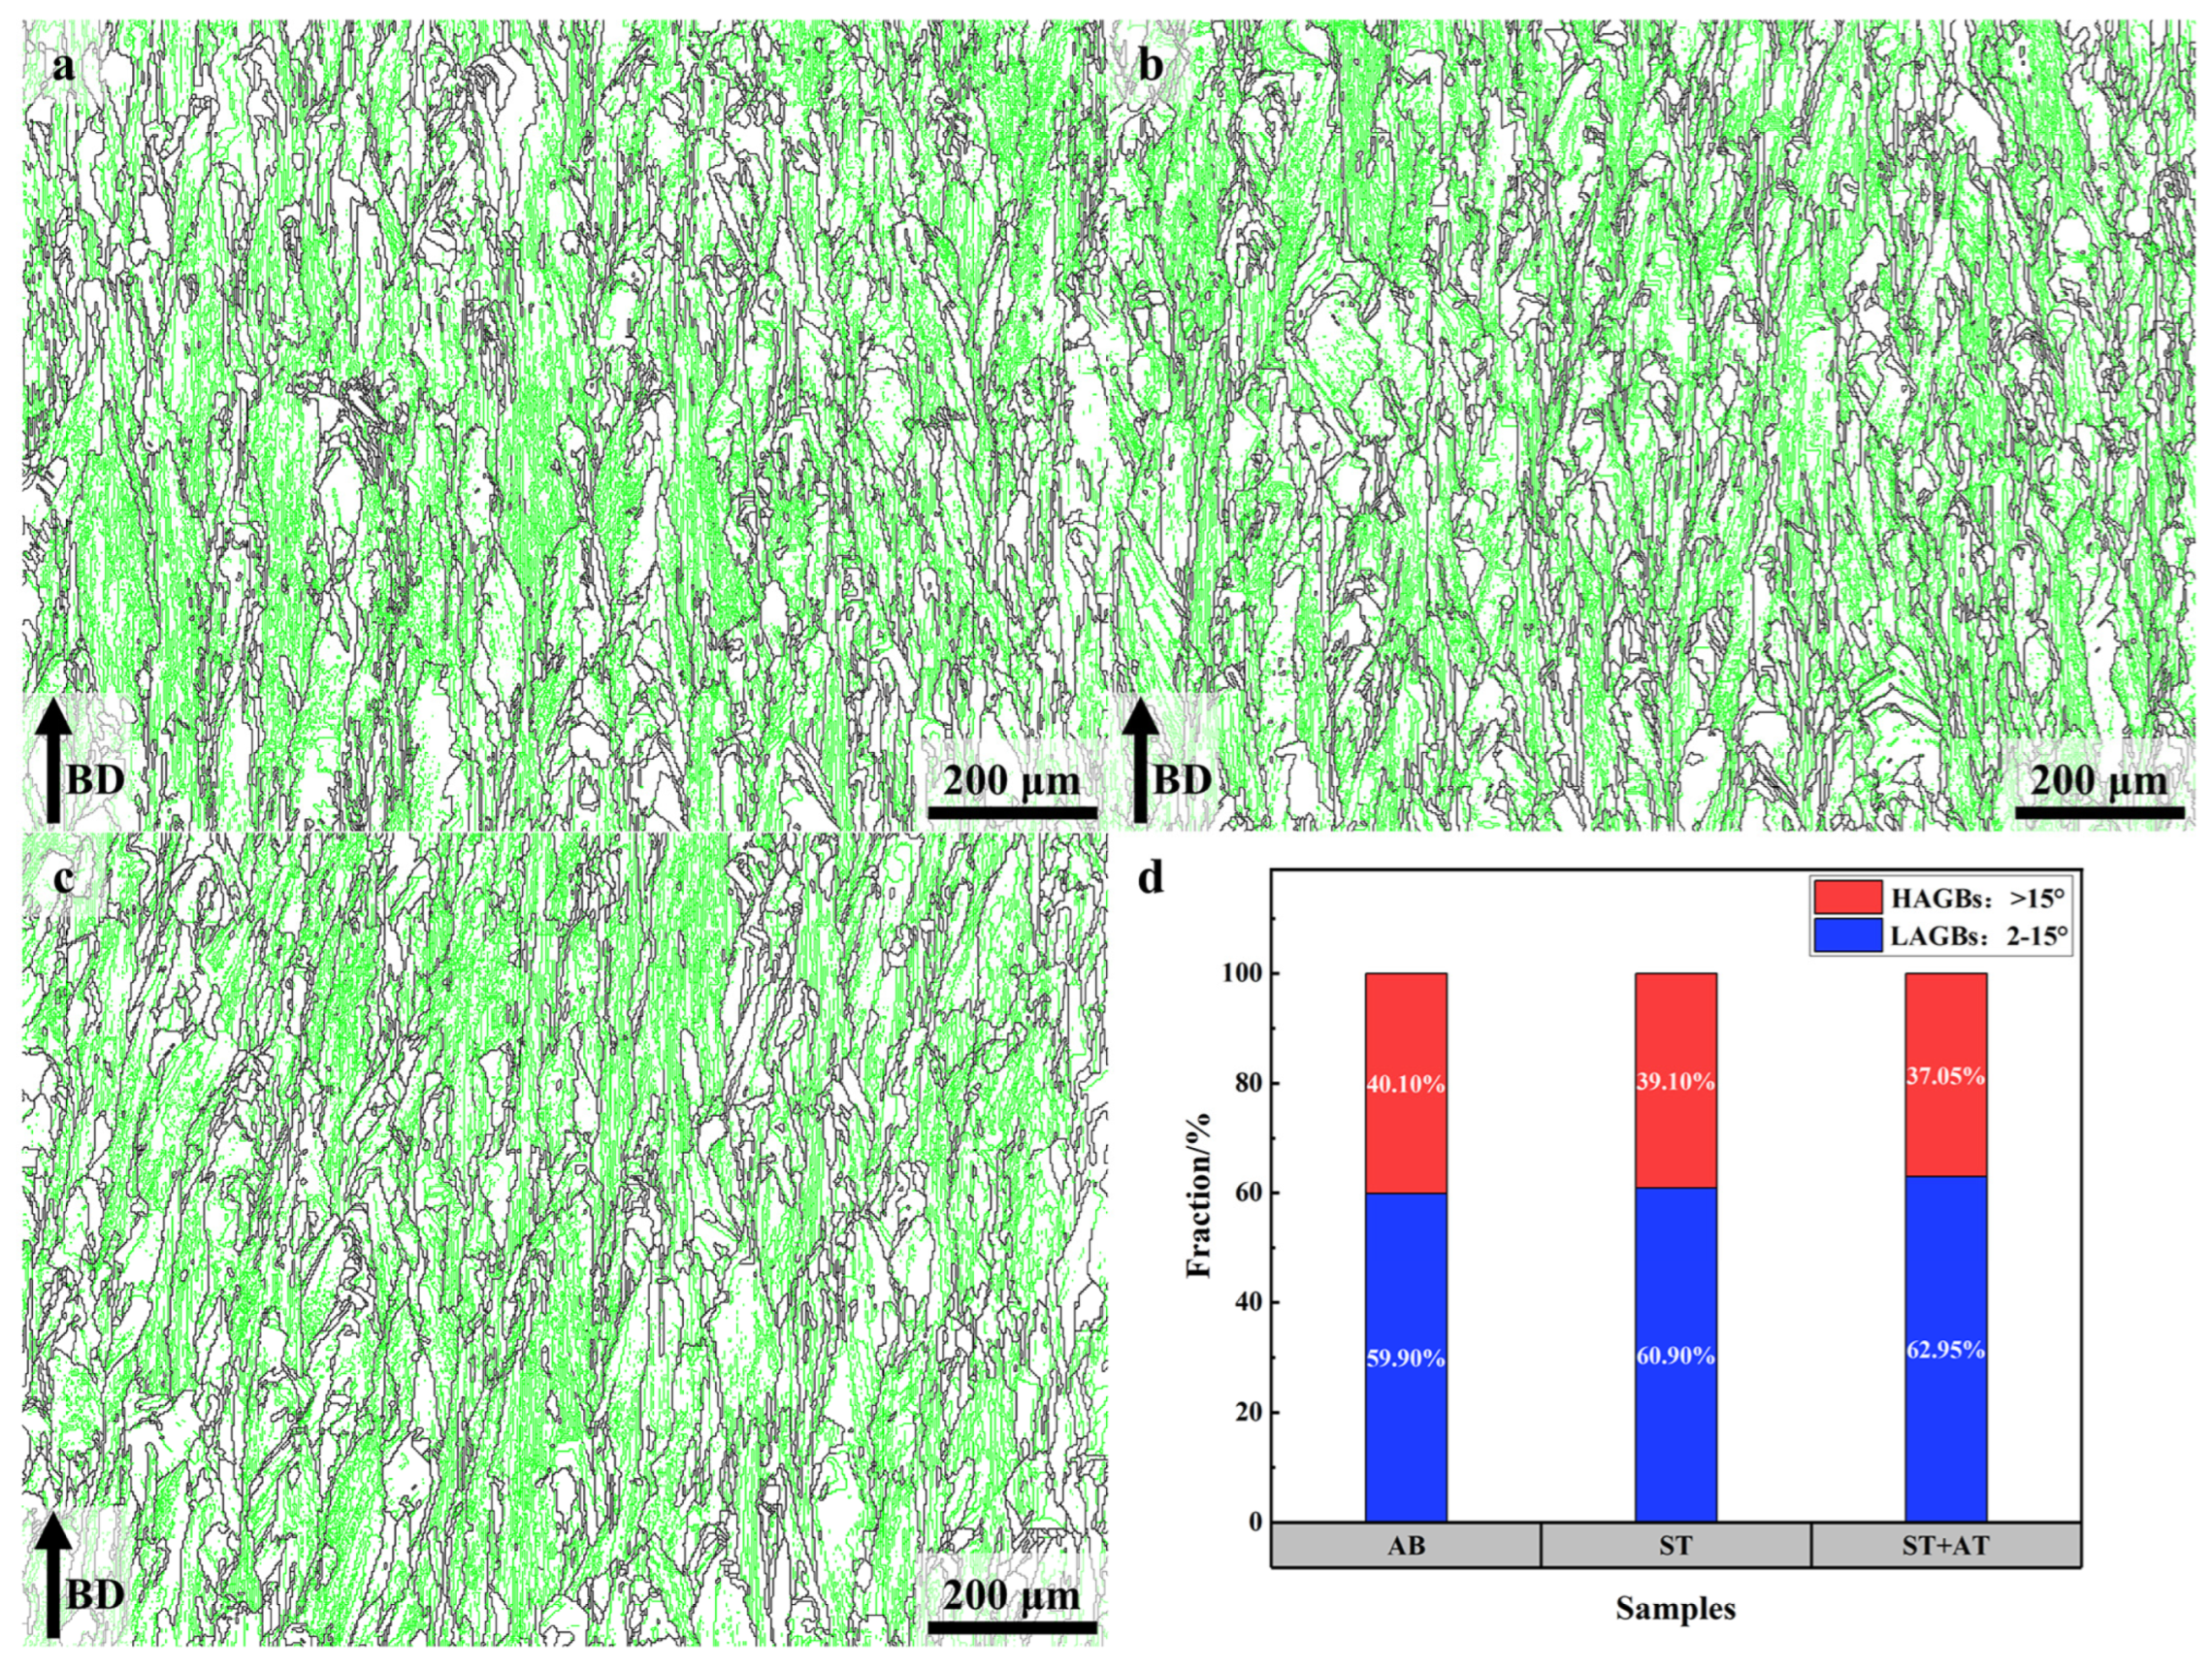
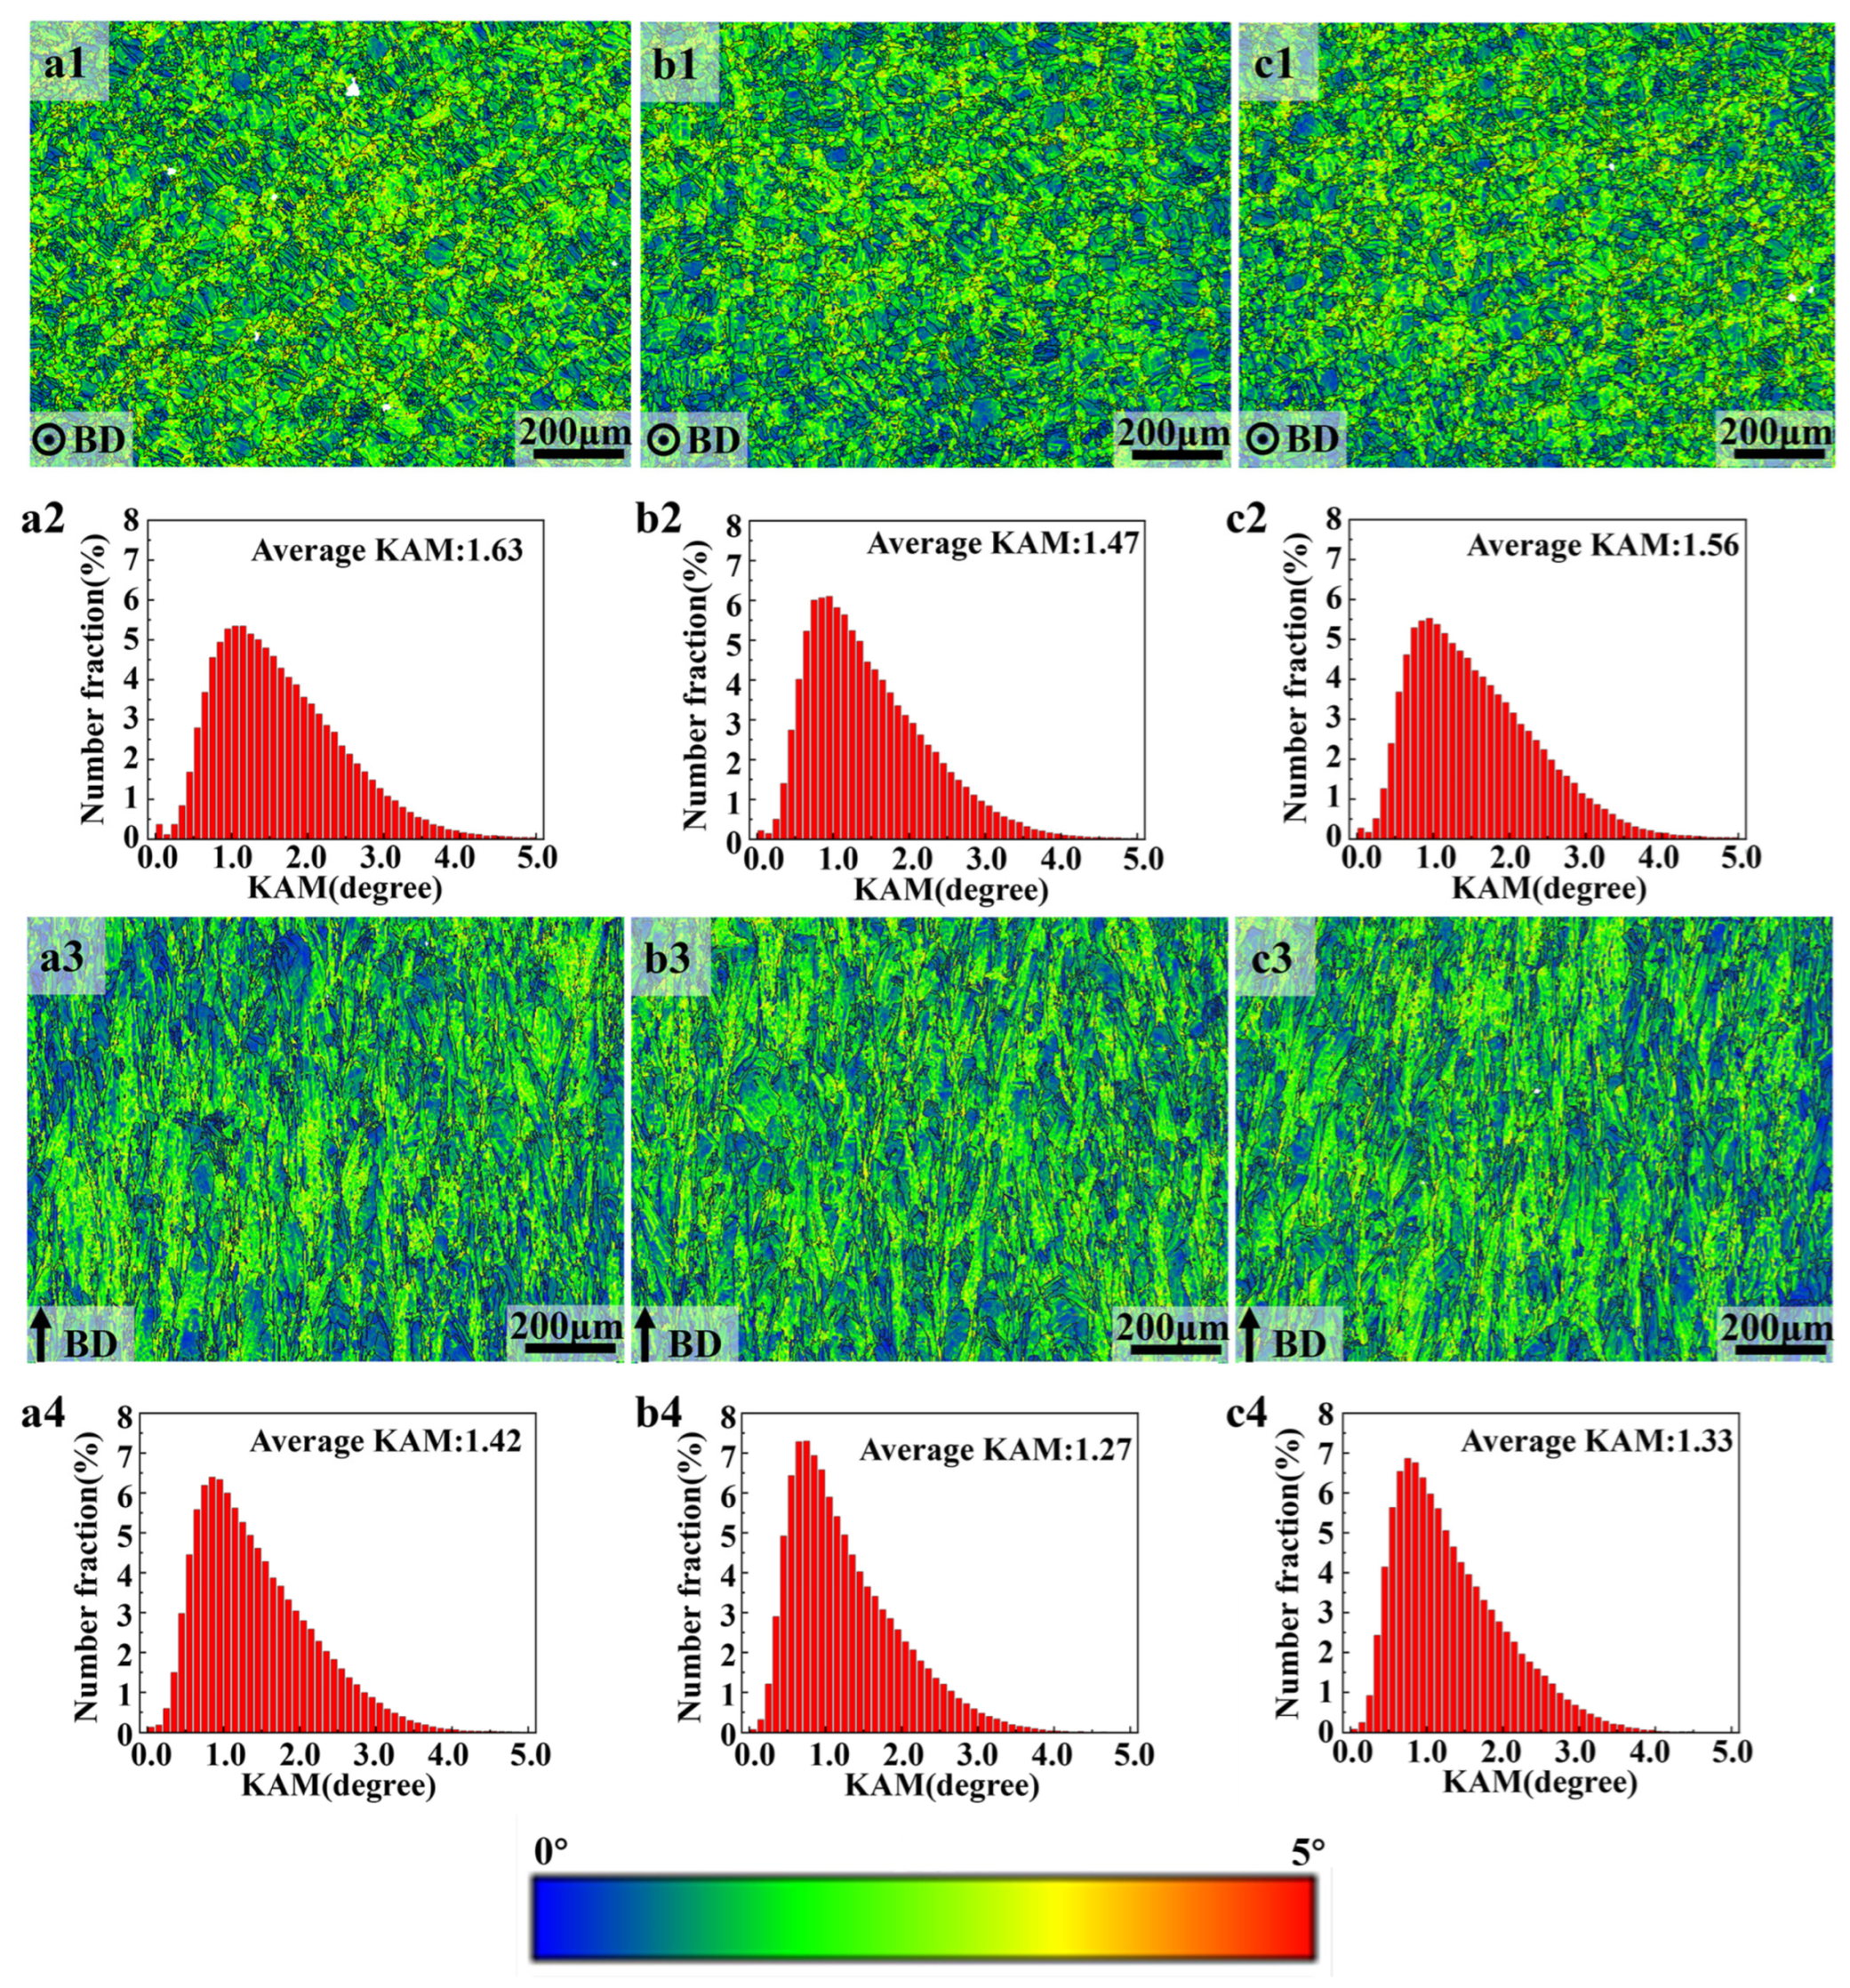
3.3. Grain Characteristics

Furthermore, EBSD analysis enables the grain morphology and texture of the horizontal and vertical sections to be elucidated for the AB, ST, and ST + AT LPBF Ni-Co-based superalloy specimens. The horizontal IPFs of the AB sample (Figure 8(a1)) show that irregular equiaxed grains with relatively disordered distribution dominate in the horizontal section. Furthermore, due to the existence of a certain degree of overlap between the melt channels in the horizontal section during laser scanning forming, the overlapping areas subsequently undergo recrystallization as a result of reheating, which results in the formation of numerous fine-sized grains distributed around the relatively larger grains.
In contrast to the horizontal plane, the IPFs in the vertical plane (Figure 8(a3)) demonstrate that the vertical section is predominantly constituted by irregular strip columnar grains, exhibiting a growth direction that is aligned with the construction direction. In other words, the columnar grains grow from the construction platform to the molten pool boundary/solid interface, and its length is significantly larger than the thickness of a single powder layer (30 μm) and the depth of the molten pool. This is due to epitaxial growth [26], caused by the partial re-melting of the previously solidified layer. The synergistic effect of local laser heating of the upper layer of the powder bed and the significant heat dissipation to the construction platform results in a high-temperature gradient along the construction direction. When the temperature gradient direction in the subsequent molten pool is in close alignment with the crystallographic orientation of the preceding molten pool, the crystal growth barrier is significantly diminished in comparison to the nucleation barrier. Ultimately, this results in the epitaxial growth of columnar crystals across the molten pool boundary.
Indeed, the equiaxed grain morphology observed in the horizontal plane is representative of the cross-section of the columnar grain observed in the vertical plane. Consequently, in both the horizontal and vertical planes, the grain orientation exhibits a relatively prominent <001> texture orientation with a maximum strength of 5.67 (Figure 8(a5)). This can be attributed to a competitive grain growth mechanism [27,28,29], which is dependent on the temperature gradient direction and the preferential growth orientation of FCC metals. When the direction of the temperature gradient is at a small angle to the preferred crystallographic orientation, the grains of similar orientation exhibit accelerated growth, whereas the growth of grains with low correlation to the optimal orientation will be suppressed. The equivalent circular diameter sizes of the grains in the as-built specimens are counted using Aztec Crystal software (v5.1.1) [30] to calculate the average grain size. The horizontal section exhibits an average grain size of 44.8 μm (Figure 8(a2)), while the vertical section demonstrates a significantly larger average grain size of 103.0 μm (Figure 8(a4)). Additionally, the recrystallization fractions of AB, ST, and ST + AT samples were quantified using the Aztec Crystal software through local misorientation angle analysis, the results of which are summarized in Table 3. The observed “sub-structure” corresponds to microstructural sub-grain features intermediate between fully recrystallized grains and deformation-retained grains, which originate from incomplete recrystallization or dynamic recovery processes during heat treatment processing.
Following solution heat treatment, the grain morphology within the horizontal section of the ST samples exhibited no notable alteration in comparison to the AB samples. However, the vertical section demonstrated a substantial transformation, displaying a transition from columnar to equiaxed grains. An analysis of the grain statistical results indicated a slight increase in the average grain size in the horizontal section, rising from 44.8 μm to 46.3 μm (Figure 8(a2,b2)). In contrast, the vertical section showed a reduction in the average grain size from 103.0 μm to 90.5 μm (Figure 8(a4,b4)). On the other hand, in comparison with the AB sample, the maximum grain size in both the horizontal and vertical sections of the ST sample was significantly diminished, resulting in a more uniform grain size distribution. This phenomenon could be attributed to the recrystallization process that occurred within the grains during the solution heat treatment, as evidenced in Table 3. The solution treatment did not weaken the strong texture orientation in the AB sample, and the maximum strength recorded was 6.53 (Figure 8(b5)).
After the aging heat treatments, the grain morphology in both the horizontal and vertical sections showed no significant changes in the ST + AT samples compared to the ST samples; however, there was a substantial modification in grain size. There was a slight increase in the average grain size in the horizontal section, rising from 46.3 μm to 48.0 μm (Figure 8(b2,c2)). In contrast, the average grain size in the vertical section showed a more significant increase, growing from 90.5 μm to 100.1 μm (Figure 8(b4,c4)). As demonstrated in Table 3, the degree of recrystallization within the alloy decreases during the aging treatment. However, the growth of recrystallized grains that occurs during solution treatment and the coalescence of grains contribute to an augmentation in grain size. In addition, it can also be found that the grain size distribution in the ST + AT sample is more homogenous. Similarly, the solution and aging treatment did not weaken the strong texture orientation in the AB sample, and the maximum strength recorded was 6.29 (Figure 8(c5)).

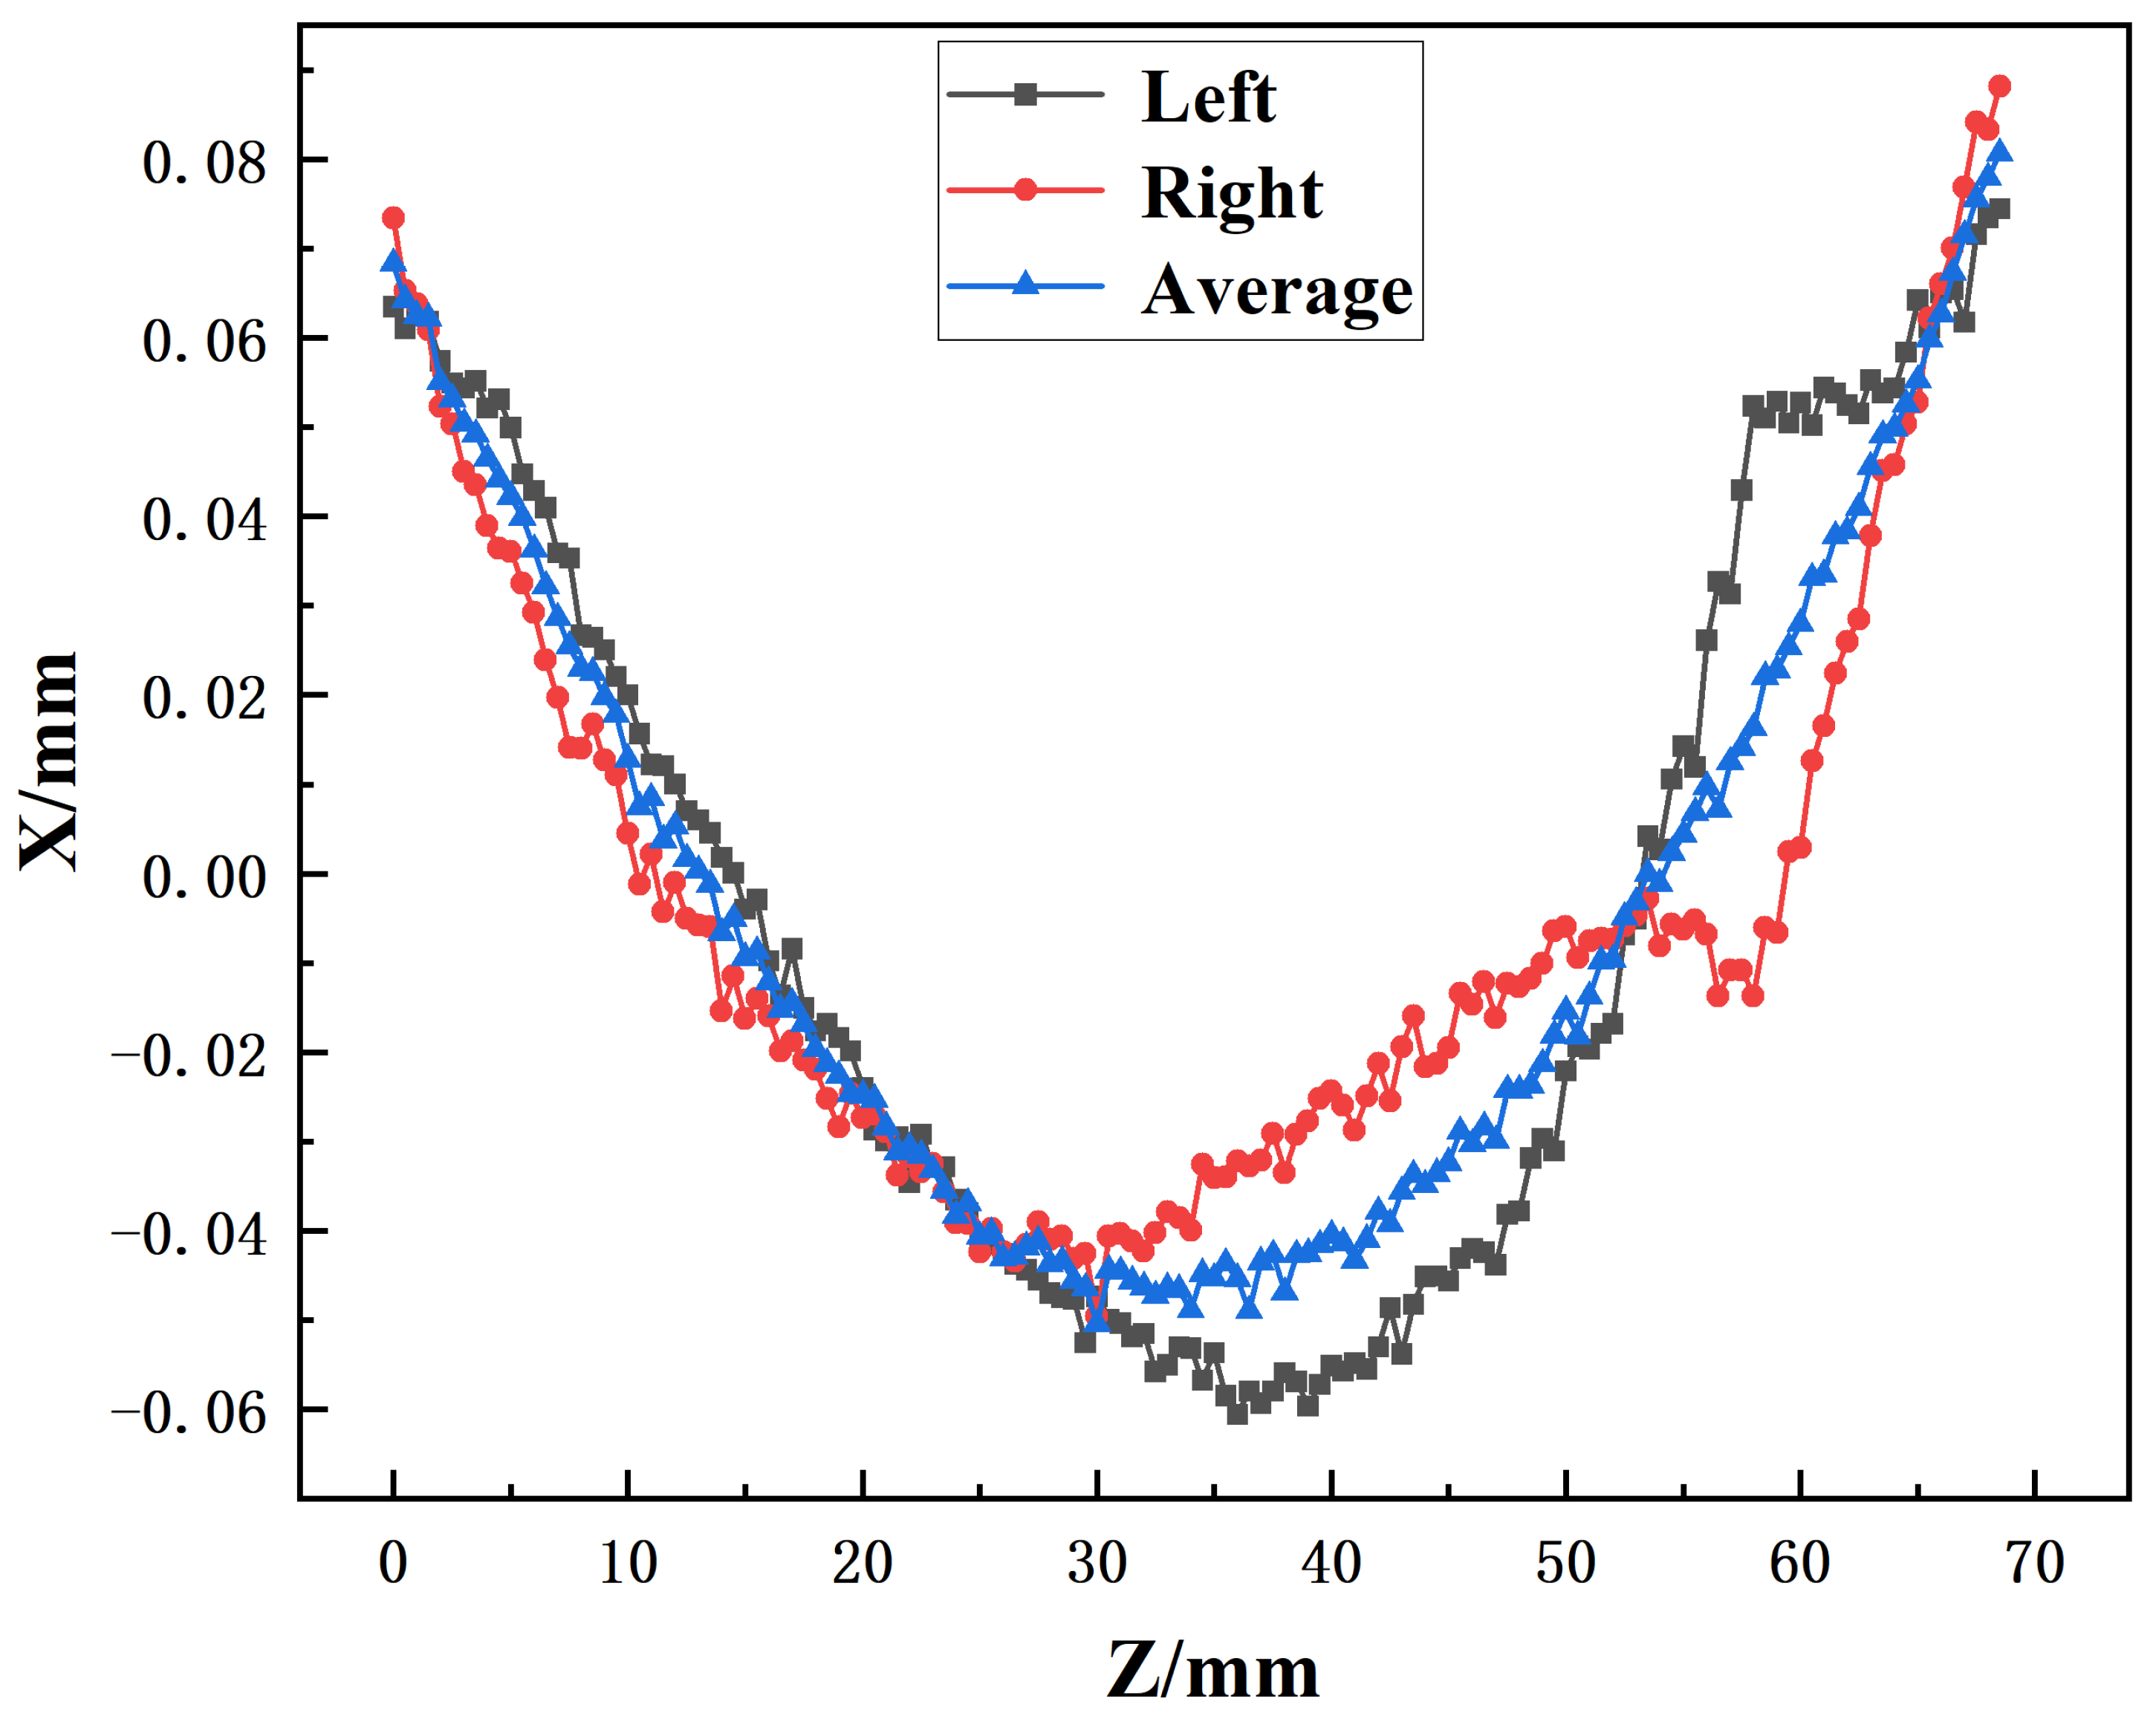
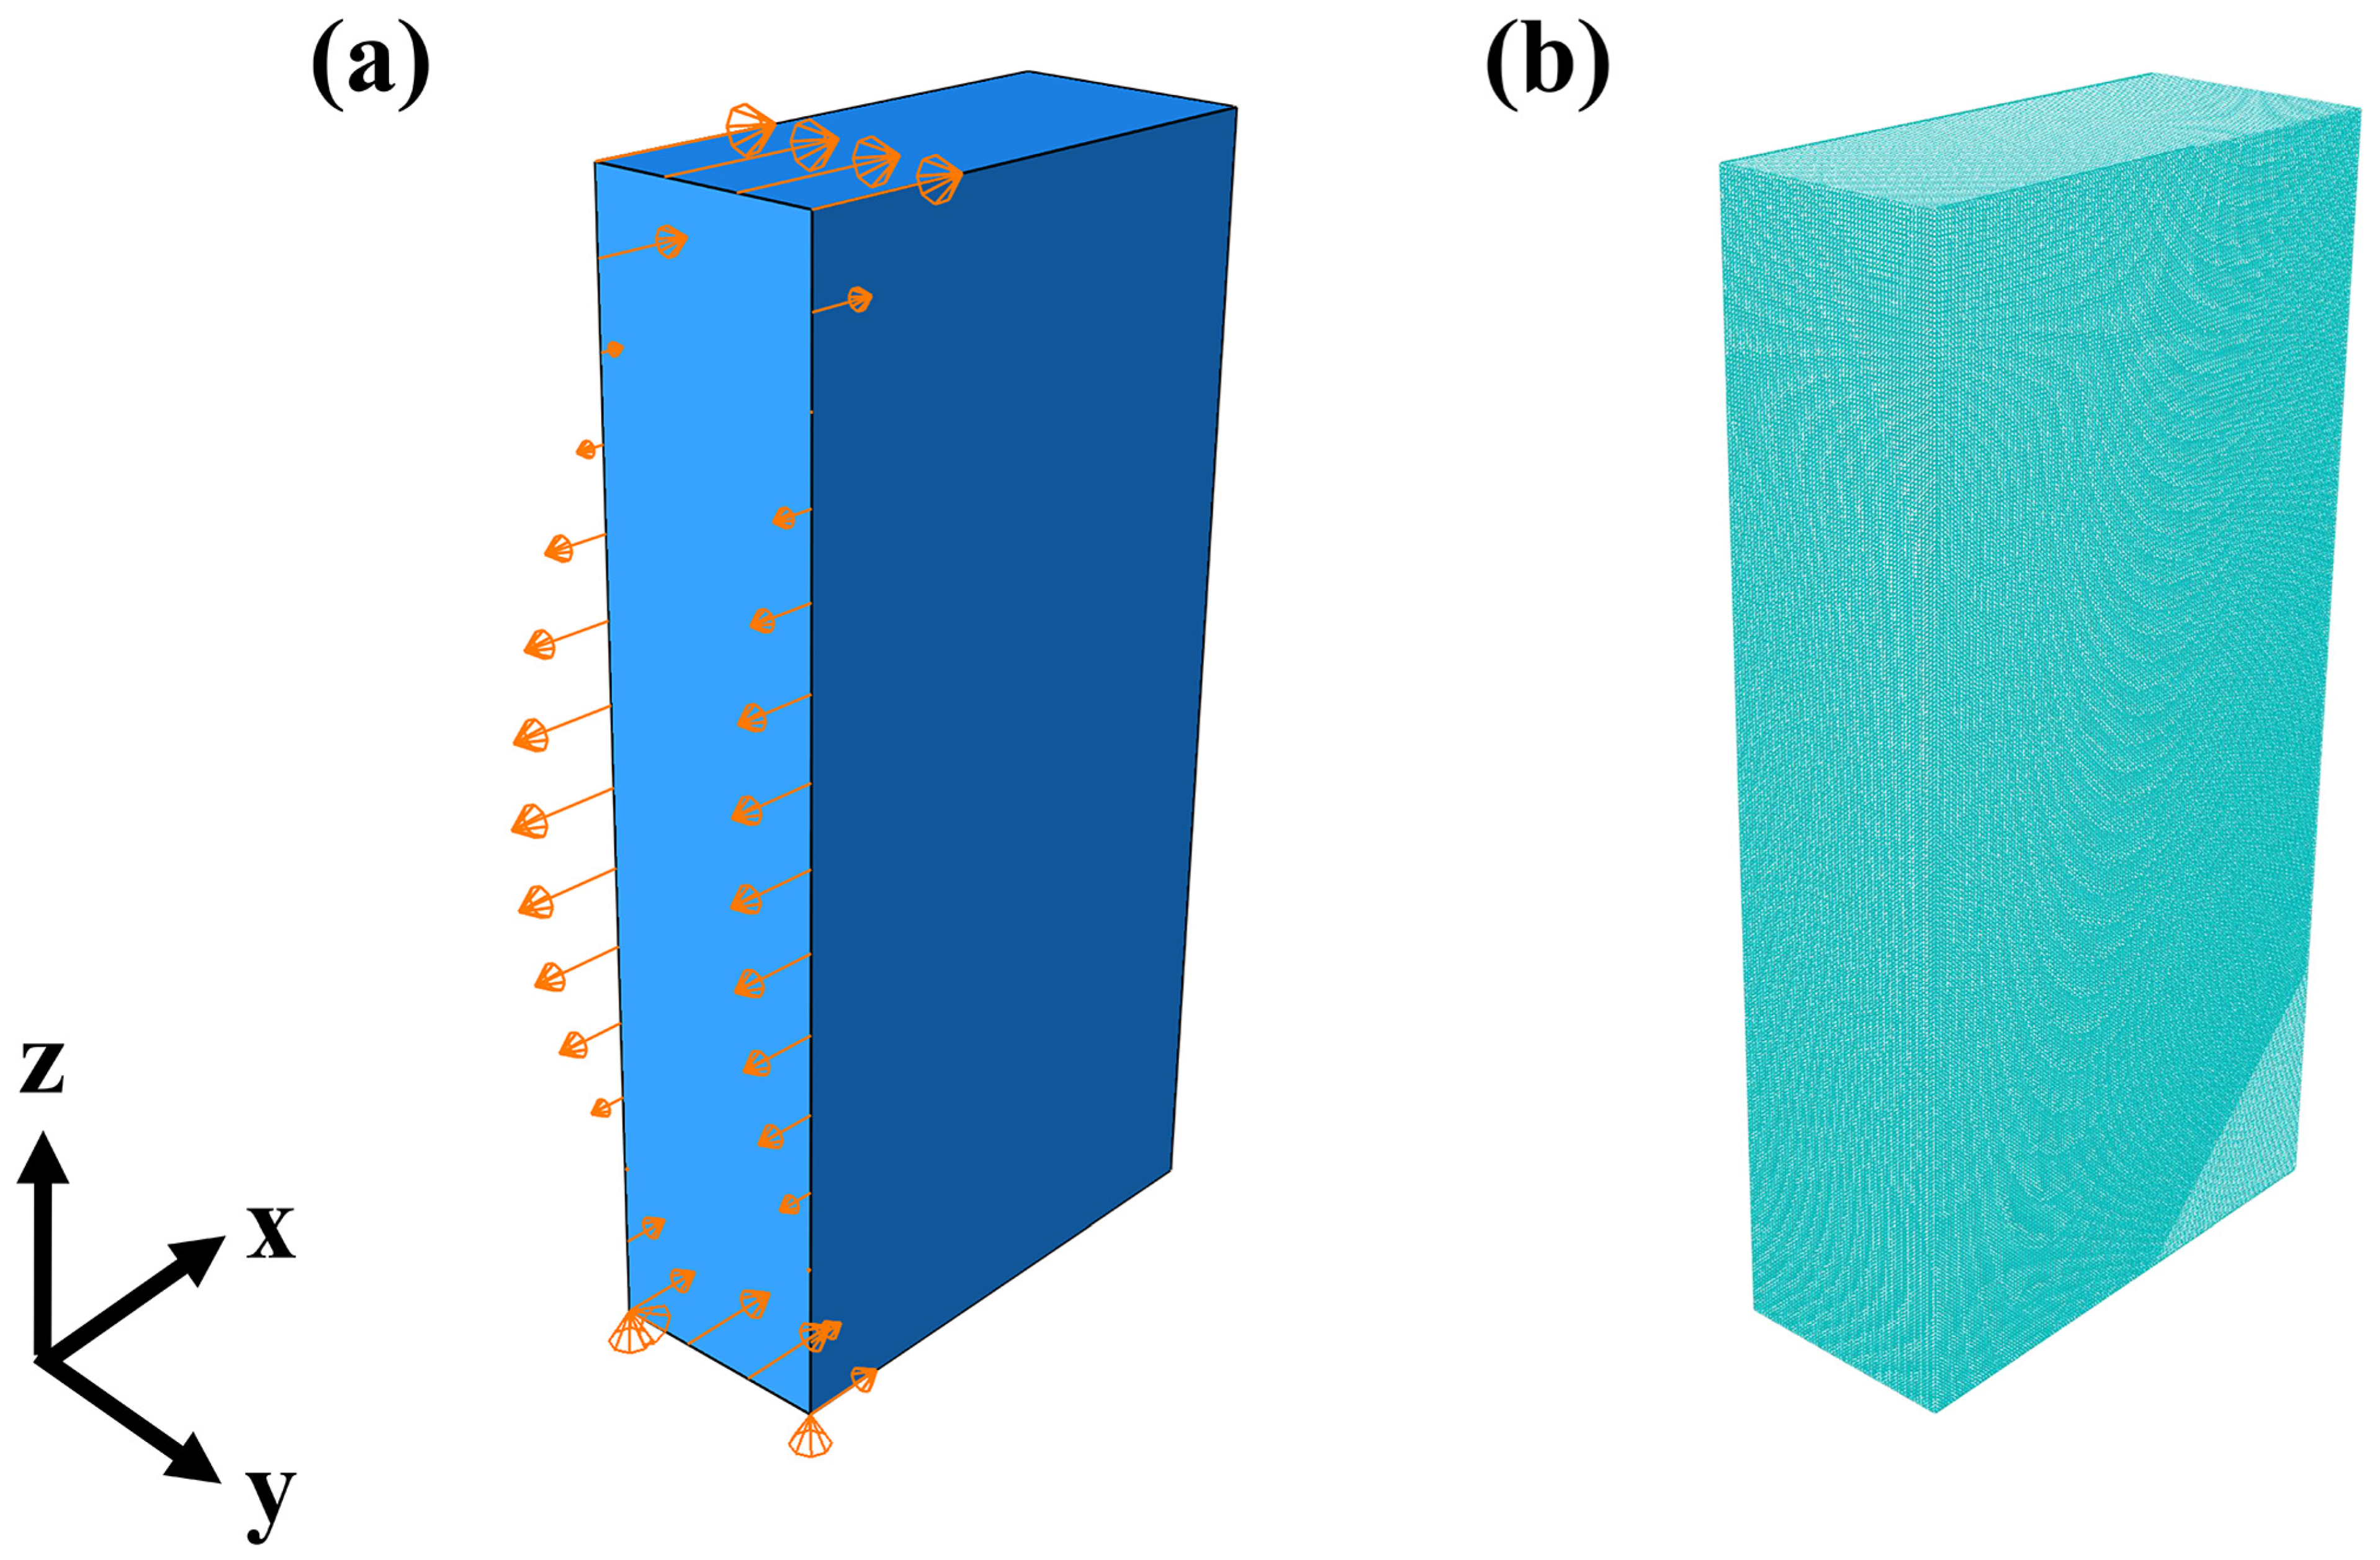
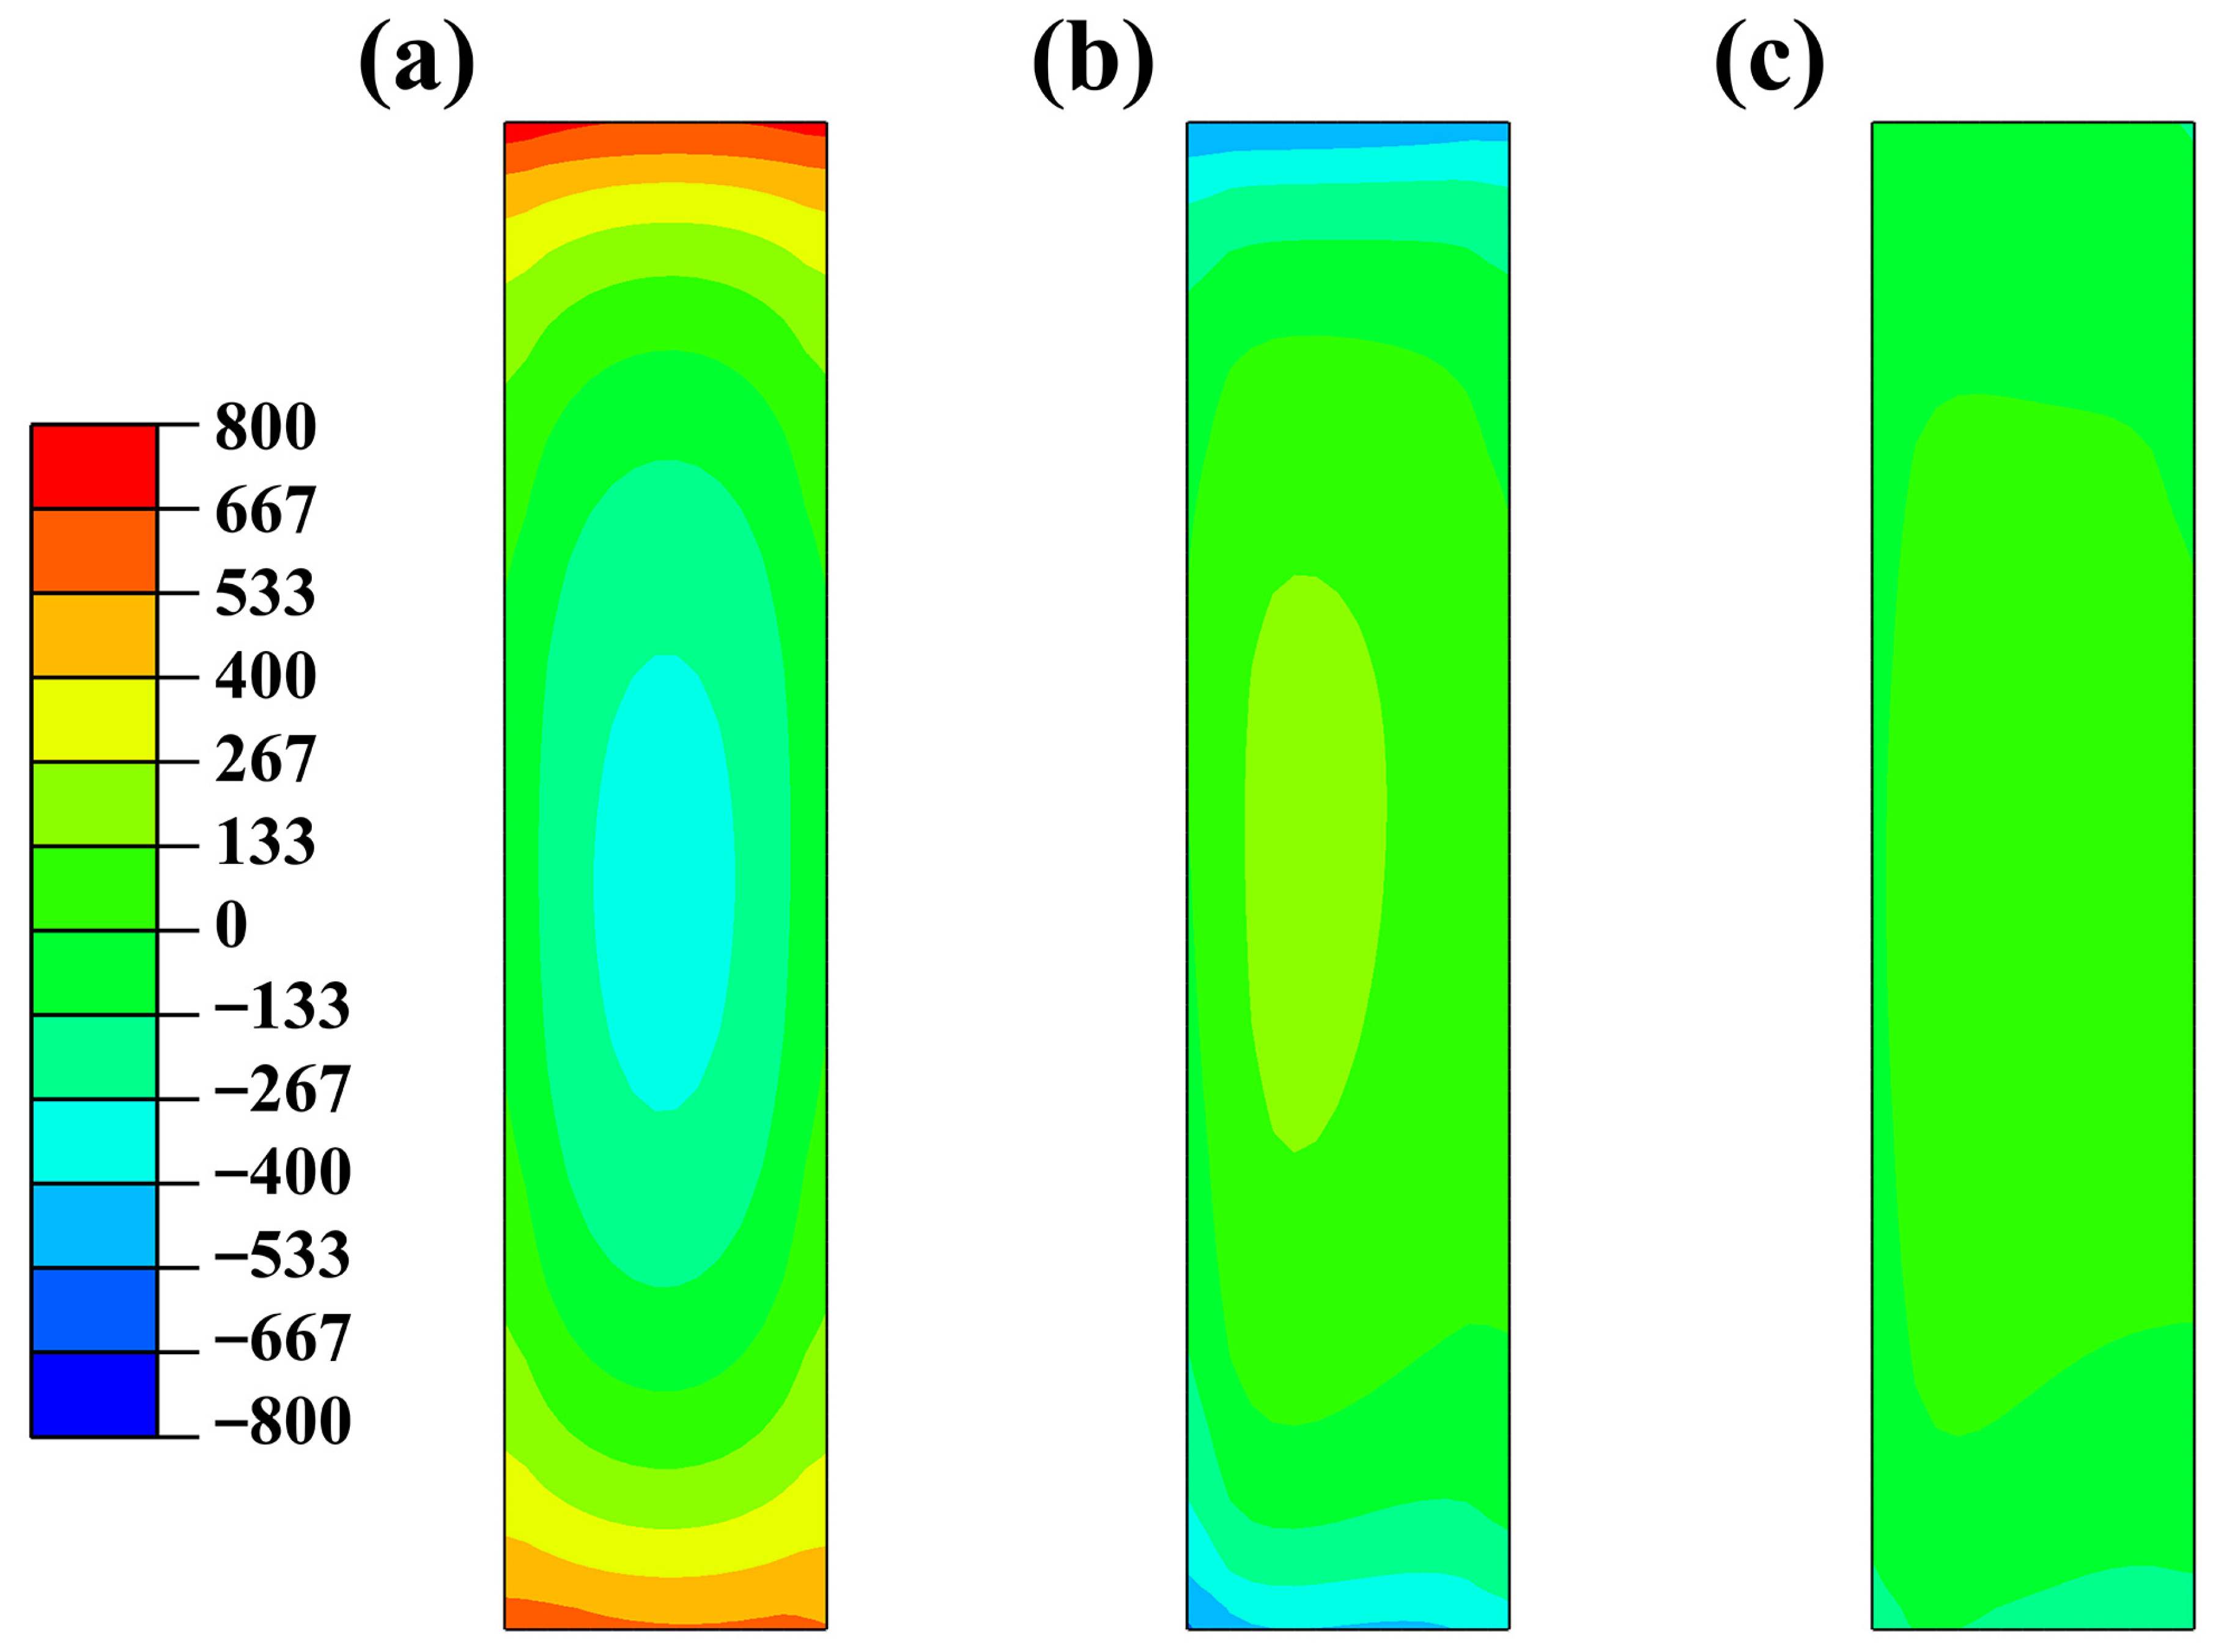
3.4. Residual Stress

The contour deformation surface obtained via CMM measurement and the one obtained after smoothing are shown in Figure 9.
In the pre-processing of contour method data, the averaging of the contour point cloud can eliminate the errors resulting from the unbalanced release of residual stress during the cutting process. Taking the measurement results of the AB sample as an example, the coordinates of points on the vertical symmetric path of yoz plane are extracted from Figure 9a,d and the xoz diagram is drawn, as shown in Figure 10. It can be observed in the figure that the cross-sectional contours on both sides after cutting are in an anti-symmetric distribution, which is caused by the unbalanced release of stress during the cutting process. The averaging process can effectively eliminate this error.
A 1/2 specimen finite element model is established based on the dimensions of the cut specimen for stress reconstruction. In the finite element model, second-order reduced-integration hexahedral elements (C3D8R) are selected, with a mesh size of 0.25 mm. The contour data obtained after the smoothing process are reversely input into the finite element model as displacement boundary conditions by means of interpolation. Secondly, the displacements in the y and z directions are constrained at the two intersection points of the end-face and the outer wall surface of the three-dimensional geometric model, and the rotational degrees of freedom in the x direction of the entire model are constrained to suppress the rigid-body motion of the three-dimensional geometric model, as shown in Figure 11.
Figure 12 illustrates the standard residual stress distribution in the yoz section for the AB, ST, and ST + AT samples. In addition, the distribution of residual stress on the vertical symmetrical path in the middle of the yoz plane of AB, ST, and ST + AT samples is shown in Figure 13. A thorough examination of the results reveals that the presence of external tensile stress and internal compressive stress characterizes the residual stress distribution of the AB sample (Figure 12a). Notably, the maximum tensile stress observed in the AB sample is 757 MPa. When the newly added material is heated and fused during the subsequent deposition layer, it will first expand and then shrink after solidification, while the cold underlayer has smaller thermal deformation and restricts the shrink of the newly deposited material, which causes tensile stress to the new layer but compressive stress to the underlying material. This results in the accumulation of residual stress in the alloy during the subsequent layer-by-layer scanning iteration process, resulting in the residual stress distribution of the AB sample.
The residual stress distribution of the ST (Figure 12b) and ST + AT (Figure 12c) samples is antithetical to the AB samples, manifesting as external compressive stress and internal tensile stress. This phenomenon occurs due to the existence of a temperature gradient between the exterior and interior of the alloy during the cooling process in ambient air. The exterior of the alloy undergoes cooling and contraction, while the interior of the alloy impedes the external contraction, thereby generating compressive stress on the external material and tensile stress on the internal material. Furthermore, a comparison of the internal residual stress levels of the ST and ST + AT samples with those of the AB sample reveals a significant stress reduction. The maximum tensile stress of the ST sample was calculated to be 163 MPa, while the maximum tensile stress of the ST + AT sample was approximately 71 MPa.

4. Discussion

As previously indicated, the complex melt flow and extreme thermal history during the LPBF process leads to a distribution of distinct cellular and columnar sub-grain microstructures within the AB samples, without γ′ phase precipitation. Moreover, during the layer-by-layer printing process, a significant amount of residual stress accumulates within the alloy. The residual stress manifests as external tensile stress and internal compressive stress. Additionally, the molten pool immediately melts, cools, and solidifies layer by layer in the building direction during the LPBF process. Consequently, columnar grains are generated within the molten pool along the direction where the temperature gradient decreases. Furthermore, due to the overlap of laser scanning in subsequent layers, the columnar grains undergo epitaxial growth across the boundaries of the molten pool. The temperature gradient gradually decreases from the bottom to the top of the molten pool, while the solidification rate gradually increases. Consequently, the upper portion of the molten pool is conducive to the formation of cellular equiaxed grains, given its low-temperature gradient and high solidification rate. Therefore, the IPF maps of sample AB show that equiaxed grains dominate the horizontal section, whereas columnar grains are more prevalent in the vertical section.
After solution heat treatment, the measurement results obtained using the contour method demonstrate that the residual stress level in the as-built alloy is significantly decreased, accompanied by a shift in the residual stress distribution towards compressive stress on the exterior and tensile stress on the interior. In terms of microstructure, the cellular and columnar sub-grain structures observed in sample AB are melted into the matrix during the solution treatment process and, as a result, cannot be observed in the ST specimen. The segregation of strengthening phase-forming elements (such as Al, Ti, Nb, etc.) at the boundaries of sub-grain structures and grain boundaries leads to the precipitation of the γ′ phase with a certain orientation of arrangement. In terms of grain characteristics, compared with the AB sample, there is no significant variation in the equiaxed grain morphology or the mean grain size within the horizontal section of the ST sample. However, in the vertical section, the columnar grains exhibit signs of becoming equiaxed and undergoing grain refinement. This phenomenon can be attributed to the elevated degree of recrystallization within the alloy resulting from the solution treatment. Previous studies have shown that an equiaxed grain structure can effectively inhibit the propagation of cracks in AM-processed Ni-based superalloys [31]. It can thus be concluded that the large residual stress accumulated during the LPBF process serves as a driving force for recrystallization and γ′ phase nucleation during the solution treatment process. As the alloy undergoes recrystallization and γ′ phase precipitation, the residual stress is relaxed, leading to a significant decrease in the residual stress levels, as evidenced by the contour method test results.
After aging heat treatment, measurements taken using the contour method indicate that the residual stress level in the ST + AT sample is further reduced compared to the ST sample. Additionally, the distribution of residual stress remains consistent with that of the ST sample. The average size of the γ′ phase in the ST + AT sample is larger in comparison to the ST sample, and its size and distribution are more homogenous. The alloy’s internal recrystallization process is inhibited by the expansion of the γ′ phase during aging treatment [32,33]. In terms of grain characteristics, compared with ST samples, the morphology and average grain size of equiaxed grains in the ST + AT samples’ horizontal section exhibit no significant alterations. During the long aging period, the growth of recrystallized grains resulting from solution treatment and the random merging of grains contributes to an increase in the average grain size observed in the vertical section. In addition, the random coalescence of grains during the aging treatment contributes to the relaxation of intergranular residual stress.
Figure 14 shows the grain boundary distribution of the samples in three different states. The AB sample exhibits the highest proportion of high-angle grain boundaries (HAGBs) and the lowest proportion of low-angle grain boundaries (LAGBs). Previous investigations have demonstrated that LAGBs are composed of dislocation arrays, the quantity of which correlates to the dislocation density within the alloy, to a certain extent [34]. Furthermore, the low-melting-point eutectic phase is prone to formation at HAGBs, which increases the tendency of crack propagation [35]. Conversely, HAGBs have been shown to facilitate atomic diffusion, thereby promoting both recrystallization and grain nucleation. Consequently, during the solution treatment process, the proportion of HAGBs in the ST sample decreases due to grain recrystallization, while the density of LAGBs increased. After the aging treatment, the quantity of LAGBs in ST + AT samples increases, indicating a rise in dislocation density, which enhances mechanical properties. Concurrently, the proportion of internal HAGBs is marginally diminished due to the random merging of grains during the aging process, thereby mitigating the propensity for crack propagation along HAGBs.
Furthermore, Aztec Crystal software was also employed to calculate and statistically analyze the kernel average misorientation (KAM) in both the horizontal and vertical sections of the samples across three different states. The results are illustrated in Figure 15. The KAM method, which can characterize the local misorientation, is commonly used to assess the dislocation density. It is important to note that the evaluation of dislocation density from KAM is lower than the actual density because the KAM method only considers geometrically necessary dislocations (GNDs) in the microstructure [36]. Nevertheless, using KAM to evaluate the dislocation density remains of certain reference significance, and a large KAM value represents a high dislocation density [37]. It can be observed that the average KAM values in both the horizontal and vertical sections of the AB sample decrease after solution treatment. This may be due to the uniform diffusion of solute atoms during the solution treatment process, which reduces the local lattice distortion and consequently decreases the orientation difference between grains. After the aging treatment of the ST sample, there was a noticeable increase in average KAM values in both the horizontal and vertical sections. This increase is likely due to the formation of the γ′ phase during the aging process, which induces local lattice distortion and results in a greater orientation difference between the grains. In addition, the average KAM value of the horizontal section of the three state samples is larger than that of the vertical section, which means that the dislocation density in the horizontal section is higher than that in the corresponding vertical section. As indicated by previous research, the high dislocation density present in AM-processed Ni-based superalloys has the capacity to absorb energy and alleviate stress concentration, thereby impeding the occurrence of cracking [38].

5. Conclusions

The effect of heat treatment on microstructure and residual stress of the Ni-Co-based superalloy fabricated using Laser Powder Bed Fusion was studied. The conclusions are drawn as described below:
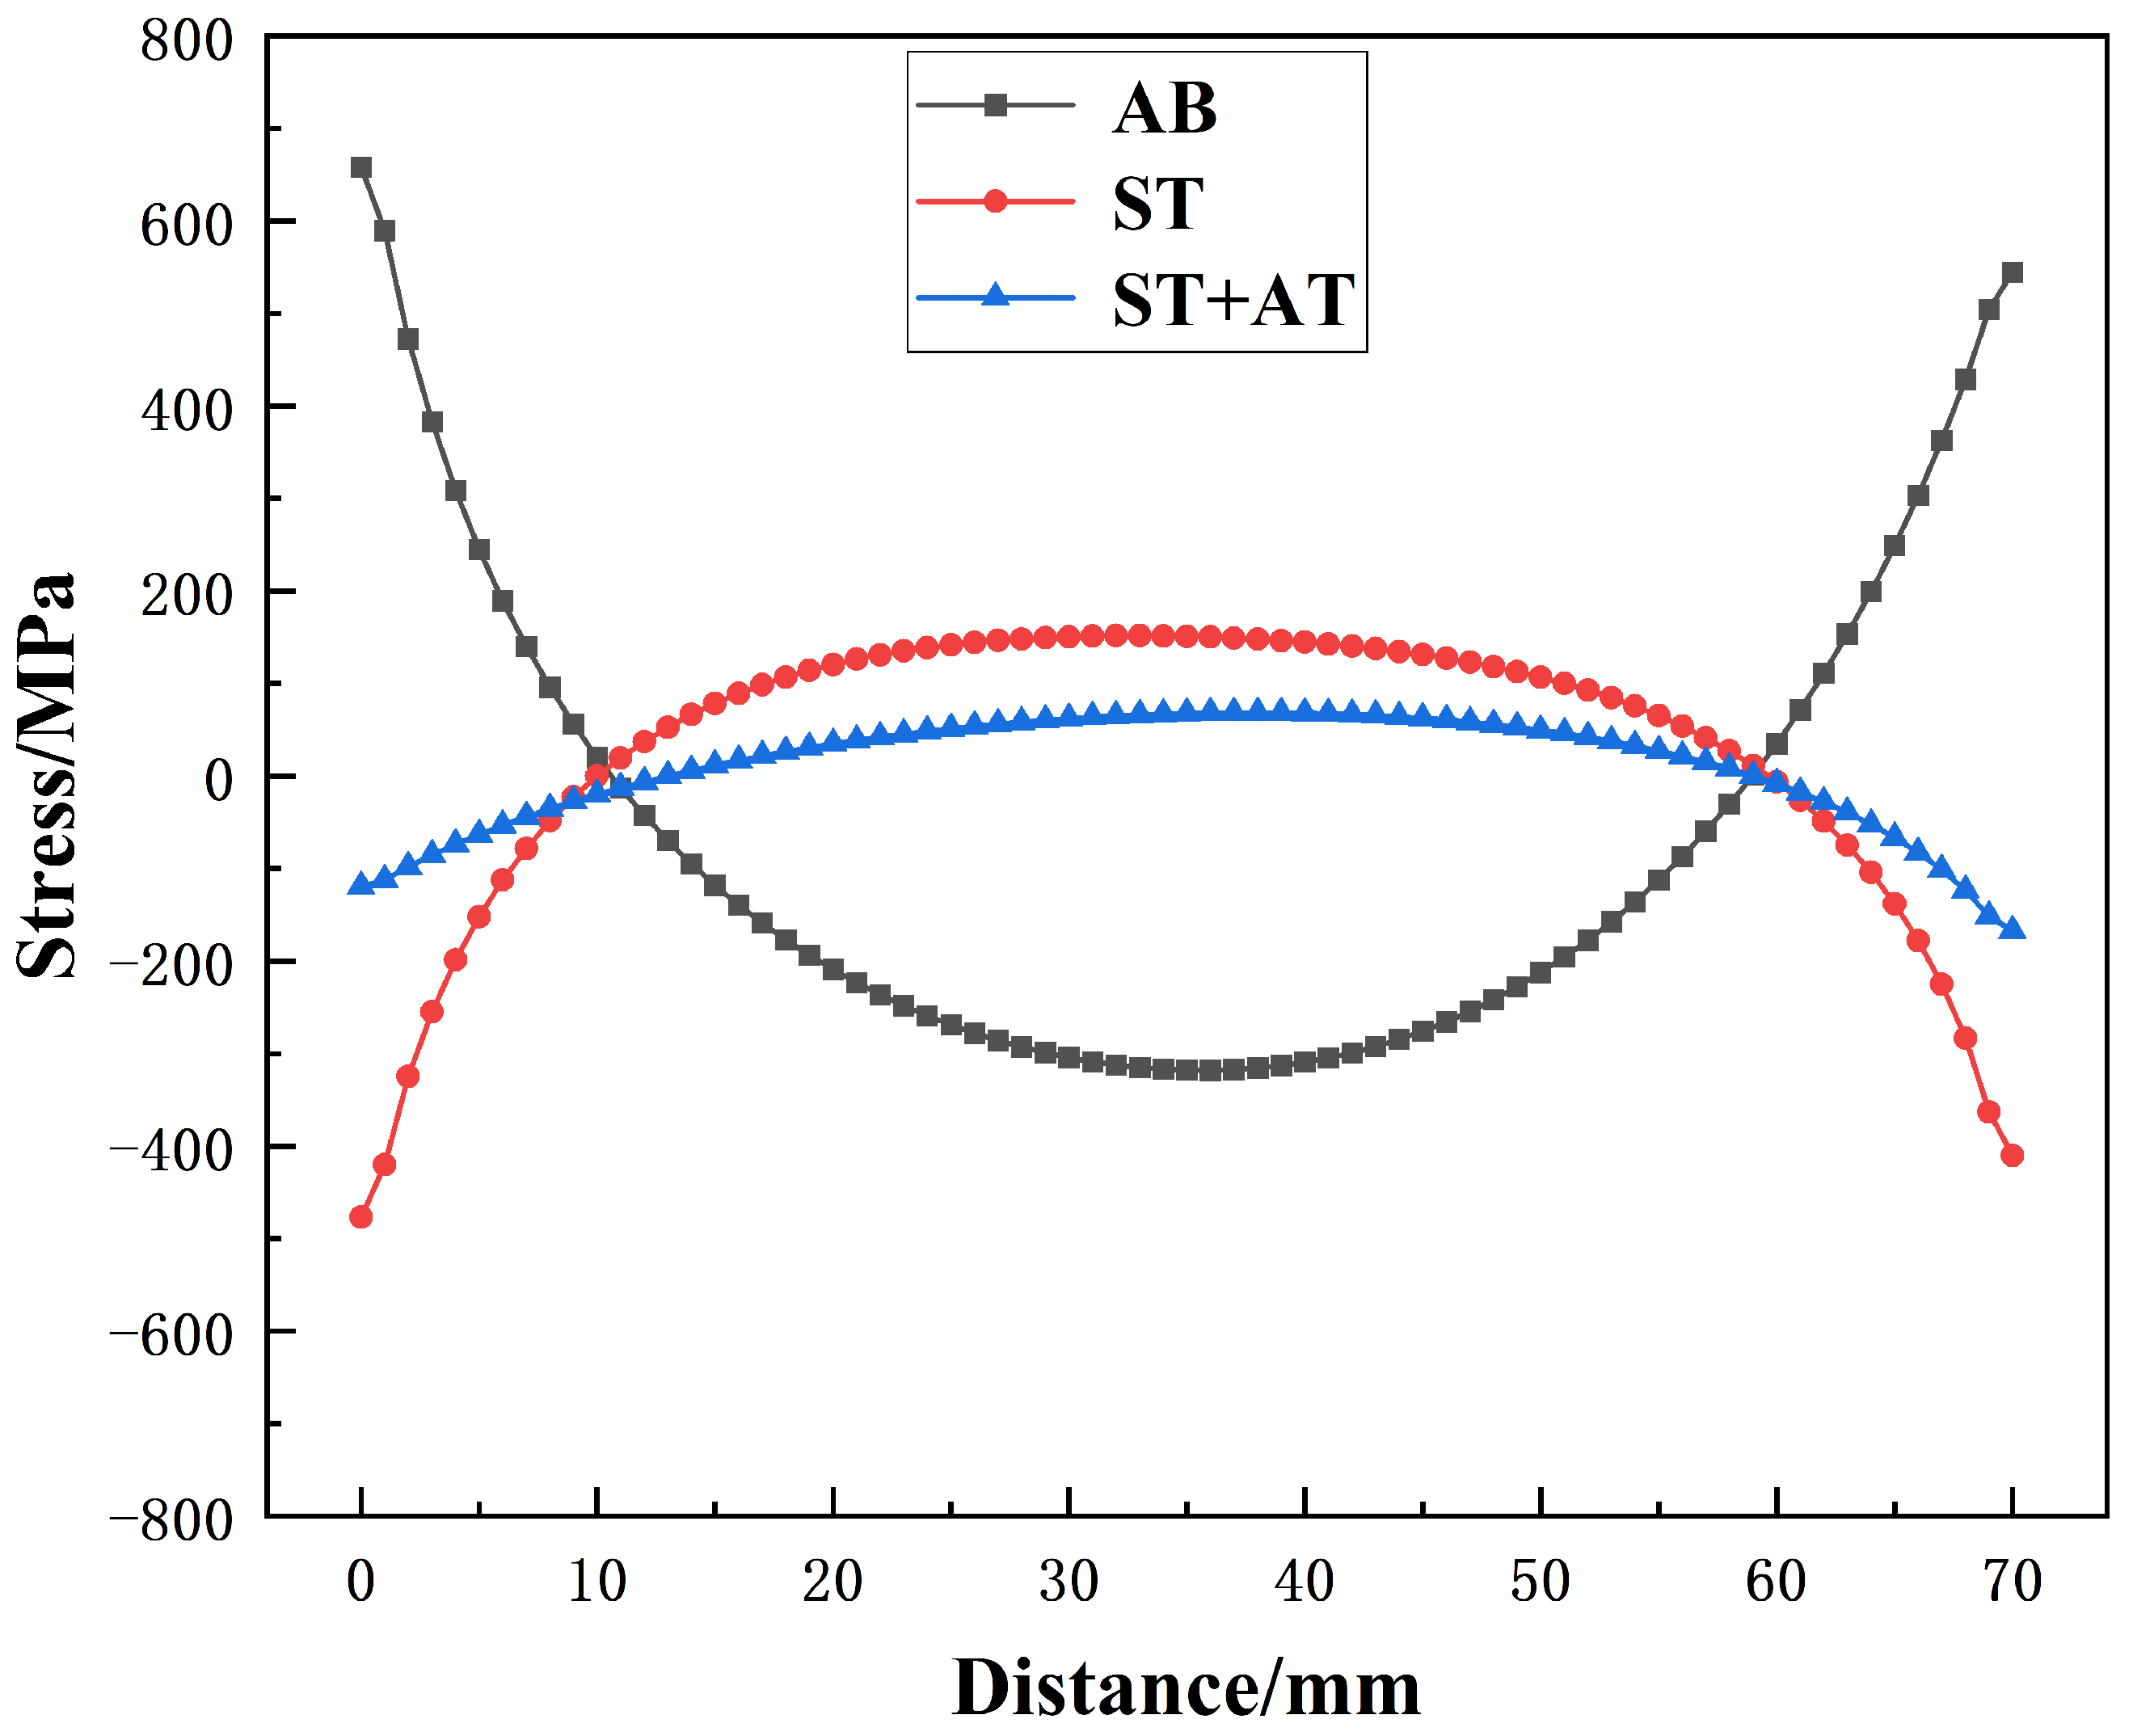
  • The as-built Ni-Co-based superalloy primarily consists of a single γ phase without the generation of the γ′ phase. In addition, cellular and columnar sub-grain structures can be observed in both the horizontal and vertical planes. EBSD results show that columnar crystals predominate in the vertical section, whereas equiaxed crystals are more prevalent in the horizontal section. Furthermore, the average dimensions of the columnar crystals exceed those of the equiaxed crystals, as well as the width of an individual molten pool. The contour test results show that there is a significant level of residual stress (maximum tensile stress: 757 MPa) in the as-built Ni-Co-based superalloy, and this residual stress is in the form of external tensile stress and internal compressive stress.
  • After solution treatment, the cellular/columnar substructure in the nickel-cobalt-based superalloy disappears, while the γ′ phase precipitates in large quantities. The columnar grains in the vertical section are equiaxed and refined due to recrystallization. In addition, the high level of residual stress in the alloy acts as a driving force for recrystallization and γ′ phase nucleation during the solution treatment process, which is greatly reduced after the solution treatment. Consequently, the ST sample exhibited a lower residual stress level internally, with a maximum tensile stress of 163 MPa.
  • After aging treatment, the average size of the γ′ phase in the alloy increases compared with the ST sample, which inhibits the recrystallization process. The growth of recrystallized grains and the random merging between grains during aging treatment led to an increase in average grain size. In addition, the random coalescence between grains also leads to the relaxation of intergranular residual stress, and the ST + AT sample exhibits a reduced level of residual stress (maximum tensile stress: 71 MPa).

Author Contributions

Conceptualization, C.W. and X.L.; Data curation, C.W.; Formal analysis, R.Z. and X.L.; Funding acquisition, X.L.; Investigation, C.W.; Methodology, C.W.; Project administration, M.L. and D.C.; Resources, M.L. and D.C.; Software, R.Z.; Supervision, M.L. and D.C.; Validation, R.Z.; Visualization, R.Z.; Writing—original draft, C.W.; Writing—review & editing, X.L., M.L. and D.C. All authors have read and agreed to the published version of the manuscript.

Funding

This work was supported by the China National Nuclear Corporation (Grant No. FY222506000101).

Data Availability Statement

The original contributions presented in this study are included in the article. Further inquiries can be directed to the corresponding author.

Acknowledgments

The authors gratefully acknowledge all the researchers and laboratories for providing the experimental facilities.

Conflicts of Interest

Author Renren Zheng is employed by the company Beijing Gaona Materials and Technology Co., Ltd. The remaining authors declare that the research was conducted in the absence of any commercial or financial relationships that could be construed as a potential conflict of interest.

References

  1. Bai, Y.; Zhang, R.; Cui, C.; Zhou, Y.; Sun, X. In-situ observation of Ni-Co based wrought superalloy high-temperature deformation: Lattice rotation and grain boundary response. Mater. Res. Lett. 2024, 12, 869–876. [Google Scholar]
  2. Kalahroudi, F.J.; Lin, F.; Krakhmalev, P.; Grehk, M. Microstructure and Fatigue Behavior of PM-HIPed Ni-Based Superalloys and Martensitic Tool Steels: A Review. Metals 2024, 14, 1159. [Google Scholar] [CrossRef]
  3. Wu, Y.; Gao, J.; Zhang, X.; Zheng, J.; Hui, X. The Effects of Microstructure on the Thermophysical Properties of the K439B Ni-Based Superalloy. Metals 2024, 14, 1074. [Google Scholar] [CrossRef]
  4. Hu, J.-C.; Huang, H.-L.; Wu, C.-C.; Sun, X.-Y.; Wang, J.; Yang, Y.-H.; Qu, J.-L.; Jiang, L.; Dou, J.-H.; Chen, Y. Oxidation behavior of Ni-based superalloy GH4738 under tensile stress. Rare Metals 2024, 43, 3913–3920. [Google Scholar]
  5. Mostafaei, A.; Ghiaasiaan, R.; Ho, I.-T.; Strayer, S.; Chang, K.-C.; Shamsaei, N.; Shao, S.; Paul, S.; Yeh, A.-C.; Tin, S.; et al. Additive manufacturing of nickel-based superalloys: A state-of-the-art review on process-structure-defect-property relationship. Prog. Mater. Sci. 2023, 136, 101108. [Google Scholar]
  6. Li, Y.; Jiang, D.; Zhu, R.; Yang, C.; Wang, L.; Zhang, L.-C. Revolutionizing medical implant fabrication: Advances in additive manufacturing of biomedical metals. Int. J. Extrem. Manuf. 2024, 7, 022002. [Google Scholar]
  7. Mannava, V.; Saravanan, T.; Sabari, S.R.; Koundinya, N.; Venugopal, A.; Murty, S.; Govind, B.; Kamaraj, M.; Kottada, R.S. A distinct role of microstructure on hot corrosion behaviour of additively manufactured IN718. Corros. Sci. 2024, 241, 112550. [Google Scholar]
  8. Prabhu, T.R.; Moganraj, A.; Samuel, M.S.; Praveenkumar, K.; Bobby, S.S.; Prakasam, A. Effect of heat treatment on microstructure and high-temperature wear performance of additive manufactured IN718. J. Manuf. Process. 2024, 127, 683–697. [Google Scholar]
  9. Wang, H.; Li, B.; Lei, L.; Xuan, F. Multi-physics information-integrated neural network for fatigue life prediction of additively manufactured Hastelloy X superalloy. Virtual Phys. Prototyp. 2024, 19, e2368652. [Google Scholar]
  10. Tekoglu, E.; Bae, J.-S.; Kim, H.-A.; Lim, K.-H.; Liu, J.; Doležal, T.D.; Kim, S.Y.; Alrizqi, M.A.; Penn, A.; Chen, W.; et al. Superior high-temperature mechanical properties and microstructural features of LPBF-printed In625-based metal matrix composites. Mater. Today 2024, 80, 297–307. [Google Scholar]
  11. Basak, A. Additive Manufacturing of High-Gamma Prime Nickel-Based Superalloys Through Selective Laser Melting (SLM); University of Texas at Austin: Austin, TX, USA, 2019. [Google Scholar]
  12. Zhang, F.; Zhou, L.; Xie, X.; Zhang, Z.; Chao, Q.; Fan, G. Crack inhibition and crystallographic texture control in an additively manufactured IN738LC Ni-based superalloy. J. Mater. Res. Technol. 2024, 33, 652–666. [Google Scholar] [CrossRef]
  13. Guo, C.; Li, S.; Shi, S.; Li, X.; Hu, X.; Zhu, Q.; Ward, R.M. Effect of processing parameters on surface roughness, porosity and cracking of as-built IN738LC parts fabricated by laser powder bed fusion. J. Mater. Process. Technol. 2020, 285, 116788. [Google Scholar] [CrossRef]
  14. Parent, P.-N.; Paris, J.-Y.; Alexis, J.; Boher, C. Influence of the scanning strategy on the microstructure and the tribological behavior of a Ni-based superalloy processed by L-PBF additive manufacturing. Wear 2025, 564, 205671. [Google Scholar]
  15. Xu, J.; Ding, Y.; Gao, Y.; Wang, H.; Hu, Y.; Zhang, D. Grain refinement and crack inhibition of hard-to-weld Inconel 738 alloy by altering the scanning strategy during selective laser melting. Mater. Des. 2021, 209, 109940. [Google Scholar] [CrossRef]
  16. Liu, S.; Liu, C.; Gao, X.; Wen, X.; Qiao, S.; Yuan, C. Insights into process optimization and induction preheating for crack-free laser metal deposition of nickel-based superalloy K417G. J. Mater. Res. Technol. 2024, 29, 2035–2050. [Google Scholar] [CrossRef]
  17. DebRoy, T.; Wei, H.L.; Zuback, J.S.; Mukherjee, T.; Elmer, J.W.; Milewski, J.O.; Beese, A.M.; Wilson-Heid, A.D.; De, A.; Zhang, W. Additive manufacturing of metallic components–process, structure and properties. Prog. Mater. Sci. 2018, 92, 112–224. [Google Scholar] [CrossRef]
  18. Prime, M.B. Cross-sectional mapping of residual stresses by measuring the surface contour after a cut. J. Eng. Mater. Technol. 2001, 123, 162–168. [Google Scholar]
  19. Bueckner, H.F. The propagation of cracks and the energy of elastic deformation. Trans. Am. Soc. Mech. Eng. 1958, 80, 1225–1229. [Google Scholar] [CrossRef]
  20. Pollard, J.; Rahimi, S.; Watford, A.; Jackson, M.; Wynne, B. The Determination of Residual Stress in Extruded Ti-6Al-4V by Contour Method and Finite Element Analysis. In Proceedings of the 13th World Conference on Titanium, San Diego, CA, USA, 16–20 August 2015; Wiley Online Library: Hoboken, NJ, USA, 2016. [Google Scholar]
  21. Danis, Y.; Lacoste, E.; Arvieu, C. Numerical modeling of inconel 738LC deposition welding: Prediction of residual stress induced cracking. J. Mater. Process. Technol. 2010, 210, 2053–2061. [Google Scholar] [CrossRef]
  22. Popov, V.; Katz-Demyanetz, A.; Bamberger, M. Heat transfer and phase formation through EBM 3D-printing of Ti-6Al-4V cylindrical parts. in Defect and diffusion forum. Defect Diffus. Forum 2018, 383, 190–195. [Google Scholar] [CrossRef]
  23. Grange, D.; Bartout, J.-D.; Macquaire, B.; Colin, C. Processing a non-weldable nickel-base superalloy by Selective Laser Melting: Role of the shape and size of the melt pools on solidification cracking. Materialia 2020, 12, 100686. [Google Scholar]
  24. Zhang, X.; Liang, Y.; Yi, F.; Liu, H.; Zhou, Q.; Yan, Z.; Lin, J. Anisotropy in microstructure and mechanical properties of additively manufactured Ni-based GH4099 alloy. J. Mater. Res. Technol. 2023, 26, 6552–6564. [Google Scholar]
  25. Dong, J.; Yu, H.; Cao, R.; Liu, Z.; Wang, X.; Wang, J.; Bi, Z. The effect of pre-strain on textures, nano-twins and mechanical properties of a novel Nickel-based superalloy GH4251 with low stacking fault energy. Mater. Sci. Eng. A 2024, 915, 147271. [Google Scholar]
  26. Cao, Y.; Bai, P.; Liu, F.; Hou, X. Grain growth in IN718 superalloy fabricated by laser additive manufacturing. Mater. Sci. Technol. 2020, 36, 765–769. [Google Scholar]
  27. Wang, Y.; Shi, J.; Liu, Y. Competitive grain growth and dendrite morphology evolution in selective laser melting of Inconel 718 superalloy. J. Cryst. Growth 2019, 521, 15–29. [Google Scholar]
  28. Zinovieva, O.; Zinoviev, A.; Ploshikhin, V. Three-dimensional modeling of the microstructure evolution during metal additive manufacturing. Comput. Mater. Sci. 2018, 141, 207–220. [Google Scholar]
  29. Zhang, X.; Xu, H.; Li, Z.; Dong, A.; Du, D.; Lei, L.; Zhang, G.; Wang, D.; Zhu, G.; Sun, B. Effect of the scanning strategy on microstructure and mechanical anisotropy of Hastelloy X superalloy produced by Laser Powder Bed Fusion. Mater. Charact. 2021, 173, 110951. [Google Scholar]
  30. Sharma, J.; Nicolaÿ, A.; De Graef, M.; Bozzolo, N. Phase discrimination between δ and η phases in the new nickel-based superalloy VDM Alloy 780 using EBSD. Mater. Charact. 2021, 176, 111105. [Google Scholar]
  31. Zhang, Z.; Han, Q.; Yang, S.; Yin, Y.; Gao, J.; Setchi, R. Laser powder bed fusion of advanced submicrometer TiB2 reinforced high-performance Ni-based composite. Mater. Sci. Eng. A 2021, 817, 141416. [Google Scholar]
  32. Zhang, H.; Chen, K.; Lin, S.; Fu, R.; Zhang, B.; Ding, J.; Feng, Z.; Huang, X.; Ma, E. Recovery facilitated by interphase boundary motion circumvents recrystallization in superalloy single crystals. Mater. Res. Lett. 2024, 12, 180–189. [Google Scholar]
  33. Buerstmayr, R.; Theska, F.; Kozeschnik, E.; Webster, R.F.; Lison-Pick, M.; Street, S.; Primig, S. Investigation and simulation of the effects of nm-scale γ′ Precipitates on the recrystallization of Ni-based superalloys. Metall. Mater. Trans. A 2023, 54, 2259–2276. [Google Scholar]
  34. Liang, S.; Yan, W. Study on the micro-structure and the nano-indentation responses of laser solid formed epitaxial Ni-based superalloy. J. Alloys Compd. 2022, 921, 166091. [Google Scholar]
  35. Chauvet, E.; Kontis, P.; Jägle, E.A.; Gault, B.; Raabe, D.; Tassin, C.; Blandin, J.-J.; Dendievel, R.; Vayre, B.; Abed, S.; et al. Hot cracking mechanism affecting a non-weldable Ni-based superalloy produced by selective electron Beam Melting. Acta Mater. 2018, 142, 82–94. [Google Scholar]
  36. Betanda, Y.A.; Helbert, A.L.; Brisset, F.; Mathon, M.H.; Waeckerlé, T.; Baudin, T. Measurement of stored energy in Fe–48% Ni alloys strongly cold-rolled using three approaches: Neutron diffraction, Dillamore and KAM approaches. Mater. Sci. Eng. A 2014, 614, 193–198. [Google Scholar]
  37. Calcagnotto, M.; Ponge, D.; Demir, E.; Raabe, D. Orientation gradients and geometrically necessary dislocations in ultrafine grained dual-phase steels studied by 2D and 3D EBSD. Mater. Sci. Eng. A 2010, 527, 2738–2746. [Google Scholar]
  38. Zhao, Y.; Ma, Z.; Yu, L.; Liu, Y. New alloy design approach to inhibiting hot cracking in laser additive manufactured nickel-based superalloys. Acta Mater. 2023, 247, 118736. [Google Scholar]
Figure 1. SEM micrographs of pre-alloyed powder of the Ni-Co-based superalloy.
Metals 15 00405 g001
Figure 2. (a) Schematic of L-PBF build with reference to BD. (b) Schematic of sample sectioning for microstructure characterization and the contour method measurements.
Metals 15 00405 g002
Figure 3. Background of contour method: (a) initial residual stress state, (b) deformed shape after cutting (elastic spring-back), and (c) forcing deformed surface back to original shape.
Metals 15 00405 g003
Figure 4. (a) The cutting surface of the sample. (b) The measurement process of the cutting surface deformation contour of the sample.
Metals 15 00405 g004
Figure 5. SEM images of the microstructure for the as-built (AB) alloy in the vertical (YZ) and horizontal (XY) sections: (a1d1) the horizontal cross-section; (a2d2) the vertical cross-section.
Metals 15 00405 g005
Figure 6. SEM images of the microstructure for the sample of ST and ST + AT in the vertical (YZ) and horizontal (XY) sections: (a1,b1) ST in the vertical section; (c1,d1) ST in the horizontal section; (a2,b2) ST + AT in the vertical section; (c2,d2) ST + AT in the horizontal section.
Metals 15 00405 g006
Figure 7. The statistical results of γ′ phase particle size of the ST and ST + AT in vertical (YZ) and the horizontal (XY) sections: (a1) ST in the horizontal section; (b1) ST in the vertical section; (a2) ST + AT in the horizontal section; (b2) ST + AT in the vertical section.
Metals 15 00405 g007
Figure 8. EBSD maps and statistical results of grain size in the horizontal (XY) section: (a1,a2) AB; (b1,b2) ST; (c1,c2) ST + AT; EBSD maps and statistical results of grain size in the vertical (YZ) section: (a3a5) AB; (b3b5) ST; (c3c5) ST + AT.
Metals 15 00405 g008
Figure 9. Contour cloud maps of CMM contour measurement before and after pre-processing. (ac) CMM measurement cloud maps of the left and right contours of AB, ST, and ST + AT specimens after wire-cutting. (df) Contour cloud maps of AB, ST, and ST + AT specimens after the averaging and smoothing processes.
Metals 15 00405 g009
Figure 10. The influence of averaging processing on CMM contour measurement.
Metals 15 00405 g010
Figure 11. Finite element model for stress reconstruction: (a) boundary conditions; (b) mesh.
Metals 15 00405 g011
Figure 12. The distribution of residual stress (MPa) in the normal direction of the cutting surface for different specimens: (a) AB; (b) ST; (c) ST + AT.
Metals 15 00405 g012
Figure 13. The distribution of residual stress on the vertical symmetrical path in the middle of the yoz plane of AB, ST, and ST + AT samples.
Metals 15 00405 g013
Figure 14. The EBSD images showing the grain boundary maps (black represents large angle grain boundaries and green represents small angle grain boundaries): (a) AB; (b) ST; (c) ST + AT; (d) The proportion of HAGBs and LAGBs.
Metals 15 00405 g014
Figure 15. KAM maps and corresponding histograms for horizontal specimens: (a1,a2) AB; (b1,b2) ST; (c1,c2) ST + AT; KAM maps and corresponding histograms for vertical specimens: (a3,a4) AB; (b3,b4) ST; (c3,c4) ST + AT.
Metals 15 00405 g015
Table 1. Nominal chemical composition of the Ni-Co-based superalloy pre-alloyed powder.
ElementsWt.%
NiBal
Cr12.0–14.0
Co24.0–26.0
W1.0–1.5
Mo2.6–3.0
C0.01–0.03
Al + Ti6.5–7.4
Nb + Ta0.8–2.0
B + Zr0.02–0.08
Table 2. Process parameters of the different treatments applied to the specimen.
SpecimenTreatment TypeTreatment
ABas-built-
STsolution treatment1070 °C/4 h/AC
ST + ATsolution treatment + aging treatment1070 °C/4 h/AC + 760 °C/16 h/AC
Table 3. Statistical table of recrystallization ratio of AB, ST, and ST + AT samples.
SpecimenRecrystallizedSub-Structured StructureDeformed
AB8.50%72.06%19.44%
ST9.54%74.09%16.37%
ST + AT8.08%69.71%22.21%
Disclaimer/Publisher’s Note: The statements, opinions and data contained in all publications are solely those of the individual author(s) and contributor(s) and not of MDPI and/or the editor(s). MDPI and/or the editor(s) disclaim responsibility for any injury to people or property resulting from any ideas, methods, instructions or products referred to in the content.

