Abstract
Metallic interconnects are key components in planar solid oxide fuel cell (SOFC) stacks. In the present study, we evaluated four Fe-Cr powder metallurgy (PM) alloy specimens, obtained from a domestic manufacturer, at nominal compositions (in wt%) of 5% Fe-95% Cr, 30% Fe-70% Cr, 50% Fe-50% Cr, and 78% Fe-22% Cr. These specimens were tested and evaluated for use in SOFC stack applications. The verification items included coefficient of thermal expansion measurements, high-temperature oxidation resistance and weight gain tests, mechanical strength tests, high-temperature sealant bonding and leakage rate measurements, and high-temperature electrical property (i.e., area-specific resistance) measurements. In addition, the specimens’ microstructures and elemental compositions were observed and analyzed. The test results indicate that the Fe content of the Fe-Cr powder metallurgy alloys influences various properties, while Cr also plays a significant role in high-temperature oxidation resistance. Among the four alloy specimens, the 78Fe-Cr alloy exhibited all of the aforementioned advantages, including a suitable coefficient of thermal expansion of 12.4 × 10⁻⁶/°C, excellent high-temperature oxidation resistance, a thermal weight-gain rate of 5.31 × 10⁻¹⁴ g2/cm4·s, a remarkably low high-temperature area-specific resistance of 7.04 mΩ·cm2, and superior bonding and interfacial stability with the GC9 glass–ceramic sealant, achieving a very low leakage rate of 3.47 × 10⁻⁶ mbar·l/s/cm. These results indicate that the 78Fe-Cr powder metallurgy alloy performs excellently and is the most promising candidate for metallic interconnects in SOFC stack applications.
1. Introduction
Metallic interconnects are essential to solid oxide fuel cell (SOFC) stacks [1,2,3,4]. They not only function as electrical conductors but also isolate the fuel gas and air from the cathode/anode of the SOFC. Because SOFC stacks normally operate at elevated temperatures, the basic requirements for the metallic interconnects used in SOFC stacks are high-temperature resistance, gas tightness, an electrical conductor, and excellent oxidation resistance [5,6,7,8,9,10]. In addition, the metallic interconnects must also demonstrate good mechanical strength, anti-creep, easy processing, and good chemical and physical stability. The main requirements for their use in SOFC applications are as follows: (1) the coefficients of thermal expansion (CTEs) of the metallic interconnects at high temperatures (e.g., 600 °C~800 °C) must match those of the adjacent components (e.g., the CTE of the electrolyte YSZ should be about 10 × 10−6/K); (2) electrical conductivity (σ) should be higher than 1 S/cm; and (3) the thermal conductivity (k) should be higher than 5 W/m·K [11]. Ferritic stainless steels with body-centered cubic (BCC) lattice structures and a chromium content of 16 wt%~24 wt% are widely used as interconnects in SOFC stacks. As for evaluating the performance of metallic interconnects in SOFC stacks, the key indicators include a compatible coefficient of thermal expansion (e.g., 10 × 10−6/°C~13 × 10−6/°C), high-temperature oxidation resistance (e.g., parabolic oxidation rate ≤ 10−13 g2/cm4·s), bonding and gas-tightness with the sealing materials, and the evolution of high-temperature, area-specific resistance (ASR). One practical technique for improving the high-temperature resistance of metallic interconnects is coating a thin ceramic film, such as lanthanum strontium manganite (LSM) [12,13,14] or manganese cobalt oxide (MCO) [15,16,17], onto their surfaces as a protective layer. The coated metallic interconnects can dramatically extend their service life and maintain good electrical conductivity. An ASR of less than 100 mΩ·cm2 is a requirement/evaluation target for coated metallic interconnects [18].
Typically, there are complex flow channels on the cathode and anode side of a metallic interconnect that facilitate the uniform distribution and flow of fuel gas and air for electrochemical reactions with the SOFCs. In addition to rolling and stamping, powder metallurgy (PM) is a simple, mass-producible, and cost-effective method for manufacturing metallic interconnects [19,20,21]. The advantages of PM include its ability to produce high-precision and complex parts, reduced machining costs, low process temperatures, and its suitability for mass production. As for material selection, PM also offers the advantages of using high-purity raw materials, high powder utilization, and the uniform and stable composition of products after sintering. B. Öztürk et al. [22] investigated two different Crofer®22 interconnect samples, one of which was manufactured via traditional machining and the other via the powder metallurgy (PM) technique, and the authors pointed out that the ASR values were the same (10 mΩ·cm2) for both the Crofer®22 interconnect manufactured via the PM technique and that manufactured via machining after testing at 800 °C for 525 h. They concluded that the Crofer®22 interconnect produced via the PM approach could prove a reliable alternative in its bulk form. A. Topcu et al. [23] reported an SOFC stack performance comparison between two single-cell stacks, which consisted of a commercially available bulk Crofer®22 APU interconnect and a powder metallurgical interconnect made of Crofer®22 APU powders. They found that the maximum power of the stacks using the bulk Crofer®22 APU interconnect and the powder metallurgical Crofer®22 APU was 3.12 and 2.97 W, respectively, at an operating temperature of 800 °C. Additionally, they claimed that the powder metallurgical Crofer®22 APU interconnect was found to have 9% porosity. Powder metallurgical materials have a porous structure due to their sintered form. However, the porosity can be reduced if proper strategies, such as a higher molding pressure and a proper sintering temperature, are introduced. Liu et al. [24] investigated the effects of Cr content on the high-temperature mechanical, oxidation, and electrical properties of powder metallurgy ferritic stainless steel interconnects. Their results showed that the strength of the PM alloy interconnect increased with the Cr content. However, the elongation of the corresponding sample decreased at 800 °C. They reported that their high-Cr-content PM ferritic stainless steel could serve as an alternative to commercial metallic interconnects such as ZMG232. There have been a number of papers published on metallic interconnects for SOFC or SOEC applications in the last decade. PM alloys used not only in the interconnects but also in the metallic substrates of SOFC and SOEC have drawn much attention in recent years. Haydn et al. [25] reported the use of porous PM Fe-Cr oxide dispersion-strengthened (ODS) alloys in substrates for metal-supported solid oxide fuel cells (MSCs). In their study, the MSCs demonstrated a powder density of over 1400 mW/cm2 at 0.7 V, operating at 850 °C. It has thus been revealed that these PM Fe-Cr ODS alloys can provide good long-term mechanical and chemical stability at elevated temperatures. Zanchi et al. [26] studied high-temperature ASR evolution on MnCo2O4-coated PM ferritic stainless steel (SUS445), which is used in solid oxide cell (SOC) interconnects. The coated interconnect demonstrated a low area-specific resistance (ASR) of 12.7 mΩ·cm2 after aging at 800 °C for 1500 h, with an ASR degradation rate of 1.2 mΩ·cm2/kh. The reason for this is understood to be the low Cr outward diffusion of the coated PM SUS445 at elevated temperatures.
Although many Fe-Cr based alloys have been reported for use as interconnects in SOFC applications, most Fe-Cr alloys are compositionally complex [27,28]. This study aims to evaluate the effects of Fe-Cr binary powder metallurgy alloys with different Fe/Cr ratios on the thermal expansion coefficient, oxidation resistance, mechanical strength, high-temperature sealant bonding, leakage rate, and area-specific resistance of the interconnects employed in SOFC stack applications.
2. Experimental Section
2.1. Specimen Preparation and X-Ray Diffraction Characterization
Four kinds of Fe-Cr alloys were constructed via the powder metallurgical technique and obtained from a domestic manufacturer [29] at nominal compositions (in wt%) of 5% Fe-95% Cr, 30% Fe-70% Cr, 50% Fe-50% Cr, and 78% Fe-22% Cr, associated with apparent densities (Dap) of 6.77 g/cm3, 6.89 g/cm3, 7.27 g/cm3, and 7.31 g/cm3, respectively. The actual compositions of the four kinds of Fe-Cr alloys were examined using an X-ray fluorescence analyzer (XGT-1700WR, HORIBA, Kyoto, Japan) at an operating voltage of 50 kV and a current of 0.7 mA. The alloys, designated as 5Fe-Cr, 30Fe-Cr, 50Fe-Cr, and 78Fe-Cr, were employed as candidate metallic interconnects for solid oxide fuel cell stack applications in the present study. All specimens were cut into 3 mm × 10 mm × 10 mm coupons, ground with emery papers ranging from 600 to 1200 grit, and cleaned in acetone using an ultrasonic bath. An X-ray diffractometer (D8 Discover, Bruker, Karlsruhe, Germany) equipped with Cu Kα (λ = 1.5406 Å) radiation was employed to determine the crystalline structures of the as-received Fe-Cr alloy specimens. The XRD measurements were conducted at an operating voltage of 40 kV and a current of 40 mA. The scanning range was 2θ = 10°~90°, and the scanning speed was 4 °/min.
2.2. Coefficient of Thermal Expansion and Thermal Conductivity Measurement
The thermal expansion curves of the specimens were measured using a thermomechanical analyzer (Diamond TMA, PerkinElmer, Shelton, CT, USA), and the coefficient of thermal expansion can be calculated from the slope of the thermal expansion curve. The specimens were heated from room temperature to 900 °C, with a heating rate of 5 °C/min. An external load of 50 mN and a 50 mL/min nitrogen atmosphere were applied to the specimen during the measurement. A thermal conductivity analyzer (TPS 2500 S, Hot Disk®, Gothenburg, Sweden) was used to measure the thermal conductivities of the specimens at ambient temperature.
2.3. Oxidation Resistance Test
The oxidation resistance of the Fe-Cr alloy specimens was determined via the weight gain test. The Fe-Cr coupons were placed into quartz tubes in an electric furnace, heated to 800 °C, and held for 1200 h in air. The specimens were removed from the furnace at a certain point and then cooled and weighed to the fourth decimal place. The weight gain data for each single specimen were obtained by averaging the values from three specimens.
2.4. Tensile Strength Measurement
The tensile strengths of the specimens at room temperature and 800 °C were determined using a universal tensile machine (Advance Instrument Inc., New Taipei, Taiwan). The specimens used in the tensile test were dog-bone-shape, with a gauge length of 25 mm. The cross-head speed was fixed at 2 mm/min. The tensile strength data were obtained from the average of at least three specimens.
2.5. Adhesion and Gas-Tightness Test
GC9 glass [30,31] paste was used as a high-temperature seal to adhere the Fe-Cr coupons at 850 °C for 4 h in order to examine the sealing properties between the GC9 glass and the Fe-Cr alloy specimens. In order to evaluate the interfacial compatibility and chemical stability of the GC9/Fe-Cr coupons, one of them was chosen for long-term testing and subsequent aging at 850 °C for 500 h. In addition, a pressure test for high-temperature leak rate measurement was conducted to determine the gas-tightness performance of the selected GC9/Fe-Cr coupon when aged at 800 °C for 700 h in air. For leakage tests, an annular GC9 glass paste frame of 5 mm in width, 13.5 cm in length, and 0.5 mm in thickness was applied between two parallel 78Fe-Cr plates and well-adhered by means of a curing process. In this test, an external stress of 0.025 MPa was applied on the specimen, and a pressure of 137.9 mbar helium was introduced to the chamber. The pressure change was monitored and recorded by a digital pressure transducer. The leak rate was calculated according to the change in pressure during the testing period.
2.6. Protective Layer Coating
A La0.67Sr0.33MnO3 film with a thickness of about 5 μm was deposited on the surfaces of the Fe-Cr coupons as a protective layer using a pulsed DC magnetron sputter [13,32]. A La0.67Sr0.33MnO3 bulk (TOSHIMA, Saitama, Japan) with 99.9% purity was used as a sputter target for the coating process. The distance between the specimens and the target was 5 cm, and the power consumption was 1.5 kW. The sputter coating processes were performed in an Argon atmosphere at a flow rate of 130 mL/min and a pressure range of 1.0 × 10⁻²~1.07 × 10⁻² mbar.
2.7. Area-Specific Resistance Measurement
The area-specific resistance (ASR) measurements were carried out using the standard DC four-point technique [33]. The LSM-coated Fe-Cr coupons, measuring 10 mm × 10 mm, were placed into an electric furnace and isothermally aged at 800 °C for 1000 h with an air flow rate of 2 L per min. The ASR measurements were conducted at a constant current of 140 mA using a Keithley 2400 system (Keithley Instruments Inc., Cleveland, OH, USA). The evolutions in resistance were recorded and calculated using the Keithley 2700 system.
2.8. Microstructural Observation
All of the specimens for microstructural observation and element analysis were carefully cut, mounted, ground, and polished, and then coated with a thin Pt film introduced to the sample surface. Microstructural examinations were carried out using a scanning electron microscope (SEM) (S-4800I, Hitachi, Tokyo, Japan) equipped with an energy-dispersive X-ray spectrometer (EDS) (EMAX-ENERGY, HORIBA, Kyoto, Japan) to determine the elemental compositions.
3. Results and Discussion
3.1. Effect of the Fe-Cr Composition
3.1.1. Surface Morphology and Roughness
The Fe-Cr alloys used in this study were made via the powder metallurgical technique. Four kinds of Fe-Cr alloys were used, designated as 5Fe-Cr, 30Fe-Cr, 50Fe-Cr, and 78Fe-Cr. Their actual compositions were determined using an XRF analyzer (XGT-1700WR, HORIBA, Kyoto, Japan), and the corresponding values are provided in Table 1. Figure 1 shows the surface morphologies of the four as-received Fe-Cr alloy specimens. The rough surface reveals that the characteristics of the powder metallurgical alloys are due to their sintered form. However, the 78Fe-Cr specimen has a smooth surface because of its high density due to its high Fe content. In addition, among them, 78Fe-Cr exhibits the highest density (7.31 g/cm3), which is a little bit lower than the theoretic density (7.71 g/cm3). This means that the relative density for specimen 78Fe-Cr is about 95%. In addition, the surface roughness values (Ra) of the as-received and ground Fe-Cr coupons were determined using a roughness meter (Tester T1000, HOMMEL, Jena, Germany), and the corresponding values are listed in Table 2. The surface roughness of the Fe-Cr coupons is reduced significantly after surface grinding by emery paper.

Table 1.
The actual compositions of the four kinds of Fe-Cr alloys.
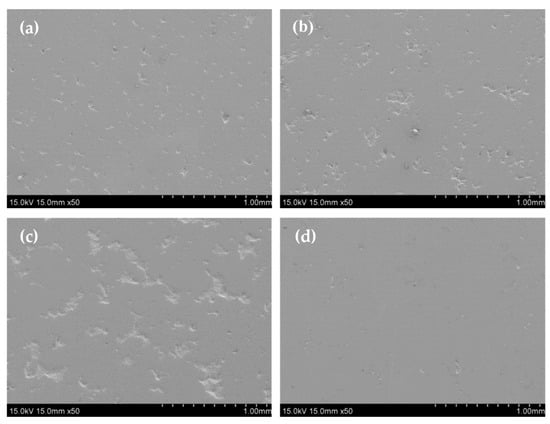
Figure 1.
Surface morphologies of the as-received Fe-Cr alloy specimens: (a) 5Fe-Cr; (b) 30Fe-Cr; (c) 50Fe-Cr; and (d) 78Fe-Cr.
Table 2.
Surface roughness of the as-received and ground Fe-Cr alloy specimens.
3.1.2. Crystalline Structure
Figure 2 shows the X-ray diffraction patterns of the as-received Fe-Cr powder metallurgy alloys. Both iron (Fe) and chromium (Cr) have a body-centered cubic structure and a very similar lattice constant. The lattice constants are 2.867 Å and 2.885 Å for Fe and Cr, respectively. The three main peaks and corresponding Miller indices (h k l) for the X-ray diffraction patterns of Fe (JCPDS No. 03-065-4899) are at 2θ = 44.66° (1 1 0), 65.01° (2 0 0), and 82.31° (2 1 1). The main peaks and corresponding Miller indices (h k l) for the X-ray diffraction patterns of Cr (JCPDS No. 01-089-4055) are at 2θ = 44.37° (1 1 0), 64.55° (2 0 0), and 81.69° (2 1 1). However, the X-ray diffraction patterns, as shown in Figure 2, are a Fe-Cr crystalline phase (JCPDS No. 00-034-0396). This implies that the Fe-Cr powder metallurgy alloys used in this study had not only a sintered form but also an alloying form. The Fe-Cr crystalline phase is a body-centered cubic structure with a lattice constant of 2.876 Å. Its main peaks and corresponding Miller indices (h k l) are at 2θ = 44.52° (1 1 0), 64.78° (2 0 0), and 82.00° (2 1 1). Moreover, it can be found that the diffraction peak (e.g., 2θ = 44.52°) of the Fe-Cr alloy shifts toward a higher angle with increasing Fe content in the Fe-Cr specimens because the melting temperature of Fe (1538 °C) is lower than that of Cr (1907 °C). Therefore, this phenomenon is ascribed to the higher Fe content and higher degree of alloying of the Fe-Cr powder mixture after sintering at elevated temperatures.
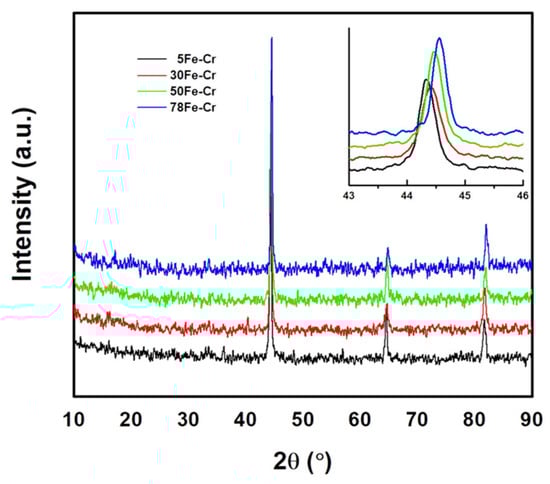
Figure 2.
The X-ray diffraction patterns of as-received Fe-Cr powder metallurgy alloys.
3.1.3. Coefficient of Thermal Expansion and Thermal Conductivity
Figure 3 shows the thermal expansion curves corresponding to the GC9 glass and four Fe-Cr alloy specimens. The average coefficient of thermal expansion (CTE) can be calculated from the slope of the thermal expansion curves, and the formula can be written as follows:
where L0 is the specimen length, ΔL is the elongation, and ΔT is the temperature difference. The average CTE of GC9 glass is 12.5 × 10⁻⁶/°C (in the temperature range of 50 °C~600 °C), and the average CTEs of 5Fe-Cr, 30Fe-Cr, 50Fe-Cr, and 78Fe-Cr are 10.6 × 10⁻⁶/°C, 11.1 × 10⁻⁶/°C, 10.9 × 10⁻⁶/°C, and 12.4 × 10⁻⁶/°C (in the temperature range of 50 °C~800 °C), respectively. Obviously, the results show that the CTE of the 78Fe-Cr specimen is consistent with that of GC9 glass. Furthermore, the CTE of the 78Fe-Cr specimen is also similar to that of the popular ferritic stainless steels used in metallic interconnects, such as Crofer22APU (12.3 × 10⁻⁶/°C) and Crofer22H (12.4 × 10⁻⁶/°C), and a little bit better than that of the Fe-Cr22 alloy (11.5 × 10⁻⁶/K) [28]. As for the CTE of the electrode materials and protective coatings used in SOFC applications, the CTEs of 8YSZ, Ba0.5Sr0.5Co0.8Fe0.2O3 (BSCF), and Mn1.5Co1.5O4 (MCO) are 10.8 × 10⁻⁶/°C [34], 20 × 10−6/°C [35], and 11.4 × 10⁻⁶/°C [15], respectively. Additionally, the measured thermal conductivities (k) for specimens 5Fe-Cr, 30Fe-Cr, 50Fe-Cr, and 78Fe-Cr at room temperature are 17.28 W/m·K, 8.94 W/m·K, 9.60 W/m·K, and 10.47 W/m·K, respectively. Although these values are lower than those of Crofer22APU (26.27 W/m·K) and Crofer22H (19.90 W/m·K), it is worth noting that the metallic interconnect with a thermal conductivity higher than 5 W/m·K is suitable for SOFC stack applications [11]. The densities, thermal conductivities, and CTEs of the Fe-Cr alloy specimens are provided in Table 3.
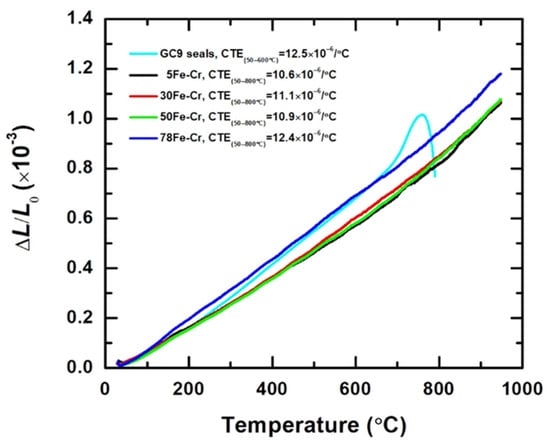
Figure 3.
The thermal expansion curves of the GC9 glass and four Fe-Cr alloy specimens.
Table 3.
The densities, thermal conductivities, and CTEs of the Fe-Cr alloy specimens.
3.1.4. Oxidation Resistance
The weight gain test is a common technique used to determine the oxidation resistance of steels. Figure 4 shows the weight gain of the four Fe-Cr alloy specimens as a function of time at 800 °C in air. Notably, the weight change (ΔW) can be fitted by the following equation [36,37,38,39,40]:
where A is the surface area of the specimen, kp is the parabolic oxidation rate, t is the time, and C is the integration constant. The parabolic law is typically applied to the oxidation of Fe-Cr alloys at elevated temperatures [38,39]. The parabolic oxidation rates of the four Fe-Cr alloy specimens over a test duration of 1200 h are 8.74 × 10⁻¹⁴ g2/cm4·s, 6.97 × 10⁻¹⁴ g2/cm4·s, 4.94 × 10⁻¹⁴ g2/cm4·s, and 5.31 × 10⁻¹⁴ g2/cm4·s for the 5Fe-Cr, 30Fe-Cr, 50Fe-Cr, and 78Fe-Cr alloys, respectively. All specimens used in this study meet the maximum acceptable limit for the parabolic oxidation rate, i.e., 10−13 g2/cm4·s, for their use as metallic interconnects in SOFC stack applications. However, the weight gain data shown in Figure 4, particularly for specimens with high Cr content, exhibit a large standard deviation. This is attributed not only to the growth of the chromia (Cr2O3) scale but also to the evaporation of Cr(VI) on the outer surface of the Fe-Cr alloy specimens at elevated temperatures [41]. M. Tomas et al. [42] evaluated six Cr2O3-forming Fe-Cr steels under a single- and dual-atmosphere, and they reported that although the presence of an oxide scale reduces Cr(VI) evaporation, it is still significant. Moreover, the surface roughness of the specimens also contributed to the variability in the weight gain data. According to Table 2, the surface roughness of high-Cr-content ground Fe-Cr alloy specimens, such as 30Fe-Cr and 50Fe-Cr, is significantly higher than that of 78Fe-Cr. This difference in surface roughness likely affected the weight gain data due to variations in the effective surface area of the specimens used in the weight gain tests. Compared with data reported in the literature [28,38,39,42], the parabolic oxidation rates for ferritic stainless steels range from 10−13 to 10−15 g2/cm4·s within the temperature range of 750 °C to 850 °C. For example, the parabolic oxidation rate of the Fe-Cr22 alloy is 7.81 × 10⁻¹³ g2/cm4·s at 850 °C [28]; that of Crofer22APU is 1.6 × 10⁻¹⁴ g2/cm4·s at 800 °C [38]; that of SUS430 is 1.22 × 10⁻¹⁴ g2/cm4·s at 800 °C [38]; and that of AISI441 is 1.1 × 10⁻¹⁴ g2/cm4·s at 750 °C [43]. Figure 5a–d shows the surface morphologies of the four Fe-Cr alloy specimens after aging at 800 °C for 1200 h in air. Moreover, it can be seen that there is no blistering or spallation on the oxide scale for all specimens after long-term oxidation. Figure 6a–d present the microstructures of the oxide scale of the four Fe-Cr alloy specimens aged at 800 °C for 1000 h in air. Some of the well-developed crystalline grain growth in the oxide scale matrix can be seen. However, most of the compositions of the oxide scale are chromia, i.e., Cr2O3 [42,44,45,46,47]. The average elemental compositions of the oxide scale, as shown in Figure 6a–d, are listed in Table 4. Note that the compositions of Fe listed in Table 4 are negligible because the data are scattered, and the trace amount of Fe detected might be from the iron substrate. In addition, the cross-sectional microstructure of the four Fe-Cr alloy specimens aged at 800 °C for 1000 h in air is shown in Figure 7a–d. Again, no blistering or spallation can be found at the interface between the alloy matrix and the oxide scale.
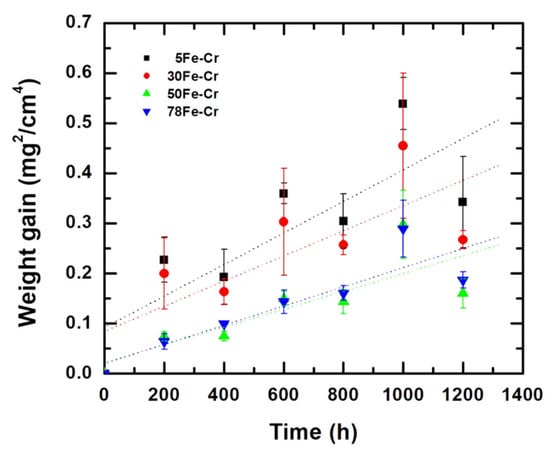
Figure 4.
Weight gain as a function of time at 800 °C in air corresponding to the four Fe-Cr alloy specimens. (dotted line: linear fitting).
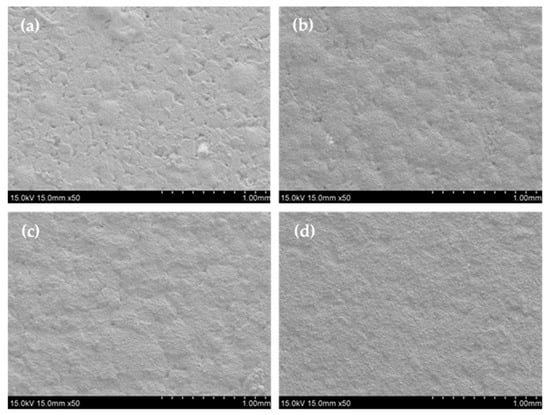
Figure 5.
The surface morphologies of specimens (a) 5Fe-Cr, (b) 30Fe-Cr, (c) 50Fe-Cr, and (d) 78Fe-Cr after aging at 800 °C for 1200 h in air.
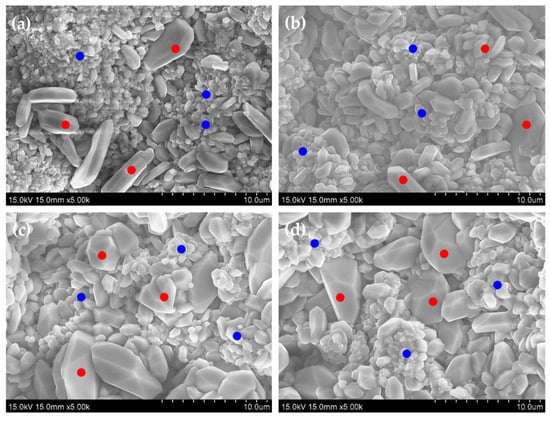
Figure 6.
Microstructures of the oxide scale of specimens (a) 5Fe-Cr, (b) 30Fe-Cr, (c) 50Fe-Cr, and (d) 78Fe-Cr after aging at 800 °C for 1000 h.
Table 4.
The average elemental composition of the oxide scale of the four Fe-Cr alloy specimens after aging at 800 °C for 1000 h.
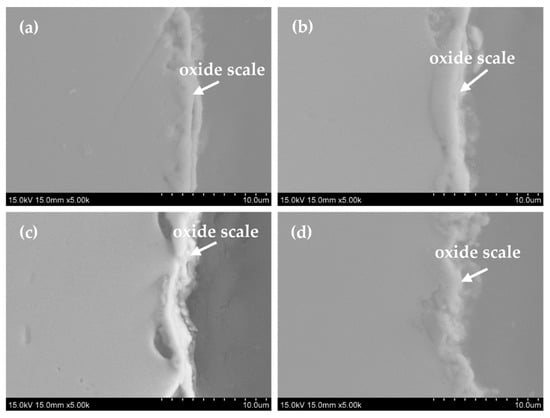
Figure 7.
Cross-sectional microstructure of specimens (a) 5Fe-Cr, (b) 30Fe-Cr, (c) 50Fe-Cr, and (d) 78Fe-Cr after aging at 800 °C for 1000 h.
3.1.5. Mechanical Strength
The mechanical strength of the metallic interconnect plays a very important role when it is used in the SOFC stack because of the creep effect, while long-term stress must also be considered. Figure 8a,b are the typical tensile curves and tensile strengths for the Fe-Cr alloy specimens with different Fe/Cr ratios. The data for the tensile strength measurements were taken from the average of at least three specimens. The average tensile strengths at room temperature are 25.99 ± 11.71 MPa, 120.86 ± 72.26 MPa, 536.18 ± 45.34 MPa, and 333.88 ± 6.31 MPa for the 5Fe-Cr, 30Fe-Cr, 50Fe-Cr, and 78Fe-Cr specimens, respectively. The results reveal that the maximum tensile strength exists at a composition ratio of Fe/Cr equal to 50/50. However, the average tensile strengths at high temperatures, e.g., 800 °C, are 65.17 MPa, 216.11 ± 15.33 MPa, 126.56 MPa, and 25 MPa for the 5Fe-Cr, 30Fe-Cr, 50Fe-Cr, and 78Fe-Cr specimens, respectively. The tensile strength decreases dramatically with increasing Fe content in the Fe-Cr alloys. Although the atomic weight of Fe (55.85) is similar to that of Cr (52), their melting points (Fe: 1538 °C; Cr: 1907 °C) differ significantly. The high tensile strength and low ductility of the 50Fe-Cr specimen are related to the precipitation of the Fe-Cr σ-phase (the phase formation temperature is approximately in the range of 600 °C~800 °C), which is mechanically hard and brittle. Furthermore, if the powder is sintered at a lower temperature (e.g., 1200 °C), the strength of the sintered Fe-Cr PM alloy specimen with high Cr content is significantly lower than that of the Fe-Cr specimen with high Fe content.
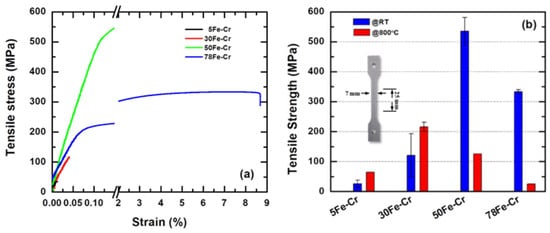
Figure 8.
(a) The typical tensile curves and (b) the tensile strength for the four Fe-Cr alloy specimens with different Fe/Cr ratios.
3.1.6. Adhesion Compatibility
Metallic interconnects used in SOFC stacks must achieve a good seal with the adjacent components via high-temperature sealants to maintain high-temperature gas-tightness. In the present study, we use GC9 glass as a high-temperature sealant adhered to the four Fe-Cr alloy specimens to examine the interfacial compatibility and chemical stability between the GC9 glass and the Fe-Cr coupons. The results of the adhesion test of the four Fe-Cr alloy specimens with GC9 glass paste after curing at 850 °C for 4 h are shown in Figure 9. The 78Fe-Cr specimen demonstrates good adhesion compatibility to the GC9 seals, as well as after aging at 800 °C for 500 h in air, irrespective of whether it is as-received or a ground sample. Figure 10 shows the cross-sectional microstructure and elemental profile of the 78Fe-Cr specimen adhered to the GC9 seal before and after aging at 800 °C for 500 h. It was found that the interface remained rigidly contacted, and there was no crack or spallation formation after 500 h of heat treatment. Additionally, no obvious diffusion of elements occurred in the adhesion interface region between the GC9 glass and the 78Fe-Cr specimen. Again, this indicates that the GC9 glass/78Fe-Cr joint is suitable for SOFC stack applications.
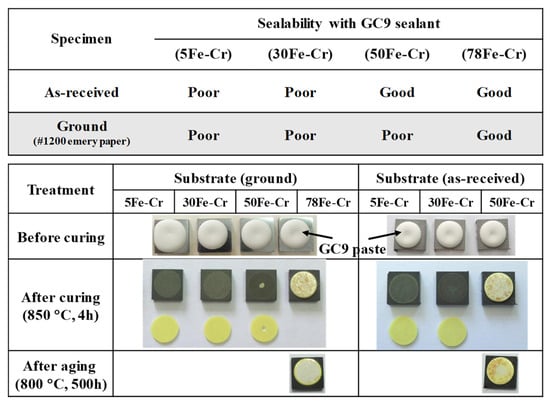
Figure 9.
Adhesion test results of the four Fe-Cr alloy specimens with GC9 seals.
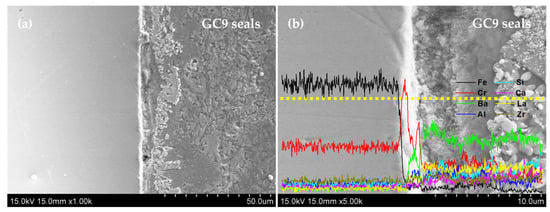
Figure 10.
Cross-sectional microstructure and elemental profile of the 78Fe-Cr specimen adhered to the GC9 seal (a) before and (b) after aging at 800 °C for 500 h. (dotted line: EDS line scan).
3.2. High-Temperature Leakage Rate
It is important that the 78Fe-Cr/glass/78Fe-Cr joint provides gas-tightness during sealing and operating processes for use as an interconnect in an SOFC stack at elevated temperatures. Pressure testing is a very common method of validating the sealability of a container or pipe. In this study, high-temperature leak rate measurements of the 78Fe-Cr/glass/78Fe-Cr joint were performed under the condition of aging at 800 °C for 700 h in air. The evolution of the pressure changes with elapsing time for the sealed 78Fe-Cr/glass/78Fe-Cr joint at 800 °C for 700 h in air is shown in Figure 11. The leak rate (L.R.) can be calculated from the leak test data as follows:
where ΔP is the pressure difference (unit: mbar), Δt is the time period, and V is the volume of the gas container. The results show that the sealed 78Fe-Cr/glass/78Fe-Cr joint maintained a very low leak rate, with an average leakage rate of 3.47 × 10⁻⁶ mbar·l/s/cm during the leak test at high temperatures. The leakage rates are far below the upper limit of 5.2 × 10⁻⁴ mbar·l/s/cm, which was set under the allowable limit, corresponding to a 1% flow gas leak [30].
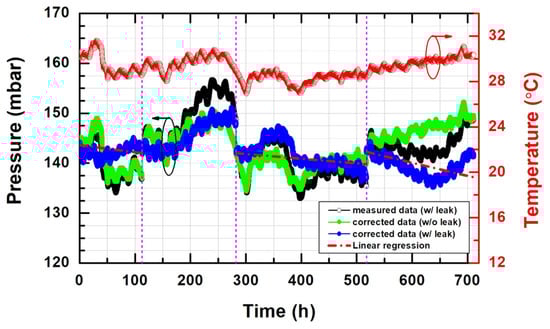
Figure 11.
The evolution of pressure changes with elapsing time for the sealed 78Fe-Cr/glass/78Fe-Cr joint at 800 °C for 700 h in air.
3.3. High-Temperature Area-Specific Resistance
Figure 12 shows the evolution of the ASR values of the LSM-coated and bare Fe-Cr alloy specimens at 800 °C for 1000 h in air. Since ASR = L/σ, where L is the thickness and σ is the electrical conductivity of the sample, we can estimate the ASR values of the LSM coatings (e.g., σ = 3.39 S/cm for LSM-65 at 800 °C) [34] and the oxide scale (e.g., σ = 0.01 S/cm for Cr2O3 at 800 °C) [48], respectively. The ASR of the LSM coatings with a thickness 5 μm is 0.147 mΩ·cm2. Assuming the thickness of the Cr2O3 is 1 μm, the ASR of oxide scale Cr2O3 will be around 10 mΩ·cm2. Therefore, the electrical resistance contribution is mainly derived from the LSM coatings and oxide scale. The electrical resistance contributed by the metallic substrates can be disregarded. The ASR values of the LSM-coated and bare Fe-Cr alloy specimens are 10.22 mΩ·cm2, 10.35 mΩ·cm2, 9.73 mΩ·cm2, and 7.04 mΩ·cm2 and 8.85 mΩ·cm2, 11.15 mΩ·cm2, 9.65 mΩ·cm2, and 10.14 mΩ·cm2 for the 5Fe-Cr, 30Fe-Cr, 50Fe-Cr, and 78Fe-Cr specimens, respectively, after aging at 800 °C for 1000 h in air. According to the results, the LSM-coated 78Fe-Cr specimen showed the lowest ASR value for the test duration. Moreover, the linear ASR increase rate of the LSM-coated specimen 78Fe-Cr is 1.96 × 10⁻³ mΩ·cm2/h. The performance of our LSM-coated PM 78Fe-Cr alloy is comparable to the results reported by Zanchi et al. [26], in which the ASR was 12.7 mΩ·cm2 and the degradation rate was 1.2 mΩ·cm2/kh. A comparison of CTE, kp, ASR, and porosity of 78Fe-Cr, Crofer22APU, and SUS445 is summarized in Table 5. In addition, the cross-section micrographs and elemental concentration profiles of the LSM-coated and bare Fe-Cr alloy specimens at 800 °C for 1000 h in air are shown in Figure 13a–h. Comparing Figure 13a–h reveals that the 78Fe-Cr specimen possesses a thinner oxide scale than the others and, therefore, has the lowest ASR value.
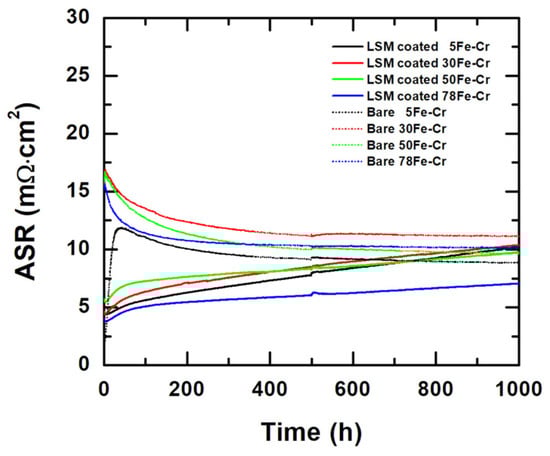
Figure 12.
The evolution of the ASR values of the LSM-coated and bare Fe-Cr alloy specimens at 800 °C for 1000 h in air.
Table 5.
Summary of CTE, kp, ASR, and porosity in various powder metallurgy interconnects.
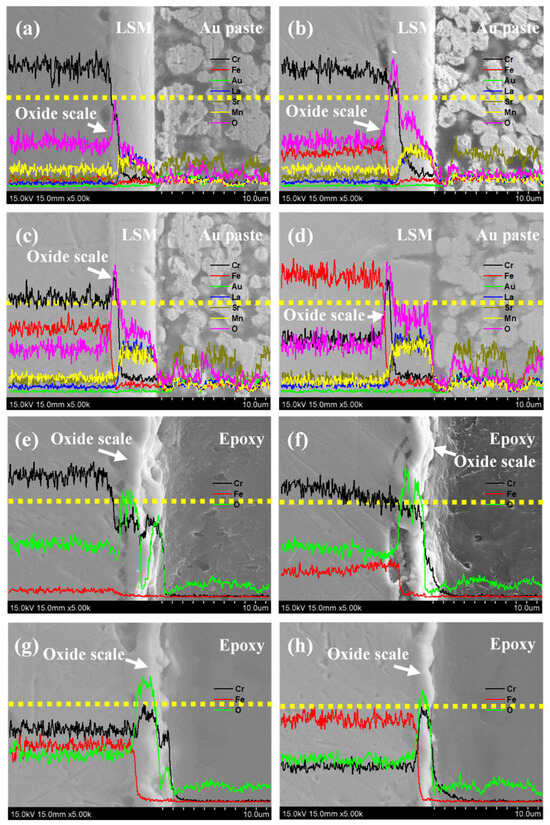
Figure 13.
Cross-section micrographs and elemental concentration profiles of the LSM-coated specimens ((a) 5Fe-Cr, (b) 30Fe-Cr, (c) 50Fe-Cr, and (d) 78Fe-Cr) and bare specimens ((e) 5Fe-Cr, (f) 30Fe-Cr, (g) 50Fe-Cr, and (h) 78Fe-Cr) at 800 °C for 1000 h in air (dotted line: EDS line scan).
4. Conclusions
In this study, we conducted comprehensive investigations of four powder metallurgy alloys with different Fe/Cr content ratios, including 5 wt% Fe-95 wt% Cr, 30 wt% Fe-70 wt% Cr, 50 wt% Fe-50 wt% Cr, and 78 wt% Fe-22 wt% Cr specimens. Among the four alloy compositions, 78Fe-Cr shows exceptional performance and may prove a promising candidate for use as a metallic interconnect in SOFC stacks. As the Fe content in the Fe-Cr alloy specimen increases, the density of the sintered Fe-Cr alloy is increased. The apparent density of the 78Fe-Cr specimen reaches 7.31 g/cm3, and the relative density reaches 95%, which satisfies the gas-tightness requirements of powder metallurgy alloys for use in SOFC applications. In addition, the 78Fe-Cr specimen performs well in all the criteria that it must meet for use as a metallic interconnect, including the following:
- (1)
- The average coefficient of thermal expansion is 12.4 × 10⁻⁶/°C, which means it can be bonded rigidly with glass–ceramic sealing materials to achieve reliable adhesion and gas-tightness.
- (2)
- The parabolic oxidation rate of thermal oxidation at high temperature is 5.31 × 10⁻¹⁴ g2/cm4·s, which is far below the acceptable upper limit for practicing applications, indicating its excellent high-temperature oxidation resistance.
- (3)
- The mechanical strength is 333.88 ± 6.31 MPa at room temperature, which meets the applicable acceptance standard of 300 MPa.
- (4)
- The 78Fe-Cr specimen demonstrates strong bonding with the high-temperature glass sealant GC9, showing good high-temperature sealing and interfacial stability between the 78Fe-Cr alloy and GC9 glass, and the high-temperature sealing leakage rate is 3.47 × 10⁻⁶ mbar·l/s/cm, which is far below the allowable upper limit value of 5.2 × 10⁻⁴ mbar·l/s/cm.
- (5)
- The results of the high-temperature area-specific surface resistance measurement showed that the ASR value of the LSM-coated 78Fe-Cr alloy specimen is 7.04 mΩ·cm2 after aging at 800 °C for 1000 h in air, and the linear increase rate is 1.96 × 10⁻³ mΩ·cm2/h, and it therefore meets the application requirements for a metallic interconnect used in SOFC stacks.
In addition, we are currently using PM 78Fe-Cr alloy as the metallic interconnect for SOCs, including both SOFC and SOEC stack assembly and performance testing. The results have been promising so far. Furthermore, the PM technique is a well-known and efficient process for industrial applications, which means that cost reduction in manufacturing metallic interconnects using the PM method can be more easily achieved.
Author Contributions
Conceptualization, C.-K.L.; methodology, C.-K.L. and W.-J.S.; validation, C.-K.L.; formal analysis, C.-K.L.; investigation, C.-K.L.; data curation, C.-K.L.; writing—original draft preparation, C.-K.L.; writing—review and editing, C.-K.L. and W.-J.S. All authors have read and agreed to the published version of the manuscript.
Funding
This research received no external funding.
Data Availability Statement
The data are contained within the article.
Conflicts of Interest
The authors declare no conflicts of interest.
References
- Fergus, J.W. Metallic interconnects for solid oxide fuel cells. Mater. Sci. Eng. A 2005, 397, 271–283. [Google Scholar] [CrossRef]
- Minh, N.Q. Ceramic fuel cells. J. Am. Ceram. Soc. 1993, 76, 563–588. [Google Scholar] [CrossRef]
- Yang, G.; Potter, A.; Sumner, J. An overview on oxidation of metallic interconnects in solid oxide fuel cells under various atmospheres. Int. J. Hydrogen Energy 2025, 99, 974–984. [Google Scholar] [CrossRef]
- Hu, Y.; Li, D.; Guo, H.; Liu, S.H.; Meng, Y.; Ding, S.; Li, C.X. Recent progress of high-performance interconnectors for SOFC: From materials, protective coatings, optimizing strategies, towards the real stack applications. Chem. Eng. J. 2025, 505, 159321. [Google Scholar] [CrossRef]
- Han, M.; Peng, S.; Wang, Z.; Yang, Z.; Chen, X. Properties of Fe-Cr based alloys as interconnects in a solid oxide fuel cell. J. Power Sources 2007, 164, 278–283. [Google Scholar] [CrossRef]
- Seo, H.S.; Jin, G.; Jun, J.H.; Kim, D.H.; Kim, K.Y. Effect of reactive elements on oxidation behaviour of Fe-22Cr-0.5Mn ferritic stainless steel for a solid oxide fuel cell interconnect. J. Power Sources 2008, 178, 1–8. [Google Scholar] [CrossRef]
- Froitzheim, J.; Meier, G.H.; Niewolak, L.; Ennis, P.J.; Hattendorf, H.; Singheiser, L.; Quadakkers, W.J. Development of high strength ferritic steel for interconnect application in SOFCs. J. Power Sources 2008, 178, 163–173. [Google Scholar] [CrossRef]
- Scott, J.A.; Dunand, D.C. Processing and mechanical properties of porous Fe-26Cr-1Mo for solid oxide fuel cell interconnects. Acta Mater. 2010, 58, 6125–6133. [Google Scholar] [CrossRef]
- Yang, Z.K.; Weil, S.D.; Paxton, M.; Stevenson, J.W. Selection and Evaluation of heat-resistant alloys for SOFC interconnect aplications. J. Electrochem. Soc. 2003, 150, A1188–A1201. [Google Scholar] [CrossRef]
- Wu, J.; Liu, X. Recent development of SOFC metallic interconnect. J. Mater. Sci. Technol. 2010, 26, 293–305. [Google Scholar] [CrossRef]
- Mah, J.C.W.; Muchtar, A.; Somalu, M.R.; Ghazali, M.J. Metallic interconnects for solid oxide fuel cell: A review on protective coating and deposition techniques. Int. J. Hydrogen Energy 2017, 42, 9219–9229. [Google Scholar] [CrossRef]
- Chu, C.L.; Wang, J.Y.; Lee, S. Effects of La0.67Sr0.33MnO3 protective coating on SOFC interconnect by plasma-sputtering. Int. J. Hydrogen Energy 2008, 33, 2536–2546. [Google Scholar] [CrossRef]
- Liu, C.K.; Yang, P.; Shong, W.J.; Lee, R.Y.; Wu, J.Y. Electrical and microstructural evolutions of La0.67Sr0.33MnO3 coated ferritic stainless steels after long-term aging at 800 °C. Adv. Solid Oxide Fuel Cells XI 2015, 36, 57–66. [Google Scholar]
- Hao, Y.; Zhu, R.; Cao, H.; Liu, Z.; Ran, R.; Yang, G. A mini-review on mitigating degradation of metallic interconnects in solid oxide cell stack systems: Advances, challenges, and solutions. Energy Fuels 2025, 39, 18751–18772. [Google Scholar] [CrossRef]
- Yang, Z.G.; Xia, G.G.; Stevenson, J.W. Mn1.5Co1.5O4 spinel protection layers on ferritic stainless steels for SOFC interconnect applications. Electrochem. Solid-State Lett. 2005, 8, A168–A170. [Google Scholar] [CrossRef]
- Guo, P.; Lai, Y.; Shao, Y.; Zhang, Y.; Sun, H.; Wang, Y. Oxidation characteristics and electrical properties of doped Mn-Co spinel reaction layer for solid oxide fuel cell metal interconnects. Coatings 2018, 8, 42. [Google Scholar] [CrossRef]
- Li, F.; Zhang, P.; Zhao, Y.; Yang, D.; Sun, J. The preparation and properties of Mn-Co-O spinel coating for SOFC metallic interconnect. Int. J. Hydrogen Energy 2023, 48, 16048–16056. [Google Scholar] [CrossRef]
- Bushuev, A.; El’kin, O.; Tolstobrov, I.; Chetvertnykh, Y.; Bobro, M.; Saetova, N.; Kuzmin, A. Development of SOFC interconnects based on industrial steels with oxide coating. Energies 2023, 16, 1237. [Google Scholar] [CrossRef]
- Danninger, H.; Calderon, R.d.O.; Gierl-Mayer, C. Powder Metallurgy and Sintered Materials; Wiley Online Library: Hoboken, NJ, USA, 2017. [Google Scholar] [CrossRef]
- Glatz, W.; Batawi, E.; Janousek, M.; Kraussler, W.; Zach, R.; Zobl, G. A new low cost mass production route for metallic SOFC-interconnectors. ECS Proc. 1999, 1999, 783–790. [Google Scholar] [CrossRef]
- Danninger, H. What will be the future of powder metallurgy? Powder Metall. Prog. 2018, 18, 70–79. [Google Scholar] [CrossRef]
- Öztürk, B.; Topcu, A.; Öztürk, S.; Cora, Ö.N. Oxidation, electrical and mechanical properties of Crofer®22 solid oxide fuel cell metallic interconnects manufactured through powder metallurgy. Int. J. Hydrogen Energy 2018, 43, 10822–10833. [Google Scholar] [CrossRef]
- Topcu, A.; Öztürk, B.; Cora, Ö.N. Performance evaluation of machined and powder metallurgically fabricated Crofer®22 APU interconnects for SOFC applications. Int. J. Hydrogen Energy 2022, 47, 3437–3448. [Google Scholar] [CrossRef]
- Liu, Z.; Song, R.; Yan, S.; Chen, D.; Ou, C.; Wang, C.; Pan, Q.; Peng, J. Influence of Cr content on the mechanical, oxidation, and electrical properties of powder metallurgy ferritic stainless steel for solid oxide fuel cell interconnect. J. Mater. Eng. Perform. 2025, 34, 13259–13270. [Google Scholar] [CrossRef]
- Haydn, M.; Ortner, K.; Franco, T.; Menzler, N.H.; Venskutonis, A.; Sigl, L.S. Development of metal supported solid oxide fuel cells based on powder metallurgical manufacturing route. Powder Metall. 2013, 56, 382–387. [Google Scholar] [CrossRef]
- Zanchi, L.; Sabato, A.G.; Monterde, M.C.; Bernadet, L.; Torrell, M.; Calero, J.A.; Tarancón, A.; Smeacetto, F. Electrophoretic deposition of MnCo2O4 coating on solid oxide cell interconnects manufactured through powder metallurgy. Mater. Des. 2023, 227, 111768. [Google Scholar] [CrossRef]
- Horita, T.; Xiong, Y.; Yamaji, K.; Sakai, N.; Yokokawa, H. Evaluation of Fe-Cr alloys as interconnects for reduced operation temperature SOFCs. J. Electrochem. Soc. 2003, 150, A243–A248. [Google Scholar] [CrossRef]
- Bian, L.; Chen, Z.; Wang, L.; Li, F.; Chou, K. Oxidation resistance, thermal expansion and area specific resistance of Fe-Cr alloy interconnector for solid oxide fuel cell. J. Iron Steel Res. Int. 2017, 24, 77–83. [Google Scholar] [CrossRef]
- Hsu, W.H.; Ho, C.H.; Lee, H.L.; Shong, D.N.; Chen, S.F.; Yeh, T.L.; Chu, C.L. Method for Forming an Interconnect of a Solid Oxide Fuel Cell. United States Patent No. US 10,040,121 B2, 7 August 2018. [Google Scholar]
- Liu, C.K.; Lee, R.Y.; Tsai, K.C.; Wu, S.H.; Lin, K.F. Characterization and performance of a high-temperature glass sealant for solid oxide fuel cell. Adv. Solid Oxide Fuel Cells X 2014, 35, 65–75. [Google Scholar]
- Liu, C.K.; Lin, K.F.; Lee, R.Y. Effects of lanthanum-to-calcium ratio on the thermal and crystalline properties of BaO-Al2O3-B2O3-SiO2 based glass sealants for solid oxide fuel cells. J. Ceram. Soc. Jpn. 2015, 123, 239–244. [Google Scholar] [CrossRef]
- Yang, P.; Liu, C.K.; Wu, J.Y.; Shong, W.J.; Lee, R.Y.; Sung, C.C. Effects of pre-oxidation on the microstructural and electrical properties of La0.67Sr0.33MnO3 coated ferritic stainless steels. J. Power Sources 2012, 213, 63–68. [Google Scholar] [CrossRef]
- Shong, W.J.; Liu, C.K.; Lu, C.W.; Wu, S.H.; Lee, R.Y. Characteristics of La0.6Sr0.4Co0.2Fe0.8O3-Cu2O mixture as a contact material in SOFC stacks. Int. J. Hydrogen Energy 2017, 42, 1170–1180. [Google Scholar] [CrossRef]
- Stanislowki, M.; Froitzheim, J.; Niewolak, L.; Quadakkers, W.J.; Hilpert, K.; Markus, T.; Singheiser, L. Reduction of chromium vaporization from SOFC interconnectors by highly effective coatings. J. Power Sources 2007, 164, 578–589. [Google Scholar] [CrossRef]
- Sun, C.; Hui, R.; Roller, J. Cathode materials for solid oxide fuel cells: A review. J. Solid State Electrochem. 2010, 14, 1125–1144. [Google Scholar] [CrossRef]
- Israelsson, N. High Temperature Oxidation and Chlorination of FeCrAl Alloys. Ph.D. Thesis, Chalmers University of Technology, Göteborg, Sweden, 2014. [Google Scholar]
- Sequeira, C.A.C. High Temperature Corrosion: Fundamentals and Engineering; John Wiley & Sons: Hoboken, NJ, USA, 2019. [Google Scholar]
- Bakhshi-Zadeh, A.; Salmani, S.; Faghihi-Sani, M.A.; Abdoli, H.; Jalili, N. Oxidation behavior and electrical properties of de-siliconized AISI 430 alloy with Mn1.5Co1.5O4 coating for solid oxide fuel cell interconnect. Oxid. Met. 2020, 93, 401–415. [Google Scholar] [CrossRef]
- Song, H.; Lee, J.; Bae, K.T.; Lee, T.; Jung, W.; Lee, K.T.; Bae, J. Reactive element and Cu-doped (Mn, Co)3O4 as a protective coating for SOFC metallic interconnects. J. Korean Ceram. Soc. 2025, 62, 1242–1257. [Google Scholar] [CrossRef]
- Mao, J.; Wang, E.; Wang, H.; Ouyang, M.; Hu, H.; Lu, L.; Ren, D.; Liu, Y. Experimental investigation of the initial stage of the oxidation mechanism of Co coating for solid oxide fuel cell. Coatings 2023, 13, 1144. [Google Scholar] [CrossRef]
- Reddy, M.J.; Chausson, T.E.; Svensson, J.E.; Froitzheim, J. 11–23% Cr steels for solid oxide fuel cell interconnect applications at 800 °C—How the coating determines oxidation kinetics. Int. J. Hydrogen Energy 2023, 48, 12893–12904. [Google Scholar] [CrossRef]
- Tomas, M.; Svensson, J.; Froitzheim, J. Evaluation of selected Fe–Cr steels under single- and dual-atmosphere conditions for intermediate-temperature solid oxide fuel cell interconnect applications. Int. J. Hydrogen Energy 2024, 65, 112–125. [Google Scholar] [CrossRef]
- Talic, B.; Venkatachalam, V.; Hendriksen, P.V.; Kiebach, R. Comparison of MnCo2O4 coated Crofer 22 H, 441, 430 as interconnects for intermediate-temperature solid oxide fuel cell stacks. J. Alloys Compd. 2020, 821, 153229. [Google Scholar] [CrossRef]
- Reddy, M.J.; Visible, A.; Svensson, J.; Froitzheim, J. Investigation of coated FeCr steels for application as solid oxide fuel cell interconnects under dual-atmosphere conditions. Int. J. Hydrogen Energy 2023, 48, 14406–14417. [Google Scholar] [CrossRef]
- Nguyen, T.D.; Zhang, J.; Young, D.J. Microstructure of Cr2O3 scales grown in Ar-5H2O-(5H2) at 850 °C. High Temp. Corros. Mater. 2024, 101, 1277–1286. [Google Scholar] [CrossRef]
- Piccardo, P.; Spotorno, R.; Geipel, C. Investigation of a metallic interconnect extracted from an SOFC stack after 40,000 h of operation. Energies 2022, 15, 3548. [Google Scholar] [CrossRef]
- Peng, J.; Zhao, D.; Xu, Y.; Wu, X.; Li, X. Comprehensive analysis of solid oxide fuel cell performance degradation mechanism, prediction, and optimization studies. Energies 2023, 16, 788. [Google Scholar] [CrossRef]
- Geng, S.J.; Zhu, J.H. Promising alloys for intermediate-temperature solid oxide fuel cell interconnect application. J. Power Sources 2006, 160, 1009–1016. [Google Scholar] [CrossRef]


Disclaimer/Publisher’s Note: The statements, opinions and data contained in all publications are solely those of the individual author(s) and contributor(s) and not of MDPI and/or the editor(s). MDPI and/or the editor(s) disclaim responsibility for any injury to people or property resulting from any ideas, methods, instructions or products referred to in the content. |
© 2025 by the authors. Licensee MDPI, Basel, Switzerland. This article is an open access article distributed under the terms and conditions of the Creative Commons Attribution (CC BY) license (https://creativecommons.org/licenses/by/4.0/).