Article

Novel Approach to the Surface Degradation Assessment of 42CrMo4 Steel in Marine and Cavitation Erosion Environments

1
Maritime Faculty, University of Montenegro, 85330 Kotor, Montenegro
2
Institute of Chemistry, Technology and Metallurgy, National Institute of the Republic of Serbia, University of Belgrade, 11000 Belgrade, Serbia
3
Faculty of Technology and Metallurgy, University of Belgrade, 11120 Belgrade, Serbia
4
The Academy of Engineering Sciences of Serbia (AESS), 11000 Belgrade, Serbia
*
Author to whom correspondence should be addressed.
Metals 2025, 15(10), 1154; https://doi.org/10.3390/met15101154
Submission received: 26 August 2025 / Revised: 9 October 2025 / Accepted: 15 October 2025 / Published: 17 October 2025

Abstract

This study focuses on the susceptibility and surface degradation of low-alloy carbon steel 42CrMo4 to corrosion and cavitation erosion, as this steel is widely used in marine environments with aggressive chemical species and harsh conditions. Due to its high strength and fatigue resistance, 42CrMo4 steel is often employed in offshore mechanical components such as shafts and fasteners as well as crane parts in ports and harbors. Various experimental methods, including corrosion and cavitation tests, were used to assess the steel’s surface integrity under extreme conditions. Surface changes were monitored using modern analytical tools for precise assessments, including image and morphological analyses, to quantify degradation levels and specific parameters of defects induced by corrosion and cavitation. Non-destructive techniques such as optical microscopy (OM), scanning electron microscopy (SEM), energy-dispersive spectroscopy (EDS), and image analysis software were employed for the quantitative assessment of morphological parameters and elemental analysis. EDS analysis revealed changes in elemental composition, indicating corrosion products that caused significant mass loss and defect formation, with degradation increasing over time. The average corrosion rate of 42CrMo4 steel in a 3.5% NaCl solution reached a peak value of 0.846 mm/year after 120 days of exposure. Cavitation erosion behavior was measured based on mass loss, indicating the occurrence of different cavitation periods, with the steady-state period achieved after 60 min. The number of formed pits increased until 120 min, after which it decreased slightly. This indicates that a time frame of 120 min was identified as significant for changes in the mechanism of pit formation. Specifically, up to 120 min, pit formation was the dominant mechanism of cavitation erosion, while after that, as the number of pits slightly declined, the growth and merging of formed pits became the dominant mechanism. The cavitation erosion tests showed mass loss and mechanical damage, characterized by the formation of pits and cavities. The findings indicate that the levels of surface degradation were higher for corrosion than for cavitation. The presented approach also provides an assessment of the degradation mechanisms of 42CrMo4 steel exposed to corrosive and cavitation conditions.

1. Introduction

42CrMo4 steel is a low-alloy carbon steel known for its high toughness, good hardness, ductility, and exceptional tensile and fatigue strength. Due to its high strength and fatigue resistance, 42CrMo4 steel is often employed in offshore mechanical components such as shafts and fasteners as well as crane parts in ports and harbors. Although the steel is employed in machinery components within harbor facilities, port structures, or ships, it is still susceptible to exposure to chloride ions through seawater or atmospheric moisture [1,2,3,4]. However, when exposed to seawater and chloride ions, appropriate corrosion protection measures are essential due to its limited inherent corrosion resistance.
This study focuses on this particular steel for several reasons: it is low-cost, possesses high strength, and exhibits hardenability due to the tempered martensitic microstructure formed under appropriate thermal treatment conditions. This steel is widely used in the manufacturing of various mechanical components, including parts for marine equipment such as shafts, crankshafts, connecting rods, drilling joints, pump components, steam turbines, and salvage equipment [1,2,3,4,5]. Wear and corrosion are surface-dependent degradation phenomena that are particularly significant in the harsh environmental conditions found in deep-sea oil and gas wells, where aggressive chemical species such as chloride/bromide salts, organic acids, carbon dioxide, and hydrogen sulfide are present [5,6]. Since corrosion typically starts at a material’s surface, poor surface coherence can significantly reduce its corrosion resistance, leading to the development of corrosion-related issues [1,7,8]. To ensure the reliable performance of marine equipment components made from 42CrMo4 high-strength steels in marine environments, it is essential to achieve excellent corrosion resistance on their machined surfaces. Therefore, it is important to understand the corrosion resistance of 42CrMo4 steel and how it interacts with salt solution conditions.
The physical degradation of a metal surface exposed to corrosion can be classified into three types: damage, wear, and erosion [9,10,11]. Seawater is a complex mixture of 11 constituents that make up almost 99.95% of total solutes. The predominant constituents are inorganic salts, mainly chlorides. Additionally, dissolved gases (especially oxygen and carbon dioxide, important in the context of corrosion), suspended solids, organic compounds, and organisms (biological life: bacteria, slime, seaweed, mussels, barnacles, and many kinds of animals or fish) are also constituents of seawater [9,10,11,12]. More precisely, seawater is a 3.5 wt.% solution of various salts, of which 86% is sodium chloride (NaCl), along with smaller amounts of magnesium (Mg2+), calcium (Ca2+), and potassium (K+) [13]. The cations in solution form strong alkalis, while the anions (chlorides (Cl), sulfates (SO42−), and bicarbonates (HCO3)) form weak acids. Consequently, the pH of seawater is relatively high and constant, around 8, with high electrical conductivity [12]. The concentration of dissolved materials in the sea varies by location and ambient temperature due to the dilution of seawater from rivers, rain, or melting ice, while evaporation can concentrate seawater. However, the concentration ratio of major constituents remains remarkably constant worldwide. In the marine environment, the rate of corrosion depends on several factors, including salinity, seawater flow velocity, dissolved oxygen concentration, pH, oxidation–reduction potential, and temperature [14]. Steel structures fully or partially exposed to seawater may experience varying rates of corrosion, which are influenced by the composition of seawater at different geographical locations, primarily due to the variability in environmental factors affecting corrosion [9]. The corrosion processes in seawater can be divided into four basic zones: the atmospheric corrosion zone, the tidal zone, the underwater corrosion zone, and the corrosion in the mud zone. The key factors affecting metal corrosion in seawater are chemical, physical, and biological [12].
Cavitation is a dynamic phenomenon characterized by the nucleation, growth, and subsequent collapse (implosion) of vapor-filled cavities within a flowing liquid. The initiation of cavitation is primarily influenced by the pressure conditions present in the liquid. The detachment of material from a solid surface due to this process is known as cavitation erosion, while the resulting degradation is termed cavitation damage [15,16,17,18,19,20,21,22]. This type of damage has been observed in various hydraulic components, including ship propellers, hydrofoils, dam spillways, valves, tunnels, hydraulic pumps, turbines, and other hydraulic structures [15,23,24,25]. A recent study conducted by Hofmann et al. [26] focused on the cavitation erosion properties of martensitic stainless steel X3CrNiMo13-4 QT780 and the difference between hydrodynamic and acoustic cavitation erosion in its mechanical response. The findings show that although hydrodynamic cavitation erosion creates larger pits at a lower frequency, acoustic cavitation erosion creates smaller pits at a high temporal frequency. Furthermore, the area covered by pits in acoustic cavitation is smaller than that of hydrodynamic cavitation for a given exposure duration. Acoustic cavitation causes initial damage more quickly than hydrodynamic cavitation, according to analysis of the same small section of the exposed sample surface over exposure time using scanning electron microscopy. Gao et al. [27] performed cavitation erosion tests to evaluate the susceptibility of stainless steels 316L and 420 to cavitation-induced damage. This study used an artificial neural network to predict cavitation damage and establish relationships between damage and parameters such as cavitation time, roughness, and residual stress. The results indicated that microhardness and residual stress were not related to cavitation damage; however, the increase in both cavitation time and roughness increases cavitation damage. Research by Raami et al. [28] showed that quenching and partitioning (Q & P) heat treatment improves the cavitation erosion resistance of AISI 420 stainless steel. This enhancement is due to increased initial hardness and retained austenite. During cavitation, the retained austenite transforms into strain-induced martensite, absorbing bubble collapse energy, increasing hardness, and preventing crack propagation, thus reducing cavitation damage. Basumatary [21,29] conducted studies monitoring the combined synergistic effects of cavitation erosion and corrosion in seawater on various propeller materials, including 2205 duplex stainless steel (DSS) and as-cast nickel aluminum bronze (NAB). The materials were subjected to pure erosion, pure corrosion, and the combined effect of erosion–corrosion to understand and measure the individual contributions of each aspect. The results showed that DSS exhibited higher resistance to corrosion in seawater, while NAB demonstrated significantly greater corrosion resistance when subjected to cavitation. It was concluded that synergy significantly impacted the cavitation erosion–corrosion of both NAB and DSS. NAB was more prone to erosion under both conditions compared to DSS, with noticeable selective cavitation erosion of the alpha phase in its microstructure. Overall, the synergism in NAB was found to be greater than in DSS. Bărbulescu et al. [30] investigated the corrosion behavior of brass in a cavitation seawater environment. This study introduced a fractal/multifractal analysis of a brass sample subjected to corrosion-erosion due to cavitation. It monitored fissure propagation through fractal methods, focusing on the fractal characteristics of the sample’s surface after erosion–corrosion, as well as the multifractal characteristics of the material’s mass variation over time in a cavitation field. This computational approach allows for the determination of damage patterns in materials caused by ultrasound cavitation. Dojcinovic’s study [31] focused on the morphology of cavitation damage and erosion rates in heat-treated medium carbon steel. The study revealed that the coarse-grained microstructure of the ferrite and pearlite phases resulted in poor cavitation resistance, making the material unsuitable for hydraulic machinery components subjected to high hydrodynamic intensities. Bordeasu et al. [32] and Dojcinovic [33] introduced roughness measurement as an alternative metric for evaluating the cavitation resistance of materials. The former [34] investigated the cavitation resistance of alloyed steel 16MnCr5, bronze CuAl10Ni5Fe2.5Mn1, and alloyed steel 42CrMo4, confirming the possibility of using the parameter Rz to estimate the cavitation erosion resistance of a material by comparing it with the results of the mean depth of erosion (MDE) parameter. On the other hand, the latter [33] monitored the behavior of low-alloyed steel 42CrMo4 and high-alloyed steel X6CrNiMoTi17-12-2 under cavitation exposure by comparing results obtained from the cross-sections of samples and optical microscopy with the profile lines obtained through roughness measurement. Both studies demonstrated that the results obtained from roughness changes are consistent with those based on measurements of mass loss and the morphology of surface damage during the cavitation testing period. Han et al. [34] studied the cavitation–erosion behavior of chromium nitride (CrN) coatings on AISI 4140 steel (42CrMo4) substrates in both fresh water and a 3.5% NaCl solution, using an ultrasonic vibration system to assess their performance. The study demonstrated that CrN coatings, deposited by means of cathodic arc plasma deposition (CAPD) with and without an electroplated chromium interlayer, exhibited improved cavitation resistance. However, damage in NaCl solution was more pronounced than in freshwater.
Notably, literature on the cavitation resistance of 42CrMo4 low-alloy steel is limited, with only a few studies investigating its resistance improvement through various heat treatment processes. It is also important to highlight that the cavitation erosion behavior of this steel has primarily been examined in the context of coatings rather than in its uncoated form. Furthermore, there is a lack of literature comparing the corrosion behavior of 42CrMo4 alloy samples in NaCl solution, an artificial substitute for marine environments, with cavitation erosion in distilled water, which is the primary focus of this paper. The goal of this study is to monitor the deterioration of the sample by applying not only the methods proposed by the corresponding standard but also several new non-destructive techniques. The study includes morphological analysis using optical microscopy (OM) and scanning electron microscopy (SEM), elemental chemical analysis via energy-dispersive spectroscopy (EDS), and image analysis procedures to describe and quantify the degradation. Additionally, profilometry was used to assess the surface roughness caused by cavitation and corrosion in a 3.5% NaCl solution of 42CrMo4 steel samples.

2. Experiment

2.1. Material

The steel examined in this study is 42CrMo4 low-alloy steel, produced through conventional casting methods in an as-cast condition. This steel is recognized for its high strength, toughness, and wear resistance, making it an ideal choice for various engineering applications. After casting, the material was shaped into beams and subjected to hot rolling. Prior to deformation, the beams were heated to 1024 °C, corresponding to approximately two-thirds of iron’s melting temperature, and subsequently processed using a four-stand rolling mill. The sample was supplied by Kovintrade International Trade Inc. in Celje, Slovenia, as hot-rolled plates, with dimensions of 10 mm × 1000 mm × 2000 mm. The samples used for testing were prepared by cutting cuboid sections from the steel plates, as illustrated in Figure 1.
The chemical composition was determined through quantitative chemical analysis of iron, steel, steel castings, and grey iron castings, using optical emission spectrometry (OES) (which is based on the detection of characteristic light emitted by atoms and ions excited by a high-voltage spark) for the elemental analysis of solid metallic samples. The optical emission spectrometer Spectro MAXx-M LMM04 was employed for this analysis. The content of identified elements was assessed in accordance with the SRPS C.A1.011:2004 standard [35], and the chemical composition of the tested steel met the requirements of the EN 10083-3 standard [36]. The results of the chemical composition are shown in Table 1.
This composition provides a balanced combination of mechanical properties, including enhanced hardenability and resistance to wear and fatigue, which are crucial for components operating in aggressive environments and high-stress conditions.

2.2. Methods

2.2.1. Corrosion Testing

Corrosion testing in marine environments assesses how materials withstand the harsh, corrosive conditions of seawater and high humidity. These tests are essential for industries such as shipping, offshore structures, and marine equipment manufacturing. Standards provide guidelines to ensure consistent results and emphasize common principles, methods, and considerations related to corrosion in marine settings [37,38].
In the proposed procedure, prepared samples of structural steel 42CrMo4 were fully immersed in synthetic seawater, specifically a 3.5% NaCl solution, to simulate a marine environment. Corrosion testing was monitored at 30-day intervals over a total immersion period of 120 days. Weight loss measurements were performed, as these are crucial for evaluating corrosion in marine environments and for quantifying material degradation when exposed to harsh conditions such as seawater. This method offers a direct assessment of material degradation, typically expressed as a corrosion rate (mm/year). Additionally, the mass of the samples was measured using an analytical balance with an accuracy of ± 0.1 mg, before and after each immersion interval. The surface morphology and elemental analysis of the samples were examined using a field emission scanning electron microscope and energy-dispersive spectroscopy.
Mass loss analysis involves weighing a sample before and after exposure to a corrosive salt environment. After exposure, the samples are cleaned to remove corrosion products, and the cumulative weight loss is calculated using Equation (1):
Mass loss (W) = Winitial − Wfinal
where Winitial and Wfinal are the masses (in grams) of the sample before and after the corrosion experiments, respectively.
Corrosion rate is typically associated with surface corrosion, while the obtained results are related to pit corrosion layers. These rates provide an initial estimate of the reliability of the tested steel samples exposed to a NaCl solution. The average corrosion rate (according to [34,39]) can be obtained using Equation (2).
C R = K   · W A ·   T   · D
where CR is the corrosion rate in mm/year, K is a constant equal to 8.76 × 104 mm/year, T is the time of exposure in hours, A is the area in cm2, W is the mass loss in grams, and D is the density of steel in g/cm3.

2.2.2. Cavitation Erosion Testing

The cavitation erosion test was conducted using the ultrasonic vibration method with a stationary sample, following the ASTM G-32-16 standard [40]. The cavitation setup, together with its relevant characteristics, is shown in Figure 1. The test conditions were as follows: frequency of 20 ± 2 kHz, amplitude 50 ± 2 µm, a diameter of the probe of 16 mm, and a distance of 0.5 mm from the probe to the sample. Distilled water was used at a temperature of 25 ± 1 °C. The sample dimensions were 20 mm in width and 4 mm in height, with its geometry (cuboid), also illustrated in Figure 1. Cavitation testing was performed in intervals of 10 and 30 min, for a total testing duration of 150 min.
Before and after each interval of the cavitation erosion test, the samples were dried at 110 °C for one hour until they reached a constant mass. The mass of the samples was measured before and after each testing interval using an analytical balance with an accuracy of ±0.1 mg.

2.2.3. Methods Applied for Monitoring Cavitation and Corrosion Testing

The surface morphology of the samples was examined using a field emission scanning electron microscope (FESEM, JEOL JSM 7001F, JEOL Ltd., Tokyo, Japan) at room temperature, with an acceleration voltage of 20 kV and a probe current of 10 nA. Elemental analysis (EDS) of the samples’ surfaces was conducted using the OXFORD Xplore 15 (Oxford Instruments, Oxfordshire, UK) instrument.
Digital images obtained from the Trinocular Metallurgical Microscope EUME 640 were analyzed to determine the level of destruction by measuring the damaged surface area during testing.
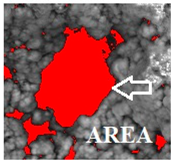
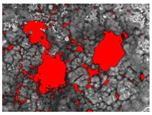
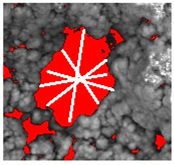
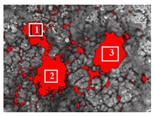
The degree of cavitation and corrosion-induced damage on the sample’s surface was monitored through image analysis using the Image-Pro Plus 6.0 software package IPP (Media Cybernetics, 2006, Rockville, MD, USA). This software allows for the determination of various descriptors that provide a morphological characterization of the formed pits. The list of morphological descriptors selected for this study is provided in Table 2.
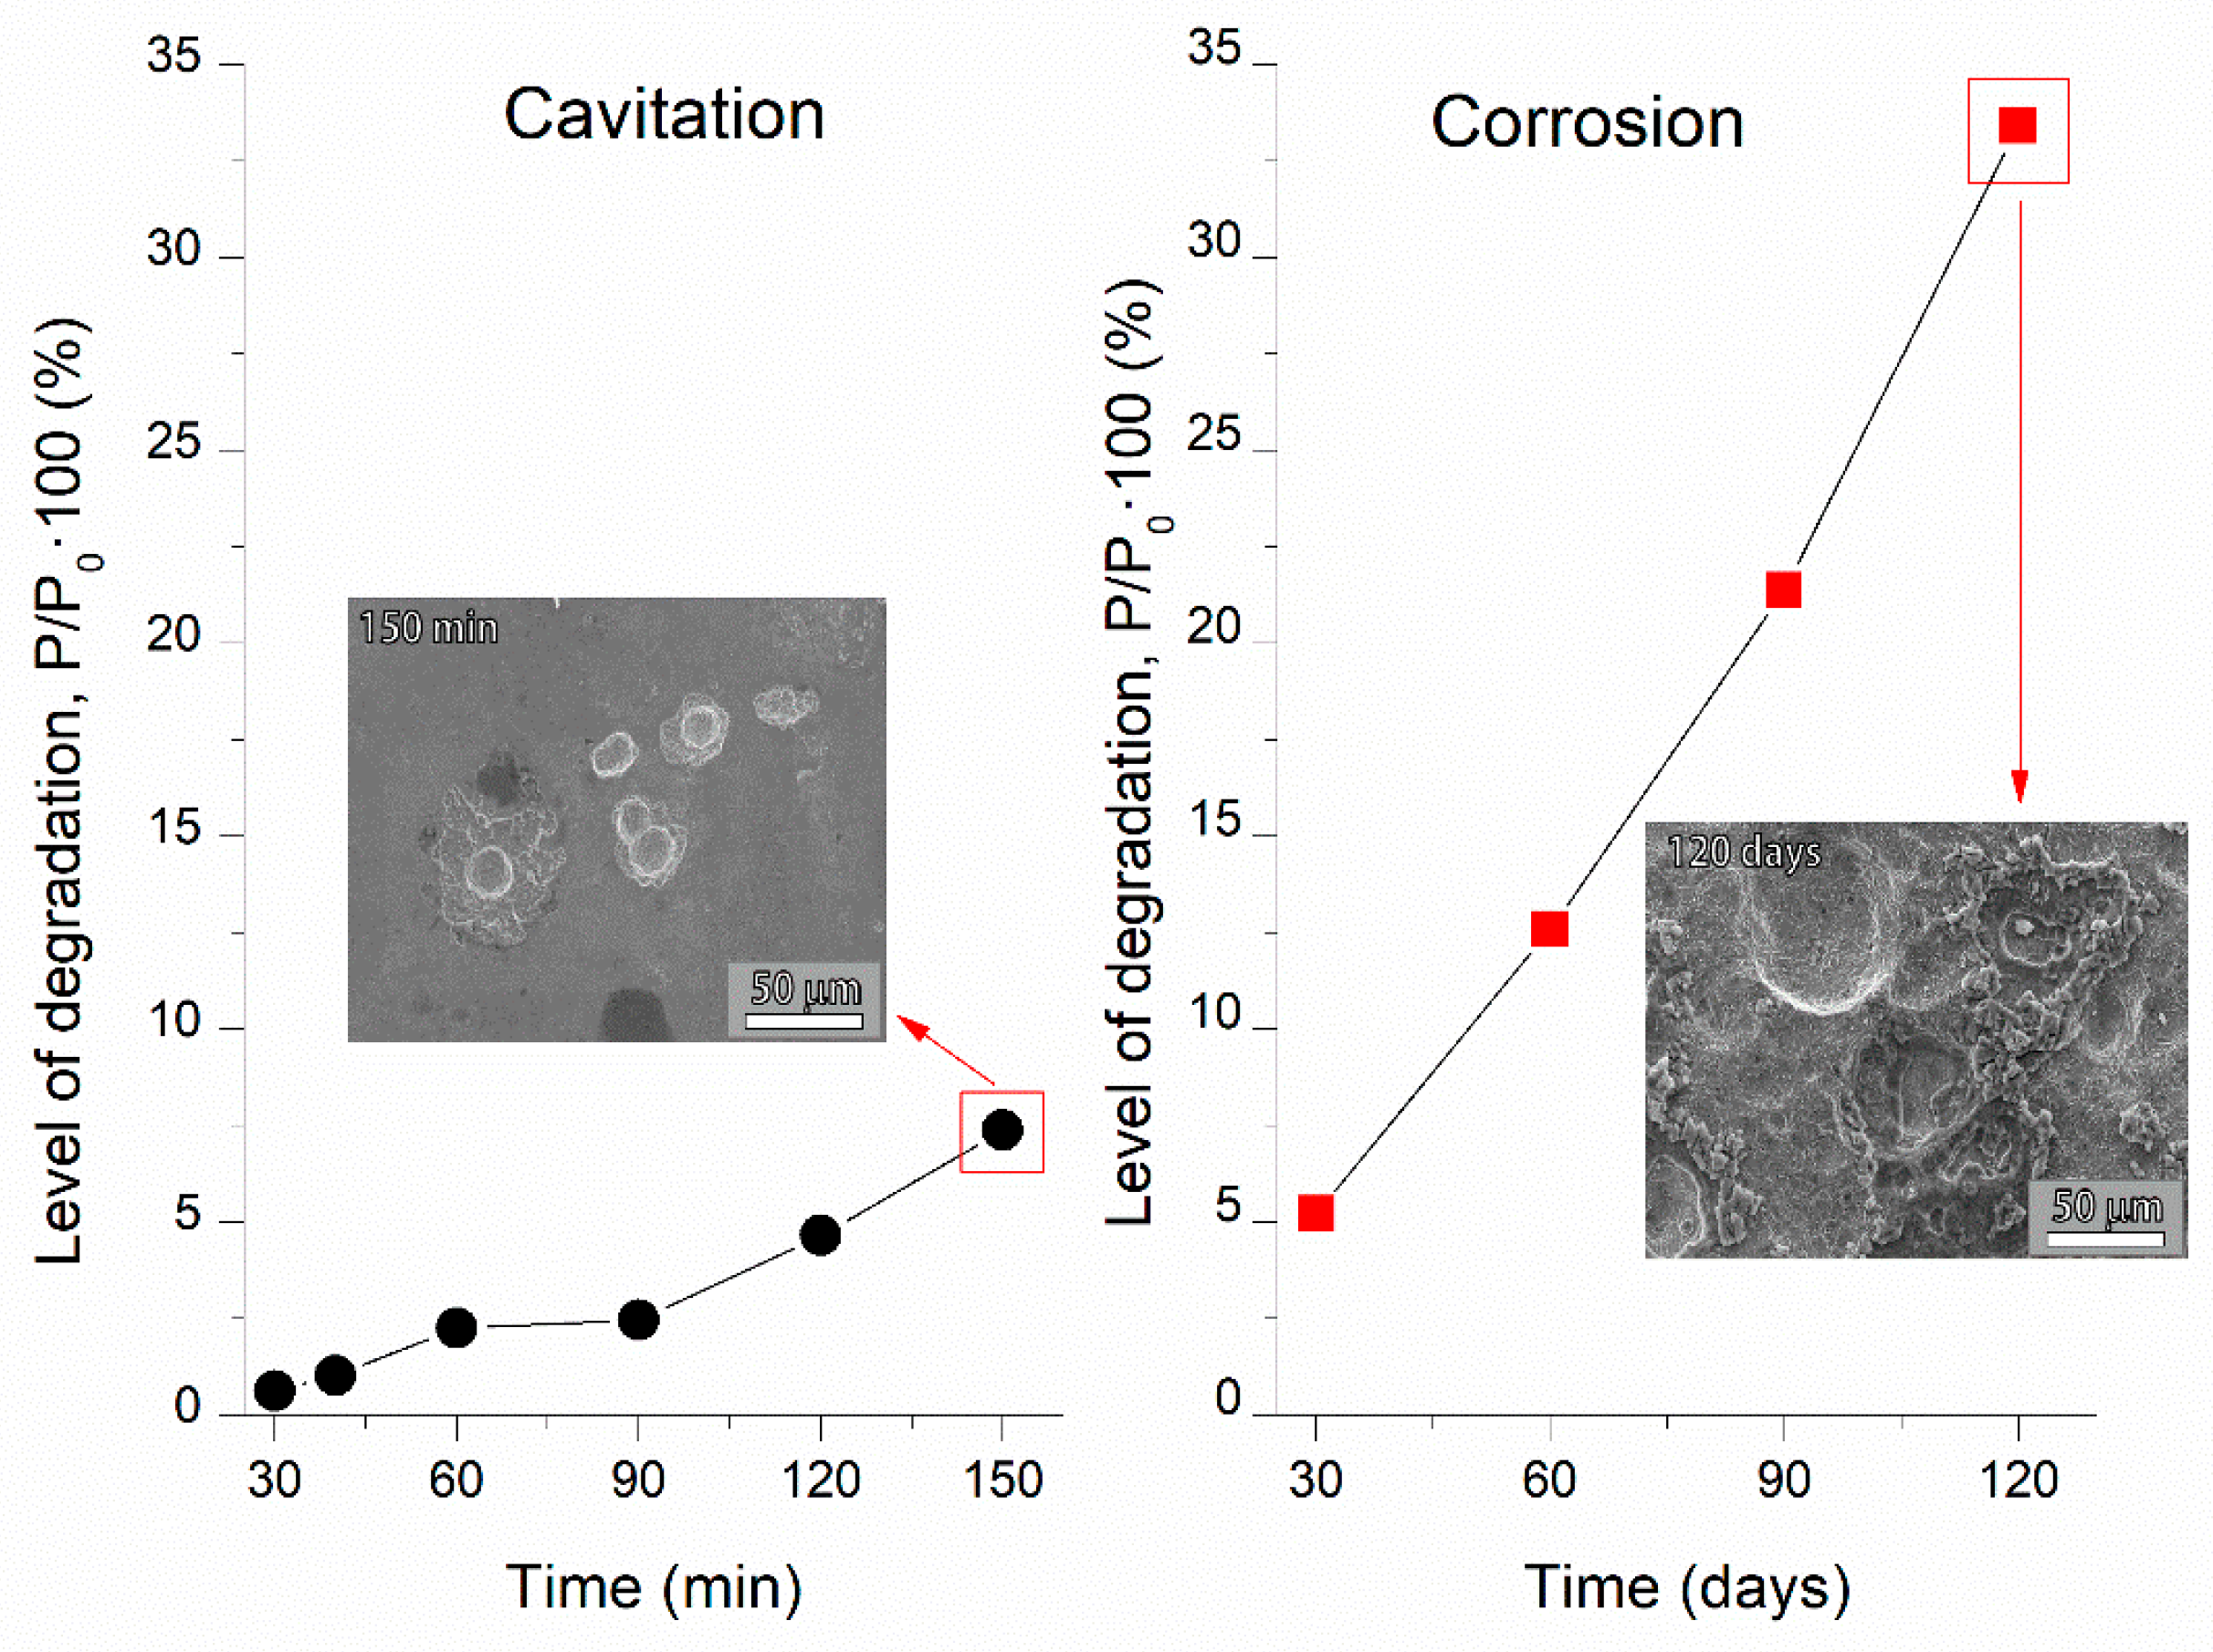
Using IPP tools, the total area of the surface defects was measured to calculate the level of degradation according to Equation (3). The level of surface degradation is defined as the ratio of the damaged surface area to the original surface area.
L e v e l   o f   d e g r a d a t i o n = P P 0 · 100 %
where P is the total degraded area (mm2) and P0 is the area of the sample surface (mm2).

3. Results and Discussion

3.1. Corrosion Erosion Experiments

3.1.1. Mass Loss

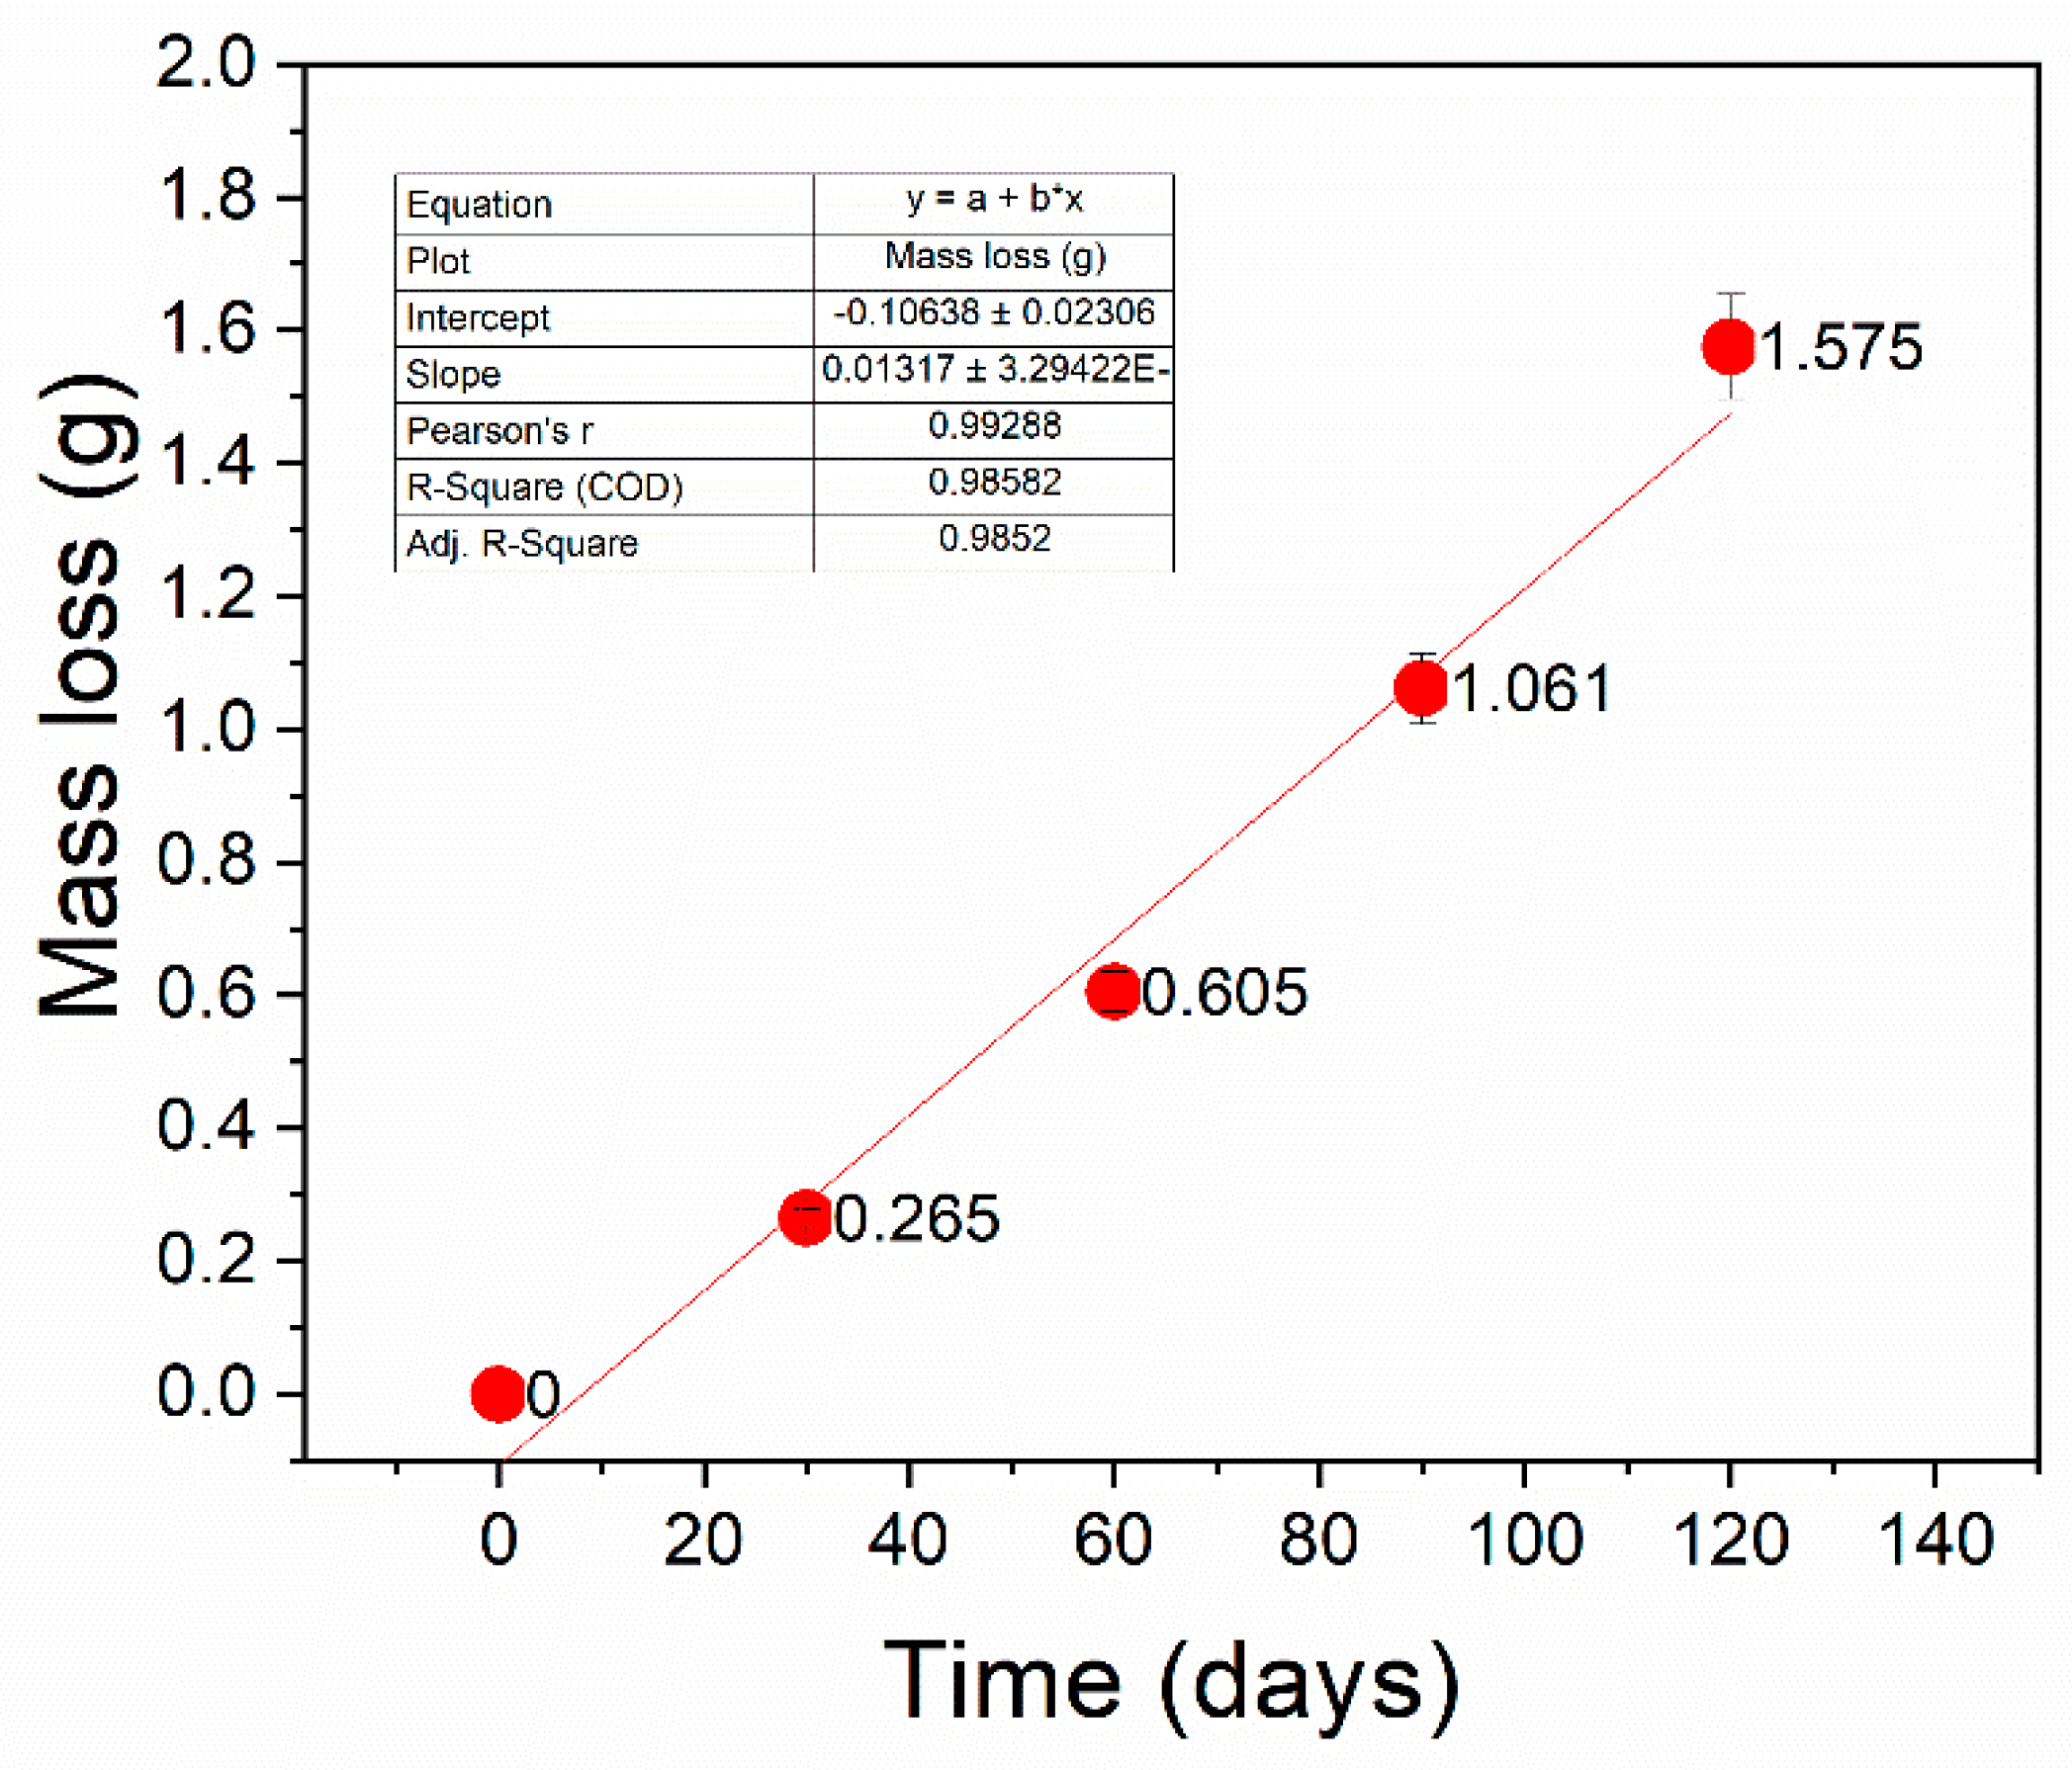
The relationship between mass loss and corrosion duration is illustrated in Figure 2. The mass loss of 42CrMo4 steel exhibits an increasing trend with successive periods of immersion in the NaCl solution. This mass loss follows an almost linear dependence over time. Such a trend is considered justified because when the low-alloy steel surface is exposed to a corrosive environment, it is likely to react with seawater, atmospheric oxygen, and chloride ions, leading to the formation of corrosion products. Over time, a relatively stable layer of these products, such as rust, can develop. This protective rust layer can slow further corrosion to some extent, thereby reducing the overall corrosion rate.
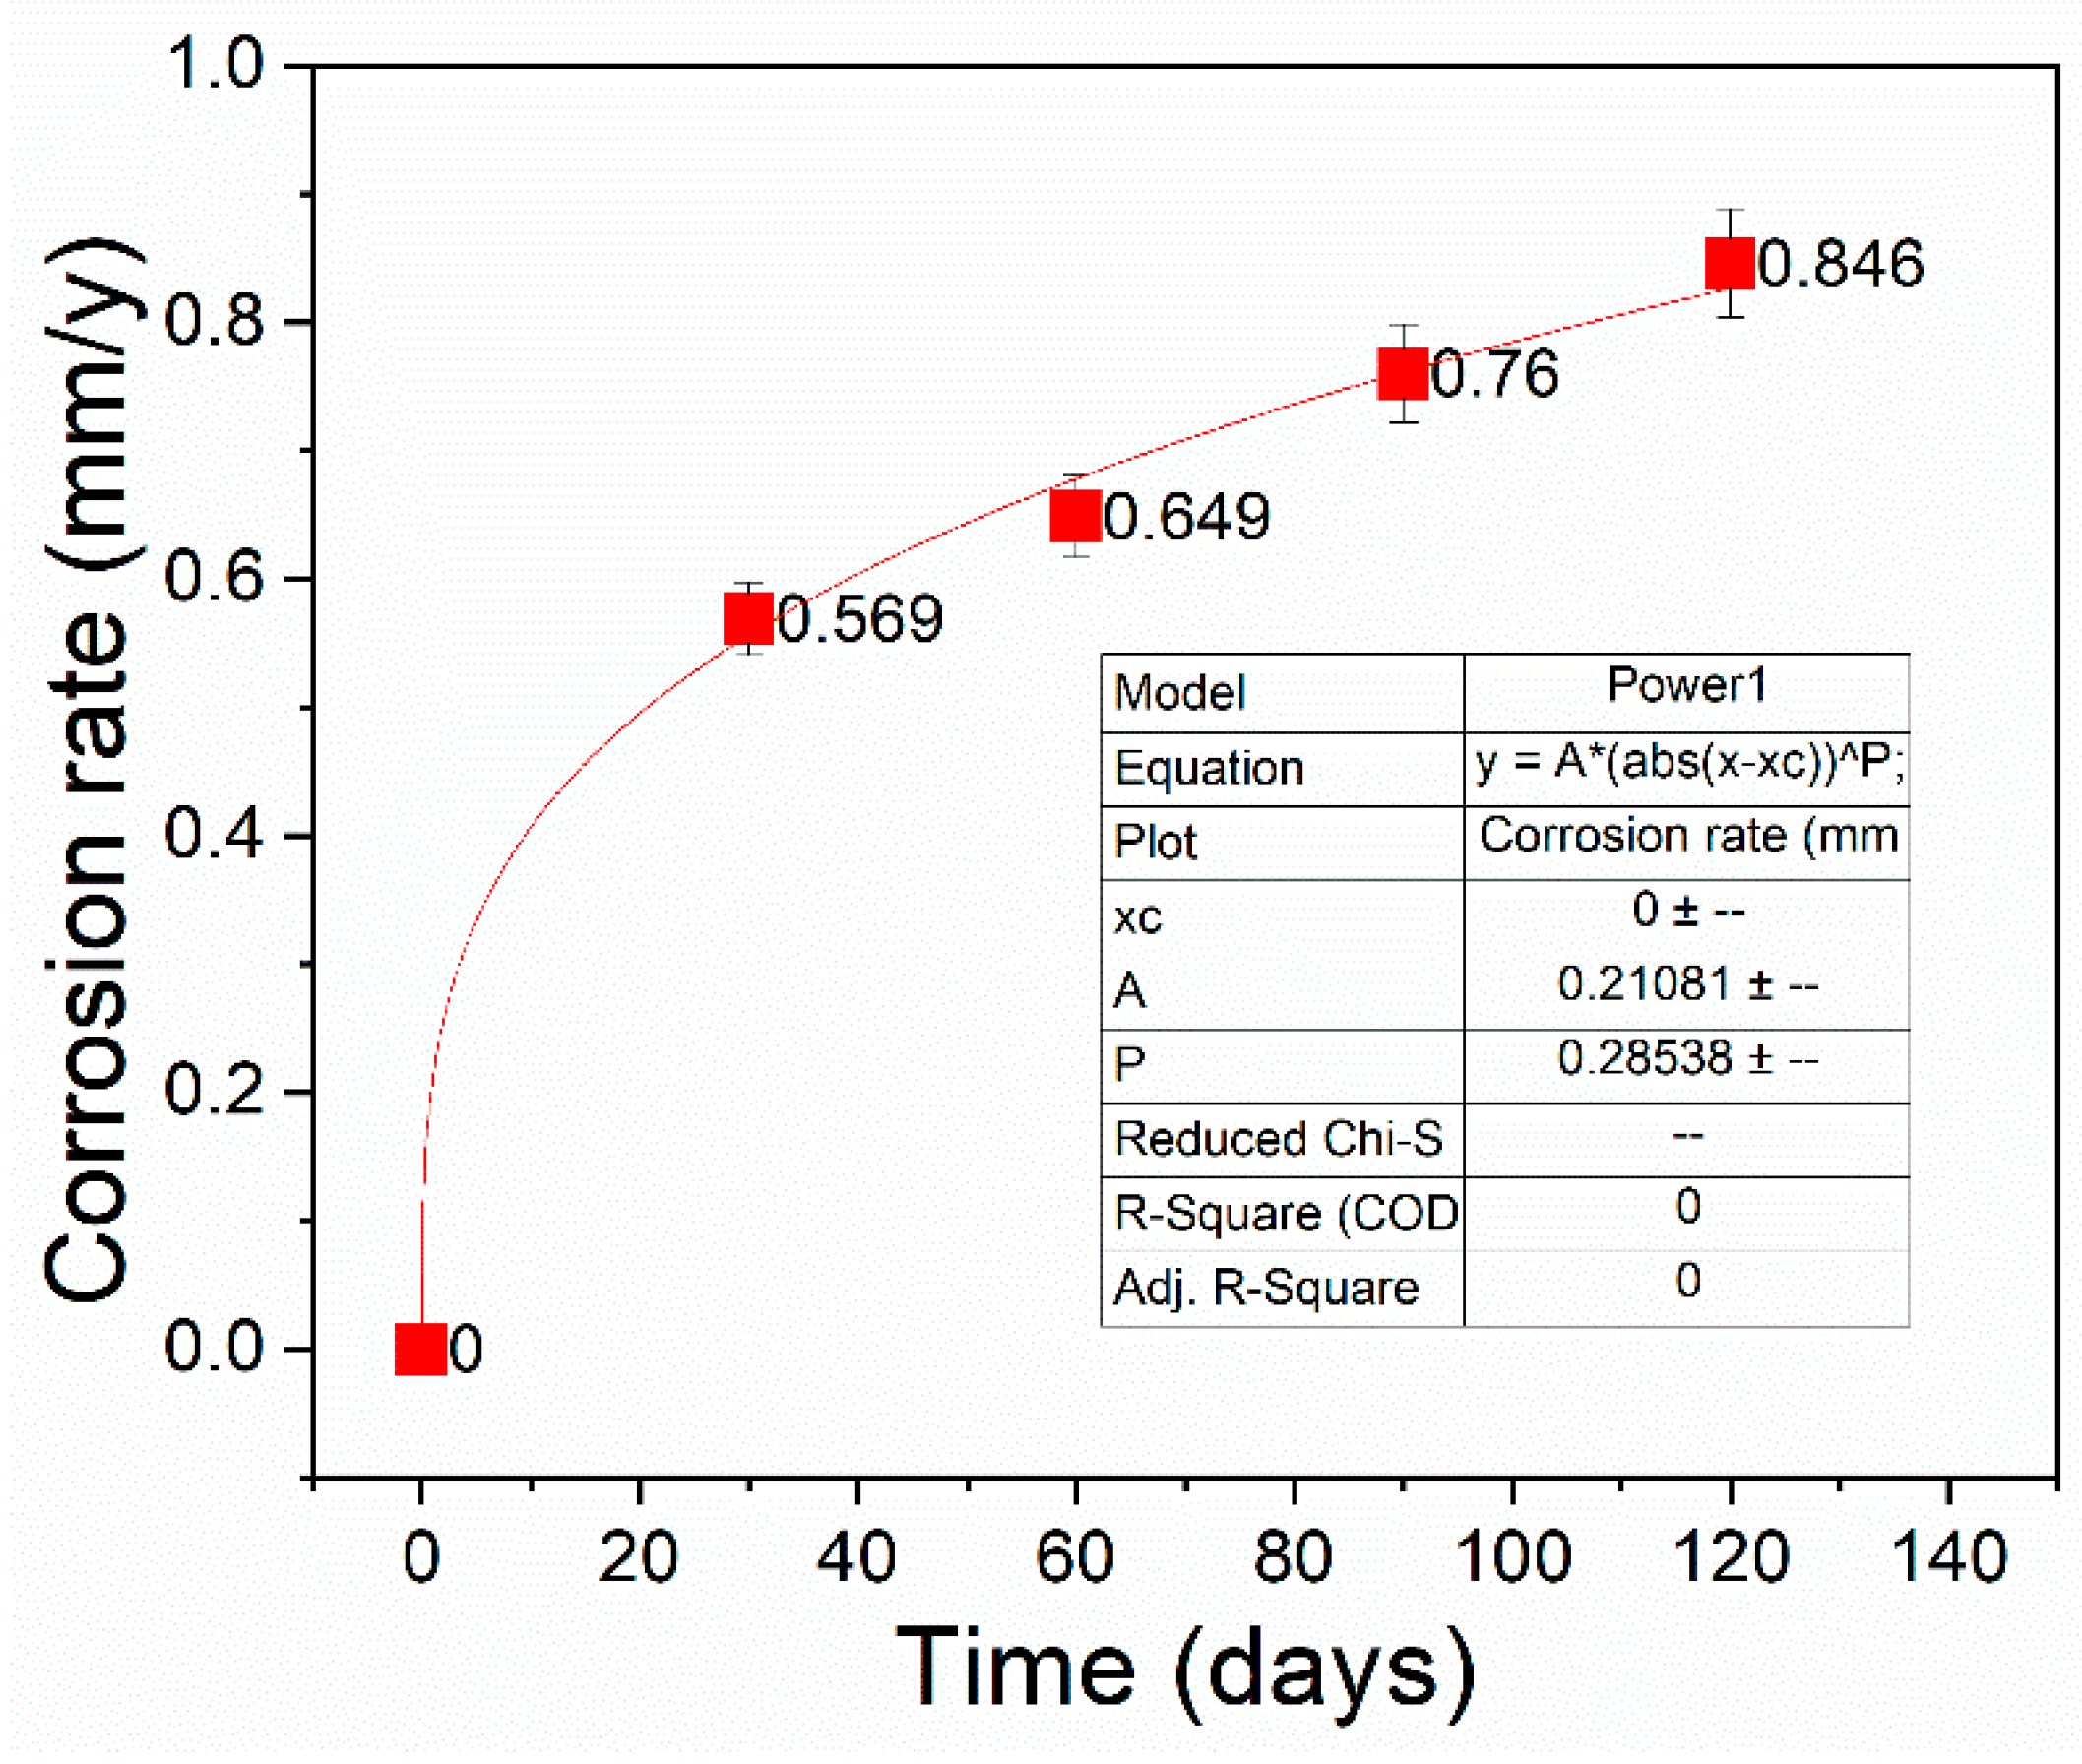
Calculated results for various test durations of corrosion rate are presented in Figure 3. Generally, as the exposure time increases, the corrosion rate of the specimens also rises. The initial corrosion rate is high, leading to aggressive corrosion as chloride ions accelerate dissolution. Over time, as corrosion continues, the rate gradually decreases. This decrease is likely due to the formation of corrosion products, such as iron oxides and hydroxides, on the metal surface. More precisely, these products partially block active sites, creating a barrier to further ion exchange, which makes the surface less reactive and slows down the corrosion process. The slope of the curve indicates that corrosion accelerates up to 30 days of testing, after which the rate slightly slows down until 120 days. The average corrosion rate of 42CrMo4 steel in a 3.5% NaCl solution exhibits a power law increase over time, peaking at 0.846 mm/year after 120 days of exposure to the solution.
Statistical analysis of the corrosion rate reveals the following parameters: the average corrosion rate indicates a material loss of 0.706 mm in thickness per year, which is considered significant. A 95% confidence interval (CI) suggests that the true mean corrosion rate is likely to fall between 0.513 mm/year and 0.899 mm/year, confirming the reliability of this estimate. Additionally, since the p-value is less than 0.001 (much lower than 0.1%), it indicates that the corrosion is statistically significant, confirming that it is real and measurable.

3.1.2. Image Analysis of Defect Morphology

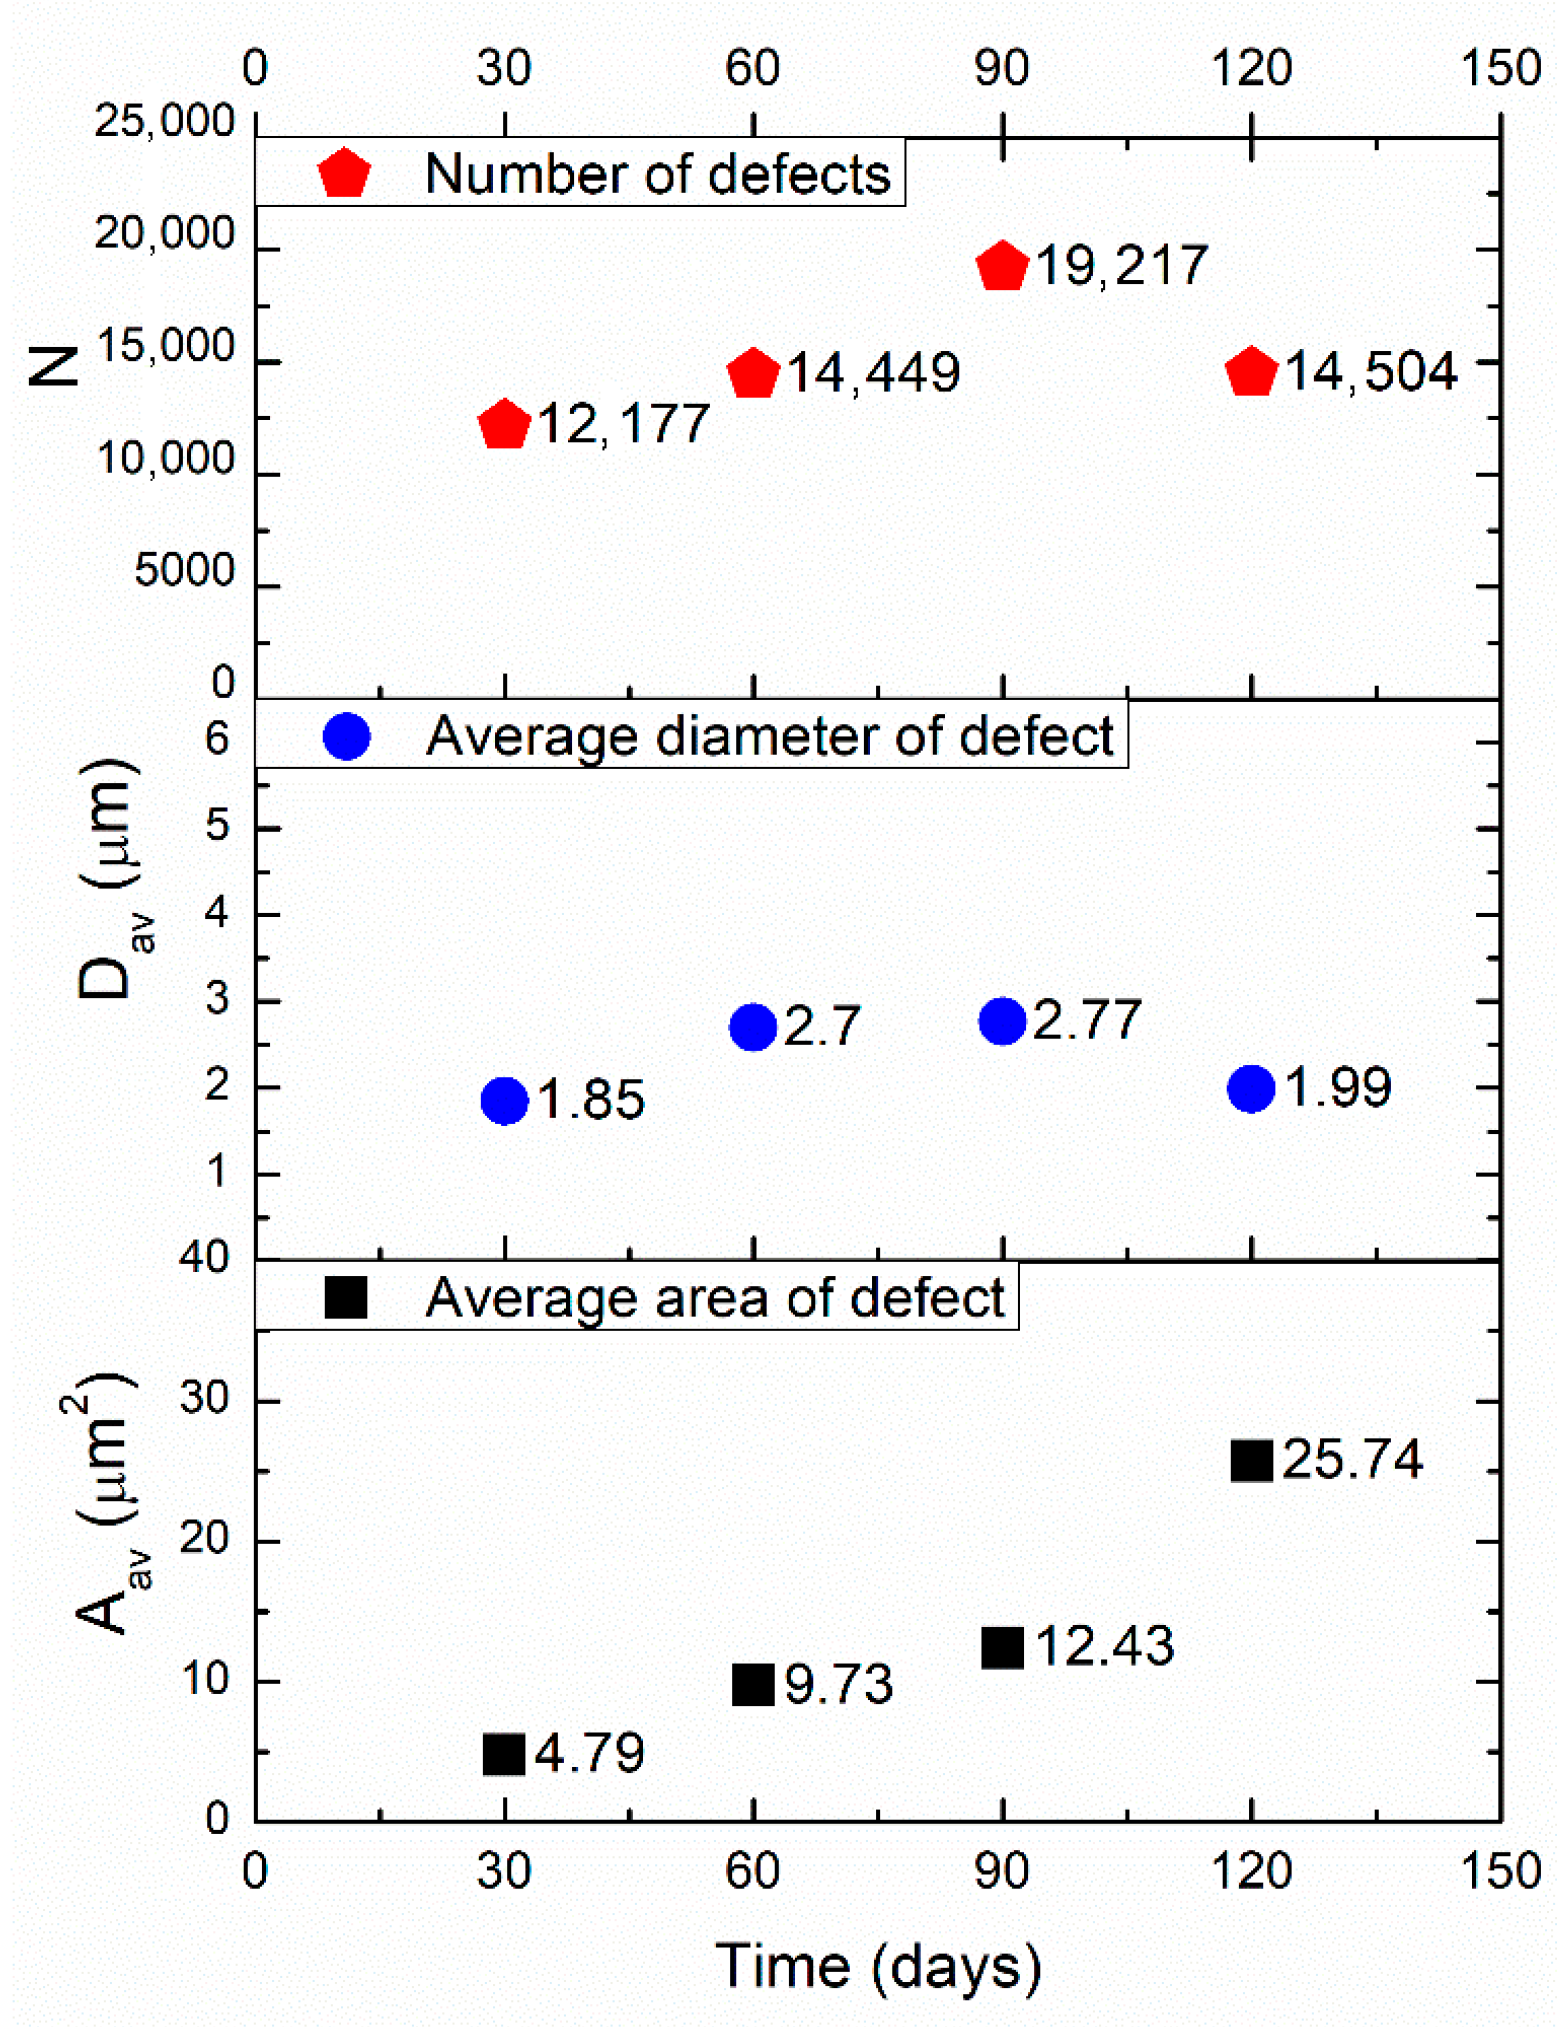
Image analysis was performed on SEM images captured at a lower magnification (Figure 4), unlike higher magnification micrographs used for EDS analysis, to evaluate the level of damage over as large a surface area as possible. This approach was focused on the morphology of corrosion-induced defects, which were quantified through three key parameters: the average surface area of the defect, the average defect diameter, and the total number of defects (Table 2). The results for these selected morphological parameters are presented in Figure 5.
The results confirm that corrosion leads to the formation of defects, increasing their area, diameter, and number over time. However, the mechanisms of defect formation and growth change during the testing period. Up to 90 days, the number of induced defects, along with their average areas and diameters, increases, indicating that both existing and newly formed defects are growing and merging because the obtained results of the average area of the formed defects are consistent with the number of defects. After 90 days of corrosion exposure, the formation of new defects is no longer the dominant mechanism, as the number of new defects decreases. This indicates that the merging of existing defects becomes predominant. Up to 90 days, the trends in average defect area and average defect diameter are similar. However, changes occur after this period, indicating that the average area of defects increases while the average diameter decreases. This suggests that there are changes in the shape or distribution of the defects, transitioning from more circular defects to more irregularly shaped ones that cover a larger area. This change may occur if the corrosion mechanism changes, leading to a finer and more distributed degradation pattern. More precisely, since the average diameter refers to the size of the defects, a decrease in that value together with an increase in the average area may indicate that the defects are no longer circular but are becoming more irregular in shape. The irregular shape of defects can result in larger surface areas, even with smaller average diameters, as their elongated or more complex shapes spread out over a larger area. Corrosion often leads to non-uniform surface degradation, so as it progresses, defects may spread over a larger area due to the surface roughening effect, increasing the overall defect area.

3.1.3. Microstructure Analysis: EDS Analysis

The changes in the elemental composition of 42CrMo4 steel before (Figure 6) and after exposure to a 3.5% NaCl solution (Figure 7, Figure 8, Figure 9 and Figure 10) were determined using EDS analysis. The measured values may vary by several tenths of a percent or more, depending on the element and the probe position. Carbon is excluded from this analysis due to measurement imprecision; for example, steel may show 3% carbon when the actual value is closer to 0.4%. All elements identified in the EDS spectrum were taken into account. Since this study focuses on the corrosion behavior of the tested steel, elements that may be introduced by sample contamination, such as those from seawater (Na, Cl, K, Ca, Sr, Br, and F), are expected, as they do not naturally occur in the steel. Consequently, elements like Ca and/or Cl are included in all elemental compositions and are presented in Figure 6, Figure 7, Figure 8, Figure 9 and Figure 10.
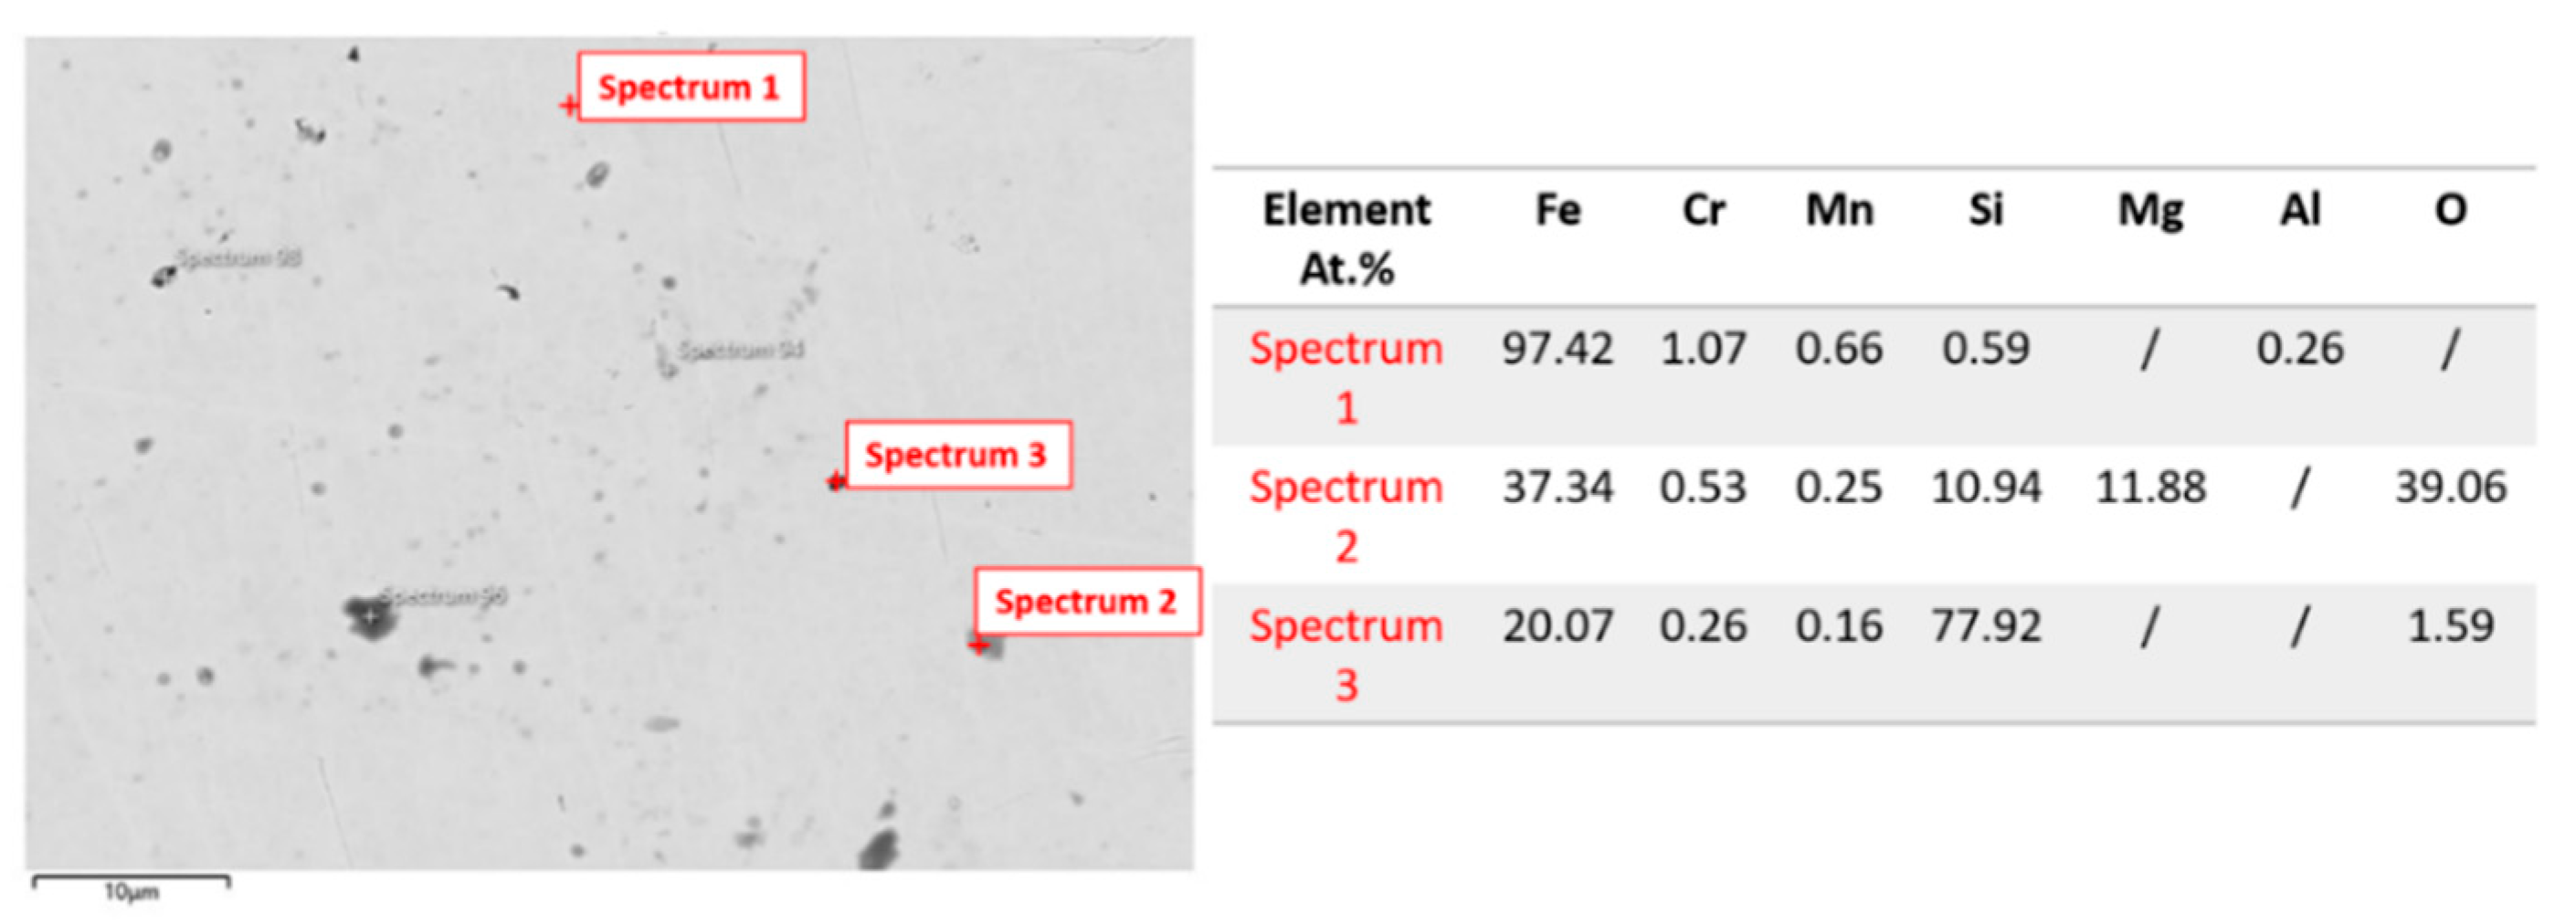
Figure 6 presents the SEM image and the elemental composition (derived from marked spots, Spectra 1–3) of 42CrMo4 steel on day zero, before exposure to corrosive media. According to SEM is obvious that this microstructure is smooth and uniform with minimal defects. The elemental composition obtained from the EDS analysis of the matrix region (Spectrum 1) is closely matched with the chemical composition shown in Table 1, containing a very high level of Fe (97.42 at.%), suggesting the presence of a ferrite microstructure as a major constituent, with small amounts of Cr, Mn, Si, and Al. Based on the microscopic analysis of the sample before testing, the microstructure after hot rolling is ferritic-pearlitic, with ferrite as the predominant microconstituent. Typically, the microstructure of 42CrMo4 steel after hot rolling consists of a ferrite-pearlitic structure, although variations may occur depending on the rolling temperature and subsequent cooling conditions [41,42,43]. However, there is a noticeable absence of molybdenum and reduced levels of impurities, which can be explained by the absence of exposure to the corrosive solution at this stage. EDS analysis (Spectrum 2) shows a significantly lower content of Fe (37.34 at.%), along with notable amounts of Mg (11.88 at.%) and Si (10.94 at.%). The presence of oxygen (39.06 at.%) indicates the existence of an oxide non-metallic inclusion, most likely a Mg-Si-O inclusion, possibly a spinel-type such as MgO·SiO2 or a silicate [44,45,46]. It can be assumed that magnesium appears in the steel structure due to contamination during sample preparation or the use as a deoxidizer or desulfurizer in steelmaking processes. The contents of Fe (20.07 at.%) and Si (77.92 at.%) detected in Spectrum 3 probably come from the deoxidizer FeSi or as a residual element found in certain raw materials or alloying elements during the steelmaking process.
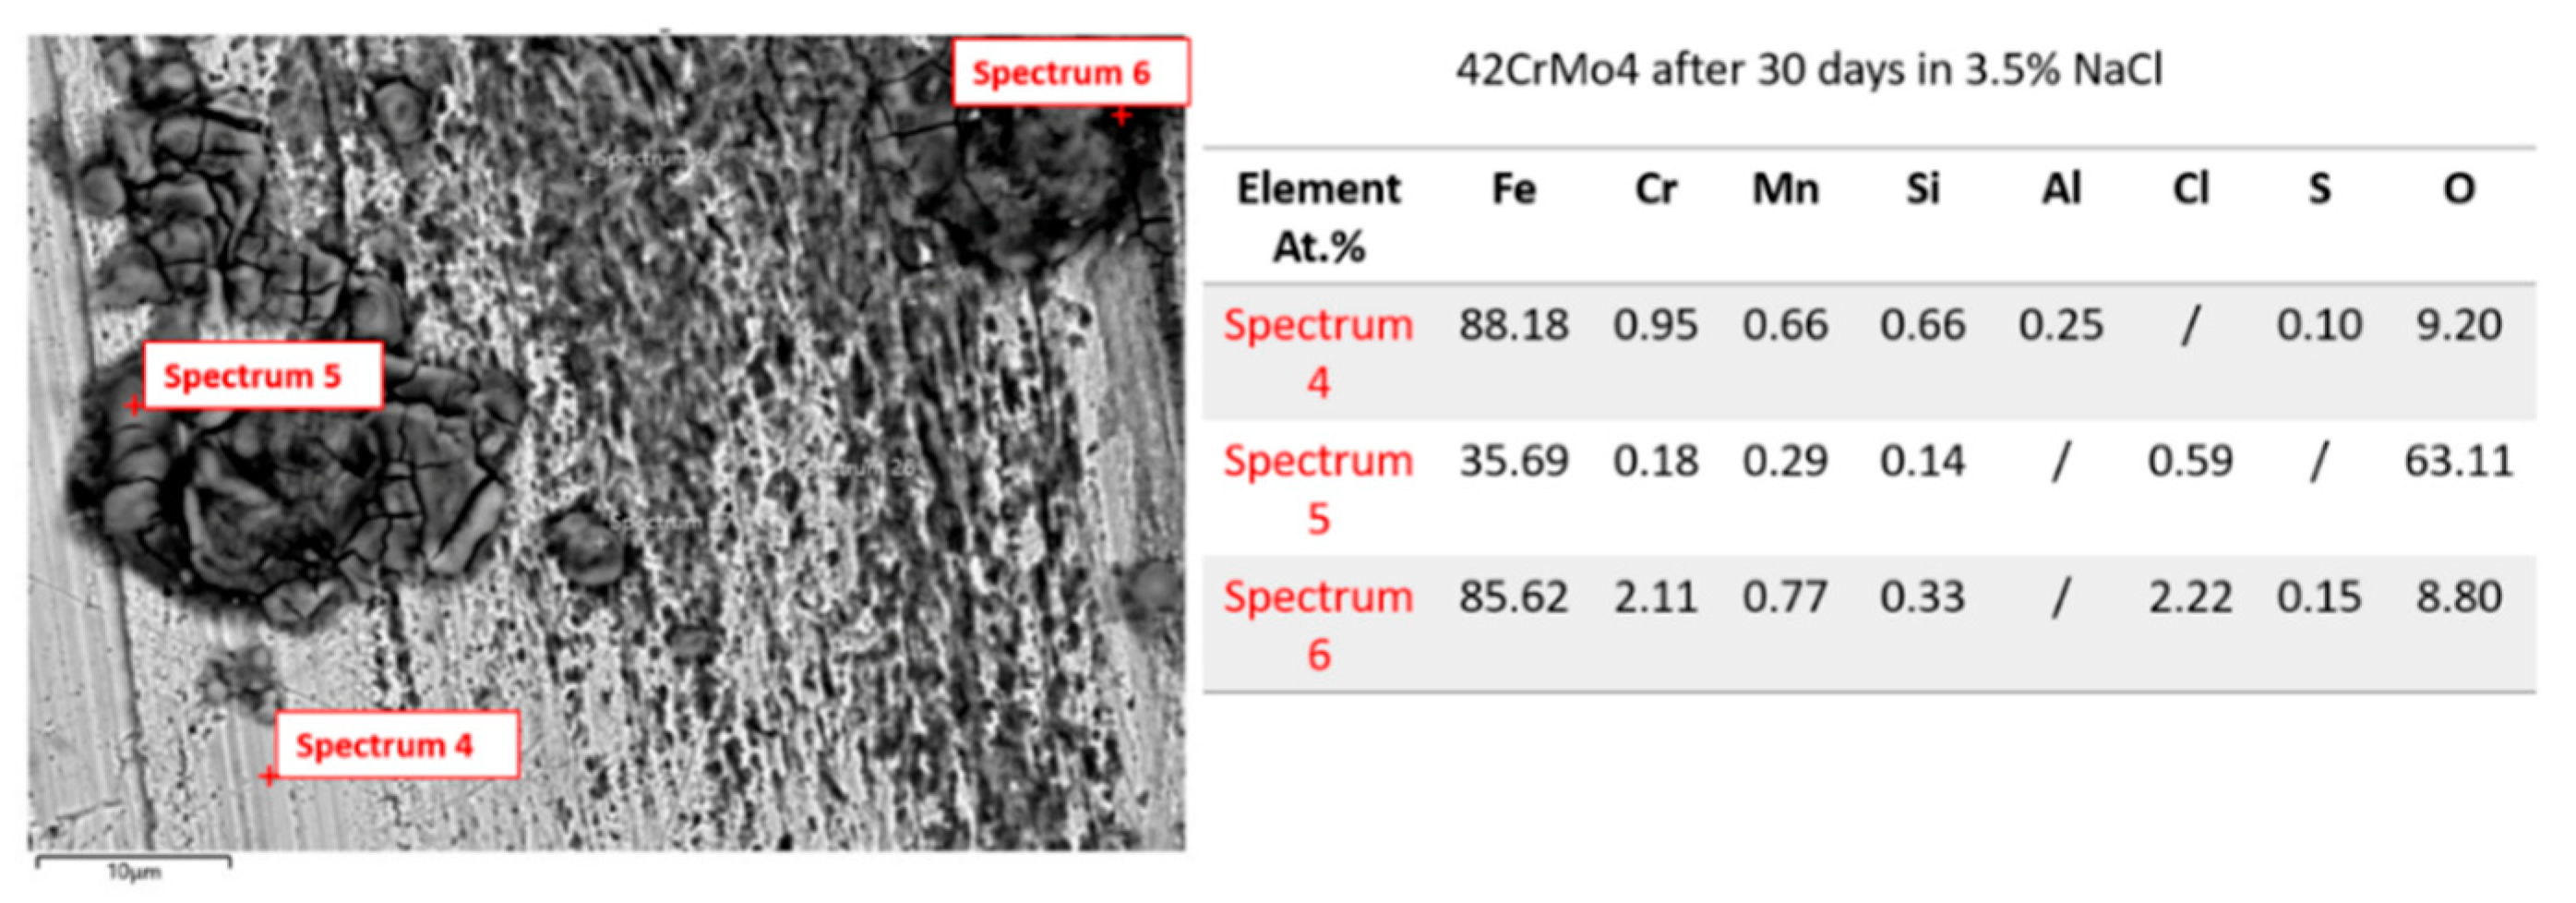
Figure 7 presents SEM images and the elemental composition (marked spots, Spectra 4–6) of the 42CrMo4 steel after 30 days of exposure to a corrosive NaCl solution. SEM reveals corrosion initiation and early-stage oxidation, with small corroded areas, localized pits, and deposits forming on the surface. Compared to the initial compositions (Table 1 and Table in Figure 6), the EDS results after the first cycle of exposure to the corrosive media show a composition similar to that observed in the initial analyses, particularly in Spectra 4 and 6. However, low levels of impurities, such as sulfur and chlorine, were detected in the structure, likely originating from the saline solution due to corrosion effects. Elemental analyses (Spectra 4 and 6) reveal dominant Fe regions (88.18 at.% and 85.62 at.%), indicating a relatively uncorroded matrix, most probably ferrite, with minimal areas of corrosion and the presence of small amounts of Cr, Mn, and Si. A slightly increased level of Cr (2.11 at.%) detected in Spectrum 6 suggests that it contributes to some corrosion resistance by forming a protective layer. The contents of O in both Spectra indicate the presence of oxide, while the low amounts of S suggest the formation of sulfide deposits. Additionally, Spectrum 6 shows the presence of Cl (2.22 at.%), suggesting the formation of chlorides and thus a partially corroded region. However, most of the steel surface remains mostly uncorroded. Unlike the previous two spectra, Spectrum 5 indicates the occurrence of corrosion. The contents of both Fe (35.69 at.%) and O (63.11 at.%) suggest the presence of Fe oxides, hydroxides, and oxyhydroxides (FeO, Fe2O3, Fe3O4, FeOOH), which are products of iron corrosion. In addition, the presence of Cl (0.59 at.%) indicates that a chloride attack occurred, probably resulting in the formation of FeCl2, FeCl3, or iron oxychloride-type compounds [47,48].
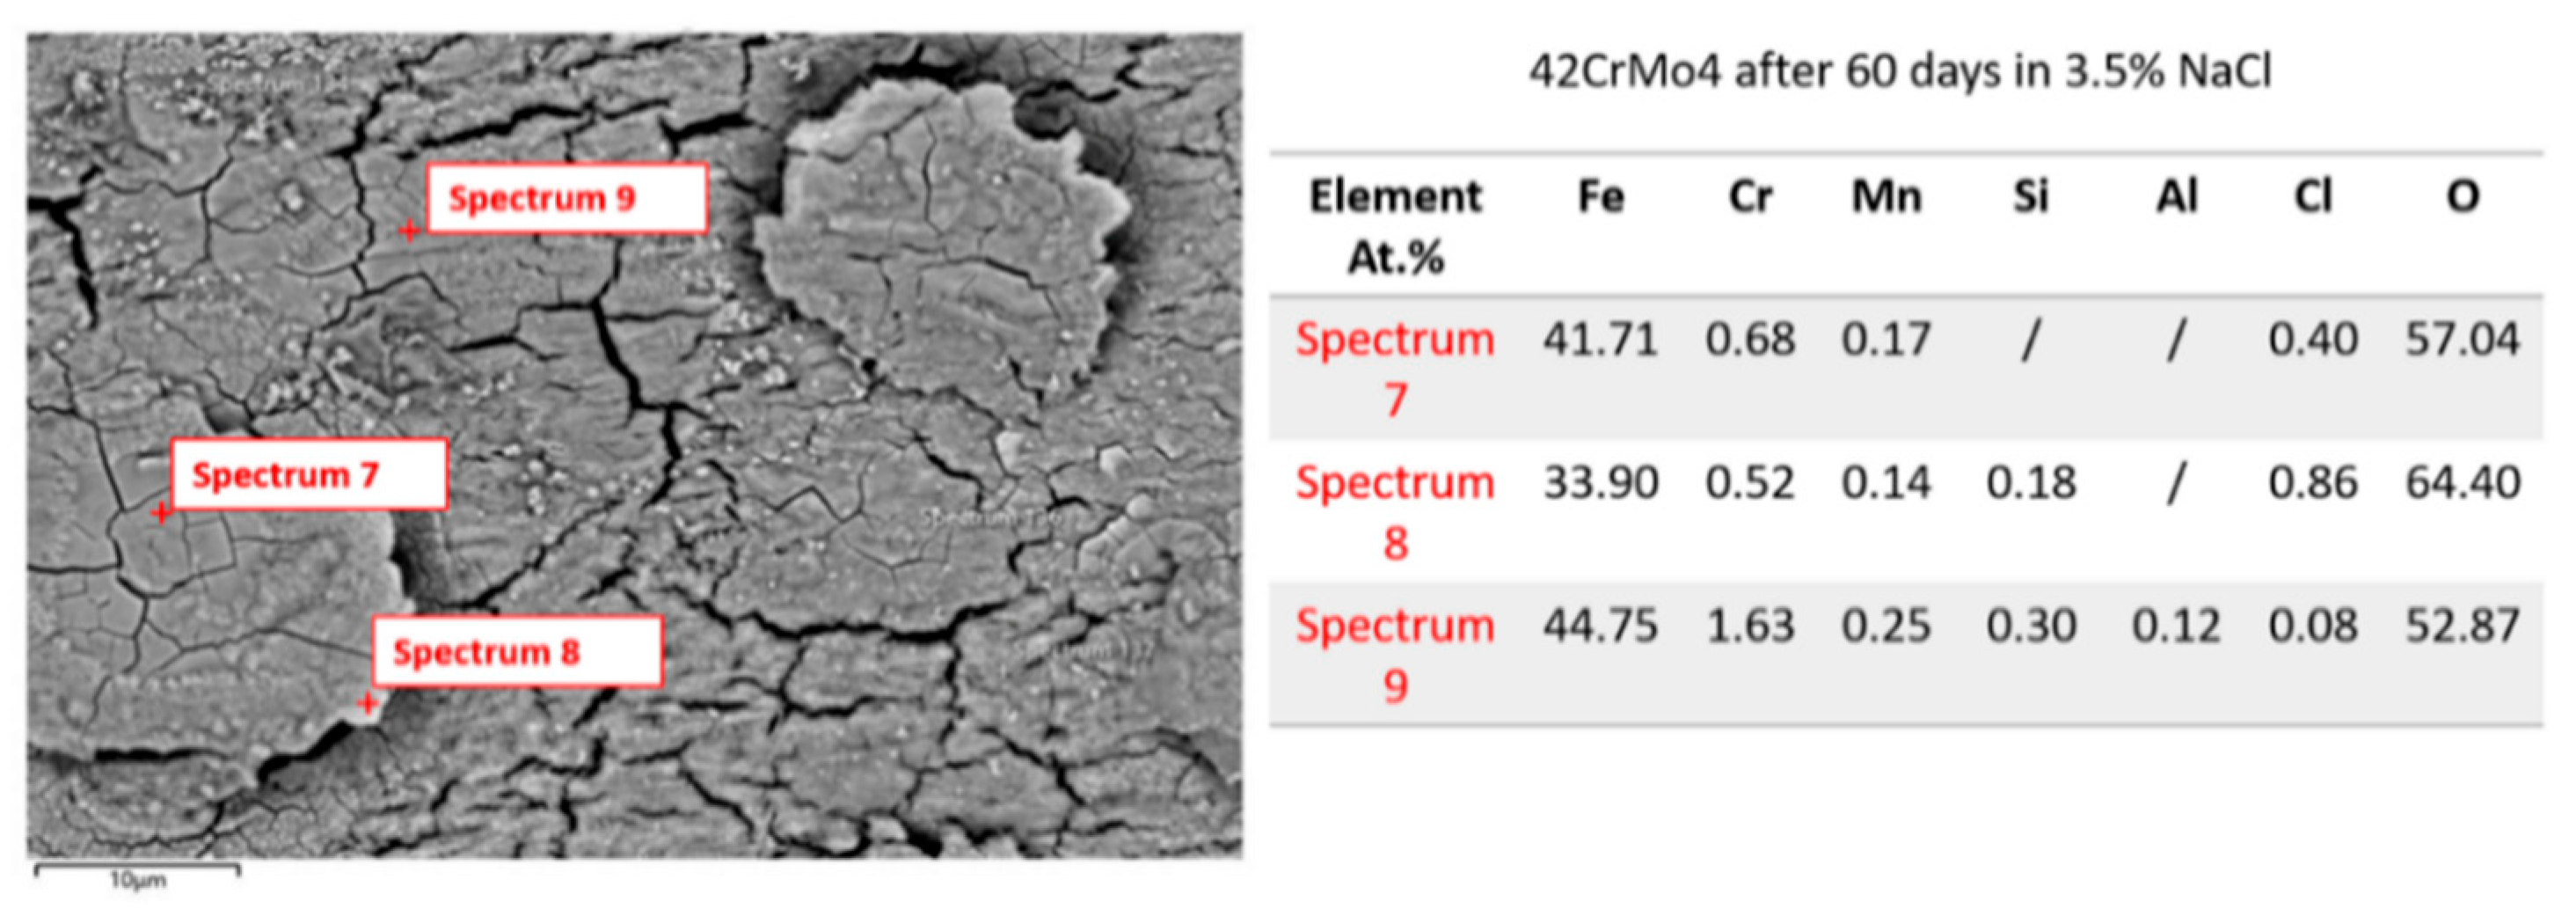
Figure 8 presents the SEM image and elemental composition (marked spots, Spectra 7–9) of 42CrMo4 steel after 60 days of exposure to a corrosive medium. Visual inspection indicates that the steel surface is heavily corroded and cracked, accompanied by thick corrosion products at the surface. Additionally, corrosion deepens, showing detachment of corrosion products. Such a pattern may indicate the occurrence of stress corrosion cracking. All three analyzed spectra exhibit a similar elemental composition and show the presence of a thick, corroded, and oxidized layer, particularly in Spectra 7 and 9. Elemental analyses of Spectra 7 and 9 reveal reduced amounts of Fe (41.71 at.% and 44.75 at.%, respectively) and elevated contents of O (57.04 at.% and 52.87 at.%, respectively) compared to their initial contents (Figure 6). This composition indicates predominant oxidation during this period and the formation of a thick layer of Fe oxides, hydroxides, and oxyhidroxides. The contents of Cr in both Spectra are slightly higher (0.68 at.%) and significantly higher (1.63 at.%), respectively, than what was determined in the initial composition (Table 1), which contributes to localized passivization and slows further corrosion. Notably, Cl appears in trace amounts (0.40 at.% and 0.08 at.%) due to exposure to the saline environment, suggesting some chloride-induced attack. This indicates the presence of chloride particles incorporated into the corroded layer, even in Spectrum 9. Elemental analysis (Spectrum 8) shows a more extensive corrosion zone than that detected in Spectra 7 and 9. This can be attributed to a lower content of Fe (33.90 at.%) and a higher content of O (64.40 at.%), indicating intensive oxidation. Additionally, the content of Cl (0.86 at.%) is also higher, suggesting the presence of chlorides or oxychlorides [47,48]. This area of the micrograph can be considered the most damaged, as chlorine-induced corrosion has significantly degraded the steel surface and penetrated to a greater depth.
Figure 9 presents the SEM images and elemental composition (marked spots, Spectra 10–12) of 42CrMo4 steel after 90 days of exposure to corrosive media. Compared to the initial chemical and elemental compositions (Table 1 and Figure 6), the contents of Fe and O show lower levels, while molybdenum has been detected for the first time, with small levels of impurities such as Mn, Si, and Al. Notably, chlorine levels increased significantly, reflecting the impact of saline solution exposure. The results reveal serious surface degradation with deep cracks and confirm the formation of corrosion products. Microstructural observation of the SEM image reveals a highly cracked and porous surface, an extensive layer of oxide, and evident spalling of corrosion products. The pattern of cracks and pores suggests that the oxide layer is non-protective and prone to further corrosion, allowing the penetration of Cl. EDS analyses of Spectra 11 and 12 reveal a highly oxidized region, most likely composed of ferous oxides, hydroxides and oxyhydroxides. This is indicated by the contents of Fe (48.28 at.% and 38.37 at.%, respectively), which is lower than that of the uncorroded composition, and the contents of O (50.01 at.% and 59.88 at.%), which is higher than that of the uncorroded composition. These contents confirm significant metal loss and heavy oxidation. Additionally, the presence of Cl (0.62 at.% and 0.64 at.%, respectively) suggests a strong chloride-induced corrosion attack. The significant amount of Cr (3.66 at.%, Spectrum 10) and a noticeable amount of Mo (0.34 at.%) may indicate the potential formation of protective chromium oxides and molybdate compounds, which can act as corrosion inhibitors [49,50,51]. The presence of Cl suggests some chloride attack, while the presence of Cr and Mo indicates the formation of a protective passive layer, which enhances corrosion resistance.
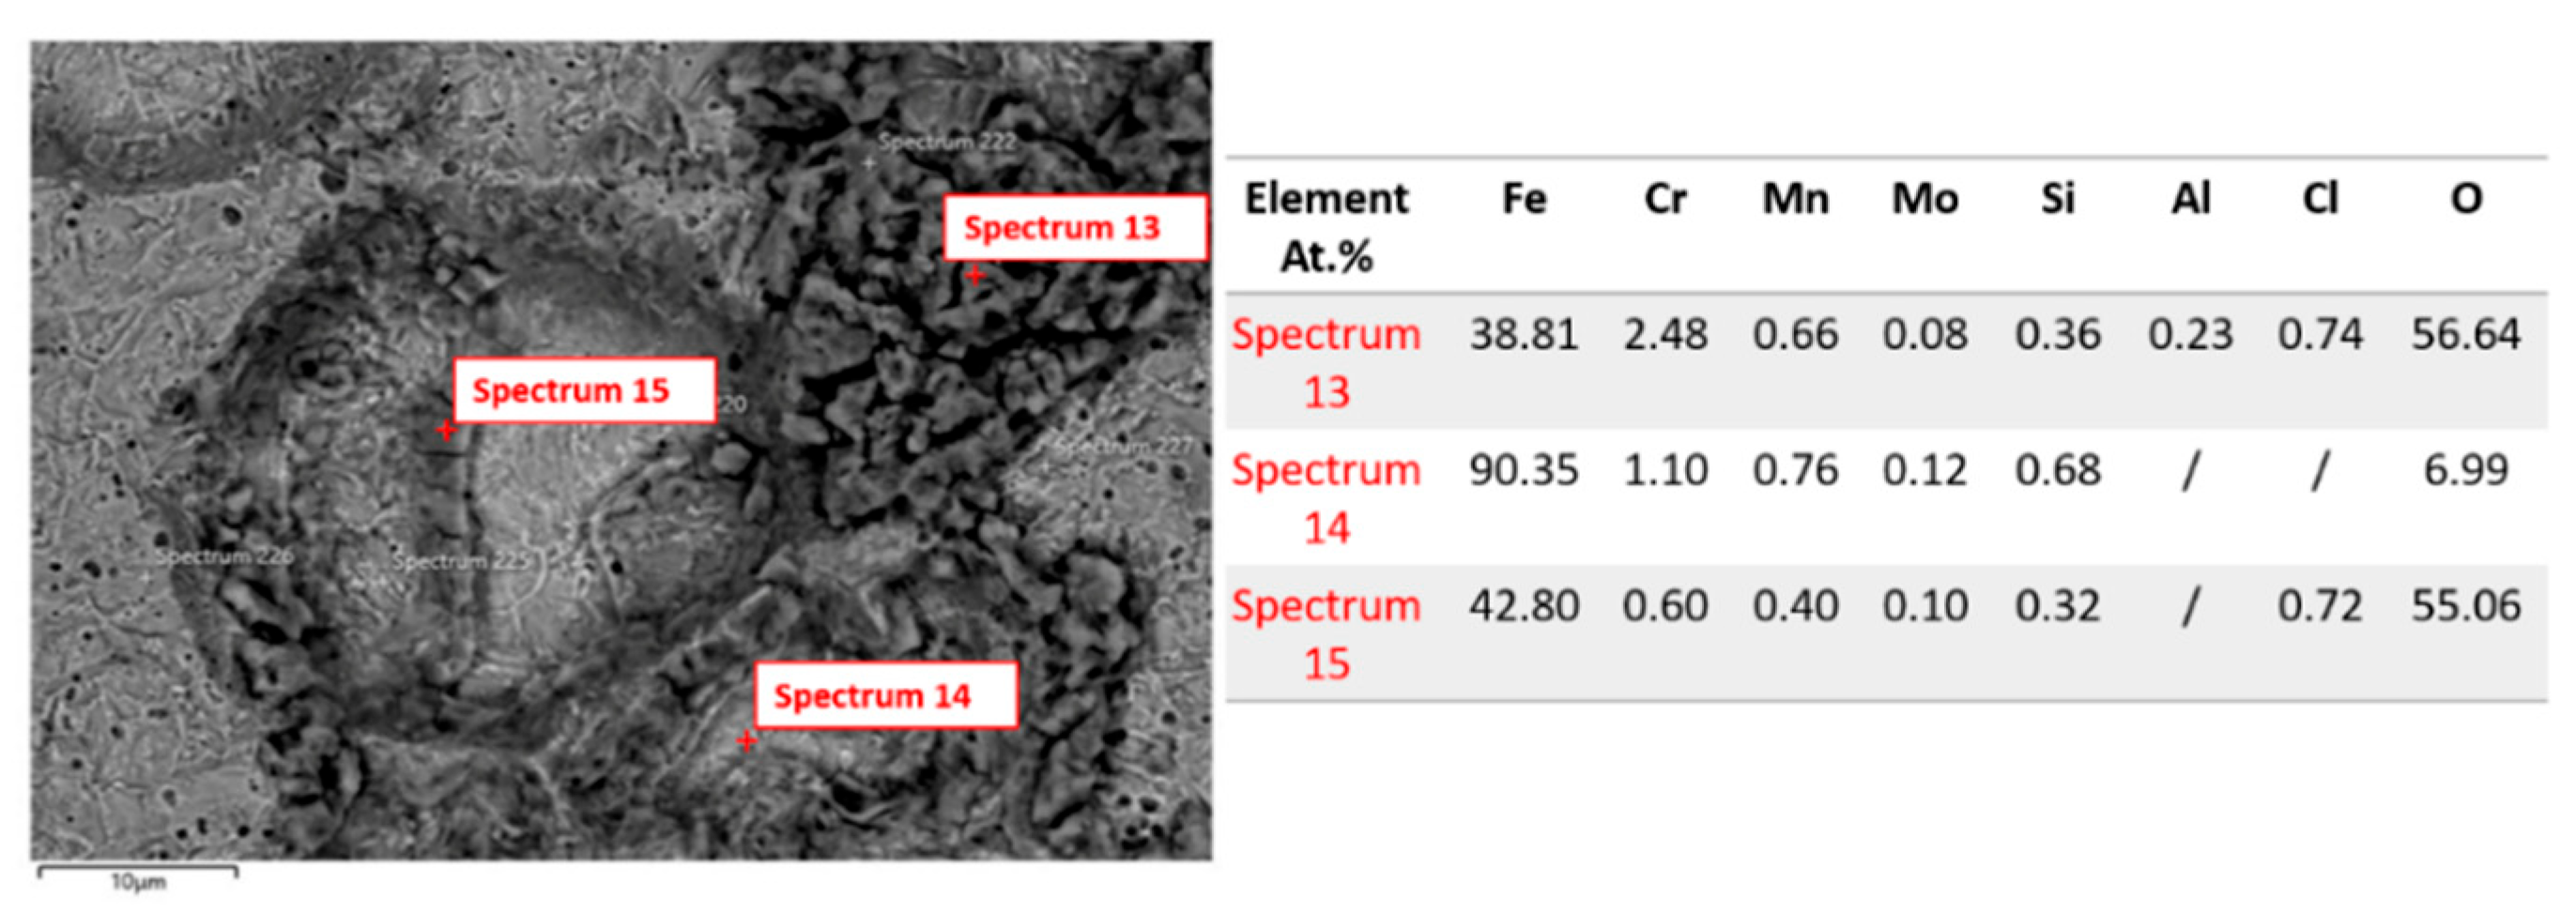
Figure 10 shows the SEM image and elemental composition (marked spots, Spectra 13–15) of 42CrMo4 steel after 120 days of exposure to a saline environment. Microstructural observations of the SEM micrograph show severe corrosion on the sample surface, characterized by areas of cracking, porosity, and corrosion deposits. Cracks and pits are particularly evident in Spectra 13 and 15. It is clear that multiple corrosion phases are present, including Fe oxides, hydroxides, and chloride-containing compounds. EDS analysis of Spectrum 13 reveals a severely corroded region with Fe at 38.81 at.%, indicating significant material loss due to corrosion, and O at 56.64 at.%, confirming extensive oxidation (iron oxides/hydroxides). The presence of Cl at 0.74 at.% suggests chloride-induced corrosion and the formation of FeCl2/FeCl3 [47,48]. Spectrum 14 indicates the presence of less corroded base material, with Fe content at 90.35 at.% and O at 6.99 at.%, suggesting minimal corrosion and largely unoxidized material. The low levels of Cr and Mo indicate less extensive passive layer formation. Elemental analysis of Spectrum 15 indicates a moderately corroded region, with the content of Fe (42.80 at.%) that is rather reduced, indicating corrosion progression and the high content of O (55.06 at.%) confirms oxidation. The content of Cl (0.72 at.%) suggests continued chloride-induced attack, indicating progressive but non-uniform corrosion.
The results of the EDS analysis of steel 42CrMo4 indicate the cooperative influence of the chemical composition of Cr and Mo, which contribute to the formation of a passive layer on the steel surface through their oxides. By reducing the content of Cr and Mo, conditions are created for the spread of pitting corrosion, which is tested by immersion in a saline solution. Figure 8 and Figure 9 indicate the oxidation of steel 42CrMo4 after 60 and 90 days, but also an increase in the content of Cr and Mo. Although the presence of chromium and molybdenum in the alloy provides a certain level of corrosion resistance, it is insufficient for the steel to achieve passivation in aggressive environments, such as NaCl solutions. Therefore, while 42CrMo4 steel may exhibit better corrosion resistance compared to some other non-alloyed steels, it does not form a stable passive layer in NaCl solutions.

3.2. Cavitation Erosion Experiments

3.2.1. Mass Loss

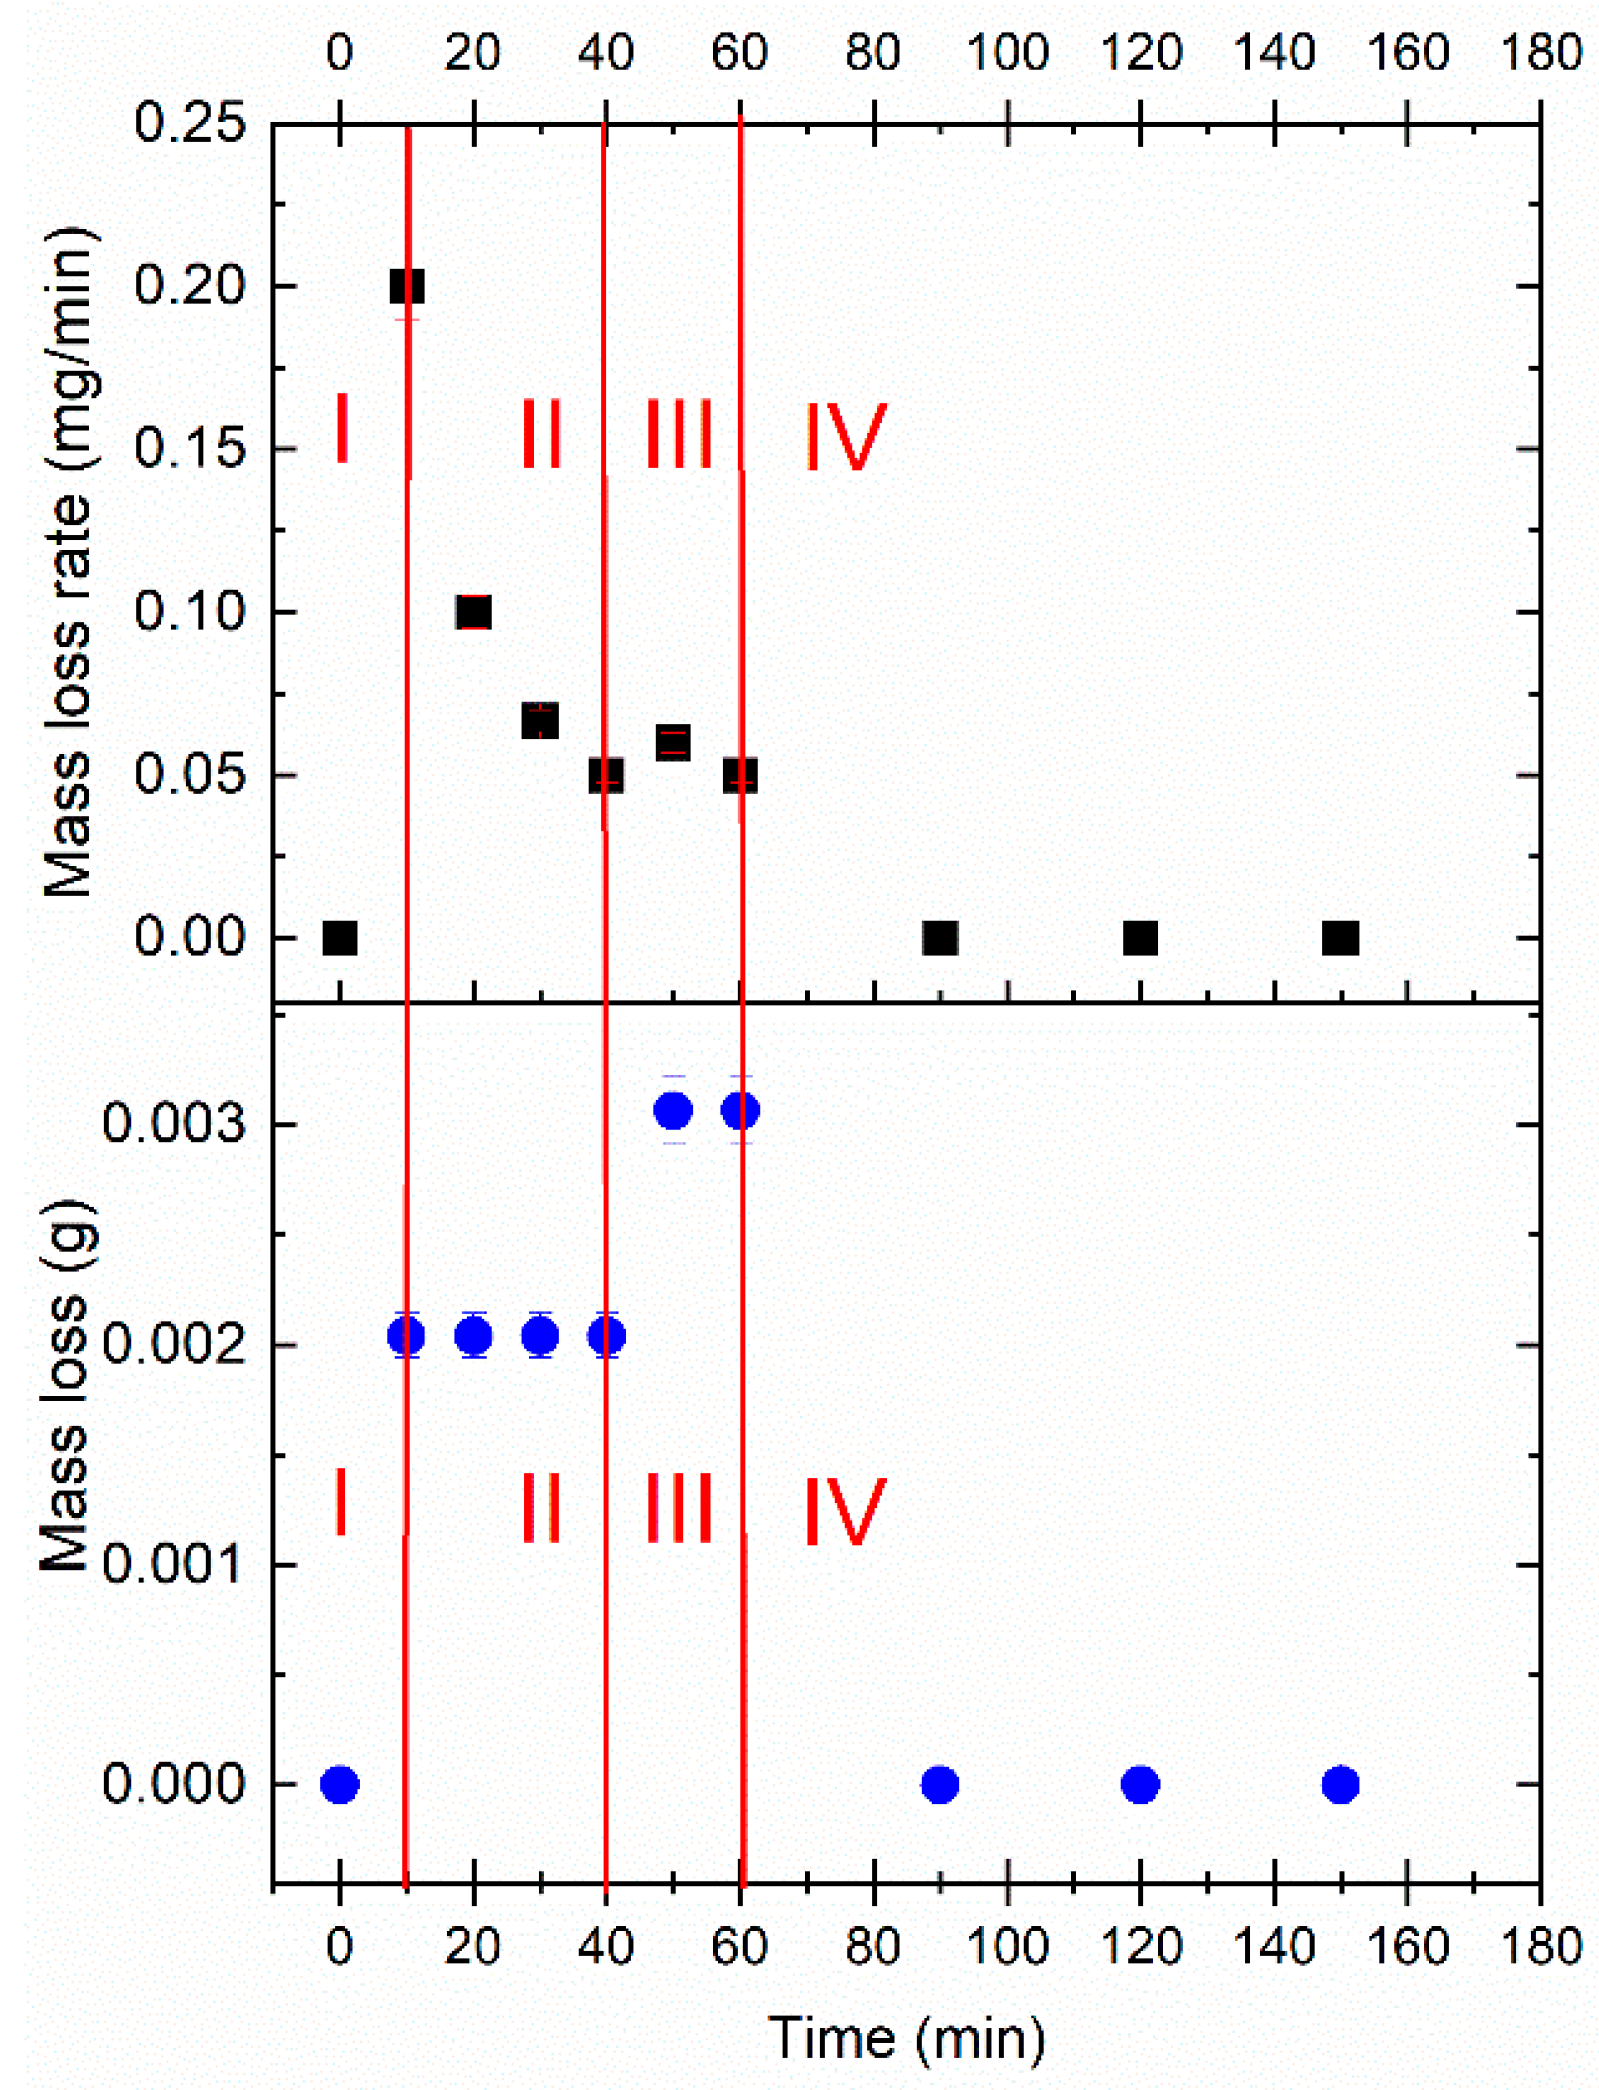
According to the most commonly used method for displaying results related to monitoring degradation progression caused by cavitation, mass loss (ML) and mass loss rate (MLR) are utilized, while the obtained results are presented in Figure 11. Different periods of cavitation are marked. The incubation period (I) is very short, indicating the initial formation of cavitation pits, when the sample is most sensitive to pit formation, and the energy required for pit formation is rather low. The accumulation period (II) lasts 30 min (from 10 to 40 min) and represents more pronounced material removal and intensified cavitation degradation progress. It can be assumed that during this period, plastic deformation begins, leading to micro-pitting and material weakening, which in turn results in increased erosion and fatigue damage. The following period, lasting 20 min (from 40 to 60), is called the attenuation period. This phase is characterized by the highest mass loss and a steady, severe material loss, while the cavitation process is fully developed, reaching a plateau and stabilization. The steady-state period begins after 60 min, marked by a sharp decline in mass loss rate. Since the exposure time continues up to 150 min, further experiments will provide the results for the duration of this period.
Statistical analysis yields the following results: The average mass loss rate due to cavitation is 0.0527 mg/min, with a 95% confidence interval of [0.0081, 0.0973] mg/min. Since this interval excludes zero, the mass loss rate is considered statistically significant. The Pearson correlation coefficient between time and mass loss rate is −0.54, indicating a moderate negative correlation; mass loss rate tends to be higher initially and decreases over time. However, the p-value of 0.11 suggests that this correlation is not statistically significant (p > 0.05), meaning it cannot be confidently claimed that time causes a decrease in mass loss rate.

3.2.2. Image and Morphological Characterization of the Samples

Surface degradation was monitored using OM and SEM microscopy. Results for the sample before and during testing are presented in Figure 12.
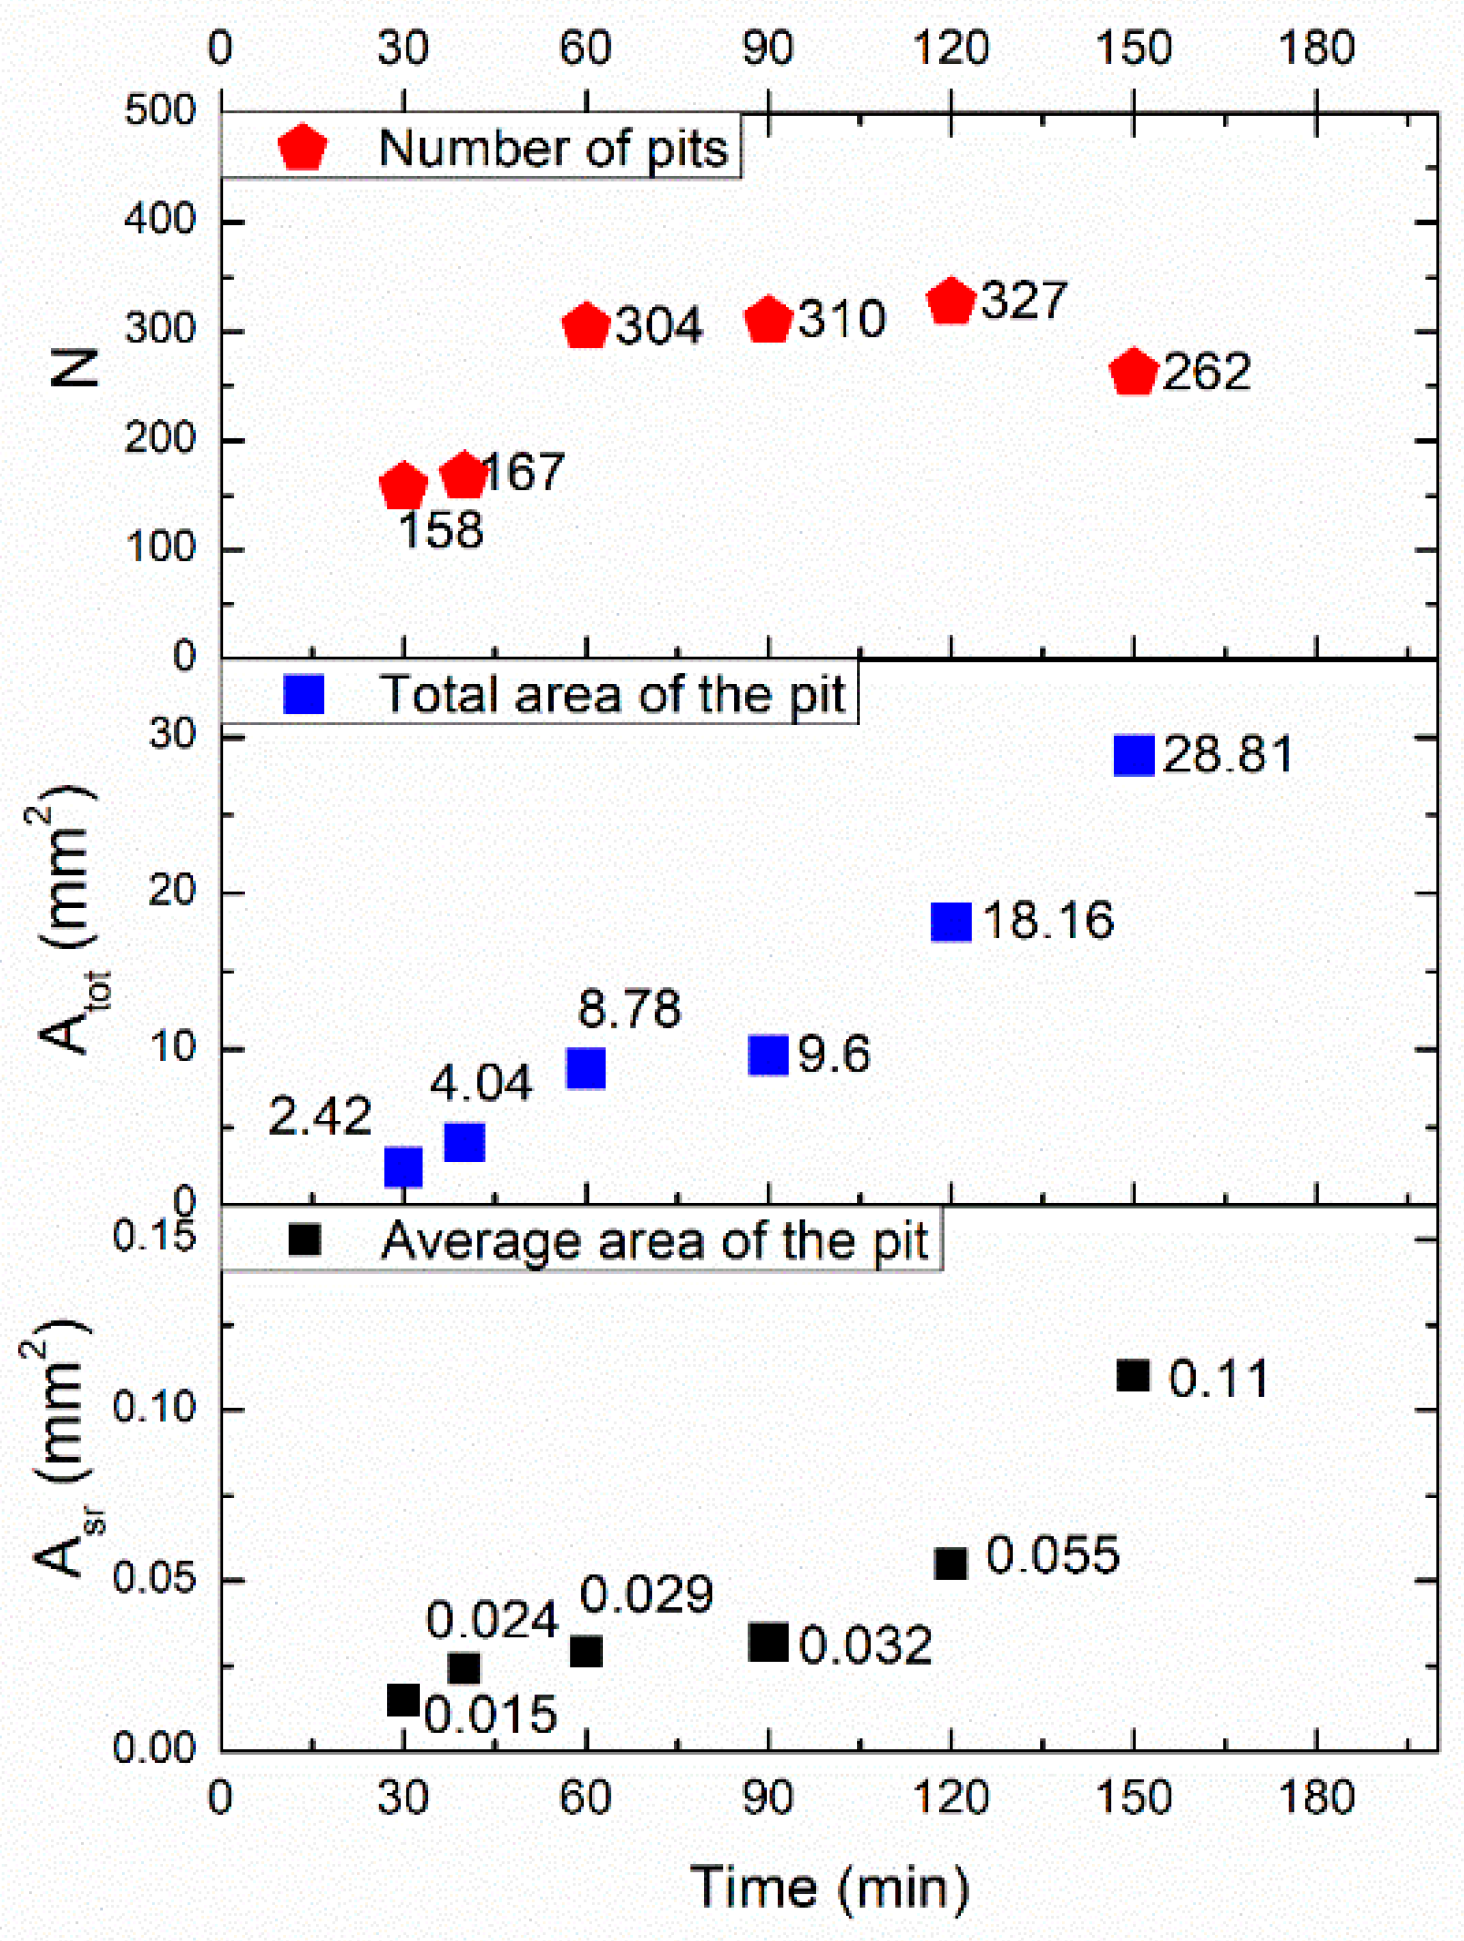
Based on the image analysis and the program for the morphological characterization of induced defects (Image Pro Plus), selected parameters, such as the average diameter of the pits, the total area of the pits, and the number of formed pits, were determined, and the obtained results are presented in Figure 13. These parameters were chosen because they can quantify the degradation level through the total area of formed pits. Additionally, the obtained values of these selected parameters can help determine the degradation mechanism. Specifically, the number of formed pits and their relation to exposure time, along with the total and average area of pits, can indicate which mechanism is dominant during a specific period of cavitation erosion. This may reveal whether the process involves pit formation, pit growth, or the merging of already formed pits into larger ones.
The average surface area of a single pit increases with each period during the cavitation erosion test. Initially, the average area of the pit increases slightly, showing small differences among the values, until 90 min. After that, it grows rapidly, reaching approximately 0.1 mm2 within 150 min. The total area of the pit increases, almost linearly, after each period during the cavitation erosion test. The exception is the period between 60 and 90 min, when the total area of the pit increases only slightly. After 90 min, the total area of the pit rises rapidly until reaching approximately 30 mm2 at 150 min. The number of formed pits during the cavitation erosion test shows an increase consistently during cavitation erosion testing over all time up to 120 min, at which point the number of formed pits begins to slightly decrease. The highest values of pit number were observed between 60 and 120 min, suggesting that pit formation can be considered as the dominant mechanism. In the period from 120 to 150 min, there is a decline in the pit numbers, suggesting the mechanism of pit growth and their merging. These observations are supported by the values of average pit area and the total area of degraded surface, which exhibit slow growth between 60 and 90 min and significant growth after 90 min.

3.3. Cavitation vs. Corrosion

Statistical analysis of corrosion rates and cavitation mass loss rates allows a direct comparison of material degradation in harsh environments. To determine whether corrosion causes greater degradation than cavitation, the mass loss rate and corrosion rate metrics are statistically compared, as discussed earlier in Section 3.1.1 and Section 3.2.1.
Overall, corrosion displays a significantly higher and more reliably measurable degradation rate, supported by strong statistical evidence and narrow confidence bounds. In contrast, while cavitation-induced mass loss does occur, its rate exhibits greater variability, less statistical certainty, and potentially a decreasing trend over time. These statistical results of the mass loss rate due to cavitation can be explained by the shape of the mass loss rate versus time curve (Figure 11) and the occurrence of cavitation erosion periods. Finally, the results of the statistical analysis support the conclusion that corrosion causes more severe and reliably measurable degradation than cavitation under the given test conditions.
According to the results obtained from the image analysis method used to monitor changes on the exposed surfaces of samples during testing, the level of surface degradation can be determined as the ratio of the damaged surface area to the initial surface area (before testing). The total area of pits is considered the total degraded surface area. The calculated values of surface degradation levels during both tests are shown in the diagrams presented in Figure 14. This method provides a reliable and objective assessment of the extent of degradation caused by exposure to cavitation and corrosion. It can be observed that the level of surface degradation due to both cavitation erosion and corrosion in 3.5% NaCl increases almost linearly. Not only visual observation, but regression analysis also proves that the slope of the curve for corrosion testing is steeper than that for cavitation, indicating a greater rate of degradation. For the longest exposure time, samples subjected to cavitation exhibit the highest level of degradation at 7.4. In comparison, the degradation level after 120 min of cavitation is 5.22, which corresponds to the degradation level after 30 days of immersion of the 42CrMo4 samples in a NaCl solution. The degradation level for samples exposed to corrosion reaches a value of 33.4 after 120 days of exposure to the corrosive environment. Figure 14 also presents SEM images acquired using secondary electrons (SE) for the longest exposure times, where significant differences can be observed due to the different mechanisms of these two processes.
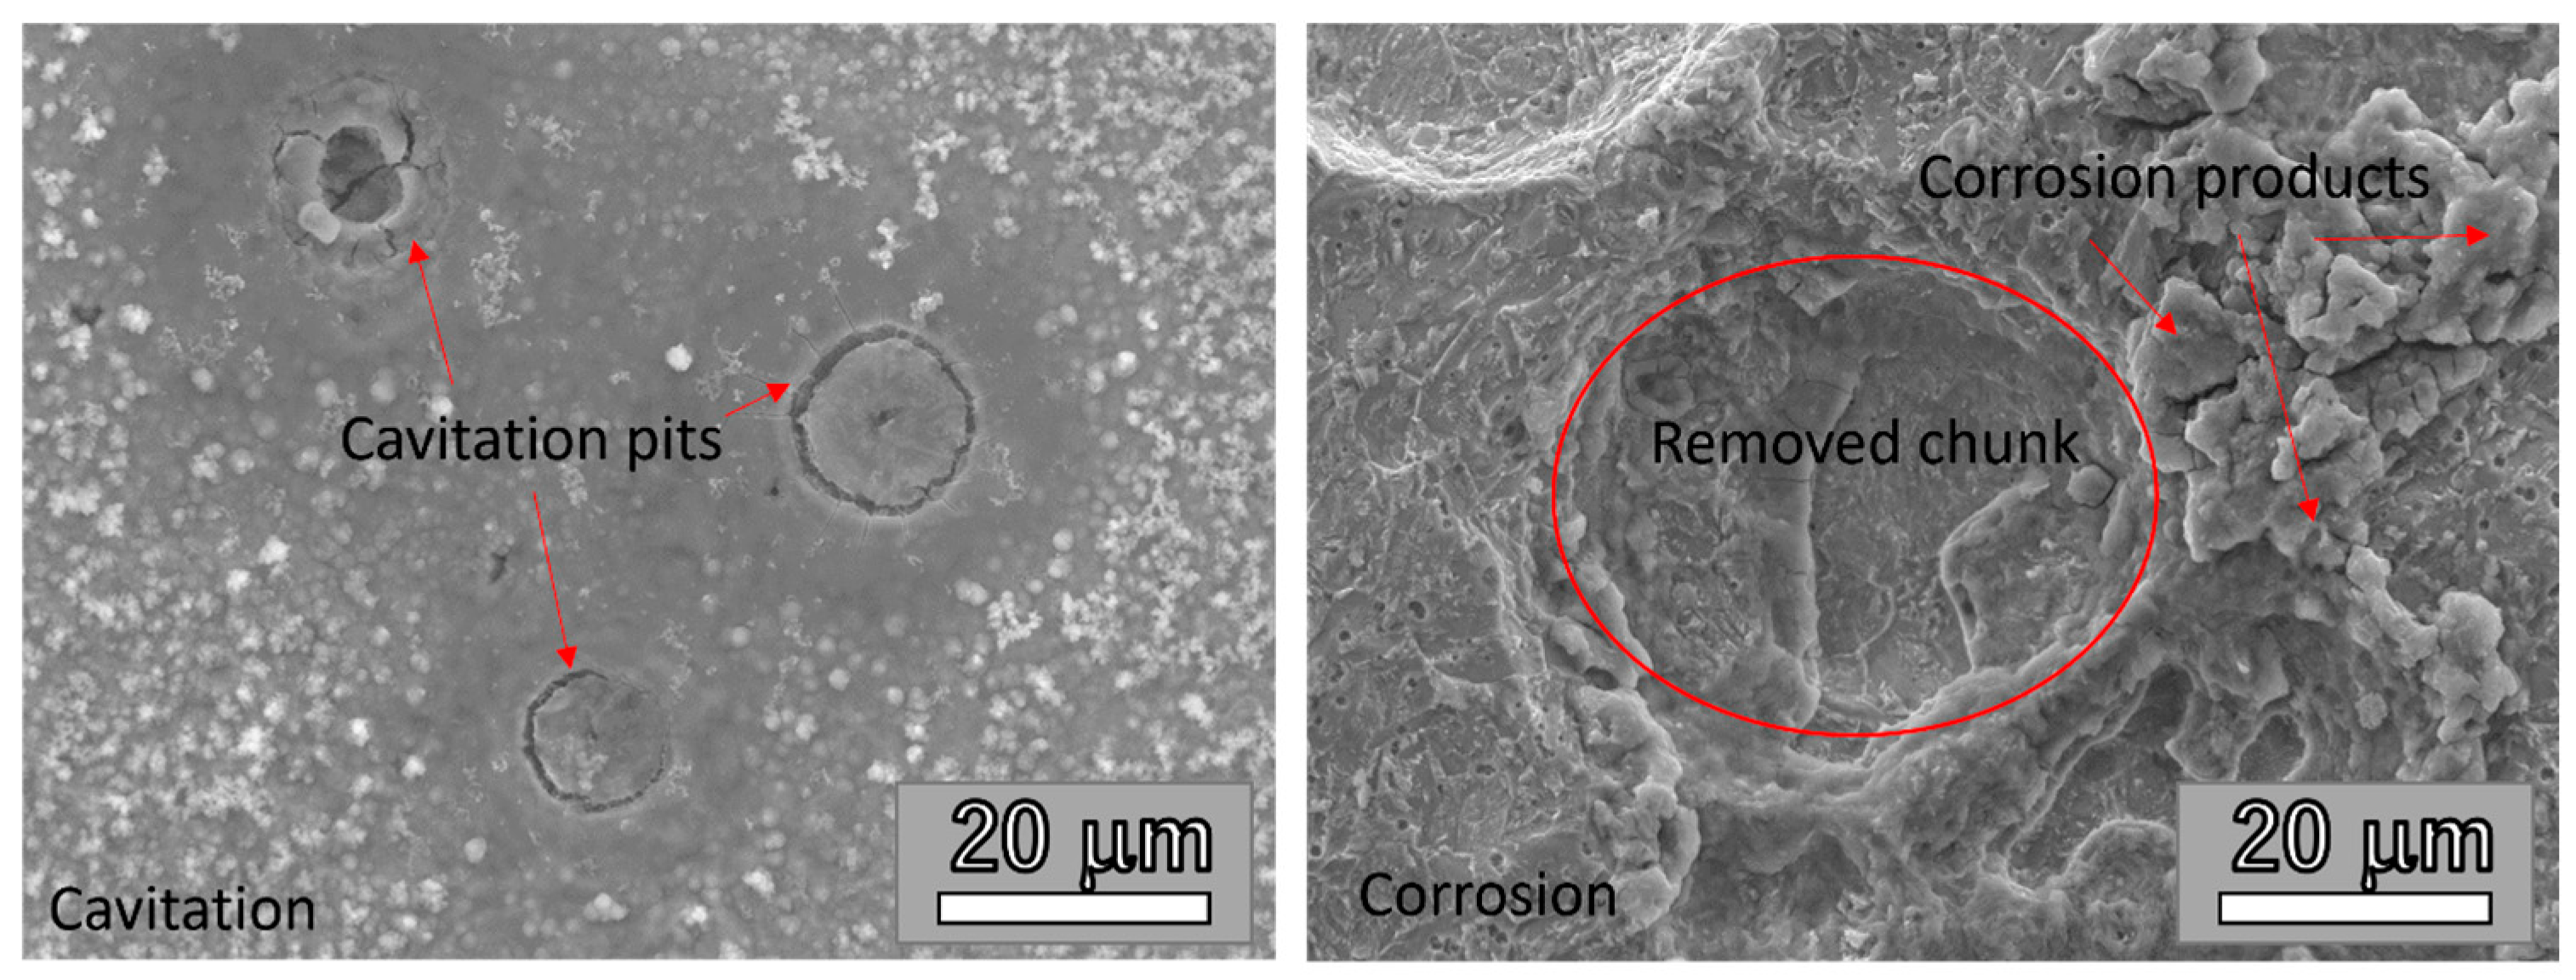
Microscopic analyses of the damage (SEM) that occurs due to cavitation and corrosion reveal differences in the morphology of the damage, as clearly demonstrated in Figure 15. In the case of corrosion, mass loss occurs due to chemical and/or electrochemical reactions between the metal and the environment, leading to the formation of corrosion products and their detachment, as shown in Figure 15. On the other hand, for the samples exposed to cavitation, mass loss results from mechanical damage caused by the collapse of cavitation bubbles, which leads to surface fatigue, local pressure, material erosion, and the appearance of pits and cavities. After corrosion in a 3.5% NaCl solution, the mass loss is approximately linear over time; however, no extensive protective layer is formed on the surface of the tested samples. Steel 42CrMo4 is an alloyed steel that contains chromium (Cr) and molybdenum (Mo), which provide certain corrosion resistance properties, but it is not fully passivated under all conditions. When 42CrMo4 steel is exposed to corrosion in the NaCl solution, it does not form a stable passive layer as some other alloyed steels do, such as stainless steel (e.g., types 304 or 316), which passivate in the presence of chromium oxides. In NaCl solutions, 42CrMo4 steel is susceptible to corrosion, as NaCl can cause pitting (localized corrosion) and other types of surface damage. Although the tested steel contains chromium and molybdenum, which provide some level of corrosion resistance, this resistance is insufficient to passivate the steel in the aggressive conditions of NaCl solutions. After exposure to a cavitation environment, mass loss exhibits an incubation period characterized by minimal mass loss, followed by a phase of accelerated damage and eventual stabilization. Corrosion damage typically shows rough surfaces with visible corrosion products, whereas cavitation damage presents pits, depressions, and characteristic pitting structures resulting from localized mechanical impacts (Figure 15).
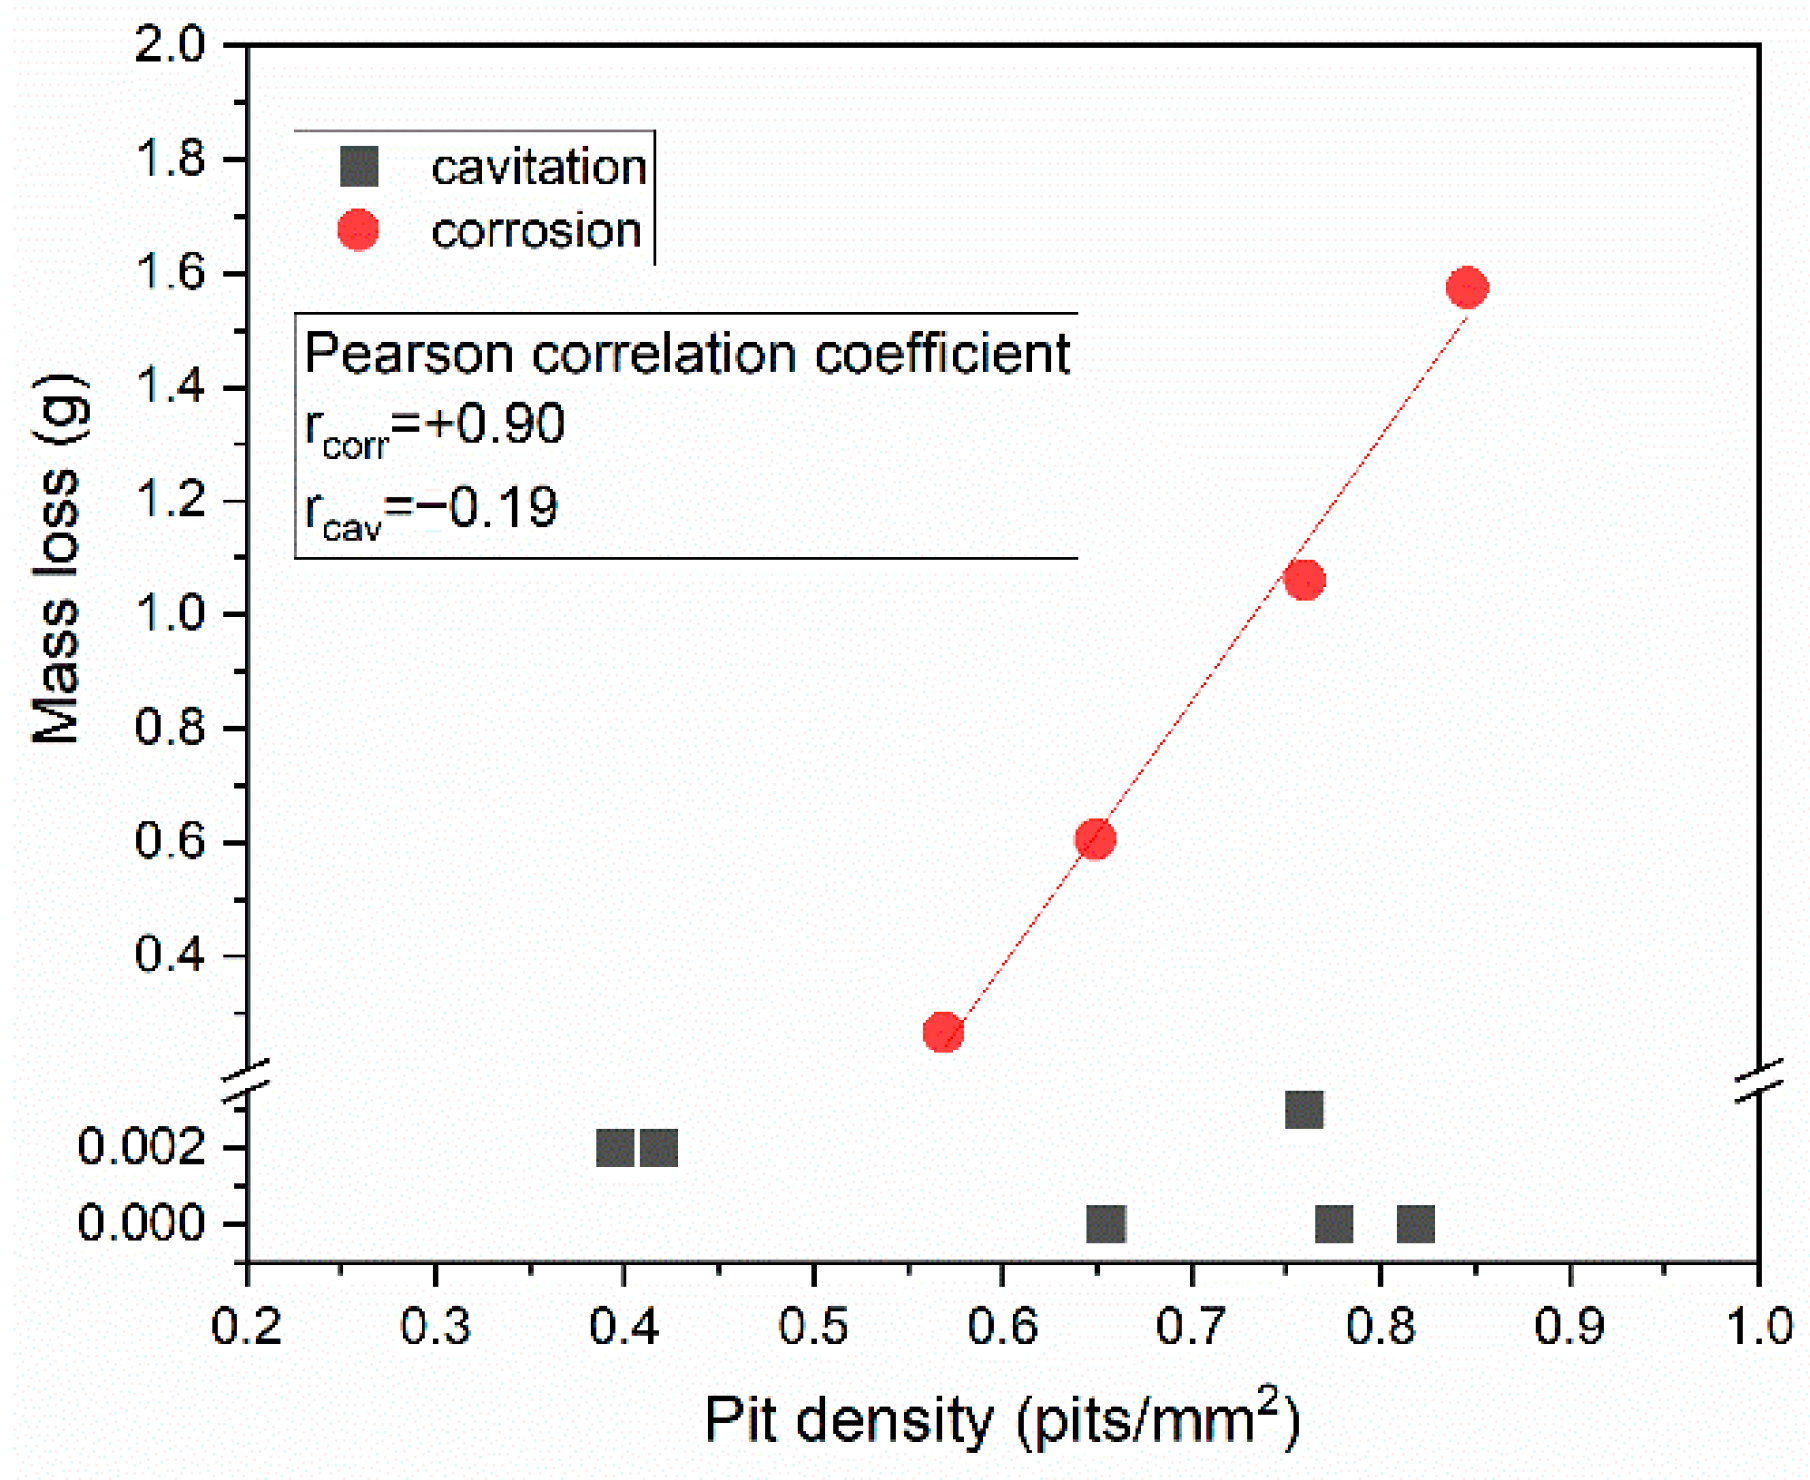
Statistical analysis of the correlation between mass loss and pit density, resulting from corrosion and cavitation exposure, is shown in Figure 16.
The Pearson correlation coefficient for corrosion is r = +0.90, indicating a very strong positive linear relationship between pit density and mass loss. This suggests that as pit density increases, mass loss also increases proportionally. The formation of pits is the dominant degradation mechanism in the corrosive environment, and the extent of surface damage is closely related to the number of pits formed. The Pearson correlation coefficient for cavitation is r = −0.19, indicating a weak negative correlation and thus no meaningful linear relationship between pit density and mass loss. This implies that increases in pit density do not consistently correlate with increases in mass loss and may even lead to a slight decrease. This suggests that cavitation damage is not directly influenced by pit density but rather by more complex mechanisms such as pit growth, pit merging, crack propagation, material spalling, and fatigue failure. Pit density may reach a saturation point or fluctuate while mass loss continues due to the detachment of larger fragments. Therefore, pit density alone is not a reliable predictor of mass loss under cavitation, as the progression of damage depends on nonlinear and dynamic processes beyond simple pit formation.

4. Conclusions

The corrosion behavior of 42CrMo4 alloy samples in NaCl solution, presenting an artificial substitute for the marine environment, was investigated, along with cavitation erosion in distilled water. Degradation levels for both corrosion and cavitation erosion were monitored using traditional approaches such as mass loss, mass loss rate, and corrosion rate measurements. Additionally, non-destructive methods were applied, including optical microscopy (OM) and scanning electron microscopy (SEM), as well as quantitative assessment of typical morphological parameters related to induced defects using image analysis tools. Energy-dispersive spectroscopy (EDS) analysis was employed to monitor corrosion degradation and the oxidation processes that occurred during corrosion.
The mass loss of steel (42CrMo4) subjected to corrosion tests follows an almost linear pattern after each period of saline exposure. The average corrosion rate of 42CrMo4 steel in a 3.5% NaCl solution reached a peak value of 0.846 mm/year after 120 days of exposure. Morphological analysis of the formed defects indicated an increase in both the average diameter and the number of formed defects up to 90 days of corrosion, after which both parameters decreased slightly. The average surface area of induced defects increased steadily throughout the entire corrosion period. Additionally, a time frame of 90 days was identified as significant for changes in the mechanism of defect formation, with defect formation being the dominant mechanism during this period. The following finding regarding the mechanism of degradation indicates that, up to 90 days, the formation of newly formed defects is predominant. After 90 days, however, the merging of already existing defects into larger ones becomes a dominant process. Quantitative analysis showed that after 90 days, defects change shape from more circular to irregular, specifically becoming elongated and complex. By determining the chemical composition through EDS, it is possible to monitor the influence of key alloying elements such as Cr and Mo on the passivation of steel (42CrMo4), indicating an increase in these elements during corrosion. However, a stable passive oxide layer that provides corrosion resistance was not formed.
Cavitation erosion behavior was measured based on mass loss, indicating the occurrence of different cavitation periods, with the steady-state period achieved after 60 min. Additionally, cavitation erosion behavior was monitored by quantifying selected morphological parameters of the formed pits, including average area, total area, and their number. Results for morphological parameters suggested that both the average and total area of the formed pits increased almost linearly during testing. However, the number of formed pits increased until 120 min, after which it decreased slightly. This indicates that a time frame of 120 min was identified as significant for changes in the mechanism of pit formation. Specifically, up to 120 min, pit formation was the dominant mechanism of cavitation erosion, while after that, as the number of pits slightly declined, the growth and merging of formed pits became the dominant mechanism.

Author Contributions

Conceptualization, S.N., A.A. and T.V.-H.; methodology, S.M., S.D. and D.G.; software, A.A. and T.V.-H.; validation, D.G., S.D., S.M. and T.V.-H.; formal analysis, A.A. and T.V.-H.; investigation, A.A. and S.M.; writing—original draft preparation, S.N. and T.V.-H.; writing—review and editing, A.A.; visualization, A.A., S.D. and D.G.; supervision, T.V.-H. All authors have read and agreed to the published version of the manuscript.

Funding

This work was financially supported by the Ministry of Science, Technological Development and Innovation of the Republic of Serbia (Contract Nos. 451-03-136/2025-01/200036 and 451-03-136/2025-03/200135).

Data Availability Statement

The original contributions presented in this study are included in the article material. Further inquiries can be directed to the corresponding author.

Acknowledgments

This work was supported by the Ministry of Science, Technological Development and Innovation of the Republic of Serbia [grant numbers 451-03-136/2025-03/200135 and 451-03-136/2025-03/200026]. This research contributes to the implementation of the United Nations 2030 Agenda for Sustainable Development, specifically addressing Goal 9: Industry, Innovation and Infrastructure (https://sdgs.un.org/goals, accessed on 14 October 2025). By developing an innovative approach for evaluating the degradation mechanisms of 42CrMo4 steel in aggressive environments, this study supports industrial innovation and the advancement of sustainable and resilient infrastructure.

Conflicts of Interest

The authors declare no conflicts of interest.

References

  1. Xu, Q.; Yang, X.; Liu, J.; Jiang, D.; Qiu, Z. Improved Corrosion Resistance of 42CrMo4 Steel by Reconstructing Surface Integrity Using Ultrasonic Surface Rolling Process. Mater. Today Commun. 2023, 35, 105932. [Google Scholar] [CrossRef]
  2. Bartošák, M.; Horváth, J.; Španiel, M. Isothermal Low-Cycle Fatigue and Fatigue-Creep of a 42CrMo4 Steel. Int. J. Fatigue 2020, 135, 105538. [Google Scholar] [CrossRef]
  3. Zhu, Z.; Lu, Y.; Xie, Q.; Li, D.; Gao, N. Mechanical Properties and Dynamic Constitutive Model of 42CrMo Steel. Mater. Des. 2017, 119, 171–179. [Google Scholar] [CrossRef]
  4. Xu, Q.; Liu, Y.; Lu, H.; Liu, J.; Cai, G. Surface Integrity and Corrosion Resistance of 42CrMo4 High-Strength Steel Strengthened by Hard Turning. Materials 2021, 14, 6995. [Google Scholar] [CrossRef]
  5. Maskavizan, A.J.; Quintana, J.P.; Dalibón, E.L.; Márquez, A.B.; Brühl, S.P.; Farina, S.B. Evaluation of Wear and Corrosion Resistance in Acidic and Chloride Solutions of Cathodic Arc PVD Chromium Nitride Coatings on Untreated and Plasma Nitrided AISI 4140 Steel. Surf. Coat. Technol. 2024, 494, 131476. [Google Scholar] [CrossRef]
  6. Datta, T.; Pathak, A.D.; Basak, S.; Gollapudi, S.; Sahu, K.K. Fractal Behavior of Surface Oxide Crack Patterns on AISI 4140 High-Strength Low-Alloy Steel Exposed to the Simulated Offshore Environment. Appl. Surf. Sci. Adv. 2021, 5, 100110. [Google Scholar] [CrossRef]
  7. Zhang, P.; Liu, Z. Enhancing Surface Integrity and Corrosion Resistance of Laser Cladded Cr–Ni Alloys by Hard Turning and Low Plasticity Burnishing. Appl. Surf. Sci. 2017, 409, 169–178. [Google Scholar] [CrossRef]
  8. Que, Z.; Saario, T.; Toivonen, A.; Ehrnstén, U. Stress Corrosion Cracking Initiation Susceptibility of Alloy 182 with Different Surface Treatments. Corros. Sci. 2022, 196, 110037. [Google Scholar] [CrossRef]
  9. Abbas, M.; Rizvi, S.H.M.; Sarfraz, S.; Raza, A.; Khan, A.; Loya, A.; Najib, A. Evaluation of the Influence of Dissolved Nitrates on Corrosion Behaviour of Ship Structural Steel Exposed to Seawater Environment. Ocean Eng. 2024, 298, 117268. [Google Scholar] [CrossRef]
  10. Raja, P.B.; Ismail, M.; Ghoreishiamiri, S.; Mirza, J.; Ismail, M.C.; Kakooei, S.; Rahim, A.A. Reviews on Corrosion Inhibitors: A Short View. Chem. Eng. Commun. 2016, 203, 1145–1156. [Google Scholar] [CrossRef]
  11. Fernandes, J.S.; Montemor, F. Corrosion. In Materials for Construction and Civil Engineering; Springer: Cham, Switzerland, 2014; pp. 679–716. [Google Scholar] [CrossRef]
  12. Roberge, P. Handbook of Corrosion Engineering; McGraw-Hill Handbooks; Mcgraw-Hill: Columbus, OH, USA, 1999. [Google Scholar]
  13. Nodoushan, E.J.; Lee, Y.J.; Na, H.-J.; You, B.-H.; Lee, M.-Y.; Kim, N. Effects of NaCl and Temperature on Rheological Characteristics and Structures of CTAB/NaSal Wormlike Micellar Solutions. J. Ind. Eng. Chem. 2021, 98, 458–464. [Google Scholar] [CrossRef]
  14. Cai, Y.K.; Zhao, Y.; Zhang, Z.K.; Ma, X.B.; Cheng, B. Atmospheric and Marine Corrosion: Influential Environmental Factors and Models. In Proceedings of the International Workshop on Environmental Management, Science and Engineering, Xiamen, China, 16–17 June 2018. [Google Scholar] [CrossRef]
  15. Hammitt, F.G. Cavitation and Multiphase Flow Phenomena; McGraw-Hill Companies: Columbus, OH, USA, 1980. [Google Scholar]
  16. Brennen, C.E. Cavitation and Bubble Dynamics; Cambridge University Press: New York, NY, USA, 2014. [Google Scholar]
  17. Sreedhar, B.K.; Albert, S.K.; Pandit, A.B. Cavitation Damage: Theory and Measurements—A Review. Wear 2016, 372–373, 177–196. [Google Scholar] [CrossRef]
  18. Gao, G.; Zhang, Z. Cavitation Erosion Mechanism of 2Cr13 Stainless Steel. Wear 2021, 488–489, 204137. [Google Scholar] [CrossRef]
  19. Tsybry, I.K.; Vyalikov, I.L. Analysis of Cavitation on the Surface of Steel under the Ultrasonic Cleaning. IOP Conf. Ser. Mater. Sci. Eng. 2017, 177, 012135. [Google Scholar] [CrossRef]
  20. Volkov-Husović, T.; Ivanić, I.; Kožuh, S.; Stevanović, S.; Vlahović, M.; Martinović, S.; Stopic, S.; Gojić, M. Microstructural and Cavitation Erosion Behavior of the CuAlNi Shape Memory Alloy. Metals 2021, 11, 997. [Google Scholar] [CrossRef]
  21. Basumatary, J. Study on Cavitation Erosion Resistance of Stellite Alloys by Ultrasonic Vibratory Method. Ph.D. Thesis, University of Southampton, Southampton, UK, 2016. [Google Scholar]
  22. Dojcinovic, M.; Volkov-Husovic, T. Cavitation Damage of the Medium Carbon Steel: Implementation of Image Analysis. Mater. Lett. 2008, 62, 953–956. [Google Scholar] [CrossRef]
  23. Knapp, R.T.; Daily, J.W.; Hammitt, F.G. Cavitation; McGraw-Hill: New York, NY, USA, 1970. [Google Scholar]
  24. Brijkishore; Khare, R.; Prasad, V. Prediction of Cavitation and Its Mitigation Techniques in Hydraulic Turbines—A Review. Ocean Eng. 2021, 221, 108512. [Google Scholar] [CrossRef]
  25. Candel, I.; Bunea, F.; Dunca, G.; Bucur, D.M.; Ioana, C.; Reeb, B.; Ciocan, G.D. Detection of Cavitation Vortex in Hydraulic Turbines Using Acoustic Techniques. IOP Conf. Ser. Earth Environ. 2014, 22, 052007. [Google Scholar] [CrossRef]
  26. Hofmann, J.; Thiébaut, C.; Riondet, M.; Lhuissier, P.; Gaudion, S.; Fivel, M. Comparison of Acoustic and Hydrodynamic Cavitation: Material Point of View. Phys. Fluids 2022, 35, 017112. [Google Scholar] [CrossRef]
  27. Gao, G.; Zhang, Z.; Cai, C.; Zhang, J.; Nie, B. Cavitation Damage Prediction of Stainless Steels Using an Artificial Neural Network Approach. Metals 2019, 9, 506. [Google Scholar] [CrossRef]
  28. Raami, L.; Varis, T.; Valtonen, K.; Wendler, M.; Volkova, O.; Peura, P. Enhancing the Cavitation Erosion Resistance of AISI 420-Type Stainless Steel with Quenching and Partitioning. Wear 2023, 526–527, 204897. [Google Scholar] [CrossRef]
  29. Basumatary, J.; Nie, M.; Wood, R.J.K. The Synergistic Effects of Cavitation Erosion–Corrosion in Ship Propeller Materials. J. Bio-Tribo-Corros. 2015, 1, 12. [Google Scholar] [CrossRef]
  30. Bărbulescu, A.; Dumitriu, C.Ș. Fractal Characterization of Brass Corrosion in Cavitation Field in Seawater. Sustainability 2023, 15, 3816. [Google Scholar] [CrossRef]
  31. Dojcinovic, M.; Markovic, S. The Morphology of Cavitation Damage of Heat-Treated Medium Carbon Steel. J. Serbian Chem. Soc. 2006, 71, 977–984. [Google Scholar] [CrossRef]
  32. Bordeasu, I.; Popoviciu, M.O.; Ghera, C.; Micu, L.M.; Pirvulescu, L.D.; Bena, T. The Use of Rz Roughness Parameter for Evaluation of Materials Behavior to Cavitation Erosion. IOP Conf. Ser. Mater. Sci. Eng. 2018, 294, 012020. [Google Scholar] [CrossRef]
  33. Dojcinovic, M. Roughness Measurement as an Alternative Method in Evaluation of Cavitation Resistance of Steels. Hem. Ind. 2012, 67, 323–330. [Google Scholar] [CrossRef]
  34. Han, S.; Lin, J.H.; Kuo, J.J.; He, J.L.; Shih, H.C. The Cavitation-Erosion Phenomenon of Chromium Nitride Coatings Deposited Using Cathodic Arc Plasma Deposition on Steel. Surf. Coat. Technol. 2002, 161, 20–25. [Google Scholar] [CrossRef]
  35. SRPS C.A1.011:2004; Methods of Chemical Analyses—Optical Emission Spectrometric Method with Spark Excitation for Quantitative Chemical Analyses of Pig Iron, Cast Iron, Low-Alloy Steels, High-Alloy Steels, Aluminium Alloys and Copper Alloys. Institute for Standardization of Serbia: Belgrade, Serbia, 2004.
  36. EN 10083-3:2006; Steels for Quenching and Tempering—Part 3: Technical Delivery Conditions for Alloy Steels. European Committee for Standardization (CEN): Brussels, Belgium, 2006.
  37. ASTM G44; Standard Practice for Exposure of Metals and Alloys by Alternate Immersion in Neutral 3.5% Sodium Chloride Solution. ASTM International: West Conshohocken, PA, USA, 2021.
  38. ISO 11130:2017; Corrosion of Metals and Alloys—Alternate Immersion Test in Salt Solution. ISO: Geneva, Switzerland, 2017.
  39. ASTM G1-03(2017)e1; Standard Practice for Preparing, Cleaning, and Evaluating Corrosion Test Specimens. ASTM International: West Conshohocken, PA, USA, 2017.
  40. ASTM G32-16; Standard Test Method for Cavitation Erosion Using Vibratory Apparatus. ASTM International: West Conshohocken, PA, USA, 2016.
  41. Murillo-Marrodán, A.; Bulzak, T.; García, E.; Derazkola, H.A.; Majerski, K.; Tomczak, J.; Pater, Z. Effect of Warm Forming Process Parameters on 42CrMo4 Skew Rolled Bar Mechanical Properties and Microstructure. Arch. Civ. Mech. Eng. 2024, 24, 20. [Google Scholar] [CrossRef]
  42. Kuc, D.; Bednarczyk, I.; Krawczyk, A.; Paterek, W.; Zygmunt, K.; Woźniak, D.; Hadasik, E. Structure and mechanical properties of rolled bars from steel 42CrMo4. In Proceedings of the 28th International Conference on Metallurgy and Materials, Hotel Voronez I, Brno, Czech Republic, 22–24 May 2019; pp. 391–396. [Google Scholar] [CrossRef]
  43. Pop, M.; Sas-Boca, I.-M.; Frunză, D.; Popa, F.; Neag, A. The Influence of Hot Deformation on the Mechanical and Structural Properties of 42CrMo4 Steel. Metals 2024, 14, 647. [Google Scholar] [CrossRef]
  44. Zhang, L.; Ren, Y. Introduction of Non-metallic Inclusions in Steels. In Handbook of Non-Metallic Inclusions in Steels; Springer: Singapore, 2025. [Google Scholar] [CrossRef]
  45. Sidorova, E.; Karasev, A.; Kuznetsov, D.; Jönsson, P.G. Investigation of the Initial Corrosion Destruction of a Metal Matrix around Different Non-Metallic Inclusions on Surfaces of Pipeline Steels. Materials 2022, 15, 2530. [Google Scholar] [CrossRef]
  46. Guo, Z.; Liu, E.; Wang, Q.; Lou, X.; Liu, H.; Zheng, Y.; Wang, B.; Zhu, L. Effect of Mg-Ce Treatment on Inclusion Characteristics and Pitting Corrosion Behavior in EH420 Marine Steel. Metals 2023, 13, 1244. [Google Scholar] [CrossRef]
  47. Alcántara, J.; de la Fuente, D.; Chico, B.; Simancas, J.; Díaz, I.; Morcillo, M. Marine Atmospheric Corrosion of Carbon Steel: A Review. Materials 2017, 10, 406. [Google Scholar] [CrossRef]
  48. Kaczmarczyk, R.; Gurgul, S. Thermodynamic Analysis of Chloride Corrosion in Steel for Energy System Applications in Fe-O-Cl-Na Environments. Energies 2024, 17, 3223. [Google Scholar] [CrossRef]
  49. Dariva, C.G.; Galio, A.F. Corrosion Inhibitors—Principles, Mechanisms and Applications. In Developments in Corrosion Protection; IntechOpen: London, UK, 2014. [Google Scholar] [CrossRef]
  50. Shin, S.-B.; Song, S.-J.; Shin, Y.-W.; Kim, J.-G.; Park, B.-J.; Suh, Y.-C. Effect of Molybdenum on the Corrosion of Low Alloy Steels in Synthetic Seawater. Mater. Trans. 2016, 57, 2116–2121. [Google Scholar] [CrossRef]
  51. Yu, X.; Al-Saadi, S.; Zhao, X.-L.; Raman, R.K.S. Electrochemical Investigations of Steels in Seawater Sea Sand Concrete Environments. Materials 2021, 14, 5713. [Google Scholar] [CrossRef]
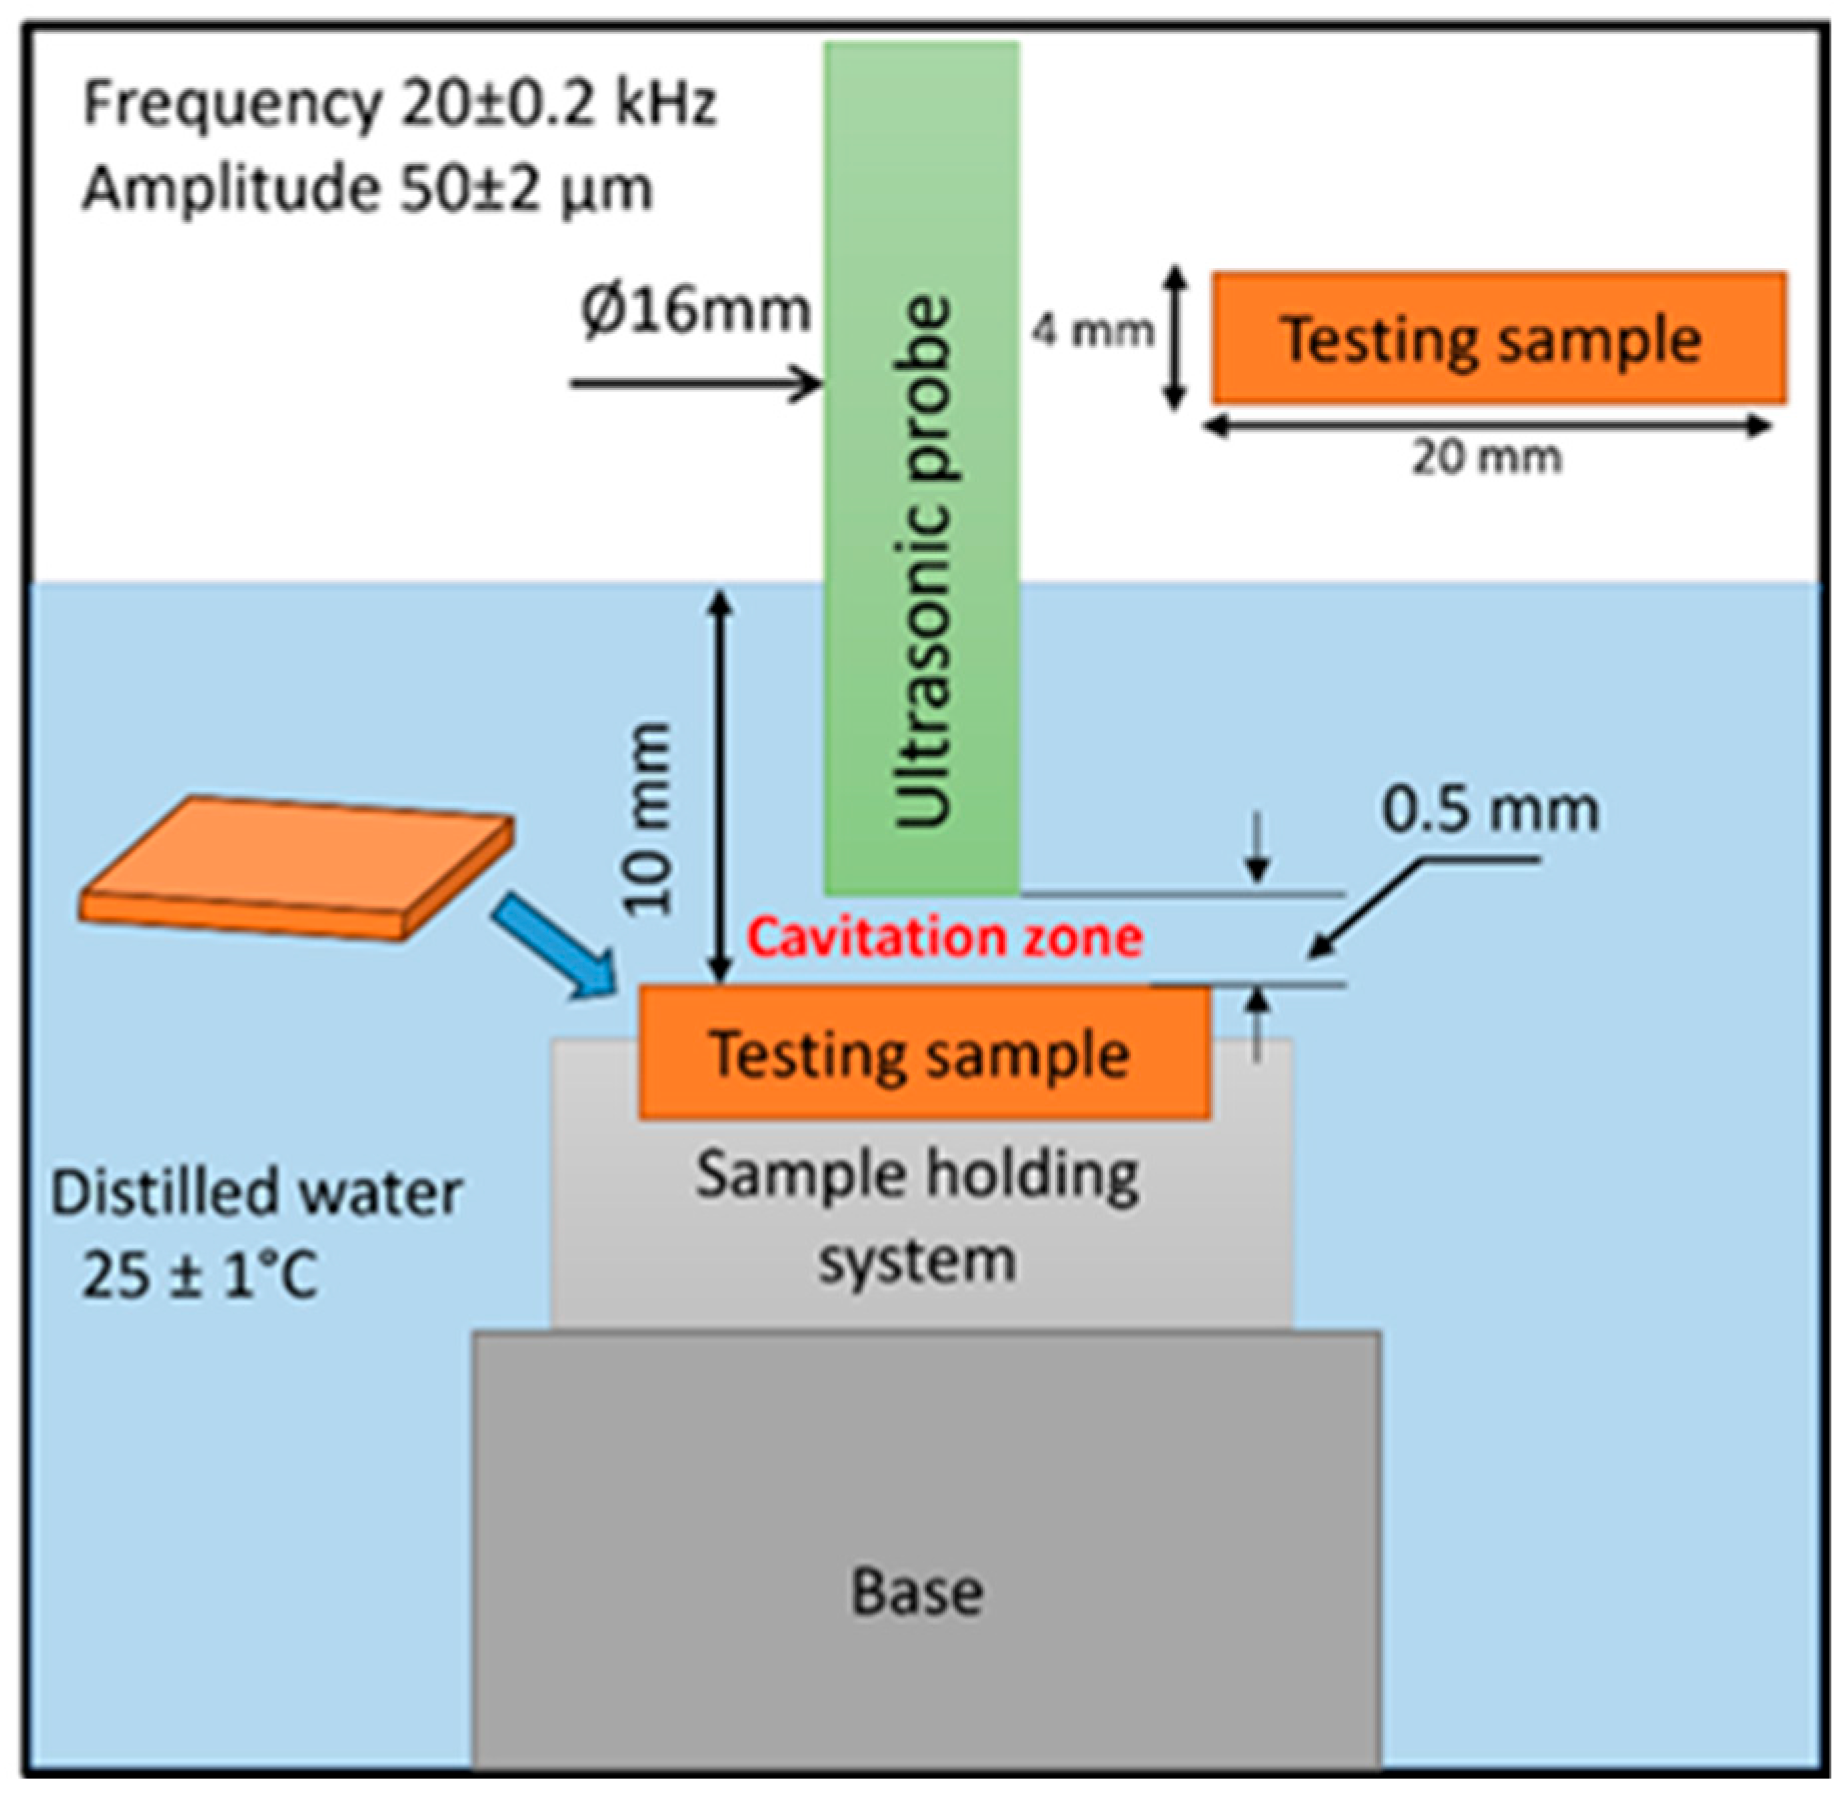
Figure 1. Part of the schematic presentation of the cavitation vibratory setup with the sample dimensions and cavitation test parameters.
Metals 15 01154 g001
Figure 2. Mass loss of 42CrMo4 during corrosion test at predetermined intervals.
Metals 15 01154 g002
Figure 3. Corrosion rate of 42CrMo4 before and during testing.
Metals 15 01154 g003
Figure 4. SEM images of the sample surface after different periods of corrosion exposure (red areas indicate corrosion damage).
Metals 15 01154 g004
Figure 5. Results of selected morphological parameters during the corrosion test at predetermined intervals.
Metals 15 01154 g005
Figure 6. SEM image and elemental composition of 42CrMo4 steel before testing.
Metals 15 01154 g006
Figure 7. SEM image and elemental composition of 42CrMo4 steel after corrosion for 30 days.
Metals 15 01154 g007
Figure 8. SEM images and elemental composition of 42CrMo4 steel after corrosion for 60 days.
Metals 15 01154 g008
Figure 9. SEM images and elemental composition of 42CrMo4 steel after corrosion for 90 days.
Metals 15 01154 g009
Figure 10. SEM images and elemental composition of 42CrMo4 steel after corrosion for 120 days.
Metals 15 01154 g010
Figure 11. Mass loss and mass loss rate during cavitation testing.
Metals 15 01154 g011
Figure 12. The appearance of the sample surface before and during cavitation erosion testing obtained using OM and SEM.
Metals 15 01154 g012
Figure 13. Determined values of selected morphological parameters during the cavitation test.
Metals 15 01154 g013
Figure 14. Surface degradation levels of 42CrMo4 steel subjected to cavitation and corrosion.
Metals 15 01154 g014
Figure 15. SEM images of surface degraded area of 42CrMo4 steel subjected to cavitation and corrosion.
Metals 15 01154 g015
Figure 16. Correlation between mass loss and pit density resulting from corrosion and cavitation exposure.
Metals 15 01154 g016
Table 1. Chemical composition of 42CrMo4 low-alloy steel (weight%).
42CrMo4
Element (wt. %)CCrMoMnSiNiCuAlSPFe
0.400.930.200.650.290.030.040.0440.0030.009Bal.
Table 2. Selected descriptors for the morphological characterization of formed pits.
Morphological DescriptorDefinitionImage
AreaArea of object.
Does not include a hole area
Metals 15 01154 i001
The total area of the pitsThe sum of the area of single objectsMetals 15 01154 i002
Diameter (mean)The average length of diameters measured at 2-degree intervals and passing through the object’s centroid.Metals 15 01154 i003
Number of pits/defectsNumber of selected objectsMetals 15 01154 i004
Disclaimer/Publisher’s Note: The statements, opinions and data contained in all publications are solely those of the individual author(s) and contributor(s) and not of MDPI and/or the editor(s). MDPI and/or the editor(s) disclaim responsibility for any injury to people or property resulting from any ideas, methods, instructions or products referred to in the content.