Abstract
Biomass ironmaking is crucial for carbon reduction in the ironmaking industry. To understand this process better, the iron production capacity and energy requirements of biomass were studied. A thermodynamic equilibrium model and energy consumption model for the biomass and iron oxide reduction system at 100–1300 °C was established by the minimum free Gibbs energy method. The effects of factors such as biomass type, temperature, and initial amount of iron oxide on the system were analyzed. The research results indicated that the maximum ironmaking capacity of biomass was determined by the element content of carbon, hydrogen and oxygen in biomass and temperature. The equilibrium H2/(H2 + H2O) and CO/(CO + CO2) at the maximum iron yield were affected not by the biomass species and element content, but by temperature. The reduction capacity of the ten selected biomass types decreased with a temperature increase from 700 °C to 1300 °C. For the 1 kg of pine sawdust and iron oxide system, the maximum equilibrium state amount of metallic iron was 23.05 mol at 718 °C, and the minimum system energy consumption per ton Fe was 1.16 GJ at 800 °C and 1.18 GJ at 900 °C. These research results will provide a key basis for a deeper understanding of the intrinsic mechanism of biomass ironmaking.
1. Introduction
In recent decades, the issue of global climate change has become an urgent concern, compelling various industries to seek effective strategies for reducing carbon emissions. The ironmaking industry, as a major contributor to carbon dioxide emissions, is under significant pressure to transform its production processes. Biomass ironmaking has emerged as a promising alternative that holds the potential to substantially mitigate carbon emissions in this sector [1,2,3,4,5].
The traditional ironmaking process, which heavily relies on coal and other fossil fuels, is associated with large amounts of carbon dioxide emissions. In contrast, biomass, being a renewable and carbon-neutral resource, offers an attractive solution. Biomass can be sourced from a wide range of organic materials such as wood, agricultural residues, and dedicated energy crops. By utilizing biomass in the ironmaking process, the industry can potentially reduce its carbon footprint and move towards a more sustainable future [6,7,8,9].
To comprehensively evaluate the viability and efficiency of biomass ironmaking, it is essential to investigate two key aspects: the iron production capacity and the energy requirements associated with biomass utilization. Understanding the iron production capacity of biomass is crucial as it determines the practicality and scale of its application in the ironmaking industry.
The thermodynamic equilibrium model established using the minimum free Gibbs energy method allows us to predict the chemical reactions and equilibrium compositions that occur during the interaction between biomass and iron oxide [10,11,12]. The energy consumption model is of utmost importance as it directly impacts the economic and environmental feasibility of the technology [13,14,15,16]. The main influencing factors of these two models are biomass type and element content, temperature, and the initial amount of iron oxides.
This research on biomass ironmaking is of great significance in the context of the ironmaking industry’s pursuit of carbon reduction [17,18,19]. By systematically studying the iron production capacity and energy requirements through the establishment and analysis of thermodynamic and energy consumption models, we can gain a deeper understanding of the underlying processes and work towards the development and optimization of sustainable biomass ironmaking technologies.
2. Materials and Methods
2.1. Thermodynamic Equilibrium Model
Biomass cannot be classified as a pure substance or a simple mixture, and chemical equilibrium analysis models cannot be developed by formulating chemical equations that account for biomass’s role in reactions [20]. To address this challenge, establishing a thermodynamic equilibrium model using the minimum free energy method relies solely on the analysis and testing results of the elemental composition of biomass, without considering the specific types of compounds present in biomass combustibles.
The minimum Gibbs free energy principle considers the number of elements and the thermodynamic functions of components as the initial non-equilibrium state, while the number of equilibrium components represent the endpoint equilibrium state [15]. This principle is a widely used method for analyzing the types and quantities of equilibrium substances in complex multiphase systems such as the gasification process of coal or biomass, the reduction process of iron, etc.
To construct a thermodynamic equilibrium model using the minimum free energy method and enhance its clarity, the following assumptions must be made:
- (1)
- The temperature and pressure of the system remain constant in both the initial and final states;
- (2)
- All chemical reactions ultimately reach a state of equilibrium;
- (3)
- Ignore the pressure drop and heat loss that occur during the reaction process;
- (4)
- Assume that biomass pyrolysis is complete and that no organic matter remains;
- (5)
- It is believed that the ash content in biomass and the gangue in iron ore are inert substances that do not participate in any chemical reactions. Therefore, they are not included in the thermodynamic equilibrium model;
- (6)
- Due to the low content of nitrogen (N) and sulfur (S) in biomass combustibles, which do not participate in reduction reactions, these elements are not included in the thermodynamic equilibrium model.
The simplified model diagram is shown in Figure 1, with biomass and iron oxides as the research objects. The initial state composition includes temperature, pressure, and the amount of four elemental substances: C, H, O, and Fe. The endpoint equilibrium state includes temperature, pressure, and the amount of 11 compound substances. There are 11 types of equilibrium substances in the system, including H2, H2O, and CH4 for the hydrogen element; Fe, Fe0.947O, Fe3O4, Fe2O3, and Fe3C for the iron element; C, CO, CO2, CH4, and Fe3C for the carbon element; and H2O, CO, CO2, Fe0.947O, Fe3O4, and Fe2O3 for the oxygen element.
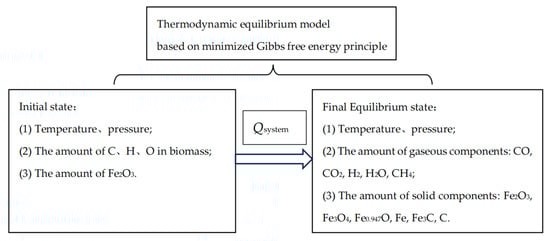
Figure 1.
Schematic diagram of the thermodynamic equilibrium model for direct reaction between biomass and iron oxides based on the minimum free energy method.
The simplified model diagram is presented in Figure 1, focusing on biomass and iron oxides as the primary research subjects. The initial state composition encompasses temperature, pressure, and the quantities of four elemental substances: carbon (C), hydrogen (H), oxygen (O), and iron (Fe). The endpoint equilibrium state includes temperature, pressure, and the quantities of 11 equilibrium substances, which include H2, H2O, and CH4 for hydrogen; Fe, Fe0.947O, Fe3O4, Fe2O3, and Fe3C for iron; and C, CO, CO2, CH4, and Fe3C for carbon. Additionally, the oxygen element is represented by H2O, CO, CO2, Fe0.947O, Fe3O4, and Fe2O3.
The expression of the minimum free energy method model is shown in the Formulas (1)–(3). By solving the non-linear equations with constraints, the amount of each component in the equilibrium state could be received.
In these two formulas, i, e represent the components and elements in the equilibrium state, respectively; N, M, represent the number of components and the number of elements in the equilibrium state, respectively; and ni, ne, are the amount of the components i and elements e in the equilibrium state, respectively; mol, , , represent the Gibbs free energy and the standard Gibbs free energy of the components i, respectively, J/mol; , represent the sum of Gibbs free energy for all components, J/mol; represents the number of element e in the component i; T represents the thermodynamic temperature of the system, K; R is the ideal gas constant, which is equal to 8.314, J/(mol · K).
represents the activity of component i, which is represented as follows: when i is a gaseous state, its activity is determined by the total gas pressure and the molar concentration of gas component i in the all-gas phase; when i is a liquid state, its activity is determined by the molar concentration of the liquid component i in the all liquid phase and activity coefficient ; when i is a solid state, . , , represent the partial pressure of the components i, the total pressure of all gas, and the standard atmospheric pressure, respectively, Pa, and .
The software LINGO v.17.0 is utilized for mathematical calculations of minimum values for non-linear equations. To enhance computational efficiency, divide the expression for the sum of Gibbs free energy by 103 during the calculation process.
The Gibbs free energy and enthalpy values of pure matter used in this model are derived from the formulation of thermodynamic equations, along with the compilation and transformation of data from the Pure Matter Handbook, as referenced in the author’s previous articles [11].
Ten different types of representative biomass were selected from the Chinese literature [16,21] as the research objects. The amount of combustible substances C, H, and O in 1 kg of biomass are shown in Table 1, respectively.

Table 1.
The amount of combustible substances C, H, and O in 1 kg of biomass mol.
2.2. Related Definitions
In the direct reaction system for the biomass reduction of iron oxides, the factors considered in this study include temperature, biomass type, and iron oxide content. The optimized system indicators encompass gas yield, gas composition, carbon conversion rate, the complete combustion heat value of the gas, metallization rate, reduction degree, and system energy consumption.
Total Gas yield refers to the volume of gas produced per unit mass of biomass during conversion under standard conditions, specifically the following:
In the formula, represents the gas volume per unit mass of biomass after its reaction with iron oxides, measured in Nm3/kg. represents the gas molar volume under standard conditions, which is 0.0224 Nm3/mol. represents the amount of gas component i in the equilibrium state, mol. represents the mass of biomass, kg.
The refers to the ratio between the amount of H2 and H2 + H2O in the equilibrium state, that is:
In the formula, represents the H2/(H2 + H2O). , represent the amount of H2 and H2O in the equilibrium state, respectively, mol.
The refers to the ratio between the amount of CO and CO + CO2 in the equilibrium state, that is:
In the formula, represents the CO/(CO + CO2). , represent the amount of CO and CO2 in the equilibrium state, respectively, mol.
The carbon conversion rate (CCR) refers to the ratio of the amount of carbon containing products to the total carbon content in initial biomass, %, that is:
In the formula, , , , , represent the amount of CO, CO2, CH4, Fe3C, and C in the equilibrium state, respectively, mol; represents the amount of carbon substances in initial biomass, mol.
Metallization rate refers to the ratio of the amount of equilibrium metallic iron to the iron content in the raw material, %, that is:
In the formula, represents the amount of metallic iron in the equilibrium state, mol; represents the amount of Fe2O3 in the initial state, mol.
Reduction degree refers to the ratio of the oxygen loss in iron oxides to the oxygen in the iron oxides in initial state, %, that is:
In the formula, , , represent the amount of Fe2O3, Fe3O4, Fe0.947O in equilibrium state, mol; represents the amount of Fe2O3 in initial state, mol.
The total complete combustion heat of gasification products refers to the sum of the complete combustion enthalpy of CO, H2, CH4, and C in the equilibrium state, MJ, that is:
In the formula, represents the combustion chemical heat of gasification products, MJ, and is a positive value through the symbol “-”. represents complete combustion enthalpy of combustible components reacting with O2 to produce CO2 and H2O, J/mol, and is a negative value based on exothermic reaction Formulas (11) and (12). represents the amount of combustible components i (=CO, H2, CH4 and C) of gasification products, mol.
In the formula, x, y, z represent the number of C, H, and O atoms in the chemical formula of the combustible components in the reaction system, respectively., , , represent the absolute enthalpy values of CO2, H2O, CxHyOz, and O2 at temperature and standard pressure, respectively.
The heat consumption of biomass gasification is the difference between the complete combustion heat value of the gasification products and the lower heat value of the raw materials, as shown in the Formula (13).
In the formula, represents the heat consumption of the biomass gasification conversion, MJ, and the negative value is exothermic, and the positive value is endothermic.
The heat consumption of the iron oxides reduction is the difference between the calorific value of the iron-containing products in the system and the calorific value of the iron-containing raw materials, as shown in the Formula (14):
In the formula, represents the heat consumption for the iron oxides reduction conversion, MJ, and the negative value is exothermic, and the positive value is endothermic. , signify the iron-containing components after and before the state change, respectively. and represent the amount of iron-containing components after and before the state change, respectively. and represent the number of components after and before the state change, respectively, mol. and represent the thermodynamic temperature of components after and before the state change, respectively, K. and , represent the standard molar enthalpy of component at the thermodynamic temperature and the component at the thermodynamic temperature , respectively, J/mol.
According to energy conservation, the system energy consumption of biomass and the iron oxide reduction system is composed of the heat consumed by biomass gasification conversion and the heat consumed by iron oxide reduction conversion, as shown in Formula (15):
In the formula, represents the system energy consumption of biomass and iron oxide reduction system, MJ, and the negative value is exothermic, and the positive value is endothermic.
3. Results and Discussion
Different amount and types of biomass and different temperatures were set to investigate the effects on the reduction products and energy consumption.
3.1. Effect of Fe2O3 Initial Amount
The conditions were set as follows: the initial mass of biomass was 1.0 kg; the type and element content of the biomass was listed in Table 1; the initial amount of Fe2O3 was 0.1–150.0 mol (increment 0.1 mol); the reduction temperature was 900 °C; and the total pressure was 101,325 Pa.
3.1.1. Equilibrium Products
Figure 2 shows the relationship between the Fe2O3 initial amount and the amount of equilibrium products for the pine sawdust and iron oxide reduction system at 900 °C and 101,325 Pa. According to the trend of the product type and the amount of the material, the reduction process can be divided into five stages in sequence. In these conditions, no Fe3O4 and Fe3C appeared.
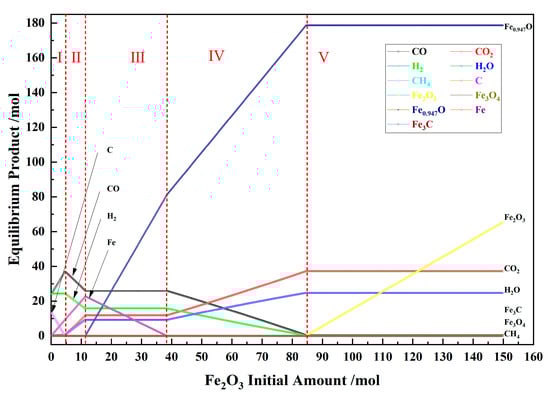
Figure 2.
The effect of the Fe2O3 initial amount on the amount of equilibrium products in the pine sawdust and iron oxide reduction system at 900 °C and 101,325 Pa.
In the I stage, the Fe2O3 initial amount was 0–4.7 mol, and the iron-containing products only contained Fe. With the Fe2O3 initial amount increasing, the product Fe amount increased, the product C amount gradually decreased to zero, the product CO amount increased to the max value, the product H2 amount remained unchanged, the product amount of CO2 and H2O amount increased slightly, and the product CH4 amount was small and decreased slowly.
In the II stage, the Fe2O3 initial amount was 4.7–11.4 mol, and the iron-containing products only contained Fe. With the Fe2O3 initial amount increasing, the product Fe amount increased to the max, the product of CO and H2 amount decreased, the product amount of CO2 and H2O amount increased significantly, and the product CH4 amount decreased to zero.
In the III stage, the Fe2O3 initial amount was 11.4–38.4 mol, and the iron-containing products only contained Fe and Fe0.947O. With the Fe2O3 initial amount increasing, the product Fe amount gradually decreased to zero, the product Fe0.947O amount increased significantly, and the product amount of CO, H2, CO2 and H2O amount remained unchanged. This stage is critical for the reduction in biomass and iron oxides. Under the coexistence of Fe0.947O–Fe and the absence of fixed carbon, CO–CO2–H2–H2O gas has a specific compositional relationship, which can be used to determine the transformation product distribution of carbon and hydrogen in biomass.
In the IV stage, the Fe2O3 initial amount was 38.4–84.7 mol, and the iron-containing products only contained Fe0.947O. With the Fe2O3 initial amount increasing, the product Fe0.947O amount increased significantly, the product of CO and H2 amount decreased significantly, and the product of CO2 and H2O amount increased significantly.
In the V stage, the Fe2O3 initial amount was 84.7–150.0 mol, and the iron-containing products only contained Fe2O3 and Fe0.947O. With the Fe2O3 initial amount increasing, the product Fe0.947O amount remained unchanged, the product Fe2O3 amount increased significantly, the product amount of CO and H2 were small and remained unchanged, and the product amount of CO2 and H2O were significant and remained unchanged.
3.1.2. Solid Products Relationship
Figure 3 shows the relationship between the Fe2O3 initial amount and the carbon conversion for the 10 types of biomasses and iron oxide reduction system at 900 °C and 101,325 Pa. With the Fe2O3 initial amount increasing from 0.1 mol to 20 mol, the carbon conversion increased to 100% from the I to II stages, and remained unchanged in the III–V stages. Except for dried cow manure and sludge, other biomass species exhibit certain similarities; that is, the lower the initial carbon conversion rate, the more the Fe2O3 initial amount is required to achieve 100% conversion rate. The main carbon conversion products were CO and CO2, as well as a small amount of CH4. As shown in Table 1, for sludge and dried cow manure, the amount of substance C in these two types of biomasses is much smaller than that of other biomasses, which may be the reason for the difference in their carbon conversion curves compared to other biomasses.
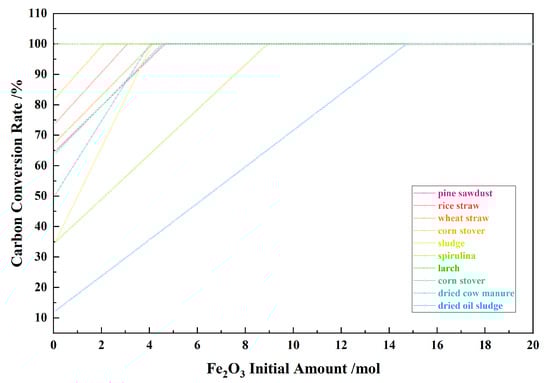
Figure 3.
The effect of the Fe2O3 initial amount on the carbon conversion rate in the biomass and iron oxide reduction system at 900 °C and 101,325 Pa.
Figure 4 shows the relationship between the Fe2O3 initial amount and the Fe equilibrium amount for the 10 types of biomasses and iron oxide reduction system at 900 °C and 101,325 Pa. With the Fe2O3 initial amount increasing, the Fe equilibrium amount increased to the maximum from the I to II stages and decreased to zero in the III stage.
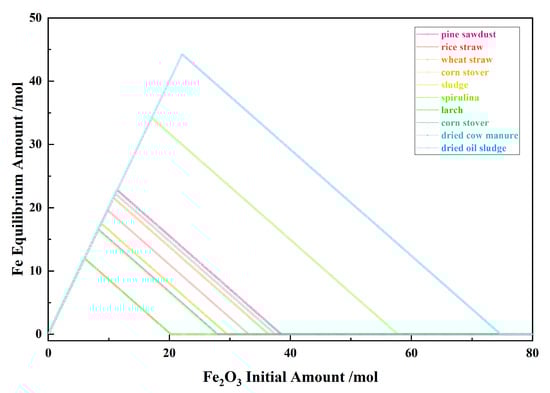
Figure 4.
The effect of the Fe2O3 initial amount on the Fe equilibrium amount in the biomass and iron oxide reduction system at 900 °C and 101,325 Pa.
Figure 5 shows the relationship between the Fe2O3 initial amount and the metallization rate for the 10 types of biomasses and iron oxide reduction system at 900 °C and 101,325 Pa. With the Fe2O3 initial amount increasing, the metallization rate remained at 100% in the I–II stages, and decreased to zero in the III stage.
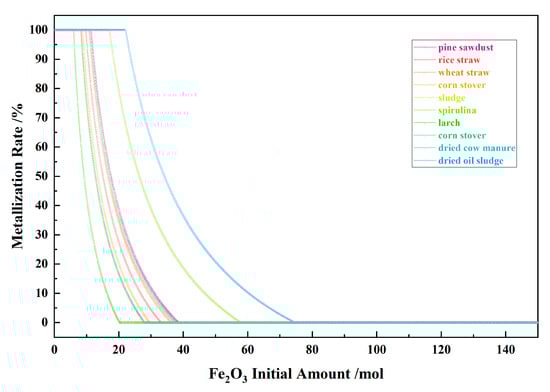
Figure 5.
The effect of the Fe2O3 initial amount on the metallization rate in the biomass and iron oxide reduction system at 900 °C and 101,325 Pa.
Figure 6 shows the relationship between the Fe2O3 initial amount and the reduction degree for the 10 types of biomasses and iron oxide reduction system at 900 °C and 101,325 Pa. With the Fe2O3 initial amount increasing, the Fe equilibrium amount increased to the maximum from the I to II stages and decreased to zero in the III stage.
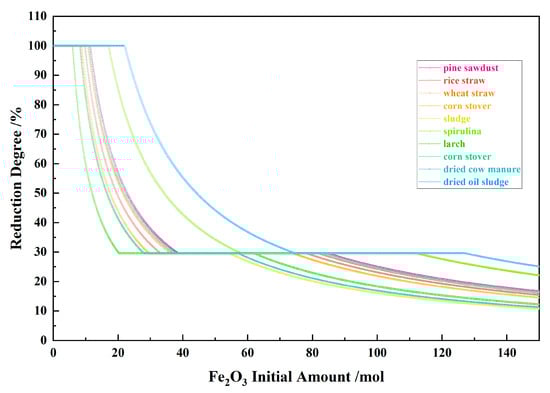
Figure 6.
The effect of the Fe2O3 initial amount on the reduction degree in the biomass and iron oxide reduction system at 900 °C and 101,325 Pa.
3.1.3. Gaseous Products Relationship
Figure 7 shows the relationship between the Fe2O3 initial amount and the total gas yield for the 10 types of biomasses and iron oxide reduction system at 900 °C and 101,325 Pa. With the Fe2O3 initial amount increasing, the total gas yield increased significantly in the I and II stage and remained unchanged in the III–IV stage, with the gas composed of CO, CO2, H2, and H2O. When the gas components remained constant, there were some specific proportional relationships between the concentration of gas components, which would be analyzed later.
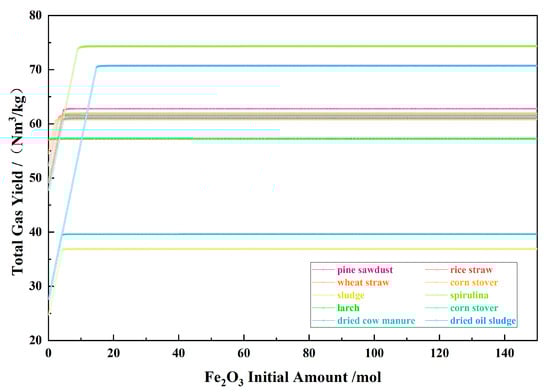
Figure 7.
The effect of the Fe2O3 initial amount on the total gas yield in the biomass and iron oxide reduction system at 900 °C and 101,325 Pa.
Figure 8 shows the relationship between the Fe2O3 initial amount and the equilibrium H2/(H2 + H2O) for the 10 types of biomasses and iron oxide reduction system at 900 °C and 101,325 Pa. With the Fe2O3 initial amount increasing, the equilibrium H2/(H2 + H2O) decreased in the I, II and IV stages and remained unchanged and consistent in the III and V stage.
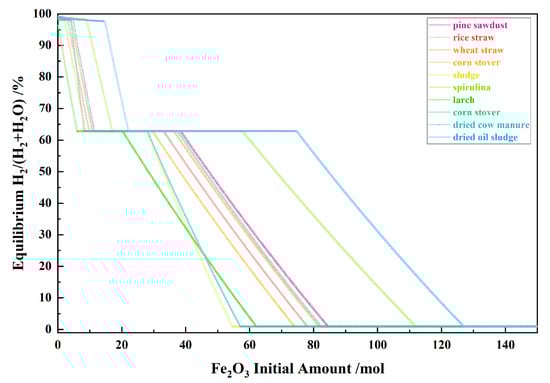
Figure 8.
The effect of the Fe2O3 initial amount on the equilibrium H2/(H2 + H2O) in the biomass and iron oxide reduction system at 900 °C and 101,325 Pa.
Figure 9 shows the relationship between the Fe2O3 initial amount and the equilibrium CO/(CO + CO2) for the 10 types of biomasses and iron oxide reduction system at 900 °C and 101,325 Pa. With the Fe2O3 initial amount increasing, the equilibrium CO/(CO + CO2) decreased in the I, II and IV stages and remained unchanged and consistent in the III and V stage.
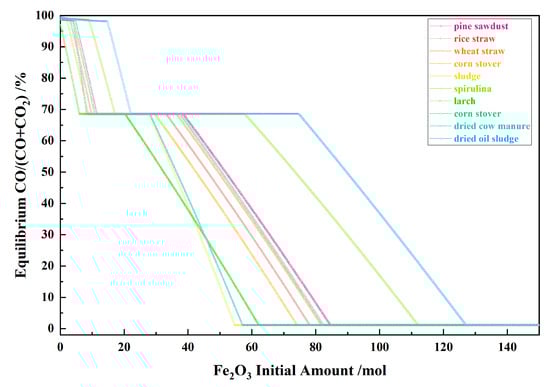
Figure 9.
The effect of the Fe2O3 initial amount on the equilibrium CO/(CO + CO2) in the biomass and iron oxide reduction system at 900 °C and 101,325 Pa.
Figure 10 shows the relationship between the Fe2O3 initial amount and the H2 + CO equilibrium concentration for the 10 types of biomasses and iron oxide reduction system at 900 °C and 101,325 Pa. With the Fe2O3 initial amount increasing, the H2 + CO equilibrium concentration decreased in the I, II and IV stages and remained unchanged and consistent in the III and V stage.
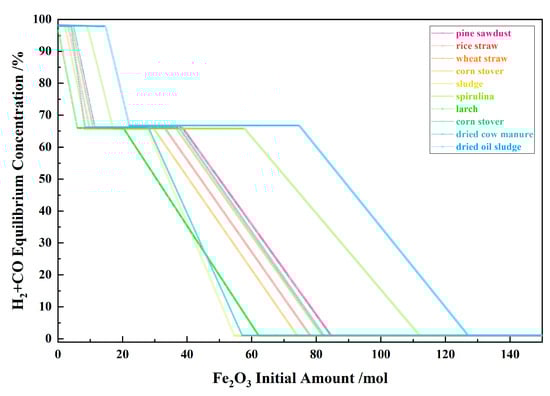
Figure 10.
The effect of the Fe2O3 initial amount on the H2 + CO equilibrium concentration in the biomass and iron oxide reduction system at 900 °C and 101,325 Pa.
3.1.4. Heat Enthalpy Relationship
Figure 11 shows the relationship between the Fe2O3 initial amount and the heat consumption of biomass gasification for the 10 types of biomasses and iron oxide reduction system at 900 °C and 101,325 Pa. With the Fe2O3 initial amount increasing, the heat consumption of biomass gasification decreased in the I, II and IV stages, and remained unchanged in the III and V stage. This is because the amount of each gas remained constant for different biomasses in the III and V stage.

Figure 11.
The effect of the Fe2O3 initial amount on the heat consumption of biomass gasification in the biomass and iron oxide reduction system at 900 °C and 101,325 Pa.
Figure 12 shows the relationship between the Fe2O3 initial amount and the heat consumption of iron oxides reduction for the 10 types of biomasses and iron oxide reduction system at 900 °C and 101,325 Pa. With the Fe2O3 initial amount increasing, the heat consumption of iron oxides reduction was a positive value and increased in the I, II and IV stages, and remained unchanged in the III and V stage. Under the same Fe2O3 initial amount, the larger the amount of metal iron or Fe0.947O produced by biomass reduction, the higher the required reduction energy consumption.
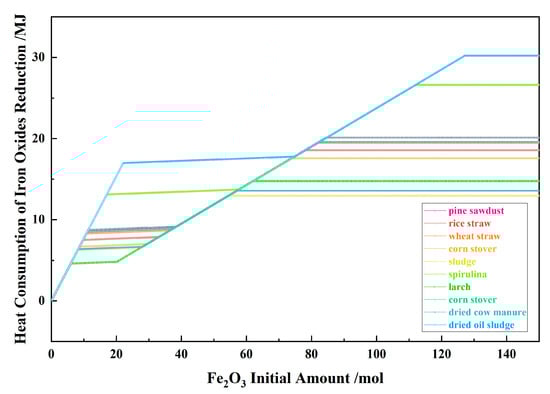
Figure 12.
The effect of the Fe2O3 initial amount on the heat consumption of iron oxides reduction in the biomass and iron oxide reduction system at 900 °C and 101,325 Pa.
Figure 13 shows the relationship between the Fe2O3 initial amount and the system energy consumption for the 10 types of biomasses and iron oxide reduction system at 900 °C and 101,325 Pa. For nine types of biomasses other than larch, with the Fe2O3 initial amount increasing, the system energy consumption exhibited a positive trend. It increased during stage I, decreased during stage II, increased again in stage III, and then decreased in stages IV and V. For the larch, with the Fe2O3 initial amount increasing, the system energy consumption exhibited a negative value, and the change amplitude was relatively small.
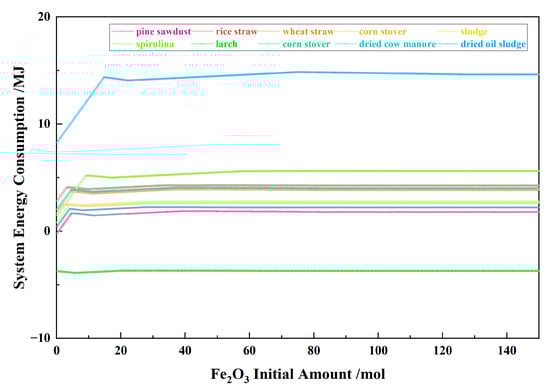
Figure 13.
The effect of the Fe2O3 initial amount on the system energy consumption in the biomass and iron oxide reduction system at 900 °C and 101,325 Pa.
3.1.5. Brief Summary and Discussion
If the goal is to obtain elemental iron, the endpoint of the III stage with Fe0.947O → Fe conversion, which is the point of maximum Fe production, is more valuable for us to study than the reaction system between biomass and iron oxides. According to the Fe production amount from low to high, Table 2 shows the equilibrium state results with maximum Fe production for the 1 kg of biomass and iron oxide reduction system at 900 °C and 101,325 Pa.
Table 2.
The equilibrium state results with maximum Fe production for the 1 kg of biomass and iron oxide reduction system at 900 °C and 101,325 Pa.
The amount of metallic Fe that can be produced per unit mass of biomass, from low to high, is as follows: larch, sludge, dried cow manure, corn straw, rice straw, wheat straw, corn stover, pine sawdust, spirulina, and dried oil sludge.
For these 10 types of biomasses, although H2/(H2 + H2O) and CO/(CO + CO2) are consistent under specific temperature and pressure conditions, the concentration of H2 + CO is different and ranges from 65.61% to 66.76% in a relatively small area, influenced by the comprehensive content of carbon, hydrogen, and oxygen elements in the biomass. This influence can be expressed through Formula (16), which calculates the maximum Fe production based on the amount of carbon, hydrogen, and oxygen elements in biomasses and the equilibrium value of H2/(H2 + H2O) and CO/(CO + CO2) in the III stage with Fe0.947O → Fe conversion.
In the formula, represents the maximum Fe production, mol. , , represent the amount of C, H, O in the biomass, respectively, mol. represents the equilibrium H2/(H2 + H2O) in the III stage with Fe0.947O → Fe conversion. represents the equilibrium CO/(CO + CO2) in the III stage with Fe0.947O → Fe conversion.
Convert the energy consumption data in Table 2 into the consumption per ton of Fe according to the Formula (17), and sort it in descending order of the system energy consumption per ton of iron. The results are shown in Table 3.
Table 3.
The energy consumption per ton of iron with maximum Fe production for the biomass and iron oxide reduction system at 900 °C and 101,325 Pa (GJ/tFe).
In the formula, = , , , MJ. represents the metallic Fe production amount, mol. the CO/(CO + CO2). = , , , and represent gasification, reduction and system energy consumption per ton of metallic Fe, respectively, GJ/tFe.
The system energy consumption per ton of metallic Fe, from low to high, is as follows: larch, pine sawdust, dried cow manure, corn straw, spirulina, sludge, wheat straw, corn stover, rice straw, and dried oil sludge.
Evidently, the system energy consumption per ton of iron reduced by different biomasses with maximum Fe production have a huge difference in biomass types. This is due to the differences in the LHV and the amount of gas products in different biomasses, even though the gas concentration in the gas products is the same.
3.2. Effect of Temperature
The conditions were set as follows: the biomass was pine sawdust; the initial mass of pine sawdust was 1.0 kg; the type and element content of pine sawdust was listed in Table 1; the initial amount of Fe2O3 was 1.0–15.0 mol (increment 1.0 mol) and 20.0–40.0 mol (increment 5.0 mol); the reduction temperature was 100–1300 °C; and the total pressure was 101,325 Pa.
Since the energy consumption of the pine sawdust ironmaking system is the minimum in endothermic reactions, it was chosen as the research object.
3.2.1. Equilibrium Products
Figure 14 shows the relationship between the temperature and the amount of equilibrium products in the 1 kg of pine sawdust and 15 mole of iron oxide reduction system at 101,325 Pa for the temperature ranges of 100–1300 °C (a) and 600–800 °C (b).
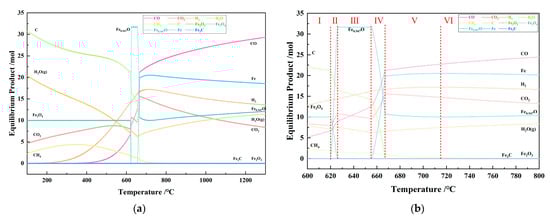
Figure 14.
The effect of the temperature on the amount of equilibrium products in the 1 kg of pine sawdust and 15 mol of iron oxide reduction system at 101,325 Pa: (a) 100–1300 °C; (b) 600–800 °C.
From Figure 14a, it can be seen that as the temperature increases from 100 °C to 1300 °C, the composition and quantity of equilibrium substances constantly change. Especially within the narrow temperature range of 620–718 °C, the changes are more complex, as shown in Figure 14b. Each stage is separated by a red dashed line in the Figure 14b and labeled with numerical symbols from I to VI. According to the phase change of the iron element, the temperature-dependent process in Figure 14b can be divided into six stages, as shown in Table 4. As the temperature increases, the reduction in iron follows a step-by-step reduction pattern at 100–718 °C: Fe2O3 → Fe3O4 → Fe0.947O → Fe. Within the temperature range of 718–1300 °C, as the temperature increases, there is a slow decrease in the amount of product Fe and a slow increase in the amount of product Fe0.947O. This is because within this range, the ratio of carbon monoxide to hydrogen in the system is ≥1.33, and the reduction ability of the mixed gas is similar to that of CO and decreases with increasing temperature.
Table 4.
The tendency of the amount of equilibrium products in the 1 kg of pine sawdust and 15 mol of iron oxide reduction system at 600–800 °C.
3.2.2. Solid Products Relationship
Figure 15 shows the relationship between the temperature and the carbon conversion rate in the 1 kg of pine sawdust and iron oxide reduction system at 100–1300 °C and 101,325 Pa. With the temperature increasing, the carbon conversion rate increased to the maximum and remained unchanged. When the Fe2O3 initial amount was ≥4 mol, the maximum carbon conversion rate was 100%. As the Fe2O3 initial amount decreased from 3 mol, the maximum carbon conversion rate decreased to <100%.
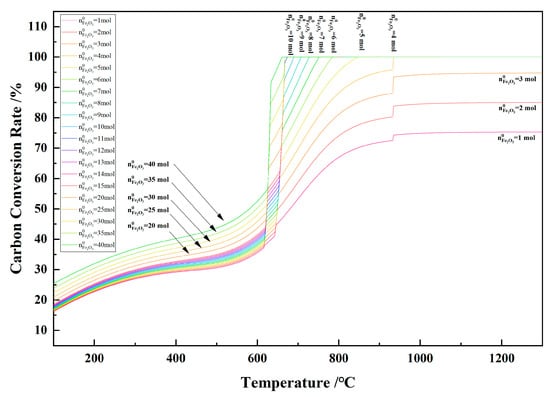
Figure 15.
The effect of the temperature on the carbon conversion rate in the 1 kg of pine sawdust and iron oxide reduction system at 100–1300 °C and 101,325 Pa.
Figure 16 shows the effect of the Fe2O3 initial amount on the temperature at a carbon conversion of 100% in the 1 kg of pine sawdust and iron oxide reduction system at 100–1300 °C and 101,325 Pa. As the Fe2O3 initial amount increased from 4 mol to 12 mol, the conversion temperature decreased from 934 °C to 668 °C. As the Fe2O3 initial amount increased from 12 mol to 35 mol, the conversion temperature was 668 °C. As the Fe2O3 initial amount increased from 35 mol to 40 mol, the conversion temperature decreased from 668 °C to 661 °C.
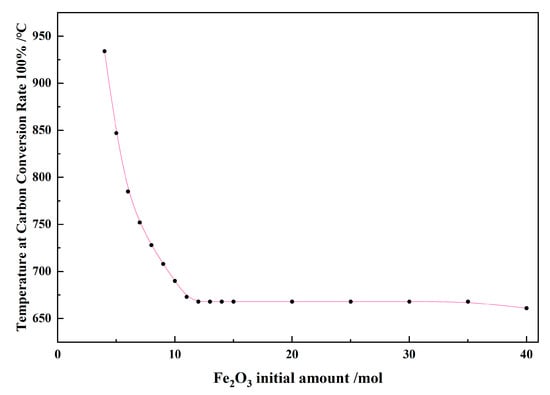
Figure 16.
The effect of the Fe2O3 initial amount on the temperature at a carbon conversion rate of 100% in the 1 kg of pine sawdust and iron oxide reduction system at 100–1300 °C and 101,325 Pa.
Figure 17 shows the relationship between the temperature and the metallization rate in the 1 kg of pine sawdust and iron oxide reduction system at 101,325 Pa and at 600–1300 °C (a) and 630–680 °C (b). With the temperature increasing from 640 °C to 670 °C, the metallization rate reached the maximum. The metallization rate remained at 100% as the Fe2O3 initial amount was 5–11 mol and the temperature was >670 °C. The maximum metallization rate decreased from 100% to zero as the Fe2O3 initial amount increased from 11 mol to 40 mol.
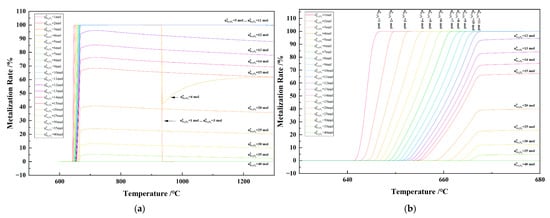
Figure 17.
The effect of the temperature on the metallization rate in the 1 kg of pine sawdust and iron oxide reduction system at 101,325 Pa: (a) 600–1300 °C; (b) 630–680 °C.
Figure 18 shows the relationship between the temperature and the degree of reduction in the 1 kg of pine sawdust and iron oxide reduction system at 600–1300 °C and 101,325 Pa. With the temperature increasing, the reduction degree of Fe2O3 reached 100% as the Fe2O3 initial amount was 1–11 mol, and the maximum reduction degree of Fe2O3 decreased to 29.60% as the Fe2O3 initial amount increased from 11 mol to 40 mol.
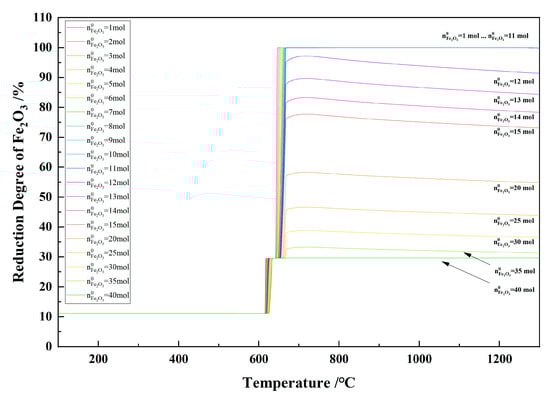
Figure 18.
The effect of the temperature on the reduction degree of Fe2O3 in the 1 kg of pine sawdust and iron oxide reduction system at 600–1300 °C and 101,325 Pa.
Figure 19 shows the relationship between the temperature and the Fe equilibrium amount in the 1 kg of pine sawdust and iron oxide reduction system at 600–1300 °C and 101,325 Pa. The maximum production of metallic Fe occurred when the Fe2O3 initial amount was 12 mol and the temperature was 718 °C, reaching 23.05 mol. The maximum production of metallic Fe remained unchanged when the Fe2O3 initial amount was 5–11 mol and the temperature was >670 °C, and decreased with the temperature increase from 670 °C to 1300 °C, when the Fe2O3 initial amount was 12–35 mol.
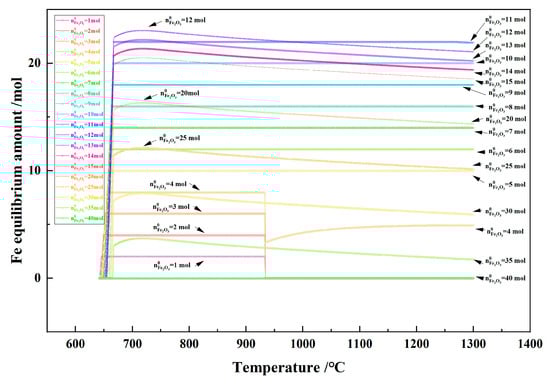
Figure 19.
The effect of the temperature on the Fe equilibrium amount in the 1 kg of pine sawdust and iron oxide reduction system at 600–1300 °C and 101,325 Pa.
3.2.3. Gaseous Products Relationship
Figure 20 shows the relationship between the temperature and the equilibrium H2/(H2 + H2O) in the 1 kg of pine sawdust and iron oxide reduction system at 100–1300 °C and 101,325 Pa. With the temperature increasing, the equilibrium H2/(H2 + H2O) shows a trend of first increasing and then decreasing as there is no carbon present in the system. When the initial Fe2O3 amount was 12–35 mol and temperature ≥ 666 °C, the equilibrium H2/(H2 + H2O) curves showed coincidence and consistency.
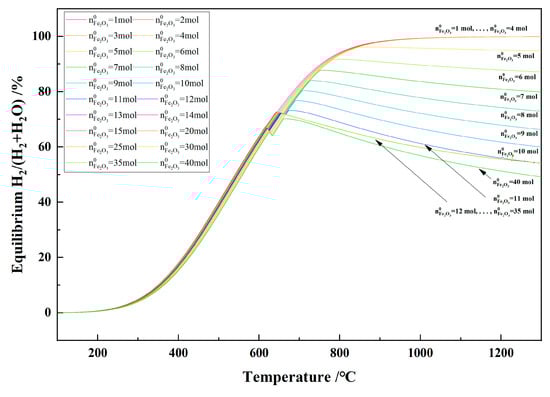
Figure 20.
The effect of the temperature on the equilibrium H2/(H2 + H2O) in the 1 kg of pine sawdust and iron oxide reduction system at 100–1300 °C and 101,325 Pa.
Figure 21 shows the relationship between the temperature and the equilibrium CO/(CO + CO2) in the 1 kg of pine sawdust and iron oxide reduction system at 100–1300 °C and 101,325 Pa. With the temperature increasing, the equilibrium CO/(CO + CO2) increased quickly initially and then slowed down. When the initial Fe2O3 amount was 12–35 mol and the temperature was ≥666 °C, the equilibrium CO/(CO + CO2) curves showed coincidence and consistency.
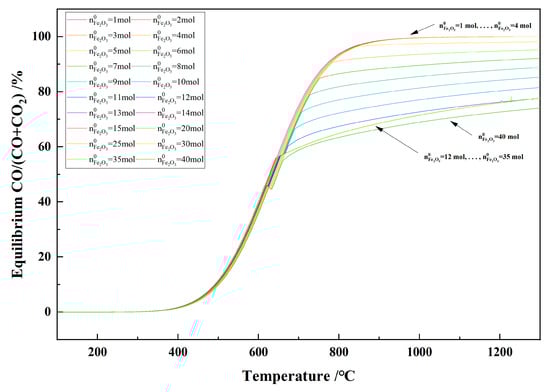
Figure 21.
The effect of the temperature on the equilibrium CO/(CO + CO2) in the 1 kg of pine sawdust and iron oxide reduction system at 100–1300 °C and 101,325 Pa.
Figure 22 shows the relationship between the temperature and the equilibrium H2 + CO in the 1 kg of pine sawdust and iron oxide reduction system at 100–1300 °C and 101,325 Pa. With the temperature increasing, the equilibrium H2 + CO increased and reached the maximum. When the initial Fe2O3 amount increased from 1 to 4 mol, the maximum equilibrium H2 + CO was same, namely 99.92%. When the initial Fe2O3 amount increased from 5 to 11 mol, the maximum equilibrium H2 + CO decreased from 96.81% to 68.15%. When the initial Fe2O3 amount was 12–35 mol and the temperature was ≥ 666 °C, the equilibrium H2 + CO curves showed coincidence and consistency.
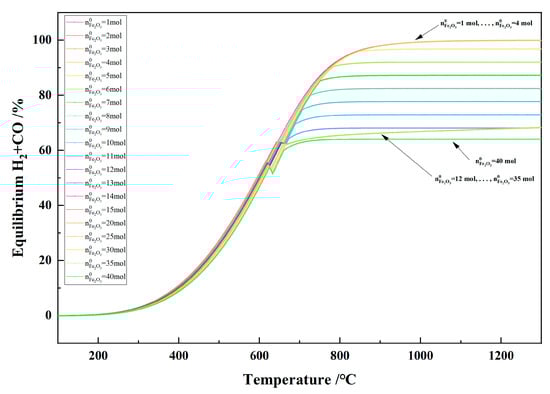
Figure 22.
The effect of the temperature on the equilibrium of H2 + CO2 in the 1 kg of pine sawdust and iron oxide reduction system at 100–1300 °C and 101,325 Pa.
Figure 23 shows the relationship between the temperature and the total gas yield in the 1 kg of pine sawdust and iron oxide reduction system at 100–1300 °C and 101,325 Pa. With the temperature increasing, the total gas yield increased significantly and reached the maximum. When the initial amount of Fe2O3 is ≥5 mol and there is no carbon present in the system, the maximum gas production of the system is the same, namely 1.407 Nm3. When the initial amount of Fe2O3 is less than 5 mol, the maximum gas production of the system increases with the increase in the initial amount of Fe2O3. When the initial amount of Fe2O3 is less than 5 mol, the total gas production of the system increases the maximum at a temperature ≥ 950 °C and the maximum total gas production increases with the increase in the initial amount of Fe2O3. The increase in maximum total gas production did not result in any change in gas concentration, as evidenced by the overlap of the curves of the initial Fe2O3 amount from 1 to 4 mol in the 950–1300 °C range in Figure 20, Figure 21 and Figure 22.
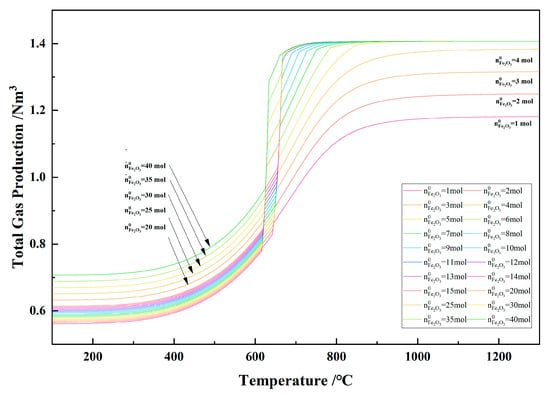
Figure 23.
The effect of the temperature on the total gas yield in the 1 kg of pine sawdust and iron oxide reduction system at 100–1300 °C and 101,325 Pa.
CO/(CO + CO2) and H2/(H2 + H2O) directly affect the maximum yield of metallic iron that biomass can reduce to obtain. When the initial Fe2O3 amount was 12–35 mol and the temperature was ≥ 666 °C, the iron product was in the Fe0.947O–Fe coexistence stage, and the equilibrium curves of CO/(CO + CO2), H2/(H2 + H2O) showed coincidence and consistency, which is independent of biomass type and the Fe2O3 initial amount. Combining Figure 8, Figure 9, Figure 20 and Figure 21, the CO/(CO + CO2)/% and H2/(H2 + H2O)/% with the maximum iron production in the biomass and Fe2O3 system are shown in Table 5. These data are applicable to temperature conditions where there is no solid carbonaceous substances (such as solid carbon and Fe3C) present in various biomasses and Fe2O3 reduction systems.
Table 5.
The equilibrium CO/(CO + CO2) and H2/(H2 + H2O) with the maximum iron production in the biomass and Fe2O3 system at 101,325 Pa.
Based on Table 1, Formula (16), and Table 5, the maximum amount of Fe2O3 that can be reduced by 10 types of biomasses was calculated and is shown in Table 6. As the temperature increases, the maximum amount of reduced Fe2O3 showed a decreasing trend. The maximum amount of reduced Fe2O3 varied greatly under the same temperature conditions.
Table 6.
The maximum amount of Fe2O3 that can be reduced by 10 types of biomasses.
3.2.4. Heat Enthalpy Relationship
Figure 24 shows the relationship between the temperature and the heat consumption of biomass gasification in the 1 kg of pine sawdust and iron oxide reduction system at 100–1300 °C and 101,325 Pa. The heat consumption of the biomass gasification was a negative value and endothermic. With the temperature increasing, the heat consumption of biomass gasification fluctuated sharply below the carbon conversion temperature and was relatively small above the carbon conversion temperature. When the initial Fe2O3 amount increased from 1 to 11 mol, the absolute value of the heat consumption of biomass gasification increased. When the initial Fe2O3 amount was 12–35 mol and the temperature was ≥666 °C, the heat consumption of biomass gasification curves showed coincidence and consistency.
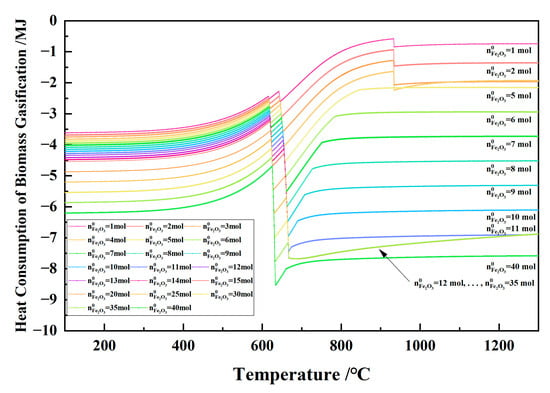
Figure 24.
The effect of the temperature on the heat consumption of biomass gasification in the 1 kg of pine sawdust and iron oxide reduction system at 100–1300 °C and 101,325 Pa.
Figure 25 shows the relationship between the temperature and the heat consumption of iron oxides reduction in the 1 kg of pine sawdust and iron oxide reduction system at 100–1300 °C and 101,325 Pa. With the temperature increasing, the heat consumption of iron oxides reduction fluctuated sharply within the narrow temperature range of 620–718 °C, and was relatively small in other temperature ranges. When the initial Fe2O3 amount increased from 1 to 40 mol, the absolute value of the heat consumption of iron oxides reduction increased at a certain temperature. When the initial Fe2O3 amount was 12–35 mol and the temperature was ≥666 °C, the heat consumption of iron oxides reduction curves showed a decreasing trend.
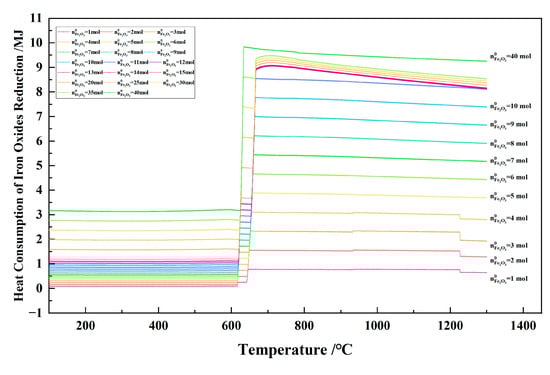
Figure 25.
The effect of the temperature on the heat consumption of iron oxides reduction in the 1 kg of pine sawdust and iron oxide reduction system at 100–1300 °C and 101,325 Pa.
Figure 26 shows the relationship between the temperature and the system energy consumption in the 1 kg of pine sawdust and iron oxide reduction system at 100–1300 °C and 101,325 Pa. With the temperature increasing, the curves of the system heat consumption approximated an S shape. When the initial Fe2O3 amount was 1–4 mol, the system heat consumption dropped sharply at 900 °C and 1227 °C. The system heat consumption exhibited a certain degree of parallelism and increased with the increase in the amount of iron oxide from 4 mol to 40 mol.
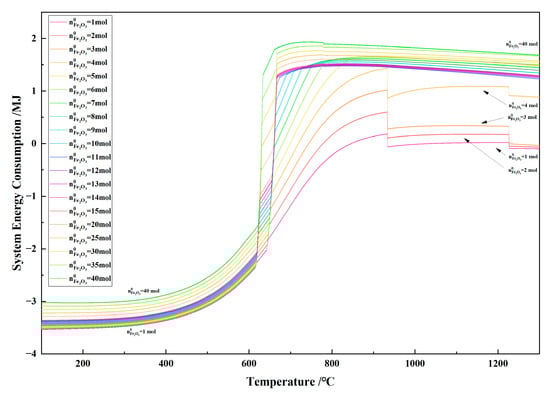
Figure 26.
The effect of the temperature on the system energy consumption in the 1 kg of pine sawdust and iron oxide reduction system at 100–1300 °C and 101,325 Pa.
Figure 27 shows the relationship between the temperature and system energy consumption per ton of metallic Fe in the 1 kg of pine sawdust and iron oxide reduction system at 670–1300 °C and 101,325 Pa. With the temperature increasing, the system energy consumption per ton of metallic Fe increased quickly and decreased slowly as the initial Fe2O3 amount was 5–10 mol, and changed slowly as the initial Fe2O3 amount was 11–25 mol. When the temperature was 800 °C, the minimum system energy consumption per ton of metallic Fe was 1.16 GJ/tFe, and the Fe2O3 initial amount was 12 mol with the metallic Fe amount 22.70 mol. When the temperature was 900 °C, the minimum system energy consumption per ton of metallic Fe was 1.18 GJ/tFe, and the Fe2O3 initial amount was 12 mol with the metallic Fe amount 22.27 mol.
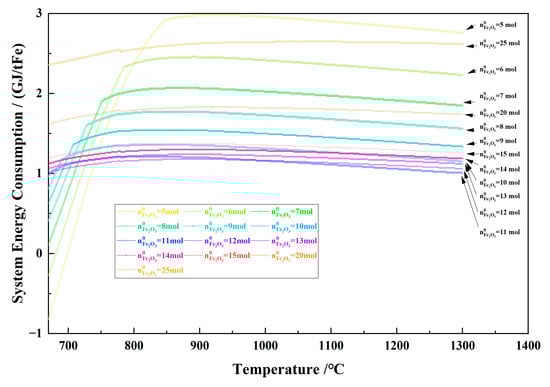
Figure 27.
The effect of the temperature on the system energy consumption per ton of metallic Fe in the 1 kg of pine sawdust and iron oxide reduction system at 670–1300 °C and 101,325 Pa.
3.2.5. Brief Summary and Discussion
For the 1 kg of pine sawdust and iron oxide reduction system at 100–1300 °C and 101,325 Pa, some interesting findings were as follows:
- When there was sufficient Fe2O3 and an appropriate temperature in the system, solid carbon could not be generated;
- The metallization rate of iron reached its maximum value within the temperature range of 640 °C to 670 °C, but solid carbon still existed in the system for the Fe2O3 initial amount between 5 and 11 mol. As the temperature increased, the metallization rate remained unchanged with the Fe2O3 initial amount between 5 and 11 mol, and this decreased with the Fe2O3 initial amount between 12 and 35 mol;
- When the temperature was above the carbon conversion temperature, the total gas production and H2 + CO concentration in the system remained unchanged, while H2/(H2 + H2O) showed a decreasing trend, and CO/(CO + CO2) showed an increasing trend, and the gas as a whole exhibited property similar to CO;
- The gasification energy consumption is manifested as an exothermic reaction, while reduction energy consumption is manifested as an endothermic reaction. As the temperature increases, the system energy consumption shifts from heat release in the low-temperature stage to heat absorption in the high-temperature stage;
- When the Fe2O3 initial amount is 12 mol, the maximum equilibrium state amount of metallic iron was 23.05 mol at 718 °C, and the minimum system energy consumption per ton of metallic Fe was 1.16 GJ/tFe at 800 °C and 1.18 GJ/tFe at 900 °C.
4. Discussion
The thermodynamic equilibrium state and energy consumption of the chemical reaction between the biomass and iron oxide reduction system are analyzed in this paper, which explores the mechanism and action of biomass as a reducing agent in ironmaking due to its carbon, hydrogen, and oxygen characteristics. There are significant differences in the performance of different biomasses in terms of metal iron production and energy consumption. When multiple types of biomasses are used as iron smelting reducing agents, the diversity of biomass will bring many uncertainties to the production of metallic iron, such as batching, heating, gas concentration, etc., which is not conducive to the stability and continuity of large-scale direct reduction iron production.
When this paper is put into practical application, the heat required for biomass and iron ore to be heated from the initial temperature to the reduction temperature should also be considered. In terms of the energy consumption of high-temperature reduction, the heat consumption of raw material heating is much greater than that of ironmaking chemical reactions [15]. In terms of actual production, factors such as non-ideal conditions, dynamic constraints, and external disturbances should be taken seriously.
These differences in reduction processes and energy consumption require careful consideration in the selection and utilization of biomass resources. It is necessary to develop strategies to match the appropriate biomass type with specific ironmaking requirements and to overcome the technical and economic hurdles associated with these variations.
It is recommended to gasify biomass and convert it into reduction gas with high H2 + CO concentration, which was convenient and controllable. Although fluctuations in gas composition also have an impact on reduction ironmaking, it is hoped that these fluctuations can be suppressed within a smaller range. The process selection of gasification before reduction can weaken the influence of biomass diversity on the smooth operation of large-scale ironmaking production.
5. Conclusions
In order to answer questions about the composition and energy consumption changes in biomass reduction ironmaking, the effects of factors such as biomass type, temperature, the Fe2O3 initial amount on the composition of system components, the amount of equilibrium substances, gas concentration, and energy consumption are calculated and discussed in detail. In conclusion, some findings were as follows:
- The Fe2O3 initial amount has a decisive impact on the system composition. If the Fe2O3 initial amount is too high, it will increase the oxidation atmosphere of the system and reduce the production of metallic iron;
- The maximum reduction ironmaking capacity of biomass is determined by its carbon, hydrogen, oxygen element content and temperature, and the Fe2O3 initial amount. The thermodynamic equilibrium of CO/(CO + CO2) and H2/(H2 + H2O) in the Fe0.947O–Fe coexistence stage does not vary with the ratio of raw materials, but changes with temperature;
- The biomass type has a significant impact on the system energy consumption of ironmaking. In the Fe0.947O–Fe coexistence stage, the production of metallic iron increases and the system energy consumption decreases.
Author Contributions
Conceptualization, G.S. and L.W.; methodology, G.S., C.G. and H.M.; software, G.S., C.G. and H.M.; validation, G.S. and L.W.; formal analysis, H.M. and W.X.; investigation, H.M. and W.X.; resources, H.M. and W.X.; data curation, G.S., C.G. and H.M.; writing—original draft preparation, G.S., C.G. and L.W.; writing—review and editing, G.S., H.M. and W.X.; visualization, G.S., H.M. and W.X.; supervision, C.G. All authors have read and agreed to the published version of the manuscript.
Funding
This research was funded by Deep Earth Probe and Mineral Resources Exploration—National Science and Technology Major Project of China, grant number 2024ZD1004001.
Data Availability Statement
The data presented in this study are available on request from the corresponding author. The data are not publicly available due to privacy and ethical restrictions.
Conflicts of Interest
Authors Guanyong Sun, Chihao Guo, Hui Ma, Wenlong Xu and Le Wang were employed by the company BGRIMM Technology Group. The remaining authors declare that the research was conducted in the absence of any commercial or financial relationships that could be construed as a potential conflict of interest.
References
- Norgate, T.; Haque, N.; Somerville, M.; Jahanshahi, S. Biomass as a Source of Renewable Carbon for Iron and Steelmaking. ISIJ Int. 2012, 52, 1472–1481. [Google Scholar] [CrossRef]
- Huang, X.A.; Ng, K.W.; Giroux, L. Grindability of biocarbon and coal blends in rolling mill. Int. J. Coal Prep. Util. 2022, 42, 1651–1663. [Google Scholar] [CrossRef]
- Wang, S.J.; Chai, Y.F.; Wang, Y.C.; Luo, G.P.; An, S.L. Review on the Application and Development of Biochar in Ironmaking Production. Metals 2023, 13, 1844. [Google Scholar] [CrossRef]
- Abhi, T.D.; MacDermid-Watts, K.; Salaudeen, S.A.; Hayder, A.; Ng, K.W.; Todoschuk, T.; Dutta, A. Challenges and Opportunities of Agricultural Biomass as a Replacement for PCI Coal in the Ironmaking Blast Furnace: A Review. J. Sustain. Metall. 2023, 9, 927–949. [Google Scholar] [CrossRef]
- Fruehan, R.J. Research on Sustainable Steelmaking. Metall. Mater. Trans. B 2009, 40, 123–133. [Google Scholar] [CrossRef]
- Zhang, J.L.; Fu, H.Y.; Liu, Y.X.; Dang, H.; Ye, L.; Conejio, A.N.; Xu, R.S. Review on biomass metallurgy: Pretreatment technology, metallurgical mechanism and process design. Int. J. Miner. Metall. Mater. 2022, 29, 1133–1149. [Google Scholar] [CrossRef]
- Chen, Y.; Fang, Y.; Feng, W.M.; Zhang, Y.F.; Zhao, G.X. How to minimise the carbon emission of steel building products from a cradle-to-site perspective: A systematic review of recent global research. J. Clean. Prod. 2022, 368, 133156. [Google Scholar] [CrossRef]
- Firsbach, F.; Senk, D.; Babich, A. Multi-Step Recycling of BF Slag Heat via Biomass for CO2 Mitigation. Minerals 2022, 12, 136. [Google Scholar] [CrossRef]
- Tang, H.Q.; Liu, Z.; Guo, Z.C. Numerical Simulation of Charging Biochar Composite Briquette to Blast Furnace. ISIJ Int. 2022, 62, 642–651. [Google Scholar] [CrossRef]
- White, W.B.; Johnson, S.M.; Dantzig, G.B. Chemical Equilibrium in Complex Mixtures. J. Chem. Phys. 1958, 28, 751–755. [Google Scholar] [CrossRef]
- Sun, G.Y.; Li, B.; Guo, H.J.; Yang, W.S.; Li, S.Y.; Guo, J. Thermodynamic Study on Reduction of Iron Oxides by H2 + CO + CH4 + N2 Mixture at 900 °C. Energies 2020, 13, 5053. [Google Scholar] [CrossRef]
- Guo, H.J. Physicochemical principles of hydrogen metallurgy in blast furnace. J. Iron Steel Res. Int. 2024, 31, 46–63. [Google Scholar] [CrossRef]
- Mousa, E.; Wang, C.; Riesbeck, J.; Larsson, M. Biomass applications in iron and steel industry: An overview of challenges and opportunities. Renew. Sustain. Energ. Rev. 2016, 65, 1247–1266. [Google Scholar] [CrossRef]
- Holappa, L. A General Vision for Reduction of Energy Consumption and CO2 Emissions from the Steel Industry. Metals 2020, 10, 1117. [Google Scholar] [CrossRef]
- Sun, G.Y.; Li, B.; Yang, W.S.; Guo, J.; Guo, H.J. Analysis of Energy Consumption of the Reduction of Fe2O3 by Hydrogen and Carbon Monoxide Mixtures. Energies 2020, 13, 1986. [Google Scholar] [CrossRef]
- Lin, Z.; Lin, M.; Zhende, Z.; Fuxing, C.; Yan, S.; Hongchao, Y. Thermodynamic Study of Energy Consumption and Carbon Dioxide Emission in Ironmaking Process of the Reduction of Iron Oxides by Carbon. J. Therm. Sci. Technol. 2021, 20, 178–187. (In Chinese) [Google Scholar] [CrossRef]
- Wang, R.; Jiang, L.; Wang, Y.; Roskilly, A.P.; Font-Palma, C.; Skoulou, V. Woody biomass waste derivatives in decarbonised blast furnace ironmaking process. Renew. Sustain. Energ. Rev. 2024, 199, 114465. [Google Scholar] [CrossRef]
- Kim, G.E.; Oh, H.S.; Lee, J.H.; Park, Y.J.; Lee, Y.B.; Kwon, J.H.; Kim, B.C. Development of Alternative Reductant using Biomass for Reducing CO2 in Ironmaking Process. Korean J. Met. Mater. 2023, 61, 218–230. [Google Scholar] [CrossRef]
- Wang, Q.; Wang, E.L. Numerical investigation of the influence of particle shape, pretreatment temperature, and coal blending on biochar combustion in a blast furnace. Fuel 2022, 313, 123016. [Google Scholar] [CrossRef]
- Cheng, W.S.; Wang, Y.J.; Wei, R.F.; Li, J.X.; Long, H.M. Reduction characteristics and mechanism of mechanically activated iron ore powder by lignin. Fuel 2025, 380, 133208. [Google Scholar] [CrossRef]
- Liping, Z.; Biao, Z.; Xin, W.; Sikan, W. Study on Gasification Performance of Different Kinds of Biomass With Microwave Heating. Acta Energ. Sol. Sin. 2021, 42, 394–399. (In Chinese) [Google Scholar] [CrossRef]
Disclaimer/Publisher’s Note: The statements, opinions and data contained in all publications are solely those of the individual author(s) and contributor(s) and not of MDPI and/or the editor(s). MDPI and/or the editor(s) disclaim responsibility for any injury to people or property resulting from any ideas, methods, instructions or products referred to in the content. |
© 2025 by the authors. Licensee MDPI, Basel, Switzerland. This article is an open access article distributed under the terms and conditions of the Creative Commons Attribution (CC BY) license (https://creativecommons.org/licenses/by/4.0/).