Abstract
Fatigue crack growth tests are conducted to assess the efficacy of the stop-hole crack repair method. This straightforward and widely adopted technique involves drilling a hole at the crack tip and subsequently enlarging it using a pin inserted into the hole. A fracture mechanics-based model is proposed to estimate the extension of fatigue life achieved through the implementation of the stop-hole technique. The model’s predictions are validated using data obtained from fatigue crack growth tests conducted on both unrepaired and repaired M(T) specimens, following the guidelines outlined in the ASTM E647 standard. The error of the fracture mechanics-based model was 1.4% in comparison with the fatigue tests.
1. Introduction
Nowadays, fatigue remains a prevalent cause of failure in mechanical structures and components. This is primarily due to the presence of practically undetectable local stress raisers, such as pores, scratches, cavities, and voids that are inherent within mechanical components, and can initiate and propagate fatigue cracks. Since in practice many components cannot be replaced as soon as the cracks are discovered, repair procedures are widely used to extend their residual lives, either by retarding the growth of fatigue cracks, or else by returning the fatigue process to the crack initiation phase. Many crack repair techniques are available, and some of them are relatively simple to implement, such as bonded composite patches [1,2,3], stop-holes (SH) [4,5,6,7,8,9,10,11], and grinding hammer peening [12,13,14]. However, other repair techniques are not so simple, like pulsed electron beam irradiation, metal crack stitching, vee-and-weld, and laser additive crack cladding [15,16,17,18,19,20,21,22,23,24,25,26,27,28]. The choice of repair method depends on various technical and practical factors, with material properties and modelling issues posing significant challenges in the selection process. Additionally, human factors play a crucial role in the successful implementation of repair techniques, as the technical and manual skills of the technicians greatly influence the outcomes. As a result, trial and error-based approaches are still prevalent for crack repairs, rather than optimized methodologies. Furthermore, simple fracture mechanics models for estimating the effects of repairing cracked components are either unavailable or underutilized in practical applications. However, these models are essential for assessing the outcomes of crack repair procedures.
The stop-hole (SH) technique is a widely adopted crack repair method due to its ease of implementation, which does not require specialized technical skills. Ghfiri et al. [29] suggest that expanding a hole at the notch root can result in a threefold increase in the number of cycles required to initiate a new crack compared to an unexpanded hole. Domazet et al. [30] reported life increments of 8.2% for non-expanded holes and 163% for expanded holes. The enhanced residual fatigue life obtained through the expanded SH technique can be attributed to several factors. Firstly, the introduction of compressive residual stresses near the notch tip during hole expansion retards crack initiation and propagation. Additionally, plastic deformation-induced changes in the microstructure of steels, such as deformation-induced martensite transformation and alterations in dislocation density, can influence the fatigue life of the components [31,32]. However, the level of success achieved with the (expanded and unexpanded) SH technique varies significantly, ranging from a modest 6% life extension [5] to a promising total fatigue life of around cycles [19]. Several factors impact the effectiveness of the SH technique, including the crack length, material microstructure, stop-hole diameter, pin diameter and material properties for insertion into the SH, and material properties of the cracked component. While some researchers have identified ideal parameters for significantly extending the fatigue life of cracked components using the SH repair, certain parameters are beyond the control of technicians, such as the material properties of the cracked component, crack size, and the loading mode (controlled-force or controlled-) after the repair. Consequently, in many real-world scenarios, the use of ideal parameters does not guarantee successful outcomes when applying the (expanded or unexpanded) SH technique. Therefore, accurate models that predict the success level of SH repairs are essential for assessing the suitability of the technique prior to implementation.
Various models have been proposed by different researchers to estimate the extension of fatigue life in repaired cracked components using the SH method. Typically, these fatigue life approaches are based on strain–life () models, which excel at predicting crack initiation [8,19], but are not as useful for crack propagation prediction. Therefore, ε − N models are accurate when the crack reinitiation process requires a large number of load cycles, while the crack propagation stage is relatively short compared to the number of cycles needed for crack restart. Wu et al. [19] established that classical approaches can accurately predict residual fatigue lives following SH repairs. However, when the crack reinitiation process is short (e.g., due to a sharp notch with a high stress concentration factor), such as when the reinitiation stage spans only a few cycles, models exhibit significant inaccuracies [19]. Thus, a fatigue crack growth model is required to obtain accurate life predictions. Fracture mechanics-based models have been properly used for crack propagation analysis and prediction of mechanical behavior [33,34,35,36,37,38,39,40,41,42].
In this study, the SH method is further modified by expanding a drilled stop-hole and introducing an interfering pin that remains in place. To predict fatigue life in repaired components, a fracture mechanics-based model is proposed to account for the very short crack reinitiation process observed during fatigue tests on the repaired specimens. The proposed model, validated through experiments, aims to assess the effects of the expanded SH technique on the residual fatigue lives of cracked plates made from AISI 1045 steel.
2. Materials and Fatigue Crack Growth Tests
2.1. Materials
The material selected for conducting fatigue crack growth (FCG) tests is an AISI 1045 steel annealed at 700 °C for 30 min. Its chemical composition is given in wt.% (C: 0.43–0.50; Mn: 0.60–0.90; Si: 0.15–0.35; P: 0.04; and S: 0.05), and its measured basic mechanical properties are: yield strength MPa; ultimate strength MPa; Young modulus GPa; hardening modulus MPa; and elongation = 33%. The specimens for tensile and FCG tests are manufactured from the same material batch. The longitudinal axis of the specimens is oriented perpendicular to the mill marks to ensure consistent test conditions. For the expanded SH specimens, cylindrical pins are manufactured using the same steel.
2.2. Fatigue Crack Growth Tests
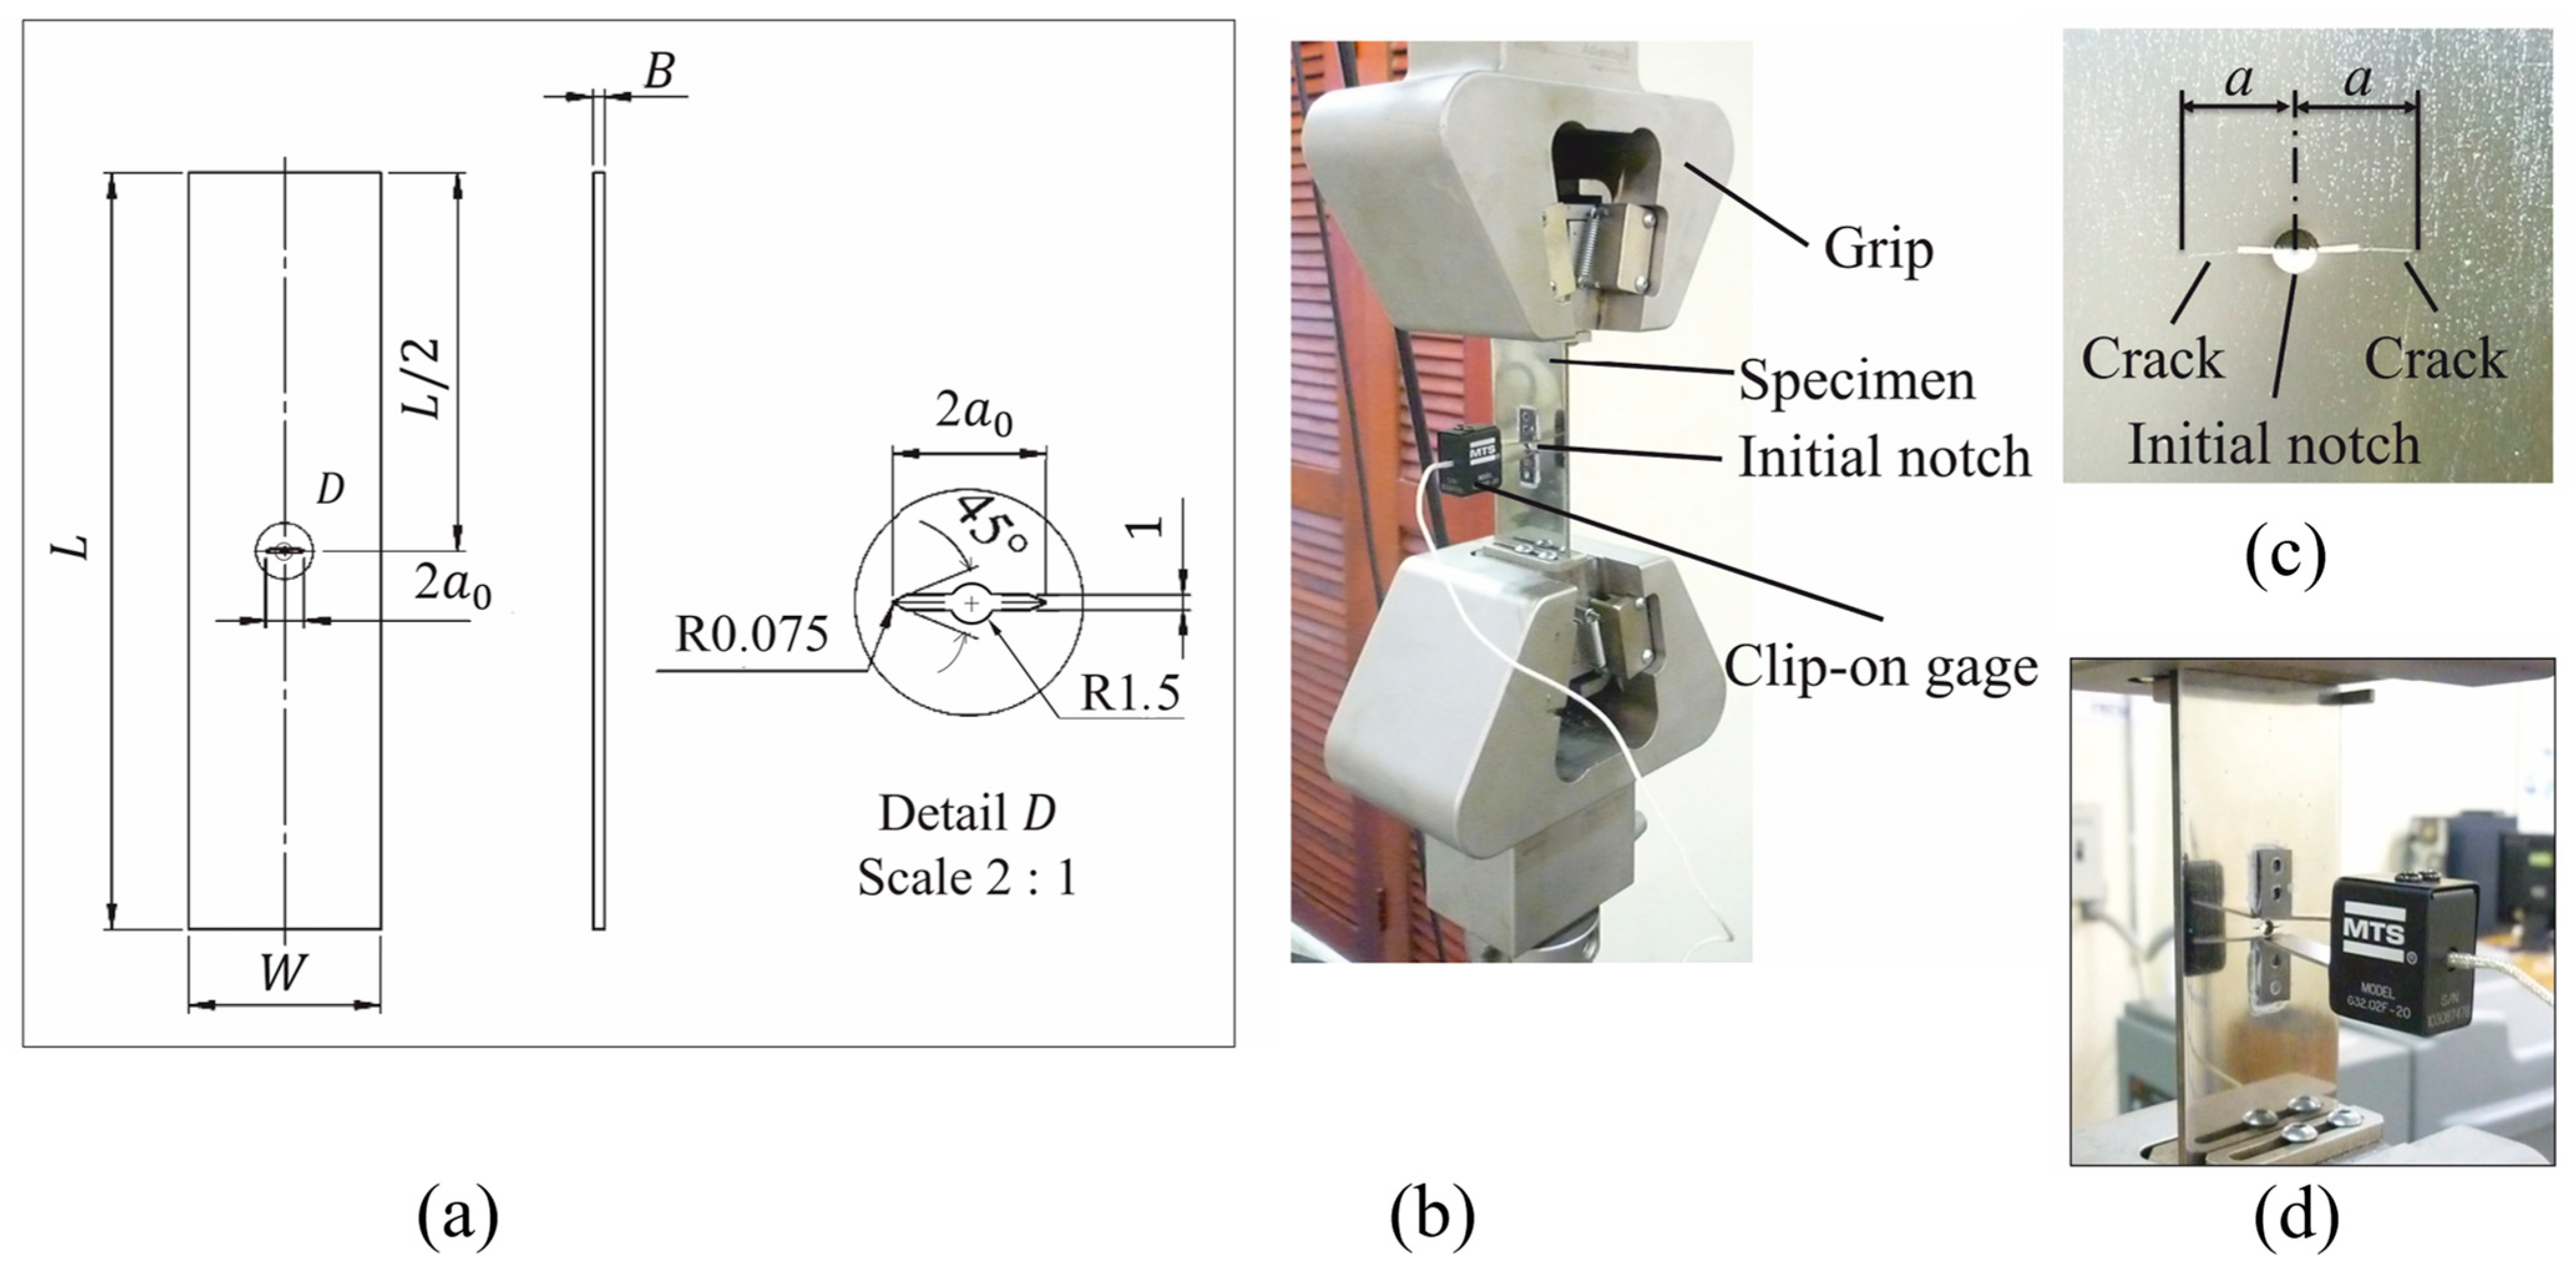
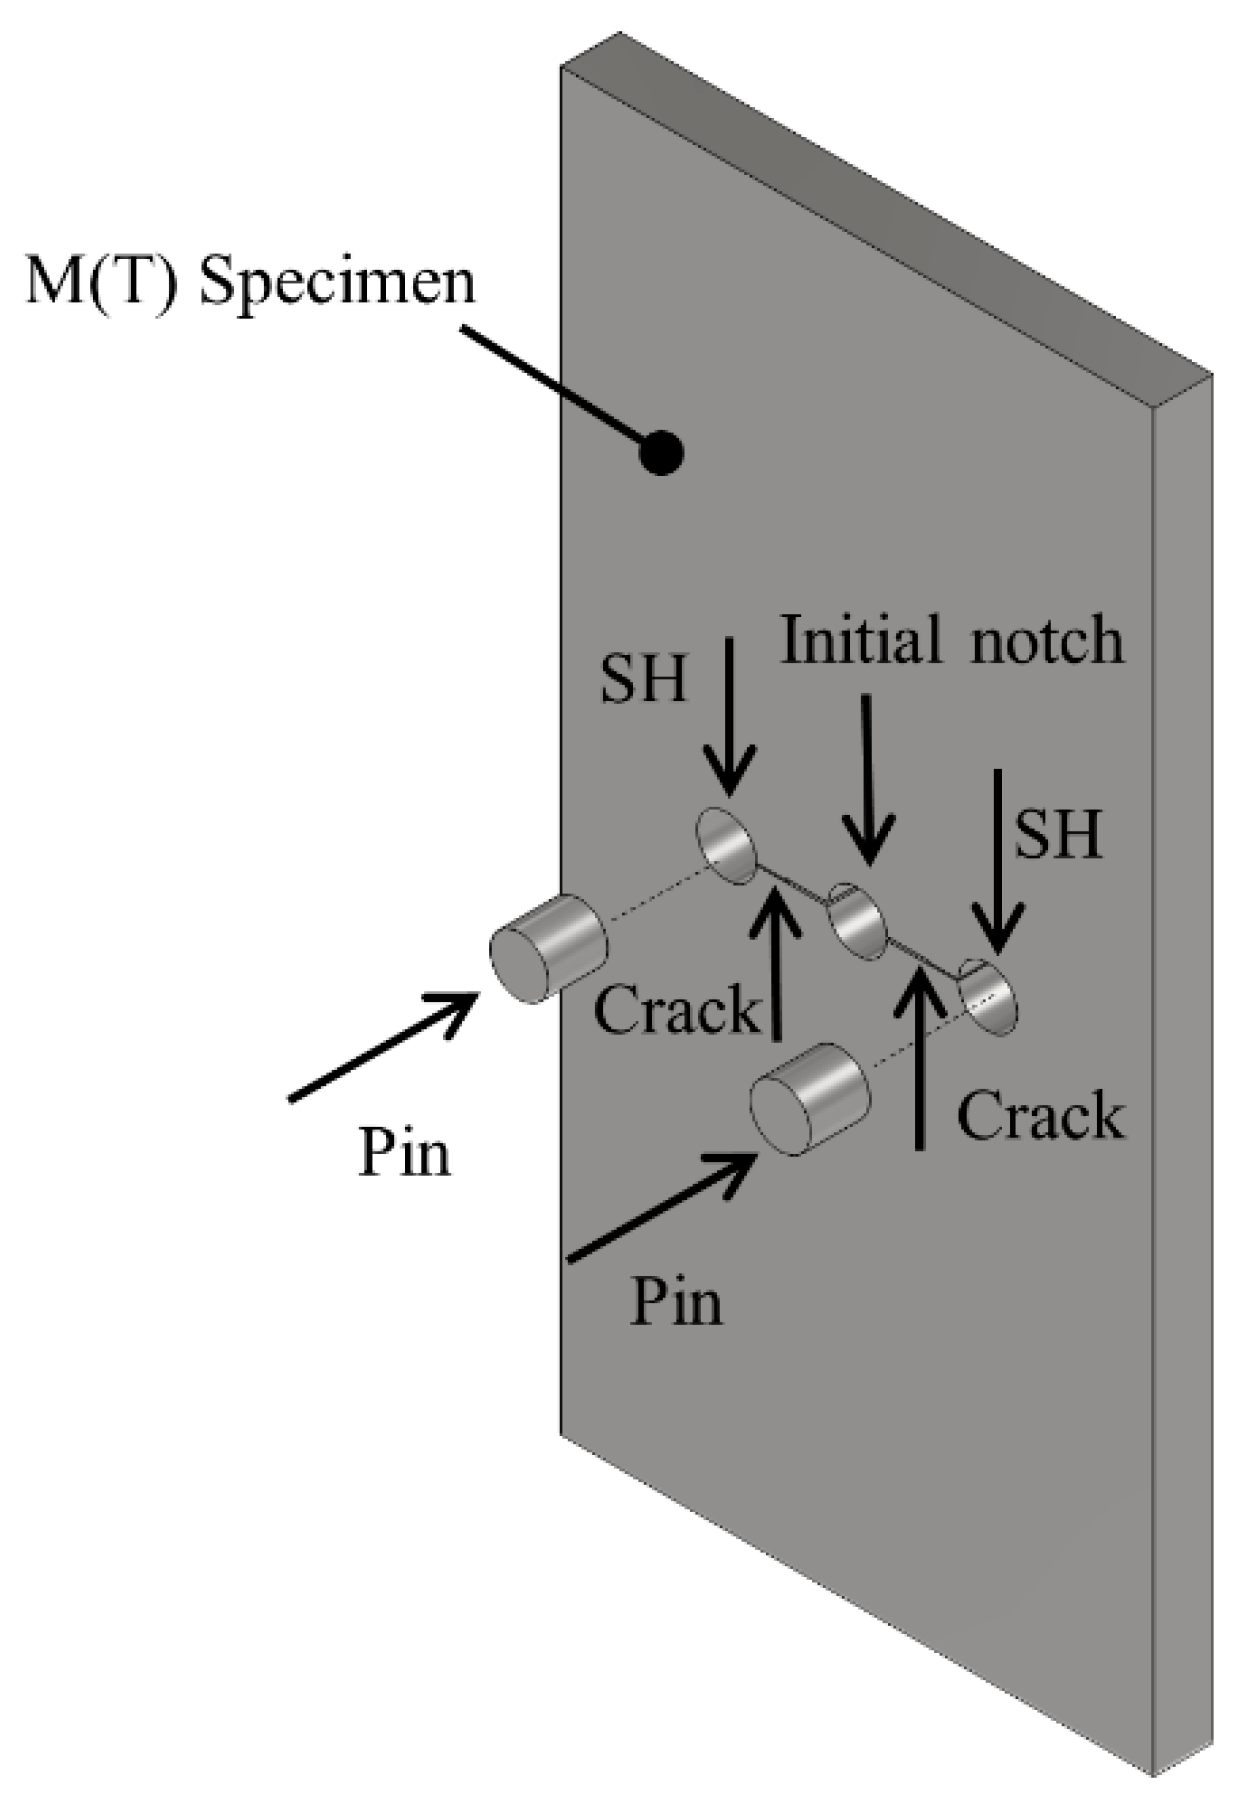
The FCG tests are conducted in accordance with the ASTM E647 standard [43]. Three M(T) specimens are tested to obtain the FCG rates for the base material (AISI 1045 steel). During the FCG tests, a maximum load ( of 25 kN) and a load ratio () of 0.1 are applied. The notched specimen geometry and dimensions are shown in Figure 1a, where the length () is , thickness () is 3 mm, and width () is . The initial notch length is , shaped using an electrical discharge machining to minimize the residual stress induced during the machining process. Additionally, three M(T) specimens are employed to implement the expanded SH technique. These repaired specimens are obtained from initially fatigued notched samples, where the crack length reaches a value of mm. The specimens are dismounted and repaired using the expanded SH technique. Once the cracked specimens are repaired, the fatigue tests are restarted until failure occurs.
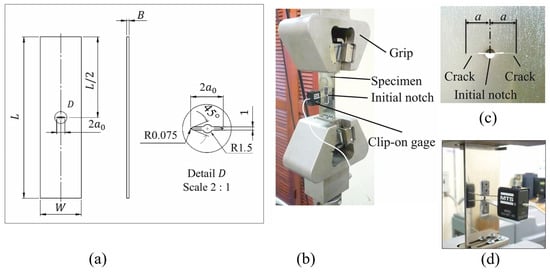
Figure 1.
(a) M(T) specimen dimensions (in mm), and testing configuration: (b) FCG test setup, (c) crack details, (d) clip-on gage setup.
For the fatigue tests, a MTS servo-hydraulic test system is utilized along with a 5 mm clip-on gauge (MTS 632.02F) to measure the crack size, as depicted in Figure 1b,d. The servo-hydraulic test system incorporates MTS software that calculates the crack size based on measurements of crack-mouth-opening displacement. The crack sizes estimated by the test system are further verified through direct optical measurements (Figure 1c).
SH Specimens
Traditional SH repair consists of drilling a hole at each crack front, usually centering the drill bit at the corresponding crack tip. In this study, the SH method is modified by inserting an interfering pin into the drilled holes. The diameter of the pin is slightly larger, by a few tenths of a millimeter, than the diameter of the hole. This size difference induces an overload effect, leading to plastic deformation in the material surrounding the root of the hole. For the SH specimens, the pins are machined to achieve an interference fit (I.F.) of 5.8%. The I.F. is computed as follows:
where and are the pin and stop-hole radii, respectively.
The expanded SH specimen is shown in Figure 2, prior to pin insertion. Circular stop holes with diameters of 3 mm are drilled meticulously at the crack tips of the initial M(T) samples (a manual drill is employed for this process). The bit is carefully centered at the respective crack tips of the initially cracked M(T) samples. Subsequently, pins with a diameter of 3.175 mm are carefully inserted into the holes using a hydraulic press. Then, the FCG test of the specimen with the inserted pins is restarted and the fatigue crack is allowed to grow until the specimen ultimately fractures. The total number of cycles endured until fracture is recorded.
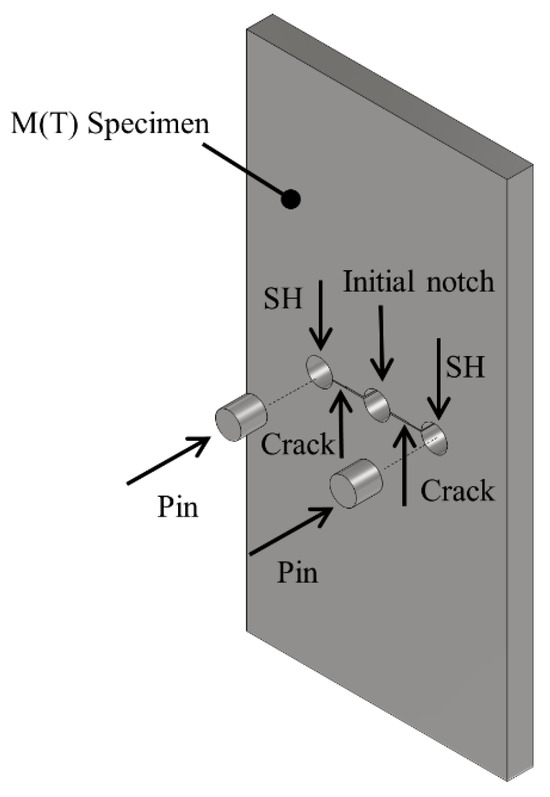
Figure 2.
Diagram of the expanded SH specimen.
3. Fracture Mechanics-Based Modelling for the Repair Technique
A fracture mechanics-based model is proposed in this work for the expanded modified SH technique. The model is based on linear elastic fracture mechanics (LEFM) principles. The following considerations are assumed:
- Fatigue cracks are considered center through-thickness cracks.
- Plastic zones are small enough to validate LEFM principles.
- Crack reinitiation process after drilling the SH is conservatively assumed to be very short and negligible.
- Fatigue cracks grow straight and symmetric from each SH.
- Environmental effects on FCG rates are negligible or accounted for by the measured data.
3.1. FCG Modelling for the Base Material
Paris’ equation [44] is widely used to estimate the FCG rates () in phase II, and it is employed in the current investigation to define the FCG model. The equation is expressed as follows:
where C and m are the Paris’ constant and exponent obtained from FCG tests. The stress intensity ranges, , are computed according to a suitable expression valid for M(T) specimens, specified in the ASTM E-647 standard as follows:
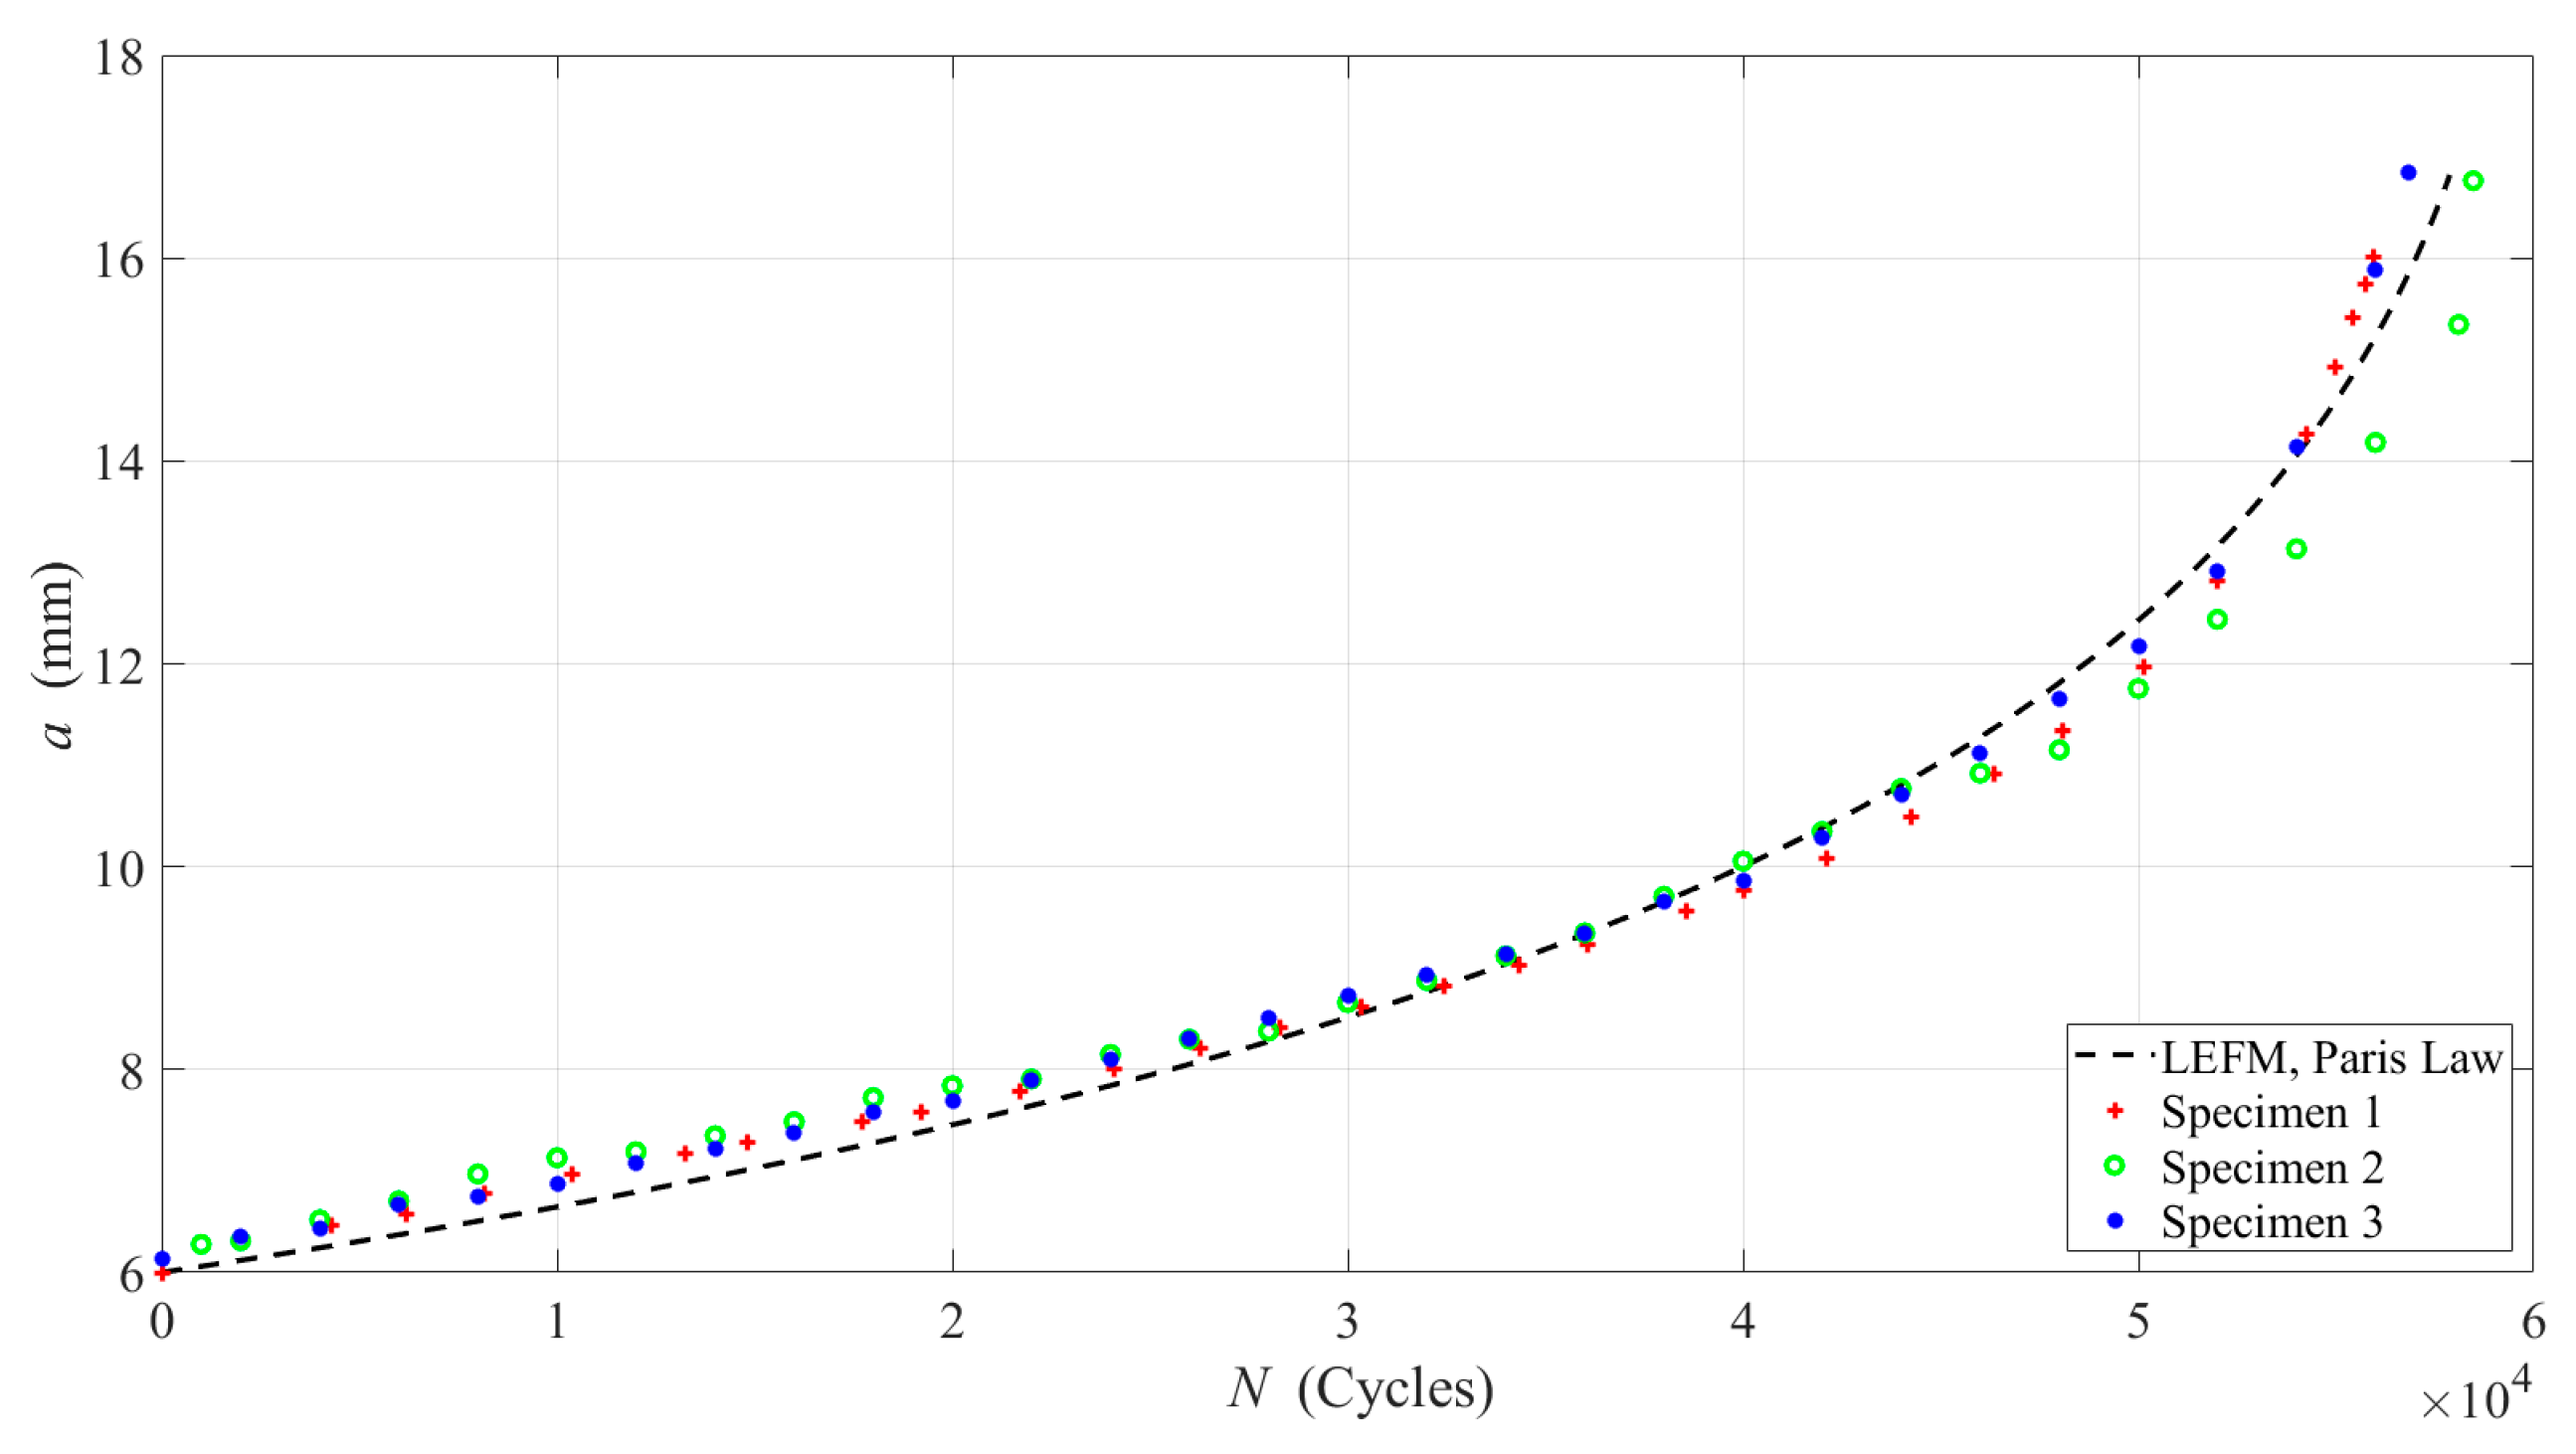
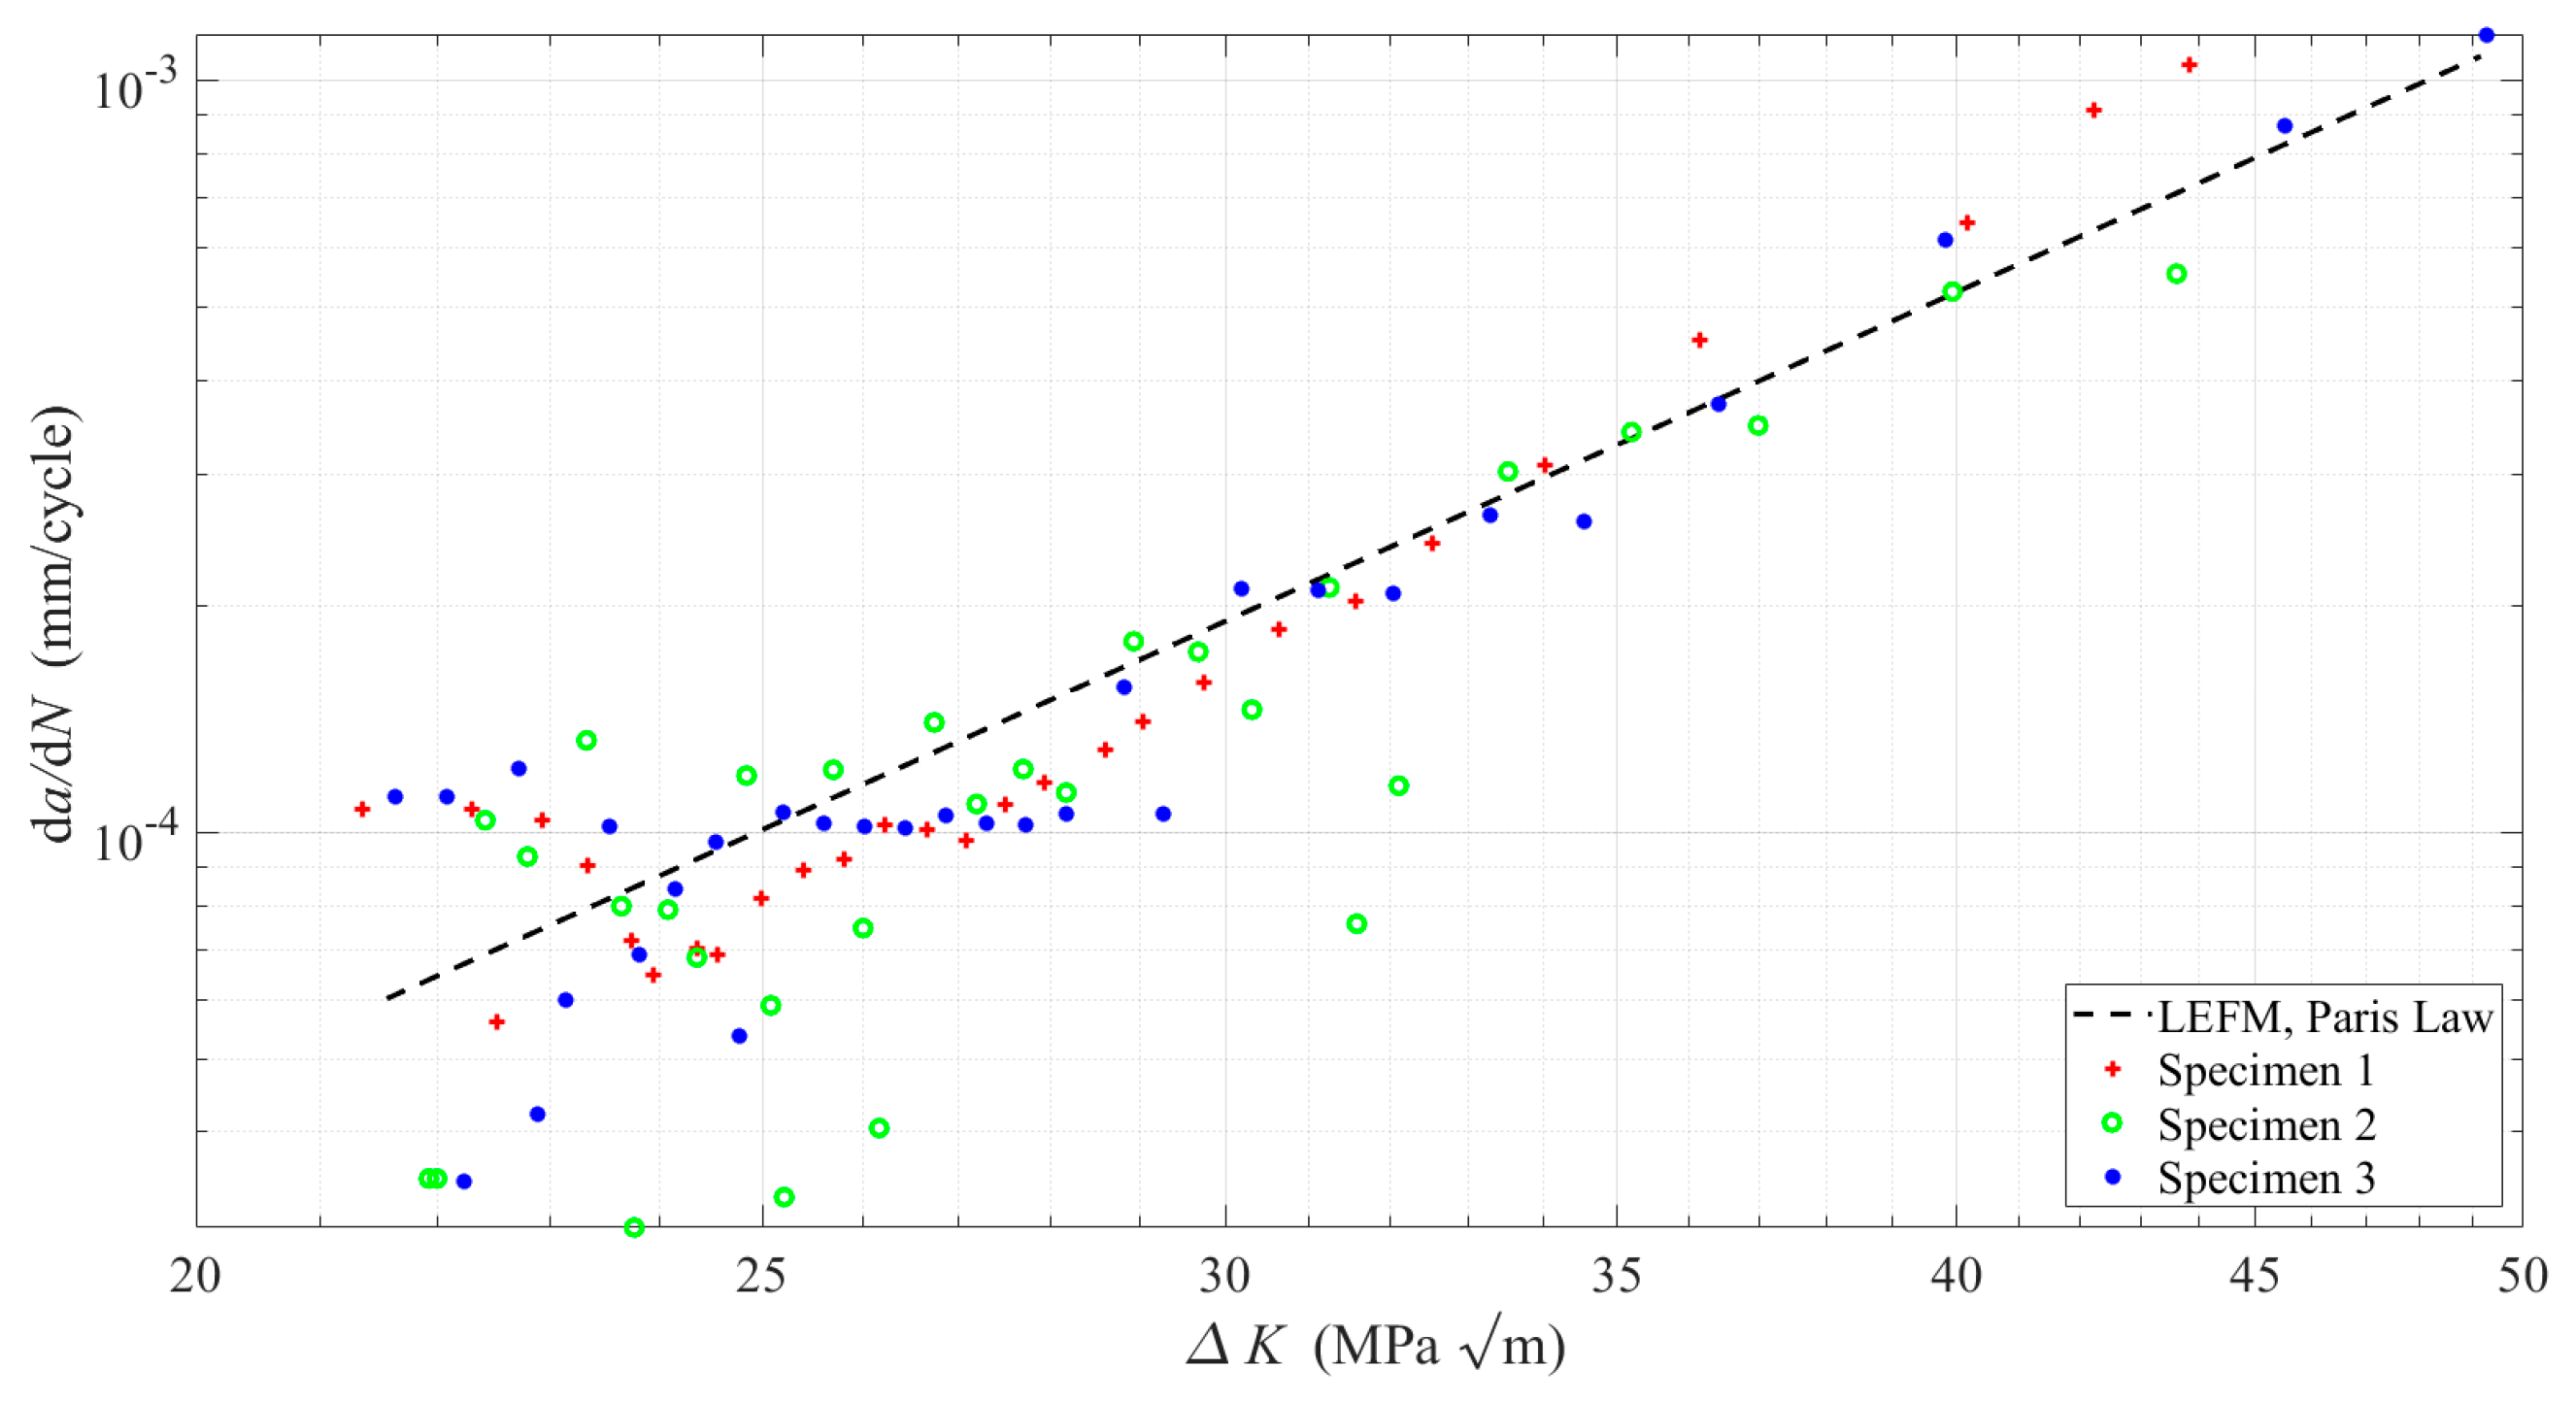
where the applied force range is for a stress ratio of . The crack length is estimated by integrating Equation (2), and it is plotted in Figure 3 along with the experimentally measured data. The FCG rates are computed using Equation (2) and plotted in Figure 4 with the results that are obtained by means of the FCG tests. The best fit for the Paris’ equation is achieved with and . These parameters yield the closest agreement between the model predictions and the experimental data.
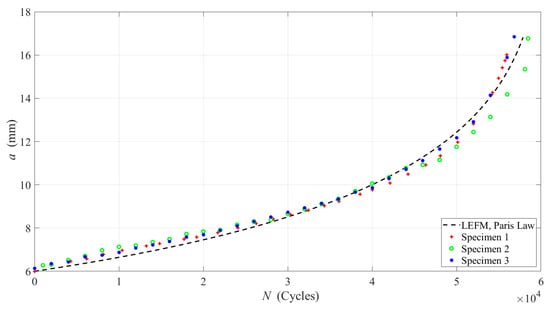
Figure 3.
Fatigue crack growth measurements at R = 0.1.
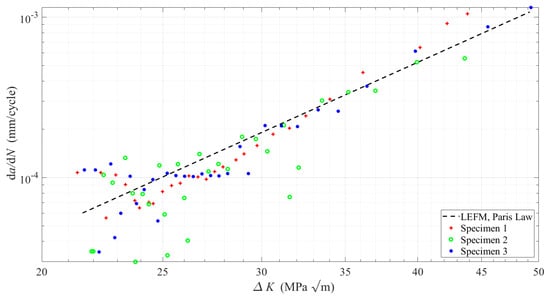
Figure 4.
Fatigue crack growth rates for AISI 1045 vs. stress intensity range at R = 0.1.
3.2. Fracture Mechanics-Based Model for the Expanded Modified SH Technique
Wheeler proposed fracture mechanics-based models for FCG predictions considering the plastic zone ahead of the crack tip [45]. In the present work, due to the rapid fatigue crack reinitiation process, which is observed during the fatigue tests, Wheeler’s approach for overload effects on FCG rates [46] is used to model the retardation effect caused by the pin inserted into the drilled SH, which is centered at the crack tip. Wheeler introduced a parameter, denoted as , to quantify the retardation effect due to a larger plastic zone induced by an overload, which is given by:
where is a data-fitting parameter, is the crack size increment, is the size of the induced plastic zone due to the overload, and is the local plastic zone at the crack tip. The exponent is obtained by means of the least-squares method using the results obtained from the FCG tests conducted on the SH specimens. Similar results are achieved in [47] for a similar material. The estimation of the yield radius, , can be accomplished using an equation derived by Irwin for the plane strain condition [48], given by the following expression:
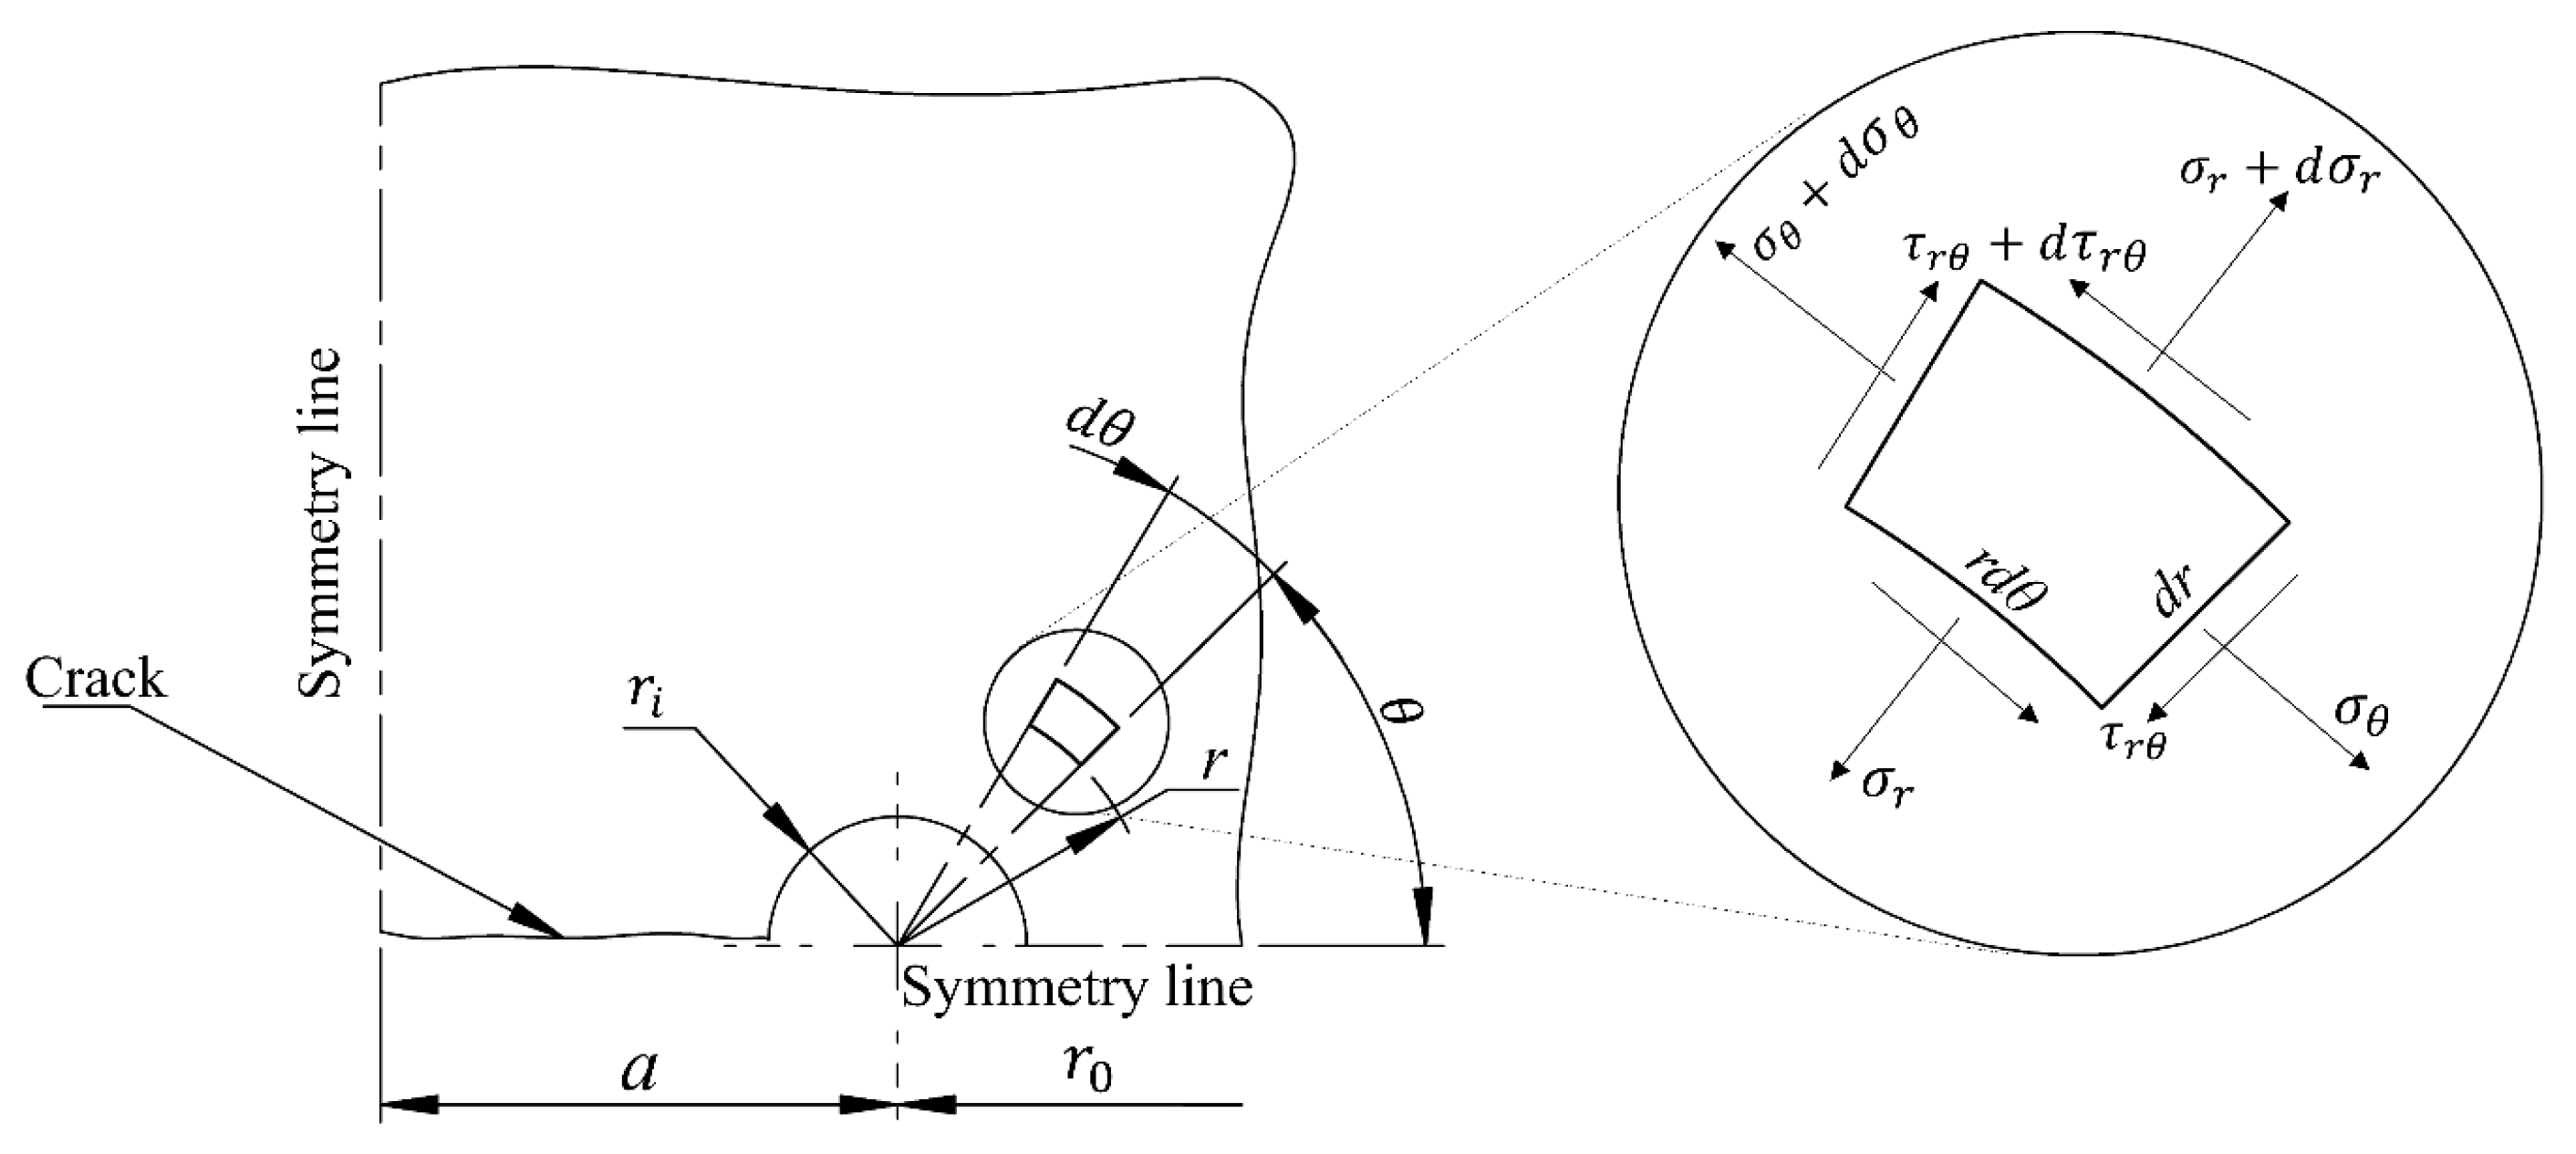
where is the yield strength and is the stress intensity factor in mode I. An expression to calculate for a plate with a drilled hole has been presented by Fett [49] as follows:
where is the notch radius, is the crack length measured from the notch root (as shown in Figure 5), and is the stress intensity factor without the effect of the drilled hole geometry. The reversed plastic zone is estimated replacing from Equation (6) into Equation (5) and then replacing by from Equation (3), giving:
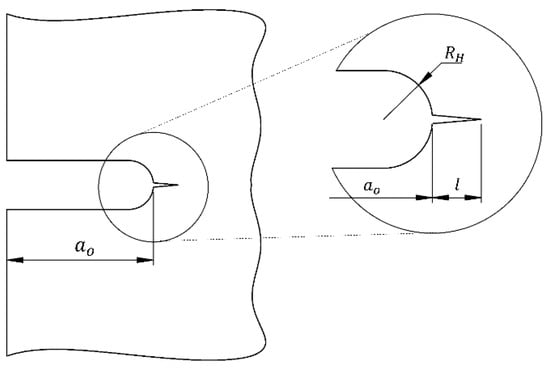
Figure 5.
Small crack growing from the root of a notch with radius (adapted from [49]).
The retardation effect estimated by remains while stays inside , therefore is computed via the replacement of with in Equation (4). In order to estimate , an elastic solution for the stress field of a plate with a hole and a radial stress applied on the hole’s surface is initially proposed (see Figure 6). The bi-harmonic equation is given in polar coordinates as follows:

Figure 6.
Infinite plate with an inserted pin with an interference fit.
The stress components for the bi-harmonic equation in polar coordinates are given by:
where is the radial stress, is the tangential stress, and is the corresponding shear stress. The following equation is proposed as an Airy stress function for the stress field in an infinite plate with a pin inserted into a circular hole with an interference fit:
Therefore, replacing Equation (10) into Equation (9) gives the stress field for this solution in terms of the constants , and as:
The constants , and in Equation (11) are determined by evaluating the boundary conditions of the infinite plate problem, which are schematized in Figure 6 and shown in Equation (12).
Considering is very small in comparison with the distance from the center of the pin to the edge of the specimen, , the boundary conditions of the plate are given as:
Substituting Equation (12) into Equation (11), the following constants are obtained:
and finally, replacing these constants (Equation (13)) into Equation (11) results in:
where and represent the tangential stresses at and , respectively, when . The contact pressure, denoted as , is the pressure exerted between the pin and the hole, and it is estimated based on an elastic–plastic model that considerers a bilinear material behavior. Thus, the contact pressure is given by [50]:
where is the hardening modulus. Equation (15) is valid when the material of both the plate and the pin are the same.
To determine , the finite element (FE) method is implemented using Ansys® [51]. The model incorporates a bilinear elastic behavior for the material and symmetric geometry conditions along the -axis, representing only half part of the plate (Figure 7). The lower part of the plate has movement restrictions in the axes to avoid free body-motion. The structural 3D SOLID185 element and the contact CONTA174 element from the ANSYS library [51] are employed. SOLID185 is a homogeneous tridimensional element formed by eight nodes and three degrees of freedom per node, and the CONTA174 is a contact element used for structural analysis which has the same geometric characteristics as the solid element face of the SOLID185 [51]. Two integration points are used along the thickness for the SOLID185 element. Contact elements are placed between the pin and hole surfaces to simulate the interference zone ( mm). The selective reduced integration method in the SOLID185 element is used to prevent the volumetric locking of nearly incompressible elements (it replaces volumetric strain at the Gauss integration point with the average volumetric strain of the elements) [51]. Different meshes are employed with special attention focused on the interference zone. The chosen mesh for presenting the results exhibits a negligible difference of only 0.76% compared to the previous mesh configuration. The maximum in-plane size of the element near the interference zone is 0.19 mm, with an aspect ratio of four relative to its thickness.
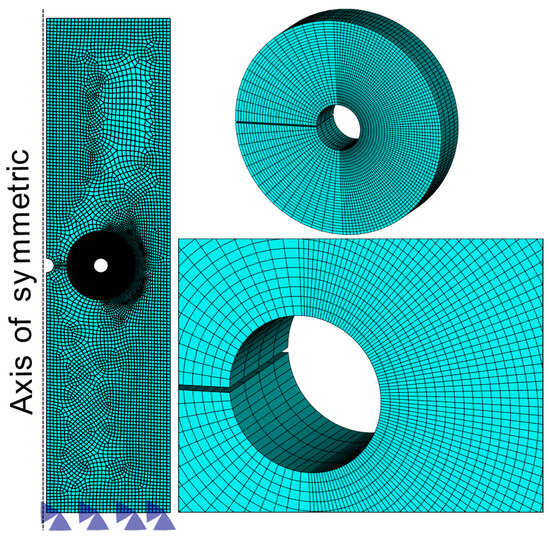
Figure 7.
Schematic representation of the finite element mesh.
A mesh with 46,240 elements and 59,111 nodes is employed with 14,400 elements and 18,755 nodes around the interference zone and the line along to for (see Figure 7) to accurately capture the size of the plastic zone , which occurs when the von Mises stress reach the yield stress . However, it is necessary to correct the obtained plastic zone for equilibrium considerations since the elastic stress above, , is neglected when is constrained by [46]. To compensate the loss of the stresses above , the plastic zone needs to be increased for [19], as pointed out by T. L Anderson [46]. This is written as is shown in Equation (16):
To determine the value of required in Equation (16), is captured from FEM analysis. is computed considering Equation (14) and the well-known von Mises stress in two-dimensional analysis:
thus, is determined by substituting Equation (14) into Equation (17), with the condition that , and using the mm obtained from the linear elastic FEM analysis. Then, the Newton–Raphson method is used to obtain the value of (solving Equation (17)). Once is estimated, is obtained from Equation (14), evaluating at . Finally, applying Equation (16), the corrected value of is obtained ( and are reported from the hole perimeter at and ).
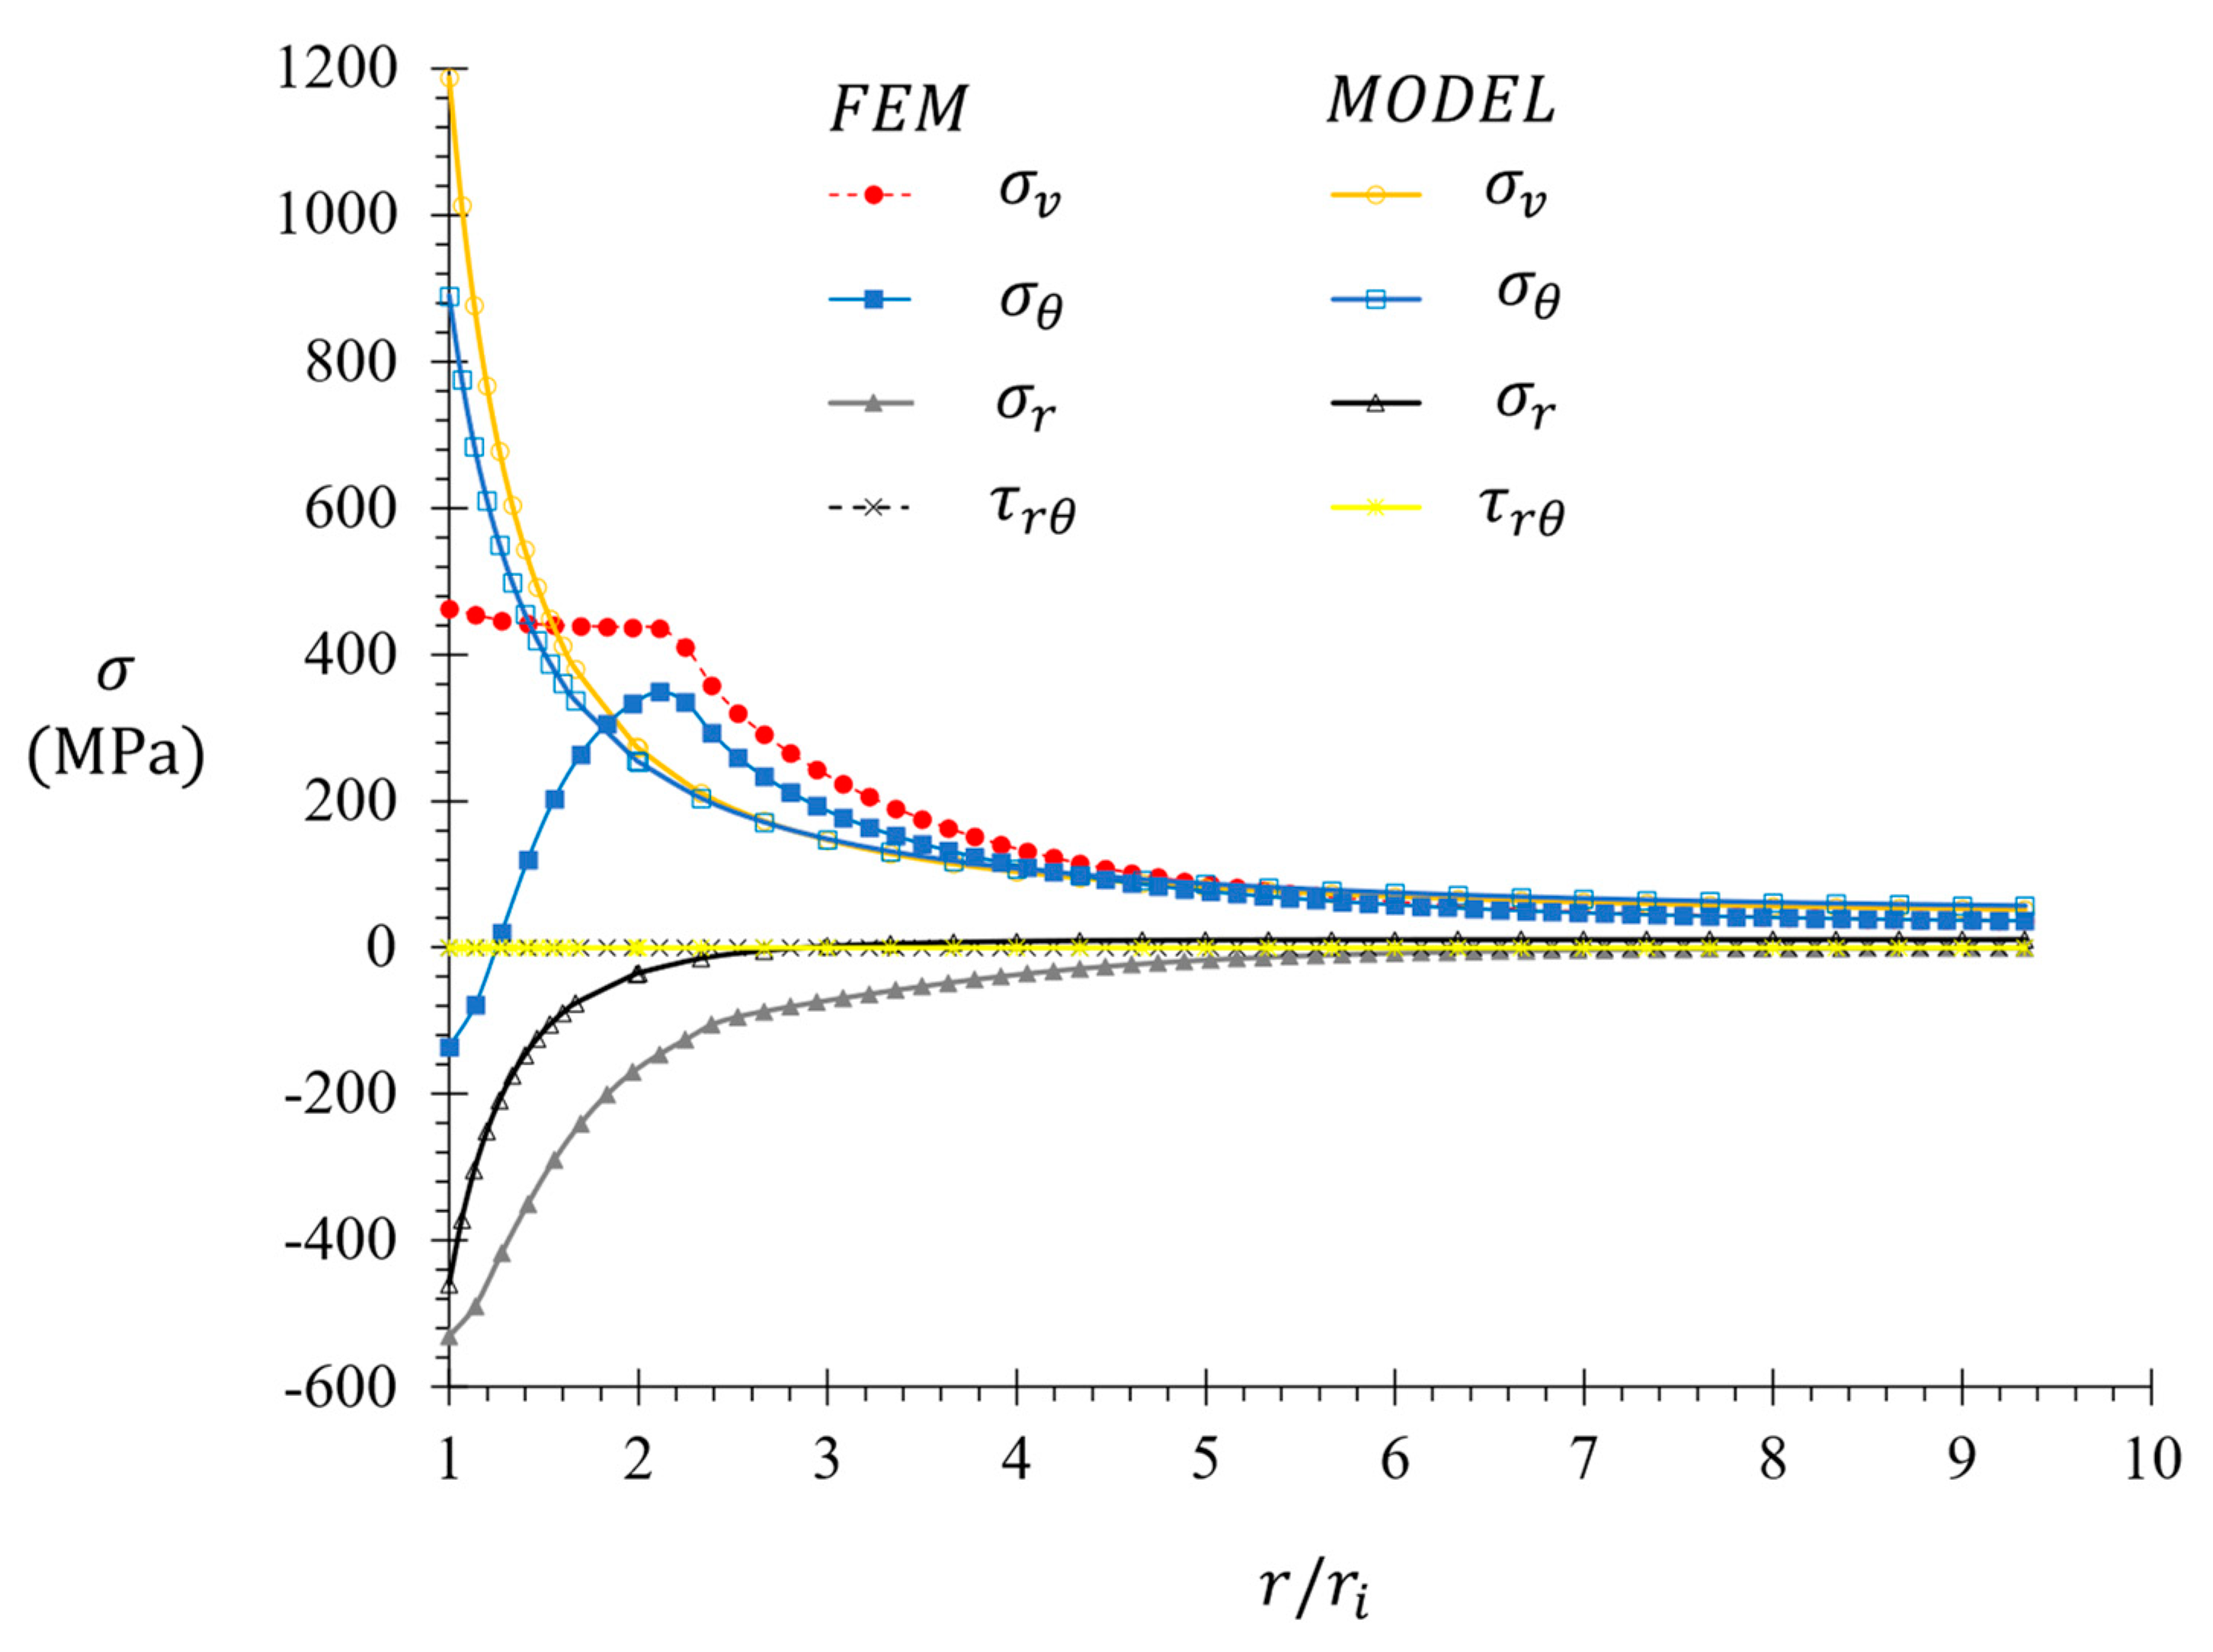
The stress fields ahead of the drilled hole after inserting the pin obtained from the FEM simulation and the analytical solution (, Equation (14)) are plotted in Figure 8, where it can be observed that the solution requires the correction of Equation (16).
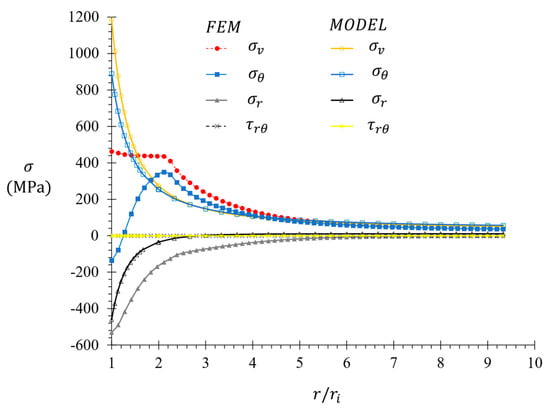
Figure 8.
Stress distributions in front of the hole at after inserting the pin.
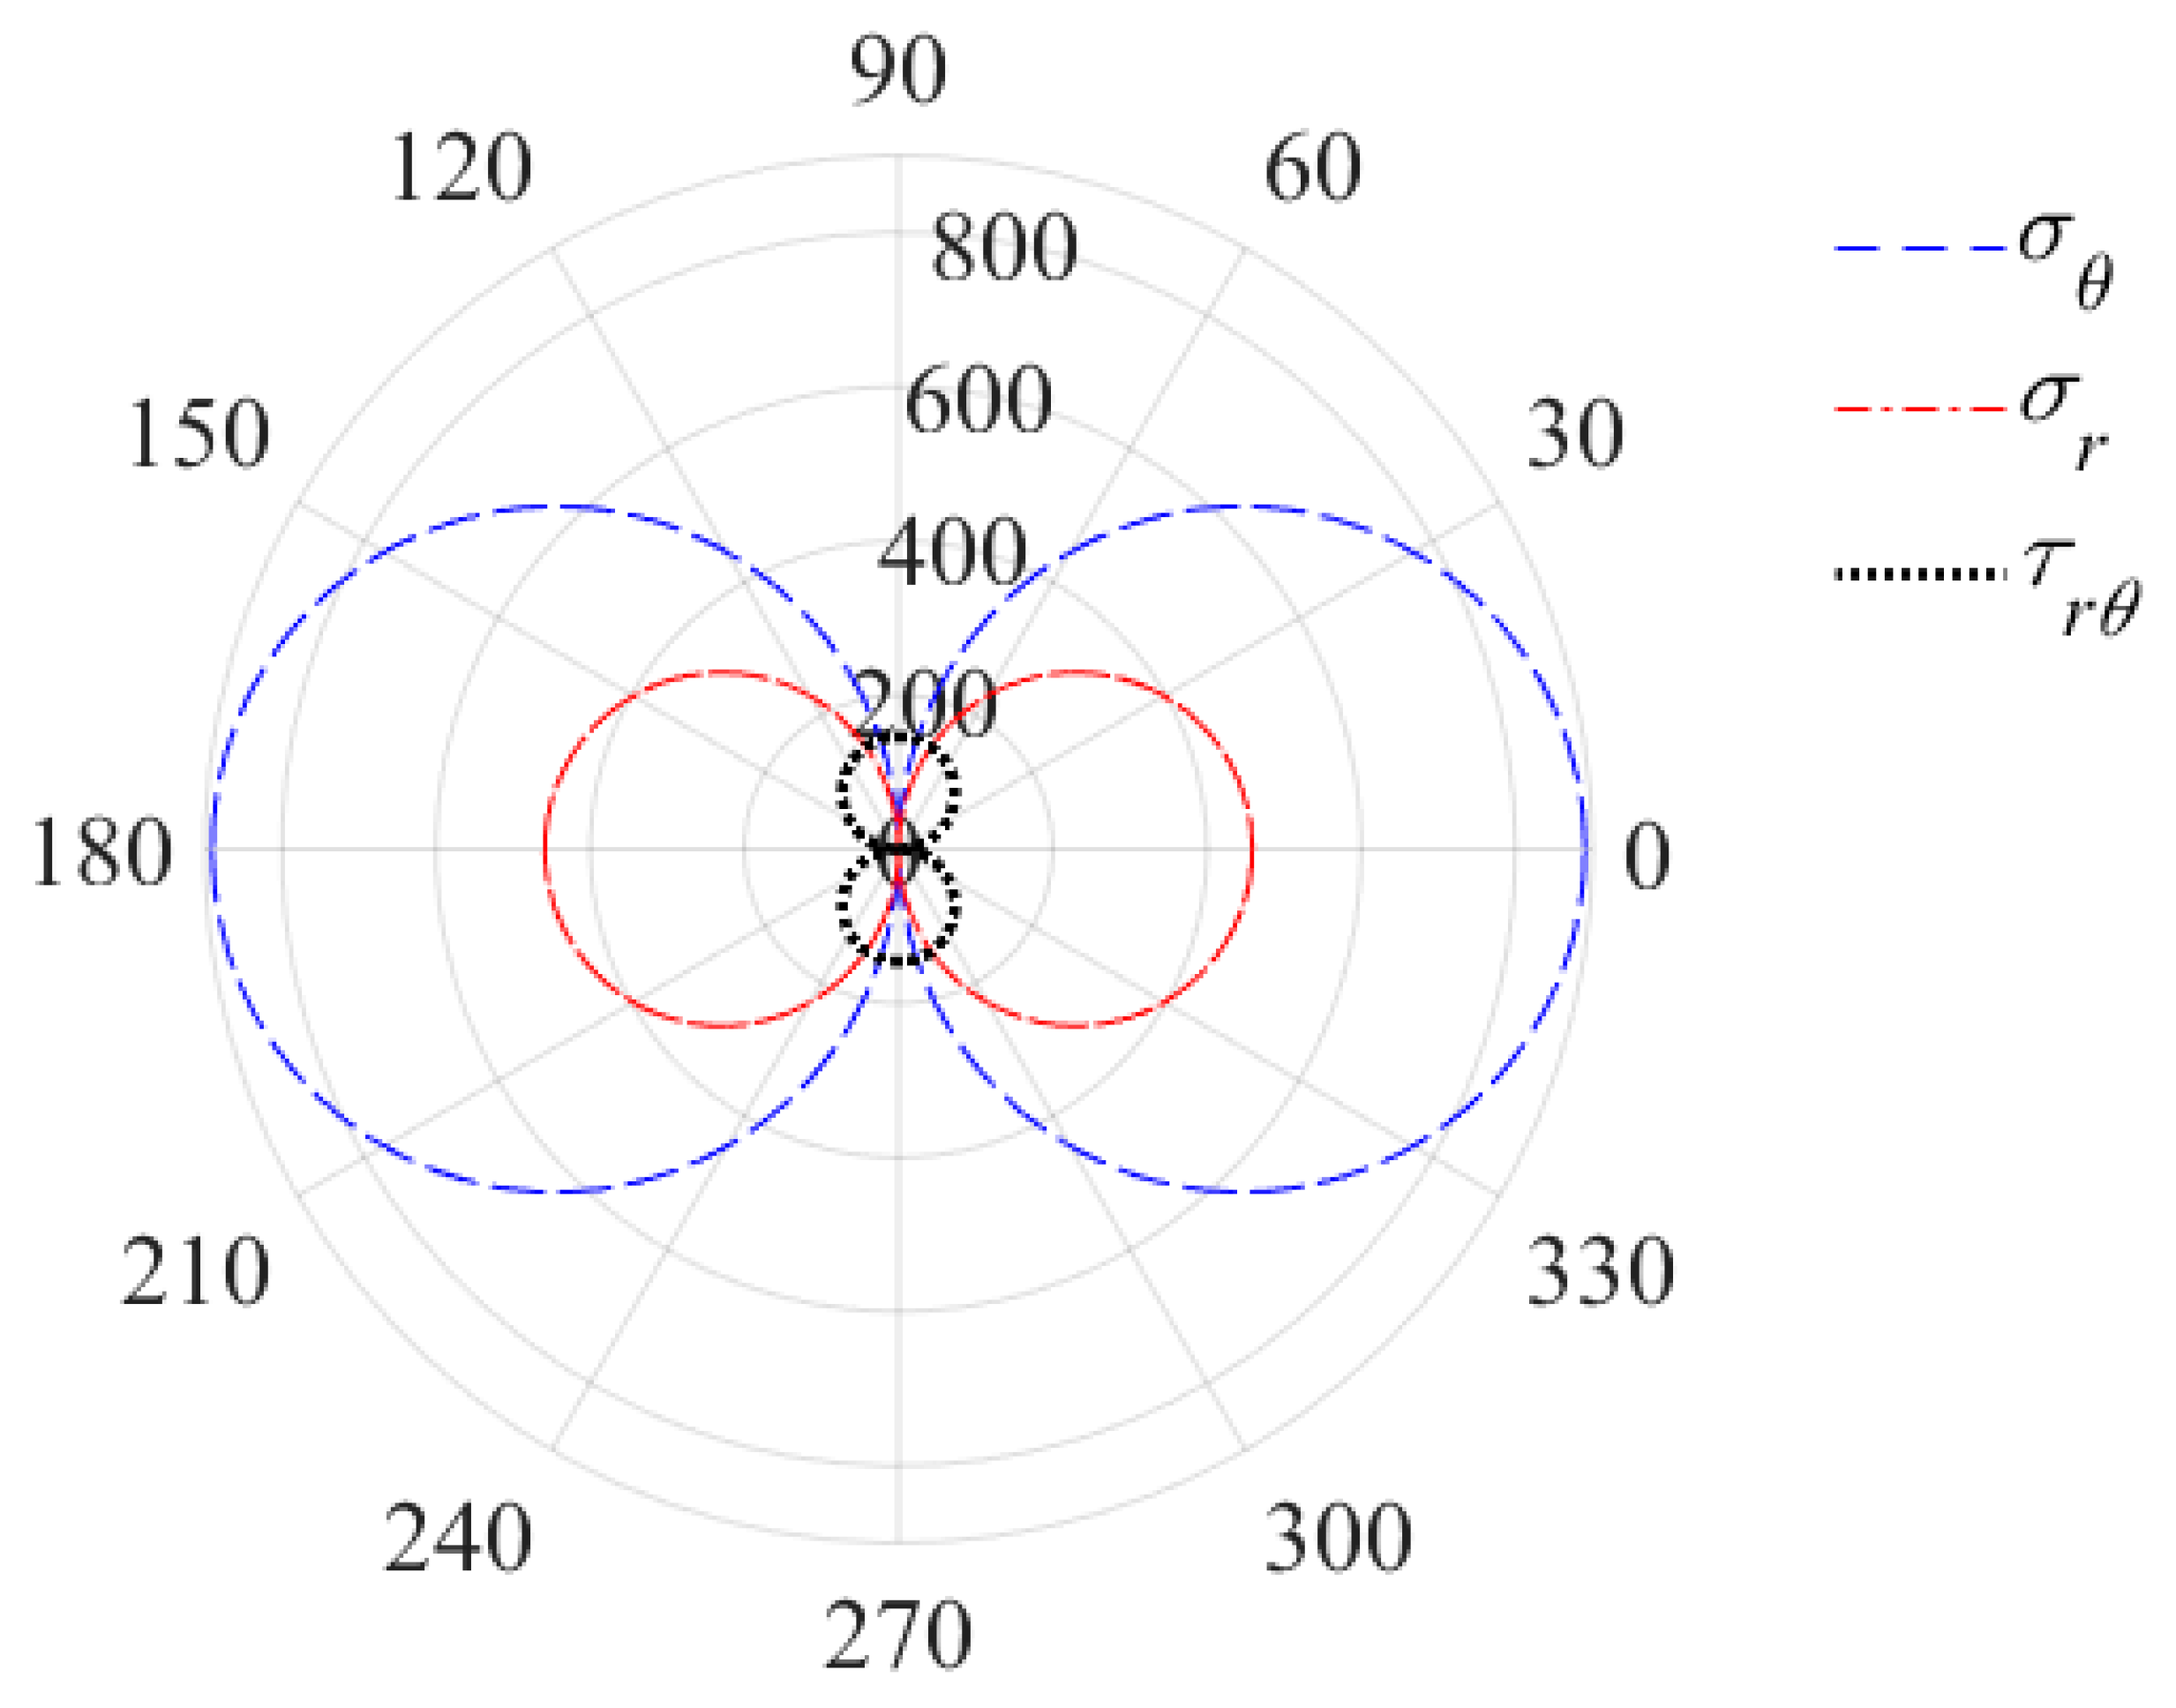
The stress field at the surface of the hole in contact with the inserted pin for the and FEM simulations are presented in Figure 9 and Figure 10, respectively. The material properties and geometric parameters used to generate Figure 9 and Figure 10 are reported in Section 2.1. Additionally, the following geometric parameters were considered as inputs for the stress field of the expanded SH technique with an interference fit of : , , , mm, , and .
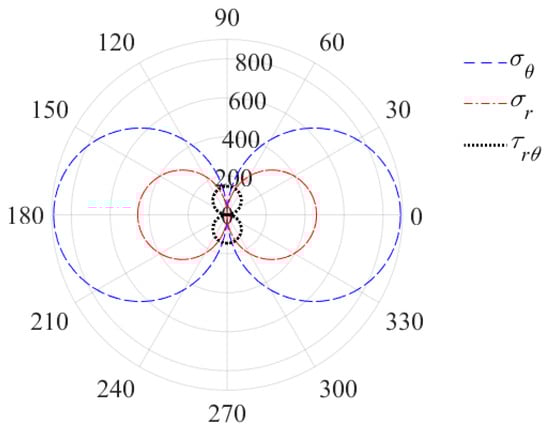
Figure 9.
Stress field in MPa, at the hole surface in contact with the inserted pin (From Equation (14)).
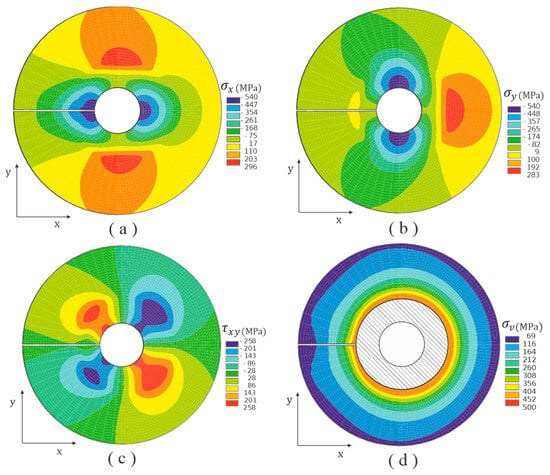
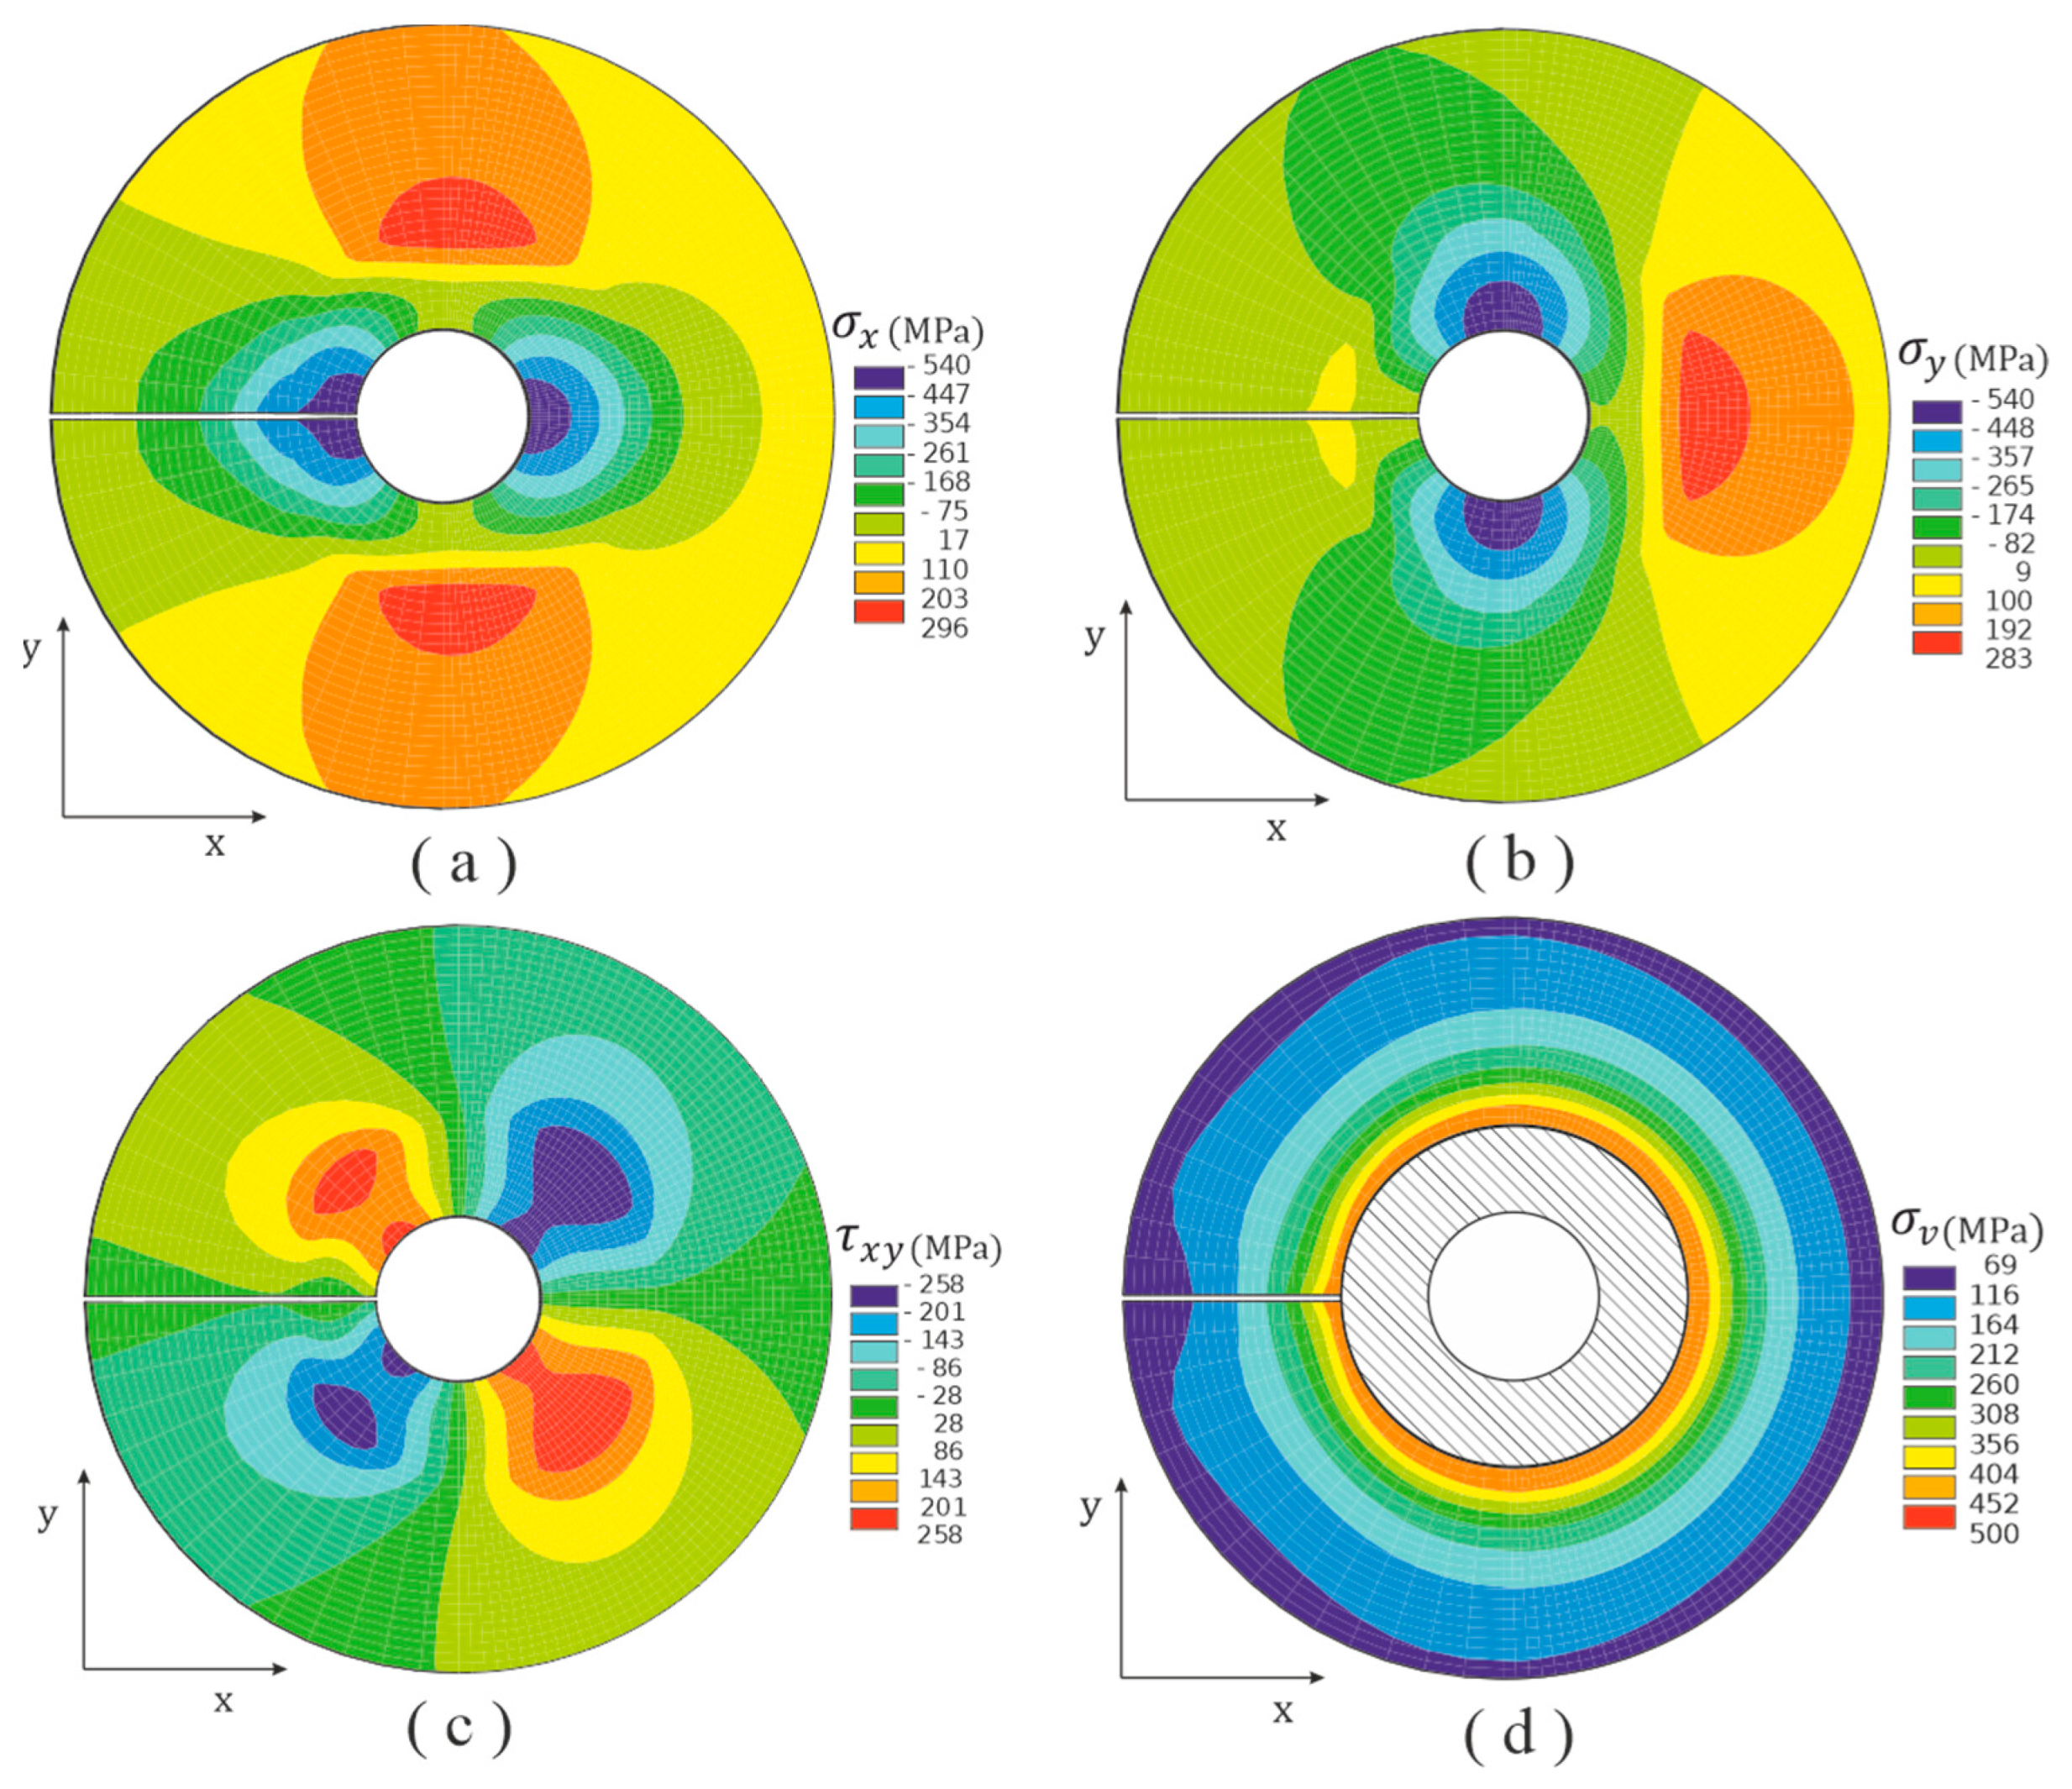
Figure 10.
Stress distribution near the hole. (a) ; (b) ; (c) ; (d) .
Figure 9 shows that exhibits a predominant behavior compared to and (similar observation can be made from Figure 8).
The local stress fields are presented in Figure 10, where the von Mises stress, depicted in Figure 10d, is employed to identify the plastic zone, which occurs when (The von Mises stress field shown in Figure 10d only makes sense for the elastic zone; for this reason, a circular dashed zone is superimposed). The variation between the corrected plastic zone size estimated using Equation (16) and the FEM prediction amounts to approximately . Figure 10c reveals that the shear stresses are zero for while the maximum values occur at planes situated at from the horizontal axis.
Finally, the fracture mechanics-based model including the correction of the plastic zone size to estimate the life extension is given by:
4. Results
4.1. Fatigue Crack Growth Tests in the Base Material
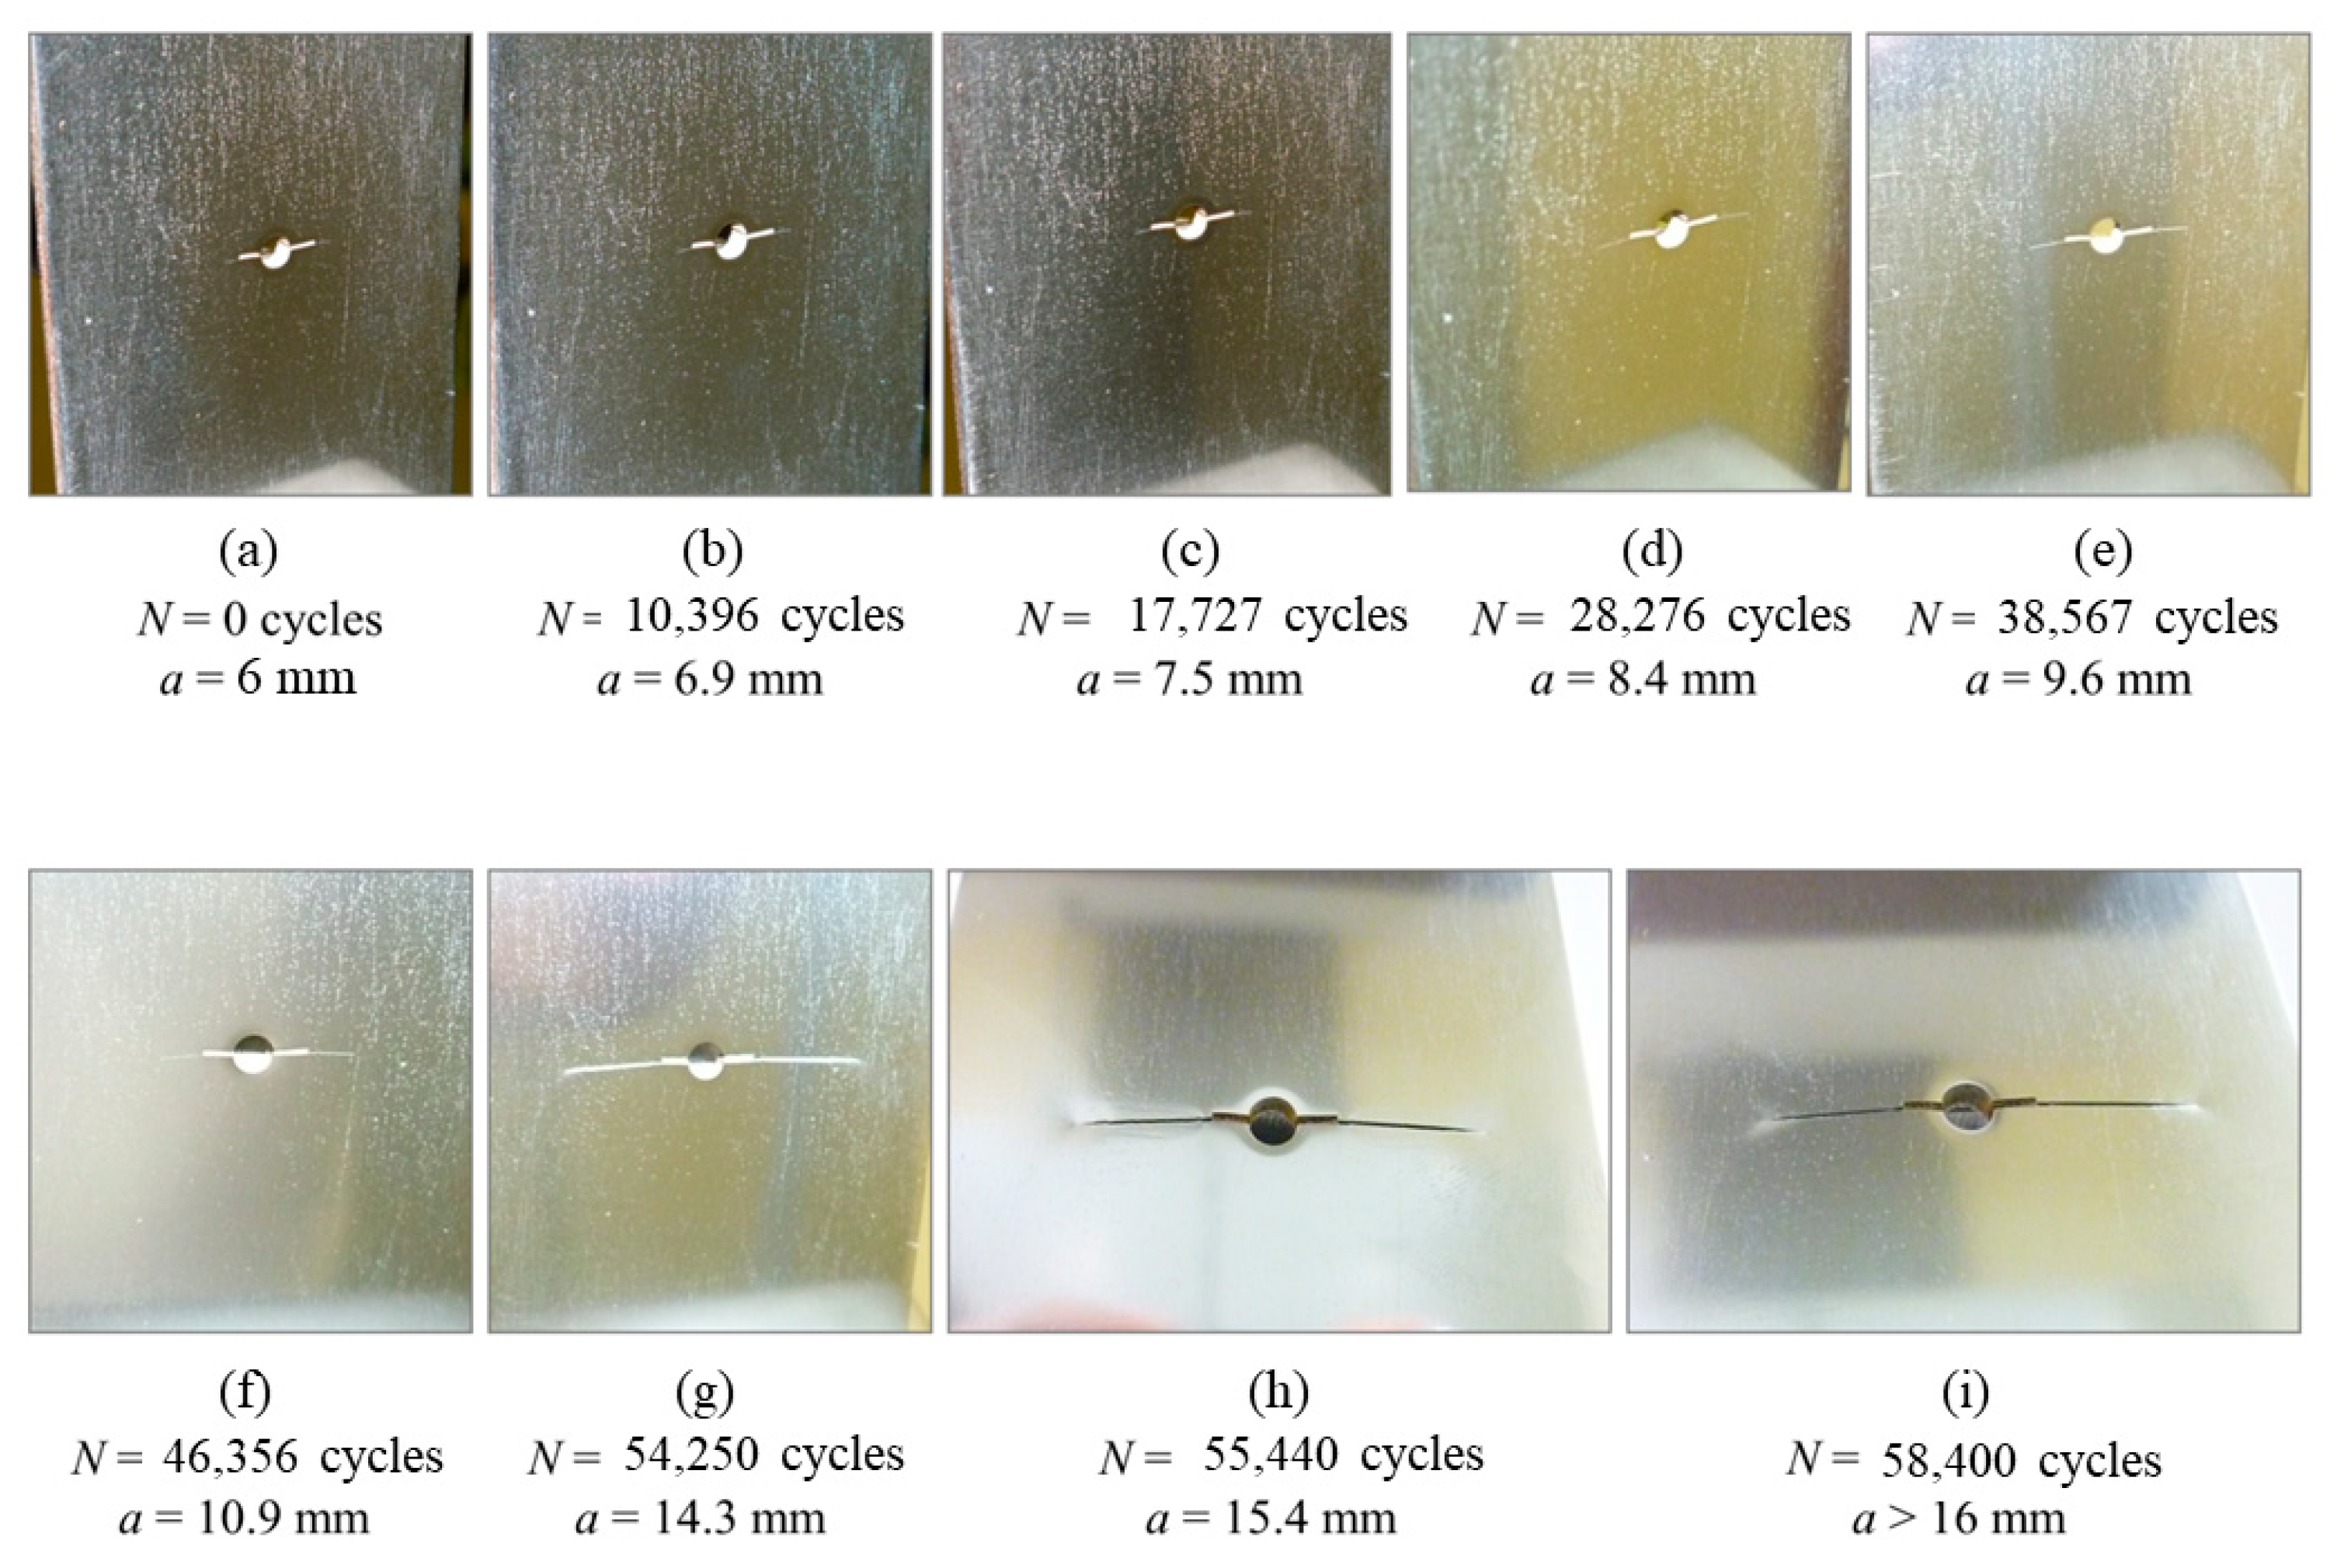
The results of the FCG tests conducted on the base material are presented in Figure 4 and Figure 5. These results are used to obtain the Paris’ parameters. The mean lifetime of the M(T) specimens (specimens 1–3) is determined to be cycles. Notable images capturing the progression of the crack during the FCG tests are showcased in Figure 11. The fatigue life of each individual specimen is provided in Table 1.
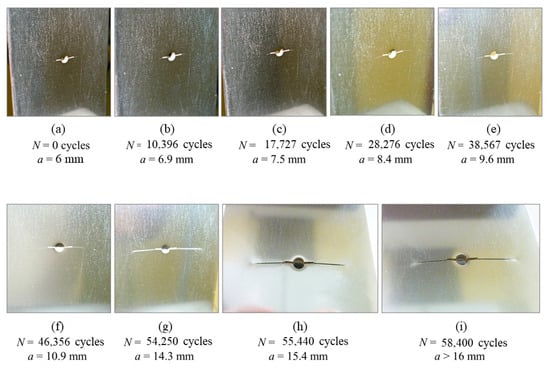
Figure 11.
Crack length growing at different numbers of load cycles applied for the base material (a) mm, (b) mm, (c) mm, (d) mm, (e) mm, (f) mm, (g) mm, (h) mm, (i) mm.

Table 1.
Fatigue life of the specimen.
4.2. FCG for the Expanded SH Technique
The results presented in Table 1 indicate that the fatigue life of the repaired specimens (specimens 4–6) is higher compared to the unrepaired specimens (specimens 1–3). The mean lifetime of the repaired samples (specimens 4–6) is cycles, resulting in a increase in fatigue life. A similar extension in the fatigue life using SH for steels has been reported in [4,5] as shown in Table 2.
Table 2.
Fatigue life increment for different steels using the SH technique.
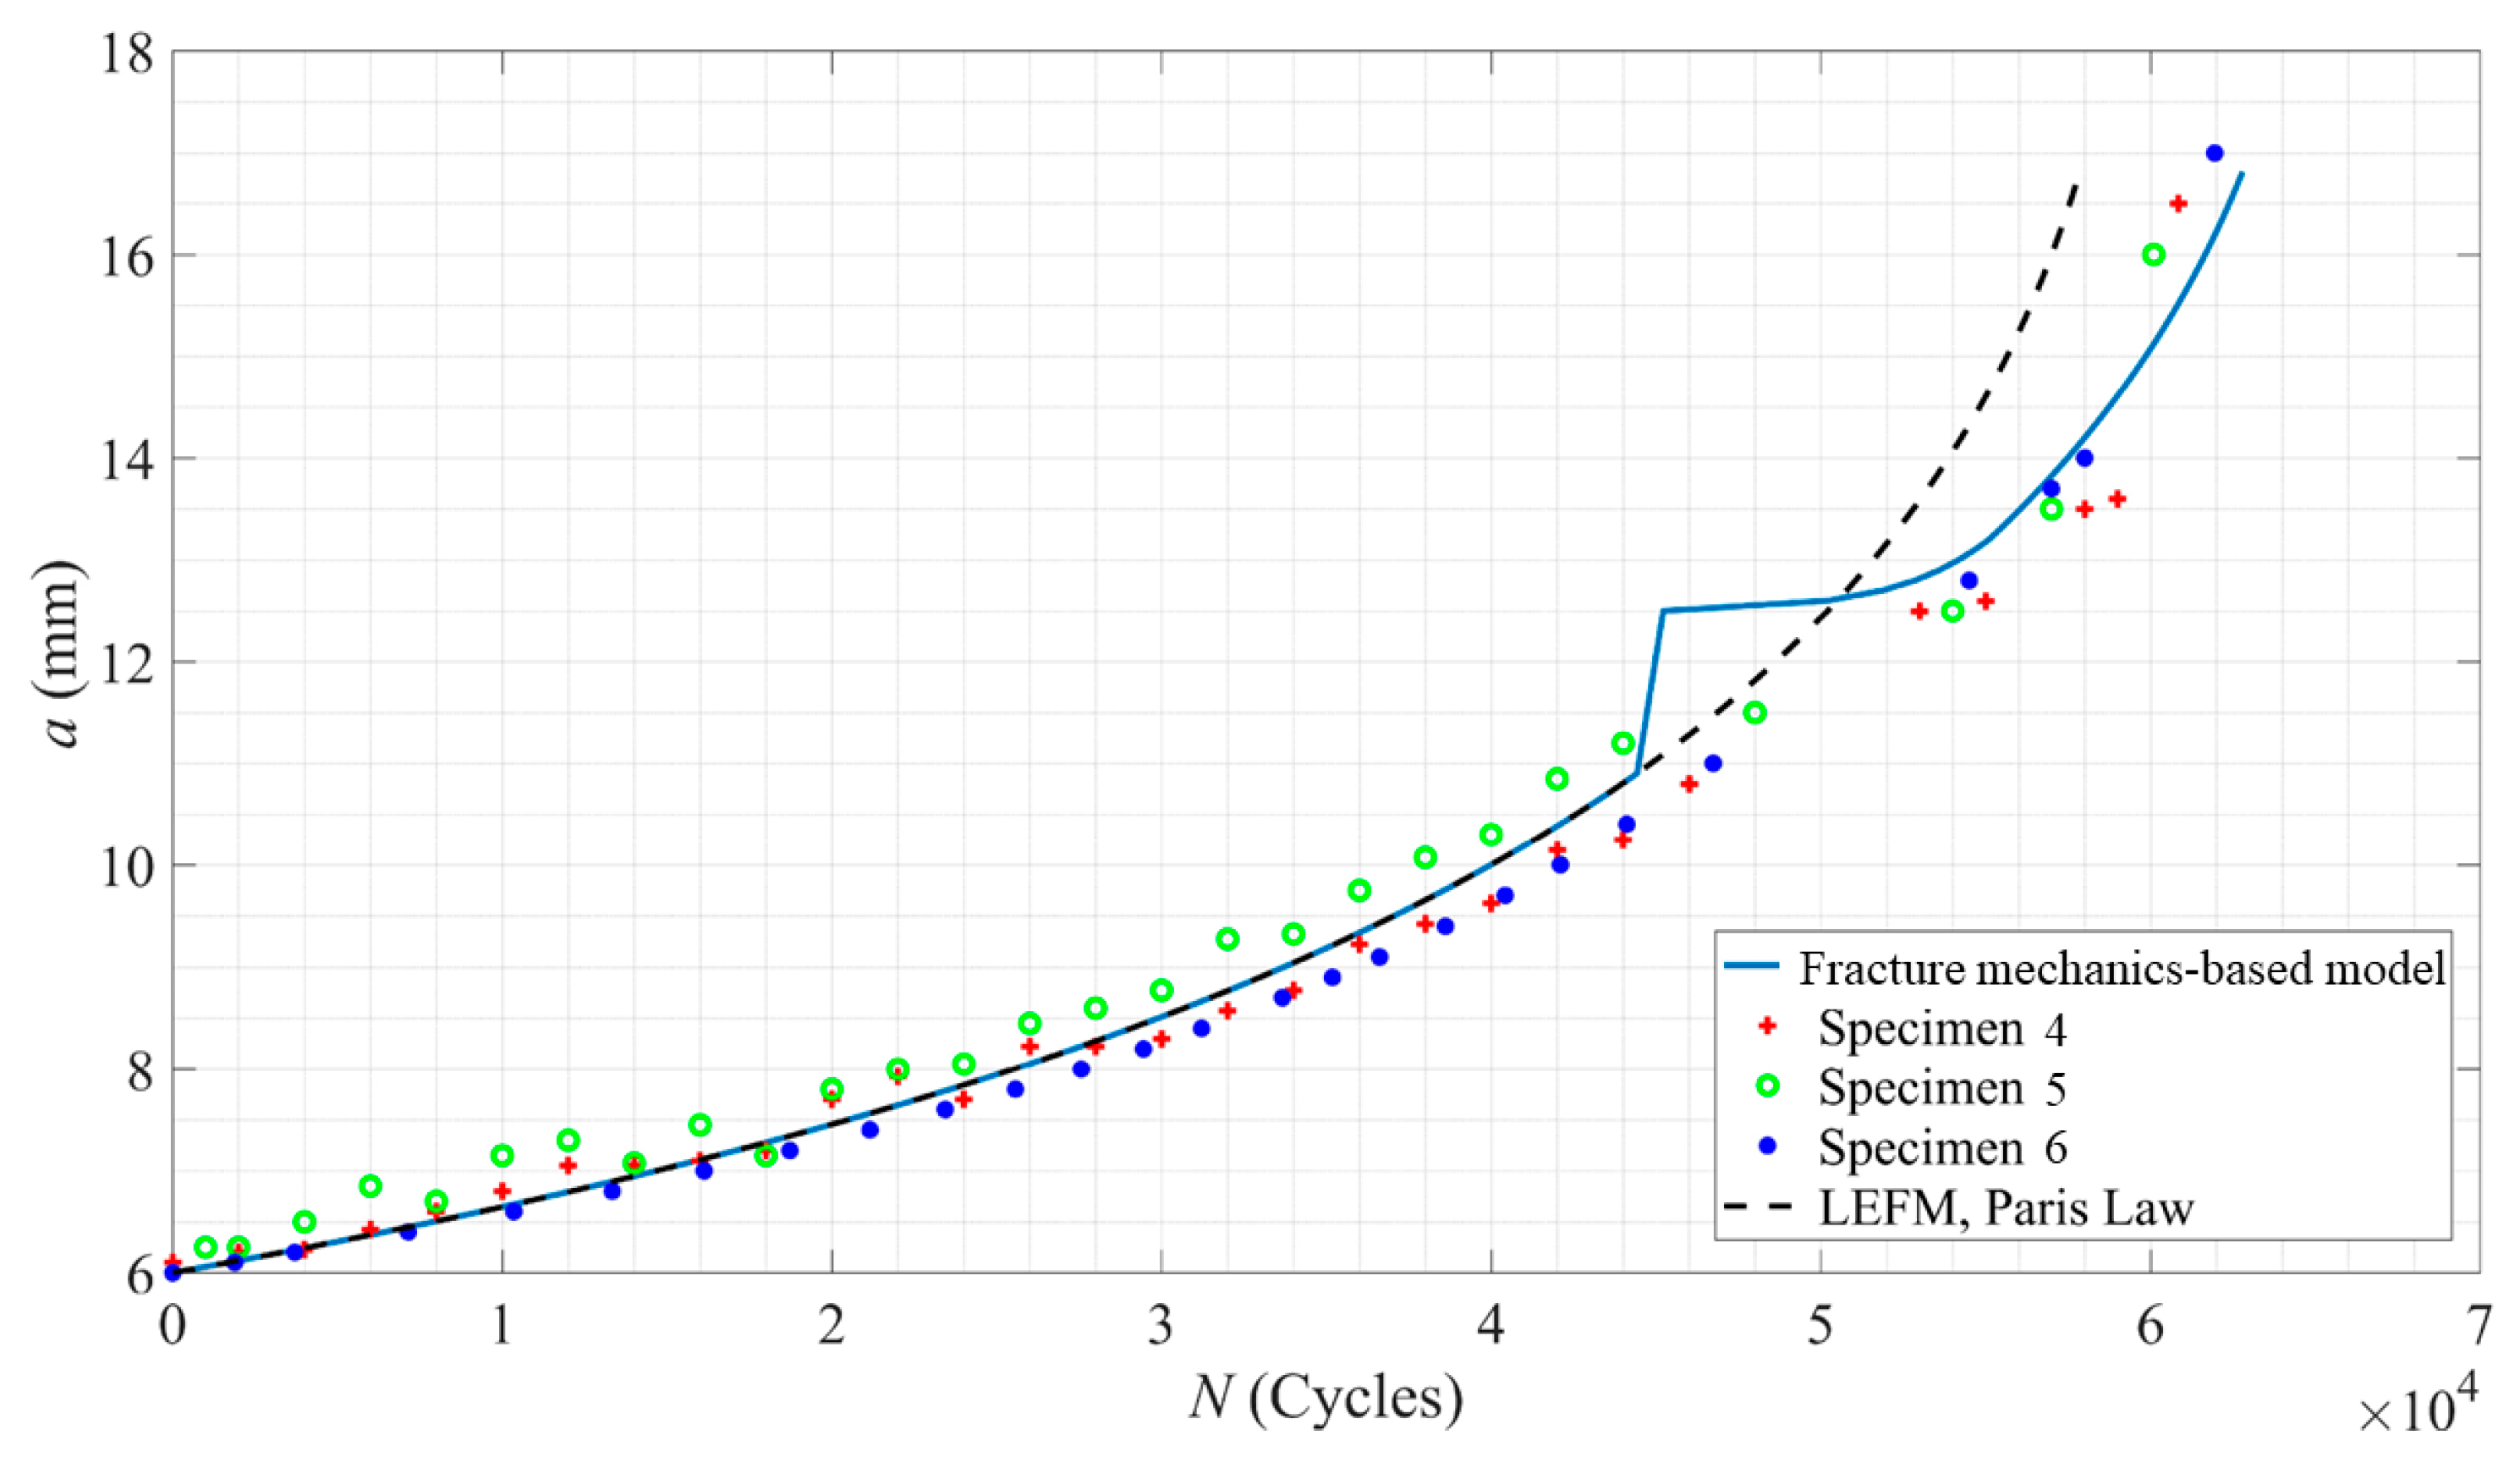
Figure 12 shows a close agreement between the experimental results and the model proposed in Section 3.1. despite the significant crack growth observed at mm due to the drilled hole. The figure illustrates a retardation in the crack growth after the repair, leading to an overall increase in the residual fatigue life of the tested specimens [4,5]. For further comparison, Table 2 presents various estimations of fatigue life increments for steels.
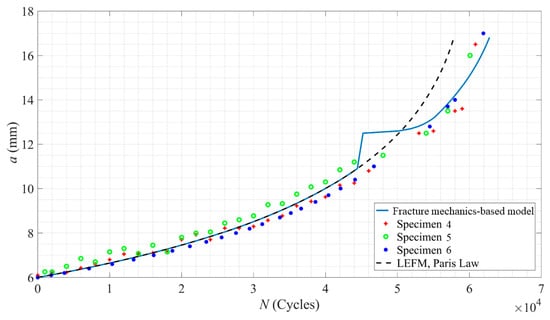
Figure 12.
Comparison between experimental data and the expanded SH model predictions at and .
5. Conclusions
In this work, the life extension of cracked plates repaired with an expanded SH technique is studied by means of fatigue crack growth tests. A fracture mechanics-based model is proposed and experimentally adjusted to model and assess the effect of the expanded SH technique. The main findings from this work are summarized below:
- -
- The proposed fracture mechanics-based model predicts that the expanded SH technique can extend the fatigue life of repaired plates by approximately 8.4% and based on the results of fatigue crack growth tests, the actual extension of fatigue life achieved with the expanded SH technique was found to be around .
- -
- The observed extension in fatigue life aligns well with similar studies reported in the literature, particularly those conducted using controlled-force mode in fatigue tests, as opposed to controlled-ΔK mode. Comparative data are presented in Table 2.
- -
- Due to the short fatigue crack reinitiation period (after expanding the SH) the fracture mechanics-based model accurately predicts the fatigue lives of the repaired specimens with a deviation of .
Author Contributions
Conceptualization, R.P., H.R.Z. and W.V.-D.; methodology, W.V.-D. and H.R.Z.; software, W.V.-D.; validation, W.V.-D., J.D.P.-R., L.N.L.d.L., A.P., H.R.Z. and R.G.-R.; formal analysis, W.V.-D., H.R.Z. and R.G.-R.; investigation, W.V.-D., R.P. and H.R.Z.; resources, H.M. and L.N.L.d.L.; data curation, R.P. and H.R.Z.; writing—original draft preparation, R.P. and W.V.-D.; writing—review and editing, W.V.-D., A.P., L.N.L.d.L., J.D.P.-R., R.G.-R. and H.R.Z.; visualization, W.V.-D., J.D.P.-R., L.N.L.d.L., A.P. and H.R.Z.; supervision, H.R.Z., H.M. and L.N.L.d.L.; project administration, R.P. and W.V.-D.; funding acquisition, H.M. and L.N.L.d.L. All authors have read and agreed to the published version of the manuscript.
Funding
Part of the research was supported by PID2022-137380OB-I00 funded by MCIN/AEI/10.13039/501100011033 and, “ERDF A way of making Europe”, by the European Union. Experimental tests were performed with support from the University Excellency groups grant by Basque Government IT 1573–22.
Data Availability Statement
The data presented in this study are available on request from the corresponding author.
Acknowledgments
R. J. Pinzon would like to thank Universidad del Norte and Departamento Administrativo de Ciencia, Tecnología e Innovación (Colciencias) for funding their Ph.D. studies and providing support in the development of their research.
Conflicts of Interest
The authors declare no conflicts of interest.
Nomenclature
| crack length | |
| initial crack length | |
| specimen thickness | |
| and | Paris’ constants |
| d/d | crack propagation rate |
| Young’s modulus | |
| hardening modulus | |
| interference fit | |
| stress intensity factor | |
| stress intensity factor in mode I | |
| crack length measured from the notch root | |
| specimen length | |
| number of load cycles | |
| applied force | |
| hole radius | |
| pin radius | |
| plastic zone size at the crack tip | |
| plastic zone size due to the overload | |
| reversed plastic zone size | |
| compensated plastic zone size | |
| distance from the center of the pin to the edge of the specimen | |
| stress ratio | |
| notch radius | |
| yield strength | |
| ultimate strength | |
| specimen width | |
| fitting parameter | |
| crack size increment | |
| stress intensity factor range | |
| applied force range | |
| contact pressure | |
| stress components in polar coordinates | |
| stress components in cartesian coordinates | |
| tangential stress at the hole’s surface when for and , respectively. | |
| von Mises stress | |
| scalar damage | |
| Wheeler’s parameter | |
| Airy’s function |
References
- Yousefi, A.; Jolaiy, S.; Hedayati, R.; Serjouei, A.; Bodaghi, M. Fatigue Life Improvement of Cracked Aluminum 6061-T6 Plates Repaired by Composite Patches. Materials 2021, 14, 1421. [Google Scholar] [CrossRef]
- Liu, X.; Wu, J.; Xi, J.; Yu, Z. Bonded Repair Optimization of Cracked Aluminum Alloy Plate by Microwave Cured Carbon-Aramid Fiber/Epoxy Sandwich Composite Patch. Materials 2019, 12, 1655. [Google Scholar] [CrossRef] [PubMed]
- Aabid, A.; Hrairi, M.; Ali, J.S.M.; Sebaey, T.A. A Review on Reductions in the Stress-Intensity Factor of Cracked Plates Using Bonded Composite Patches. Materials 2022, 15, 3086. [Google Scholar] [CrossRef]
- Chao Lu, Y.; Peng Yang, F.; Chen, T.; Gong, H. The retardation effect of combined application of stop-hole and overload on sheet steel. Int. J. Fatigue 2020, 132, 105414. [Google Scholar] [CrossRef]
- Yao, Y.; Ji, B.; Fu, Z.; Zhou, J.; Wang, Y. Optimization of stop-hole parameters for cracks at diaphragm-to-rib weld in steel bridges. J. Constr. Steel Res. 2019, 162, 105747. [Google Scholar] [CrossRef]
- Jiang, X.; Lv, Z.; Qiang, X.; Zhang, J. Improvement of Stop-Hole Method on Fatigue-Cracked Steel Plates by Using High-Strength Bolts and CFRP Strips. Adv. Civ. Eng. 2021, 2021, 6632212. [Google Scholar] [CrossRef]
- Razavi, S.M.J.; Ayatollahi, M.R.; Sommitsch, C.; Moser, C. Retardation of fatigue crack growth in high strength steel S690 using a modified stop-hole technique. Eng. Fract. Mech. 2017, 169, 226–237. [Google Scholar] [CrossRef]
- Ayatollahi, M.R.; Razavi, S.M.J.; Yahya, M.Y. Mixed mode fatigue crack initiation and growth in a CT specimen repaired by stop hole technique. Eng. Fract. Mech. 2015, 145, 115–127. [Google Scholar] [CrossRef]
- Deng, Q.; Yin, X.; Wang, D.; Abdel Wahab, M. Numerical analysis of crack propagation in fretting fatigue specimen repaired by stop hole method. Int. J. Fatigue 2022, 156, 106640. [Google Scholar] [CrossRef]
- Taghizadeh, H.; Chakherlou, T.; Ghorbani, H.; Mohammadpour, A. Prediction of fatigue life in cold expanded fastener holes subjected to bolt tightening in Al alloy 7075-T6 plate. Int. J. Mech. Sci. 2015, 90, 6–15. [Google Scholar] [CrossRef]
- Takahashi, I. A simple repair method of fatigue cracks using stop-holes reinforced with wedge members: Applicability to reinitiated cracks and effects of an anti-fatigue smart paste. Weld. Int. 2020, 34, 267–287. [Google Scholar] [CrossRef]
- Branco, C.; Infante, V.; Baptista, R. Fatigue behaviour of welded joints with cracks, repaired by hammer peening. Fatigue Fract. Eng. Mater. Struct. 2004, 27, 785–798. [Google Scholar] [CrossRef]
- Tai, M.; Miki, C. Fatigue strength improvement by hammer peening treatment—Verification from plastic deformation, residual stress, and fatigue crack propagation rate. Weld. World 2014, 58, 307–318. [Google Scholar] [CrossRef]
- Tai, M.; Miki, C. Improvement effects of fatigue strength by burr grinding and hammer peening under variable amplitude loading. Weld. World 2012, 56, 109–117. [Google Scholar] [CrossRef]
- Baker, A.; Jones, R. Bonded Repair of Aircraft Structures; Springer Science & Business Media: Berlin/Heidelberg, Germany, 1988; Volume 7. [Google Scholar] [CrossRef]
- Marazani, T.; Madyira, D.M.; Akinlabi, E.T. Repair of cracks in metals: A review. Procedia Manuf. 2017, 8, 673–679. [Google Scholar] [CrossRef]
- Lozano, C.M.; Riveros, G.A. Effects of Adhesive Bond-Slip Behavior on the Capacity of Innovative FRP Retrofits for Fatigue and Fracture Repair of Hydraulic Steel Structures. Materials 2019, 12, 1495. [Google Scholar] [CrossRef] [PubMed]
- Song, P.; Shieh, Y. Stop drilling procedure for fatigue life improvement. Int. J. Fatigue 2004, 26, 1333–1339. [Google Scholar] [CrossRef]
- Wu, H.; Imad, A.; Benseddiq, N.; de Castro, J.T.P.; Meggiolaro, M.A. On the prediction of the residual fatigue life of cracked structures repaired by the stop-hole method. Int. J. Fatigue 2010, 32, 670–677. [Google Scholar] [CrossRef]
- Schubbe, J.J.; Bolstad, S.H.; Reyes, S. Fatigue crack growth behavior of aerospace and ship-grade aluminum repaired with composite patches in a corrosive environment. Compos. Struct. 2016, 144, 44–56. [Google Scholar] [CrossRef]
- Errouane, H.; Sereir, Z.; Chateauneuf, A. Numerical model for optimal design of composite patch repair of cracked aluminum plates under tension. Int. J. Adhes. Adhes. 2014, 49, 64–72. [Google Scholar] [CrossRef]
- Zarrinzadeh, H.; Kabir, M.; Deylami, A. Experimental and numerical fatigue crack growth of an aluminium pipe repaired by composite patch. Eng. Struct. 2017, 133, 24–32. [Google Scholar] [CrossRef]
- Ferdous, M.; Naka, K.; Makabe, C.; Miyazaki, T. A review of simple methods for arresting crack growth. Adv. Mat. Res. 2015, 1110, 185–190. [Google Scholar] [CrossRef]
- Zarrinzadeh, H.; Kabir, M.; Deylami, A. Crack growth and debonding analysis of an aluminum pipe repaired by composite patch under fatigue loading. Thin-Walled Struct. 2017, 112, 140–148. [Google Scholar] [CrossRef]
- Mohammed, S.M.K.; Bouiadjra, B.B.; Benyahia, F.; Albedah, A. Analysis of the single overload effect on fatigue crack growth in AA 2024-T3 plates repaired with composite patch. Eng. Fract. Mech. 2018, 202, 147–161. [Google Scholar] [CrossRef]
- Huang, C.; Chen, T.; Feng, S. Finite element analysis of fatigue crack growth in CFRP-repaired four-point bend specimens. Eng. Struct. 2019, 183, 398–407. [Google Scholar] [CrossRef]
- Ye, H.; Wang, T.; Shuai, C.; Liu, C.; Xu, X. A novel driving force parameter ΔKeff1-αKmaxα for fatigue crack propagation in prestressed-CFRP-repaired steel structure. Compos. Struct. 2019, 214, 183–190. [Google Scholar] [CrossRef]
- Alshoaibi, A.M.; Fageehi, Y.A. Finite Element Simulation of a Crack Growth in the Presence of a Hole in the Vicinity of the Crack Trajectory. Materials 2022, 15, 363. [Google Scholar] [CrossRef]
- Ghfiri, R.; Shi, H.J.; Guo, R.; Mesmacque, G. Effects of expanded and non-expanded hole on the delay of arresting crack propagation for aluminum alloys. Mater. Sci. Eng A 2000, 286, 244–249. [Google Scholar] [CrossRef]
- Domazet, Ž. Comparison of fatigue crack retardation methods. Eng. Fail. Anal. 1996, 3, 137–147. [Google Scholar] [CrossRef]
- Moshtaghi, M.; Safyari, M. Effect of Work-Hardening Mechanisms in Asymmetrically Cyclic-Loaded Austenitic Stainless Steels on Low-Cycle and High-Cycle Fatigue Behavior. Steel Res. Int. 2021, 92, 2000242. [Google Scholar] [CrossRef]
- Velilla-Díaz, W.; Zambrano, H.R. Effects of Grain Boundary Misorientation Angle on the Mechanical Behavior of Al Bicrystals. Nanomaterials 2023, 13, 3031. [Google Scholar] [CrossRef] [PubMed]
- Tian, L.; Cheng, Z. Fracture and Fatigue Analyses of Cracked Structures Using the Iterative Method. Geofluids 2021, 2021, 4434598. [Google Scholar] [CrossRef]
- Zhang, P.; Li, J.; Zhao, Y.; Li, J. Crack propagation analysis and fatigue life assessment of high-strength bolts based on fracture mechanics. Sci. Rep. 2023, 13, 14567. [Google Scholar] [CrossRef] [PubMed]
- Yang, D. Analysis of Fracture Mechanics Theory of the First Fracture Mechanism of Main Roof and Support Resistance with Large Mining Height in a Shallow Coal Seam. Sustainability 2021, 13, 1678. [Google Scholar] [CrossRef]
- Velilla-Díaz, W.; Ricardo, L.; Palencia, A.; Zambrano, H.R. Fracture toughness estimation of single-crystal aluminum at nanoscale. Nanomaterials 2021, 11, 680. [Google Scholar] [CrossRef] [PubMed]
- Liu, J.; Feng, G.; Wang, J.; Ren, H.; Song, W.; Lin, P. Fatigue Life Assessment in the Typical Structure of Large Container Vessels Based on Fracture Mechanics. J. Mar. Sci. Eng. 2023, 11, 2075. [Google Scholar] [CrossRef]
- Leonetti, D.; Maljaars, J.; Snijder, B. Fracture mechanics based fatigue life prediction for a weld toe crack under constant and variable amplitude random block loading—Modeling and uncertainty estimation. Eng. Fract. Mech. 2021, 242, 107487. [Google Scholar] [CrossRef]
- Attarha, M.; Sattari-Far, I. Comparison of the continuum damage and fracture mechanics in fatigue assessment of components containing residual stresses. Mech. Based Des. Struct. Mach. 2023, 1–18. [Google Scholar] [CrossRef]
- Velilla-Díaz, W.; Zambrano, H.R. Crack length effect on the fracture behavior of single-crystals and bi-crystals of aluminum. Nanomaterials 2021, 11, 2783. [Google Scholar] [CrossRef]
- Alrayes, O.; Könke, C.; Ooi, E.T.; Hamdia, K.M. Modeling Cyclic Crack Propagation in Concrete Using the Scaled Boundary Finite Element Method Coupled with the Cumulative Damage-Plasticity Constitutive Law. Materials 2023, 16, 863. [Google Scholar] [CrossRef]
- Kristensen, P.; Niordson, C.; Martínez-Pañeda, E. An assessment of phase field fracture: Crack initiation and growth. Phil. Trans. R. Soc. A 2021, 379, 20210021. [Google Scholar] [CrossRef]
- Standard Test Method for Measurement of Fatigue Crack Growth Rates. ASTM International: West Conshohocken, PA, USA, 2015. Available online: https://www.astm.org/e0647-15e01.html (accessed on 29 January 2024).
- Paris, P.C. A rational analytic theory of fatigue. Trends Engin 1961, 13, 9–14. [Google Scholar]
- Wheeler, O. Spectrum loading and crack growth. Trans. of ASCE. J. Basic. Eng. 1972, 94, 181–186. [Google Scholar] [CrossRef]
- Anderson, T.L. Fracture Mechanics: Fundamentals and Applications; CRC Press: Boca Raton, FL, USA, 2017. [Google Scholar]
- Harter, J.A. AFGROW users guide and technical manual. Technical report, Air Force Research Lab Wright-Patterson Afb Oh Air Vehicles Directorate. Air Force Res. Lab. 1999, 10. Available online: https://apps.dtic.mil/sti/citations/ADA370431 (accessed on 29 January 2024).
- Irwin, G.R. Analysis of Stresses and Strains Near the End of a Crack Traversing a Plate. J. Appl. Mech. 1957, 24, 361–364. [Google Scholar] [CrossRef]
- Fett, T. Stress Intensity Factors-T-Stresses-Weight Functions; Institute of Ceramics in Mechanical Engineering, University of Karlsruhe: Karlsruhe, Germany, 2008. [Google Scholar]
- Budynas, R.G.; Nisbett, J. Diseño en Ingeniería Mecánica de Shigley, 8th ed.; McGraw-Hill Interamericana: Mexico City, Mexico, 2008. [Google Scholar]
- ANSYS. Ansys User’s Manual: Theory Reference, R22; Swanson Analysis System Inc.: Houston, TX, USA, 2007. [Google Scholar]


Disclaimer/Publisher’s Note: The statements, opinions and data contained in all publications are solely those of the individual author(s) and contributor(s) and not of MDPI and/or the editor(s). MDPI and/or the editor(s) disclaim responsibility for any injury to people or property resulting from any ideas, methods, instructions or products referred to in the content. |
© 2024 by the authors. Licensee MDPI, Basel, Switzerland. This article is an open access article distributed under the terms and conditions of the Creative Commons Attribution (CC BY) license (https://creativecommons.org/licenses/by/4.0/).