Abstract
The rolling process of aluminum foil is subject to the issue of variable thickness, which has a substantial impact on its performance. The thickness of the aluminum foil is influenced by various factors, including the magnitude of the bending force, the distance between the rollers, the thermal expansion of the roller, and the acceleration of the rolling mill. To address the issue of quick fluctuations in bending force during the rolling process, either a positive bending force or a slight negative bending force is employed. The adjustment factor for the bending force applied to the roll gap is set to a value of 1.0. Upon conducting a comparative analysis of the thermal expansion curves of the model with varying thermal expansion coefficients, it was ascertained that an optimized coefficient of 1.71 yielded the most favorable results. The roll gap is adjusted using a sixth power equation to accommodate the rolling of materials with both low and high pressure. Subsequently, the roll is elevated by 0.2 mm and 0.18 mm for the entire duration. The findings from the rolling experiments indicate that the optimization of the process leads to a notable reduction in the variance of aluminum foil thickness.
1. Introduction
Lithium-ion batteries (LIBs) are widely acknowledged as a very desirable power source owing to their numerous advantages, including a high operating voltage, elevated energy density, low self-discharge rate, exceptional stability, and environmentally friendly characteristics [1,2]. The overall performance of a lithium-ion battery is largely dependent on its main components. Its main components include the anode, cathode, electrolyte, diaphragm, and collector [3]. Conventional lithium-ion batteries are mainly based on the lithium-ion intercalation mechanism, which cannot provide high charging capacity [4]. To change this situation, new lithium-ion battery components are becoming increasingly popular [5]. The enhancement and advancement of LIBs are being pursued through the creation of materials in order to enhance their efficiency and safety [6,7]. The utilization of aluminum foil as an electrode collector in batteries is prevalent due to its ability to enhance adhesion at the interface between the cathode material and the collector, as well as augment the ion transport capacity [8,9]. The lower thickness of the aluminum foil reduces the internal resistance of the battery, thus improving the cycling and storage performance of the battery [10,11]. The energy density of the battery is influenced by the thickness of the aluminum foil. The processing of aluminum foil leads to a significant range of thickness variations, hence impacting the overall performance of the battery [12,13]. Therefore, limiting significant fluctuations in the thickness of the aluminum foil is crucial to maximizing battery performance and life.
The thickness of the aluminum foil was influenced by various aspects throughout the rolling process, including the aluminum embryo, rolling oil, rolling parameters, sheet shape, and other relevant factors [14]. The issue of variance in aluminum foil thickness can be mitigated through the adjustment of rolling settings. Xiao et al. [15] constructed a theoretical framework to compute the attainable rolling thickness of ultra-thin strips by applying Fleck’s theory. The model was subsequently validated by experimental testing. By employing this model, the reduction process can be efficiently executed in a single iteration, considering factors such as the force applied per unit width, the unique technical requirements of the mill, the material’s yield strength, and the initial thickness of the strip. The equations for the greatest attainable thickness, considering the constraints of rolling force, were rectified. Sun et al. [16] analyzed the work roll and the backup roll as an elastic continuum, taking into account the influence of shear force and moments of inertia. They then developed a dynamic model of the rolling mill. The two models were interconnected to establish the dynamic model. In the dynamic model, the thermal expansion of the rolls, the wear of the rolls, and other related parameters cannot be considered. A coupled static model of the rollers and the strip was employed to account for the dynamic model. A dynamic model of the rolling mill with thickness control was constructed by integrating the dynamic model with the compensation model.
The advancement of science and technology has led to the predominant utilization of automatic thickness control as the primary method for regulating the thickness of aluminum foil [17]. Continuous measurement of the actual rolling thickness of rolled parts is achieved by employing several sensors, including but not limited to the thickness gauge, rolling seam instrument, and pressure head [18]. By utilizing the computer function procedure, the measured value and the given value are compared to determine the deviation signal. This signal is then used to adjust the rolling seam, rolling force, tension, and roll speed in order to maintain thickness control within the acceptable deviation range [19,20]. The study conducted by Hu et al. [21] investigates the rolling characteristics of the tandem cold-rolling process and introduces a novel technique for optimizing multiple variables. This technique utilizes inverse linear quadratic (ILQ) optimal control theory to effectively control the thickness and tension. At first, a new mathematical model of the tandem cold-rolling process was introduced and verified utilizing the fundamental equations of rolling technology and real-world data. Afterwards, a thorough examination of the rolling properties resulted in the discovery of important controlling principles for the complex rolling process. An innovative ILQ control strategy was applied to the thickness and tension control system for the intricate rolling process. Linearizing the mill stand model while preserving the nonlinearities of the rolling gap model leads to a computationally efficient optimization problem. This technique achieves a desirable equilibrium between precision and computational efficiency. The feedforward controllers are incorporated into the feedback loop of the AGC (Automatic Generation Control), utilizing a two-degree-of-freedom controller framework to rectify any disparities between the model and the plant. The simulation results, based on a validated mathematical model and first experimental data from an industrial pilot installation, clearly show a significant improvement compared to the existing AGC system without feedforward control [22].
There are few studies that have investigated the effect of the roll-bending method on the head thickness inequality and the stability of the convexity of hot-rolled strips. Accordingly, the aim of this paper is to adjust the bending force through a set-up process and to implement a compensation factor for the bending force in the rolling gap. The statistical analysis consisted of studying the temperature-thermal expansion curves while controlling the coefficient of thermal expansion of the hot-rolled work rolls. At the same time, a non-linear compensation technique is proposed to solve the problem of thickness variation due to the sudden reduction of aluminum foil thickness during the acceleration phase. This has the potential to establish a reliable and precise technique for processing aluminum foil.
2. Process Optimization
2.1. Materials and Methods
The use of high-purity aluminum ingots was provided by Xinjiang Zhonghe (Urumqi, China). The composition is shown in Table 1 and the characteristics in Table 2. Aluminum sheets were rolled at the rated parameters of the mill and the optimized parameters, respectively. Rolling was carried out five times, and the average value of aluminum foil thickness was taken. The hot rolling experiments were carried out using a four-roll reversible mill (Xinjiang Joinworld Company Limited, Urumqi, China). The hot rolling experiments were carried out in the mill, and the diameter of the working roll of the mill was 860 mm and the length was 1.8 m. The maximum rolling pressure of the mill is 25,000 kN, the maximum rolling speed is 250 m/min, and the maximum roll spacing is 600 mm. The working roll can be set up to bend the roll; the maximum bending roll force and the rolling force are 1500 kN and 3500 kN, respectively.

Table 1.
Nominal composition of aluminum foil raw material.
Table 2.
Characteristics of aluminum foil raw material.
2.2. Optimization of Bending Roller Force
During the rolling process of aluminum foil, it is seen that the bending roll force undergoes a transition from positive to negative. The considerable amount of the change will lead to a noteworthy adjustment in the convexity parameter of the ultimate hot-rolled product, affecting the stability of the rolling process and reducing the thickness of the aluminum foil [23]. The application of the initial bending roll force in the subsequent rolling process of the hot-rolled product gives rise to many issues, including alterations in the shape of the plate and an excessive convexity of the aluminum foil. In order to mitigate the frequency of such issues, we employ an optimization approach to adjust the bending roll force setting. The positive bending force is maintained at a constant level, while the magnitude of the negative bending force is diminished. The bending roll force values for each pass in the rolling process are shown in Table 3.
Table 3.
Bending roll force setting table.
2.3. Optimization of Bending Force on Roll Gap
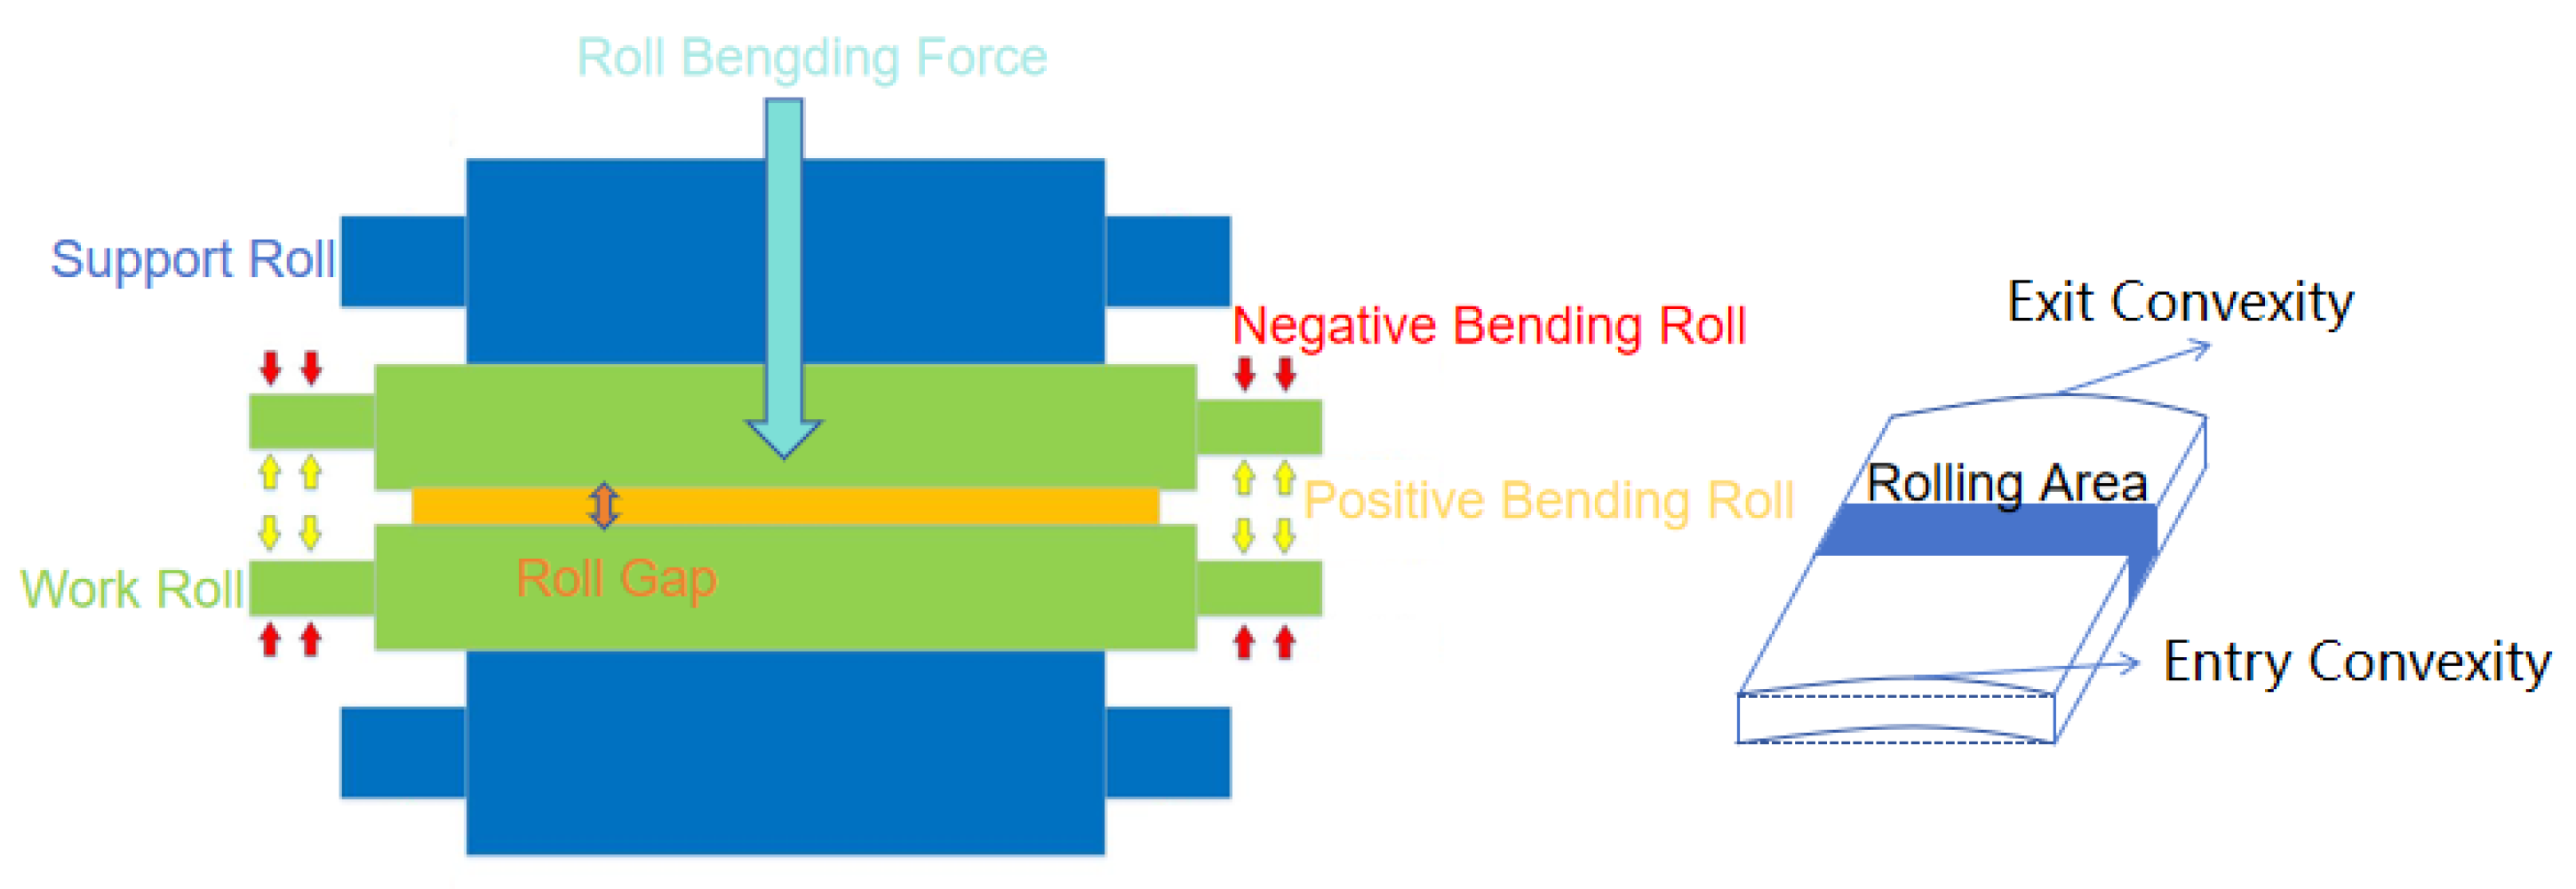
The bending rolls exhibit significant magnitudes and substantial fluctuations during the rolling procedure. The present study investigates the coupling relationship between the bending roll force and the rolling gap while maintaining a constant rolling convexity [24]. The simplified structure of the mill and workpiece is shown in Figure 1.

Figure 1.
A simple schematic diagram of the mill and workpiece.
The equation for exit convexity [25] is as follows:
The generalized bouncing equation [26] is as follows:
where Ch is exit convexity; P is rolling force; FW is working bending roll force; CH is entry convexity; KP is rolling force transverse stiffness; KFW is bending roll force transverse stiffness; KCH is exit convexity inheritance coefficient; h is hot rolled target thickness; s is roll gap value; and CP is rolling force longitudinal stiffness.
According to the production experience set, h is 6.2 × 10⁻⁶ m, P is 100 kN, and CP is 5 × 10⁷ kN/m. Substituting into the above formula, the roll seam value s calculated by the model is 4.2 × 10⁻⁶ m (without considering the effect of bending roller force on the roll seam).
When the difference between the numerical size of the hot roll bending force and the rolling force is not large, the actual exit thickness of the aluminum plate is affected by the work roll-bending force.
The bouncing equation [26] is as follows:
where hact is actual exit thickness and CFW is work roll bending longitudinal stiffness.
CP and CFW can be considered approximately equal. From the above calculation, s is 4.2 × 10⁻⁶ m, FW is 500 kN, and hact is calculated to be 7.2 × 10⁻⁶ m. It can be seen that the positive bending rolls of the working roll will increase the thickness of the head outlet.
In order to reduce the thickness of the head outlet due to the positive bending rolls of the work rolls, the roll gap can be reduced directly. Assuming that there is a variation in roll gap during the rolling process, the expression for hact is as follows:
where δs is roll gap variation.
When δs is −1 × 10⁻⁶ m, hact is calculated to be 6.2 × 10⁻⁶ m. This case does not take into account the change in rolling force when the roll gap is pressed down. When the roll gap is reduced by 1, the rolling force must increase accordingly.
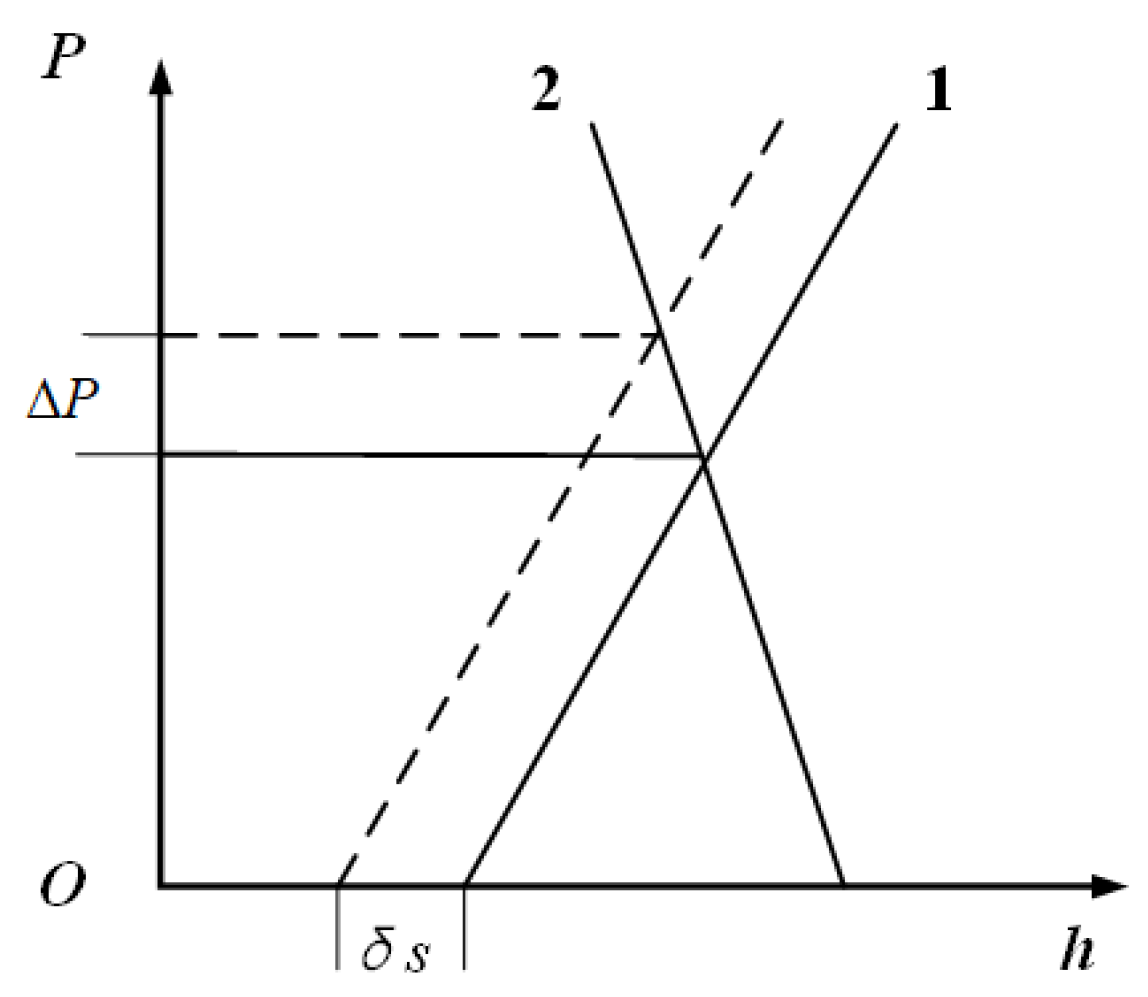
It can be seen that the roll gap should be reduced a little more. Only if δs < −1 can the actual thickness hact be 6.2 × 10⁻⁶ m. The relationship between the rolling force P, the roll gap s, and outlet thickness hact is shown in Figure 2. The horizontal coordinate in the figure is the exit thickness, and the vertical coordinate is the rolling force. Curve 1 is the mill stiffness equation with slope CP; curve 2 is the aluminum foil plastic equation with slope Q.
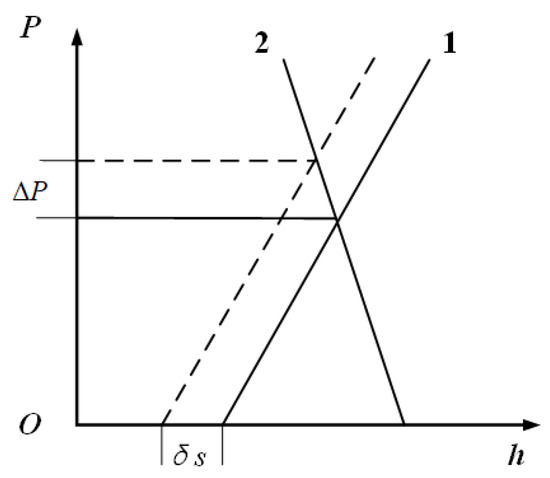
Figure 2.
Rolling force compensation for roll gap changes (curve 1 is the elasticity equation, and curve 2 is the plasticity equation).
The ΔP is calculated as follows:
where Q is the plastic stiffness of aluminum foil.
Substituting into the bouncing equations as follows:
After adjusting the roll gap, the rolling force changes. Keeping the bending roll force unchanged, the strip exit convexity Ch will change, as shown in the following equation:
Changes in the roll gap cause changes in the rolling force, and compensation for the bending roll force while the rolling force changes ensures that the exit convexity remains unchanged. By combining Equations (1) and (8), the coupling relationship between the rolling force and the bending roll force can be obtained.
The bouncing equation changes to:
By combining the previous equations, the analytical expression for the δs and ΔFW is:
2.4. Influence of the Coefficient of Thermal Expansion
Fluctuations in roll temperature during the rolling process can cause changes in the thermal expansion of the work rolls, which can affect the roll gap [27]. The formula for the effect of thermal expansion on the roll gap due to an increase in the temperature of the working roll is:
where ∆R is the thermal expansion of the work roll center; T0 is the on-board temperature; TCenter is the temperature of the center of the work roll body in the rolling process; D is the diameter of the rolls; and β is the thermal expansion coefficient.
2.5. Influence of a Rapid Increase in the Speed of Rolling Machines on Thickness
The rolling speed during the final pass is increased from 10 m/min to 130 m/min, and the speed changes dramatically. The process of speeding up the mill after coiling leads to a significant thinning of the strip thickness difference [28]. The distance between the roll gap and the thickness gauge is 2.6 m, while the distance between the beginning of the speed-up point and the beginning of the thinning point is calculated to be about 2.2 m, with a difference of 0.4 m. The distance between the roll gap and the thickness gauge leads to the thickness thinning and lagging behind the mill speed-up. At the same time, taking into account the amount of front slip of the strip, response time, data transmission time, and hydraulic cylinder execution time of the delay, it can be assumed that the thickness thinning occurs as soon as the speed increases.
It is known from the speed-up thinning law that the thickness appears to be steeply decreasing at the beginning of the speed-up section and then gradually recovering under the AGC regulation. A power of 6 equations with a decreasing rate of change is selected for compensation. The roll compensation equation is as follows:
where y is the roll gap compensation value; H is the total roll gap compensation; x is the ramp-up time; t is the total ramp-up time; V is rolling speed at ramp-up time; Vmin is rolling speed before speed-up; Vmax is rolling speed after speed-up; and a is the acceleration of the speed-up section.
3. Results and Discussion
3.1. Optimization of Bending Roll Force on Foil Thickness
The alteration in convexity’s rate of change when optimizing the bending roll force is shown in Figure 3. Following the optimization of the bending roll force, there is an observed increase in the percentage of the hot-rolled final product exhibiting a rate of change of convexity within the ±20% interval. Specifically, this percentage rises from 51.3% to 57.1%. The range of the highest probability deviation interval has been modified, shifting from 20% to 40% to a new range of 0% to 20%. It is evident that by decreasing the magnitude of the bending roll force variation, one can mitigate the rate of convexity alteration and enhance the stability of the rolling process.
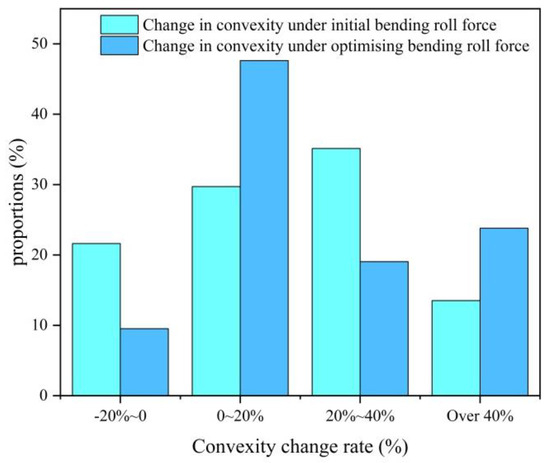
Figure 3.
Variation of convexity of the hot-rolled end product before and after optimizing.
3.2. Optimization of Bending Roll Force on Roll Gap Setting
Based on the milling procedure of measurement, the stiffness of the mill can be represented as CFW = Cp = 3.75 × 10⁻⁶ kN/m, with a corresponding value of Q = 400 kN/m. The transverse stiffness of the work roll bending force and rolling force were determined using a two-dimensional variable-thickness finite element model [29]. The calculated values for KFW and Kp were found to be 5.246 × 10⁶ kN/m and 13.587 × 10⁶ kN/m. Determine the roll gap and bending roll force adjustment by considering the bending roll force Fw values of 650 kN and −400 kN.
The simplification of Equation (11) is as follows:
The amount of compensation between the roll gap and the bending roll force is shown in Table 4. When positive bending rolls are used in the rolling process, they cause the roll gap to increase, making it susceptible to over-thickness deviation. Reducing the space between the roll gaps can exacerbate the situation. Negative bending rolls used in the rolling process cause the phenomenon of an ultra-thin head. Increasing the spacing of the roll gap can alleviate the thinning of the head. Since the finite element simulation always has errors, it cannot perfectly simulate the field mill parameters and all the rolling conditions. To correct the error, add a correction factor k2 prior to the roll gap compensation factor k1. The parameters used are shown in Table 5.
Table 4.
Compensation of roll gap and bending roll force.
Table 5.
Roll gap correction factor and roll gap compensation factor.
The relationship between the roll gap and the bending roll force is as follows:
When analyzing the effect of the bending roller force on the roll seam, the main consideration is the effect of the bending roller force on the roll seam in the positive and negative state changes. According to the relationship between the bending roller force and the head thickness difference of the strip in production, adjust the correction factor to adjust the roll gap compensation value under different bending roller forces. The corresponding relationship between the bending roll force and the thickness difference is shown in Table 6.
Table 6.
Corresponding table of bending roll force and thickness difference.
Negative bending rolls cause a thin head thickness deviation, and positive bending rolls cause a thick head thickness deviation. As can be seen from Table 6, the compensation coefficient for the third and fourth rolls is 1.6. The third roll has a positive 3% deviation under the negative bending rolls −100/−200/−500, and the fourth roll has a −4% deviation under the positive bending rolls 650/650/650. The compensation factor of 1.6 of the bending rolls for the roll seam will lead to excessive lifting of the roll seam in the case of negative bending rolls and excessive downward pressure of the roll seam in the case of positive bending rolls. Reducing the roll compensation coefficient from 1.6 to 1.0 resulted in a deviation of −1.22% at −100/−200/−500 for negative bending rolls on roll 19, and a deviation of −2.88% at 650/650/650 for positive bending rolls on roll 20. Reducing the compensation factor for the roll seam reduced the thickness deviation at the exit.
3.3. Optimization of Roll Gap by Thermal Expansion of Rolls
Measured through the rolling process to the midpoint of the work roll at a machine temperature of 33 °C, a roll diameter of 860 mm, and a coefficient of thermal expansion of 1.1 × 10⁻⁵/K. Derived from the formula for rolling in the roll seam at the midpoint of the temperature of the roll T roll thermal expansion equation:
where y0 is the compensation value of a single work roll and x is the temperature of the center of the work roll body TCenter. This formula is called the theoretical optimal compensation equation.
Select the model thermal expansion compensation coefficients of 0.92, 1.02, and 1.121. obtain the roll thermal expansion compensation equations for different thermal expansion compensation coefficients. All three are modeled compensation equations. y = 0.00503x − 0.101 for a thermal expansion compensation factor of 0.92, y = 0.00558x − 0.111 for a thermal expansion compensation factor of 1.02, and y = 0.00614x − 0.123 for a thermal expansion compensation factor of 1.12.
As the thermal expansion compensation coefficient increases, the model compensation curve is constantly close to the theoretical optimal compensation curve. The temperature corresponding to the intersection of the model compensation curve and the theoretical optimal compensation curve gradually increases, and when the roll temperature is the temperature corresponding to the intersection of the two curves, the thermal expansion compensation accuracy of the roll is at its maximum. When the temperature is greater than the intersection temperature, the larger the temperature, the smaller the compensation accuracy. When the temperature is smaller than the intersection temperature, the smaller the temperature, the smaller the compensation accuracy.
The analysis reveals that there is a common intersection of the three model compensation curves. Based on the relationship between their slopes and intercepts, a series of model compensation curves with different compensation coefficients are fitted. Thermal expansion compensation coefficient setting k1, thermal expansion compensation curve equation:
The analytic expressions for k and b are:
Measure the temperature of the work roll after the machine is at 80 °C. At this temperature, the best compensation curve single-roll compensation value is 0.443. When the model thermal expansion compensation coefficient k1 is 1.35, the analytical expression of the slope k and the intercept b is brought. When the thermal expansion compensation coefficient is 1.35, the thermal expansion compensation curve is y = 0.00735x − 0.148, and the single-roll compensation value of the model under this compensation coefficient is 0.44275. The two compensation values are relatively close to each other, so the model thermal expansion compensation coefficient can be changed to 1.35 from the present 1.12.
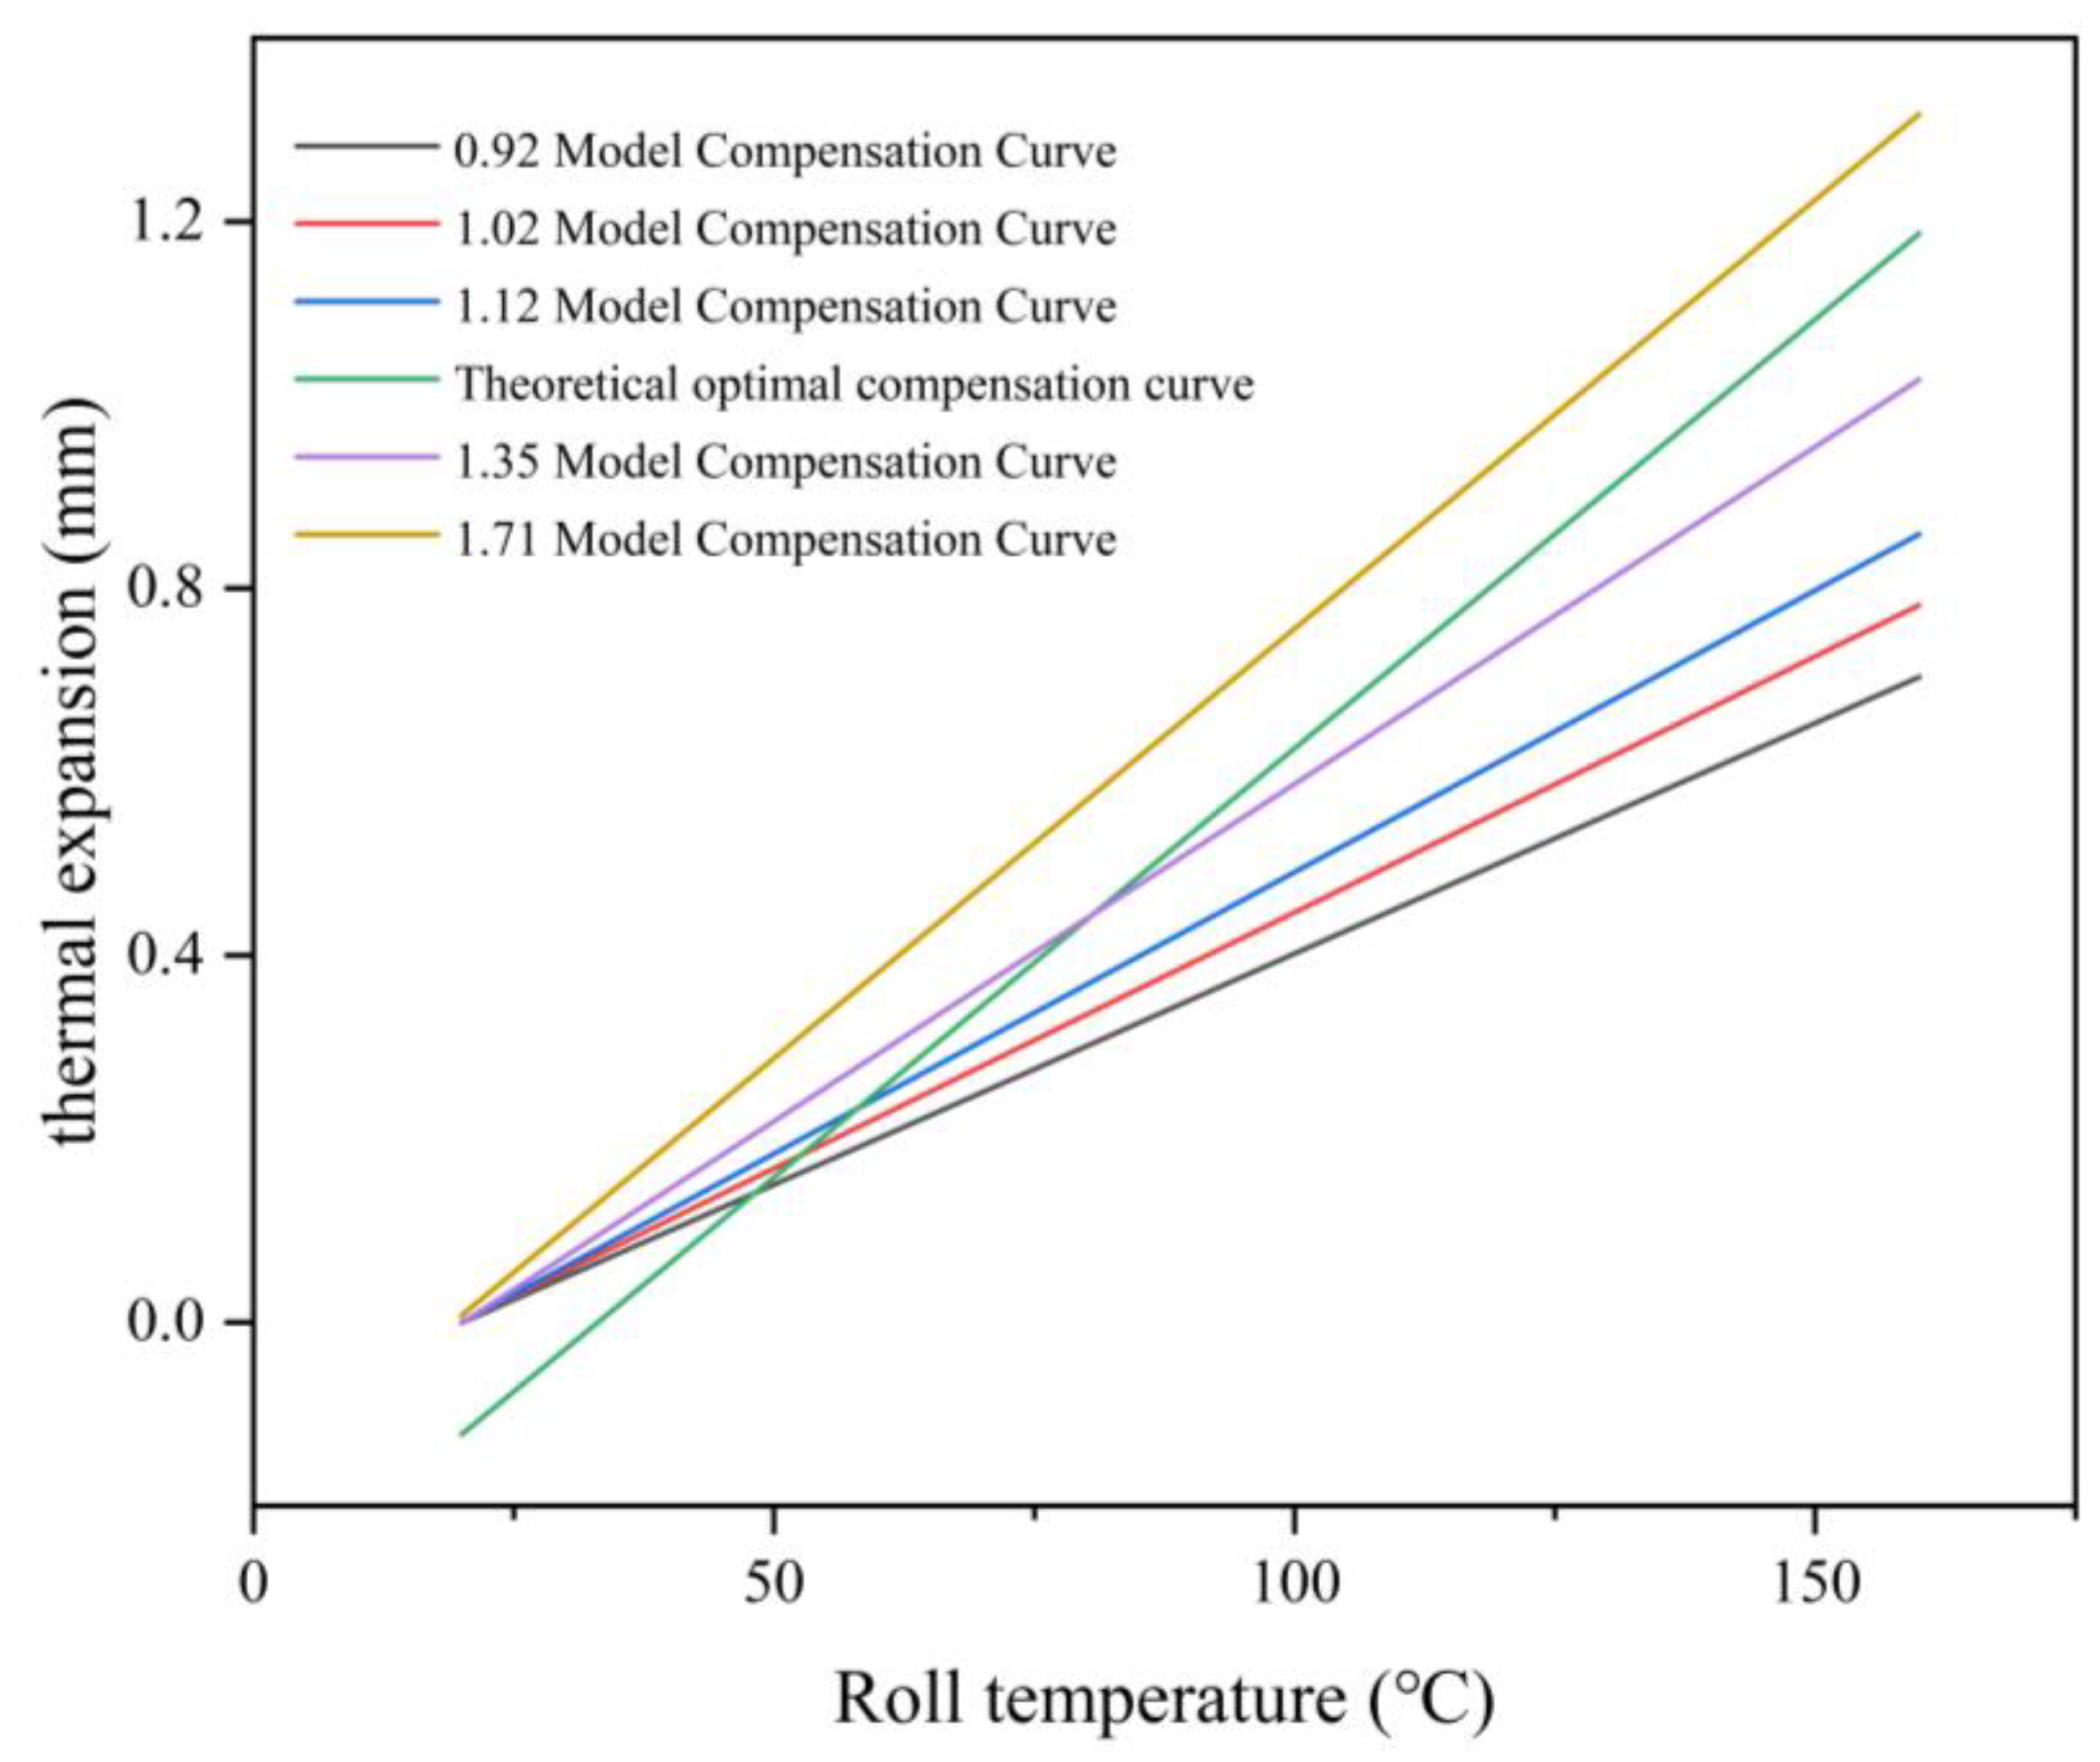
The compensation formula with a compensation factor of 1.35 is more accurate only at 80 °C. The actual rolling process roll temperature is a dynamic change. Continuing to increase the thermal expansion compensation coefficient can make the model compensation amount adapt to a wider temperature range. As the model compensation coefficient increases, the model compensation curve parallels the theoretical optimal compensation curve. This model compensation curve is called the model optimal compensation curve. The compensation curve is shown in Figure 4.
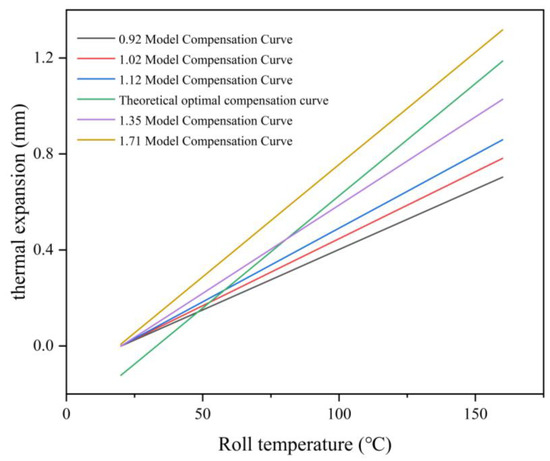
Figure 4.
Roll thermal expansion compensation curve.
This model thermal expansion expression only occurs at 80 °C when the accuracy is greater. The roll temperature is a variable in the actual rolling process. In order to adapt the modeled compensation to a wider temperature range, the thermal expansion compensation factor needs to be continuously increased. As the model correction factor rises, the model correction curve parallels the theoretical optimum correction curve; the model correction curve is called the model optimum correction curve. Since the model optimal compensation curve is parallel to the theoretical optimal compensation curve, the difference between the two curves is about 0.13 mm. The thermal expansion compensation coefficient is changed to 1.71, and the roll gap value is reduced by 0.13 mm. The model thermal expansion compensation value and the theoretical optimal compensation value are the same under different roll temperatures. Under this compensation coefficient, the error of model compensation can be eliminated when the roll temperature changes.
3.4. Optimization of Thickness Variation Induced by Rolling Mill Speed-up
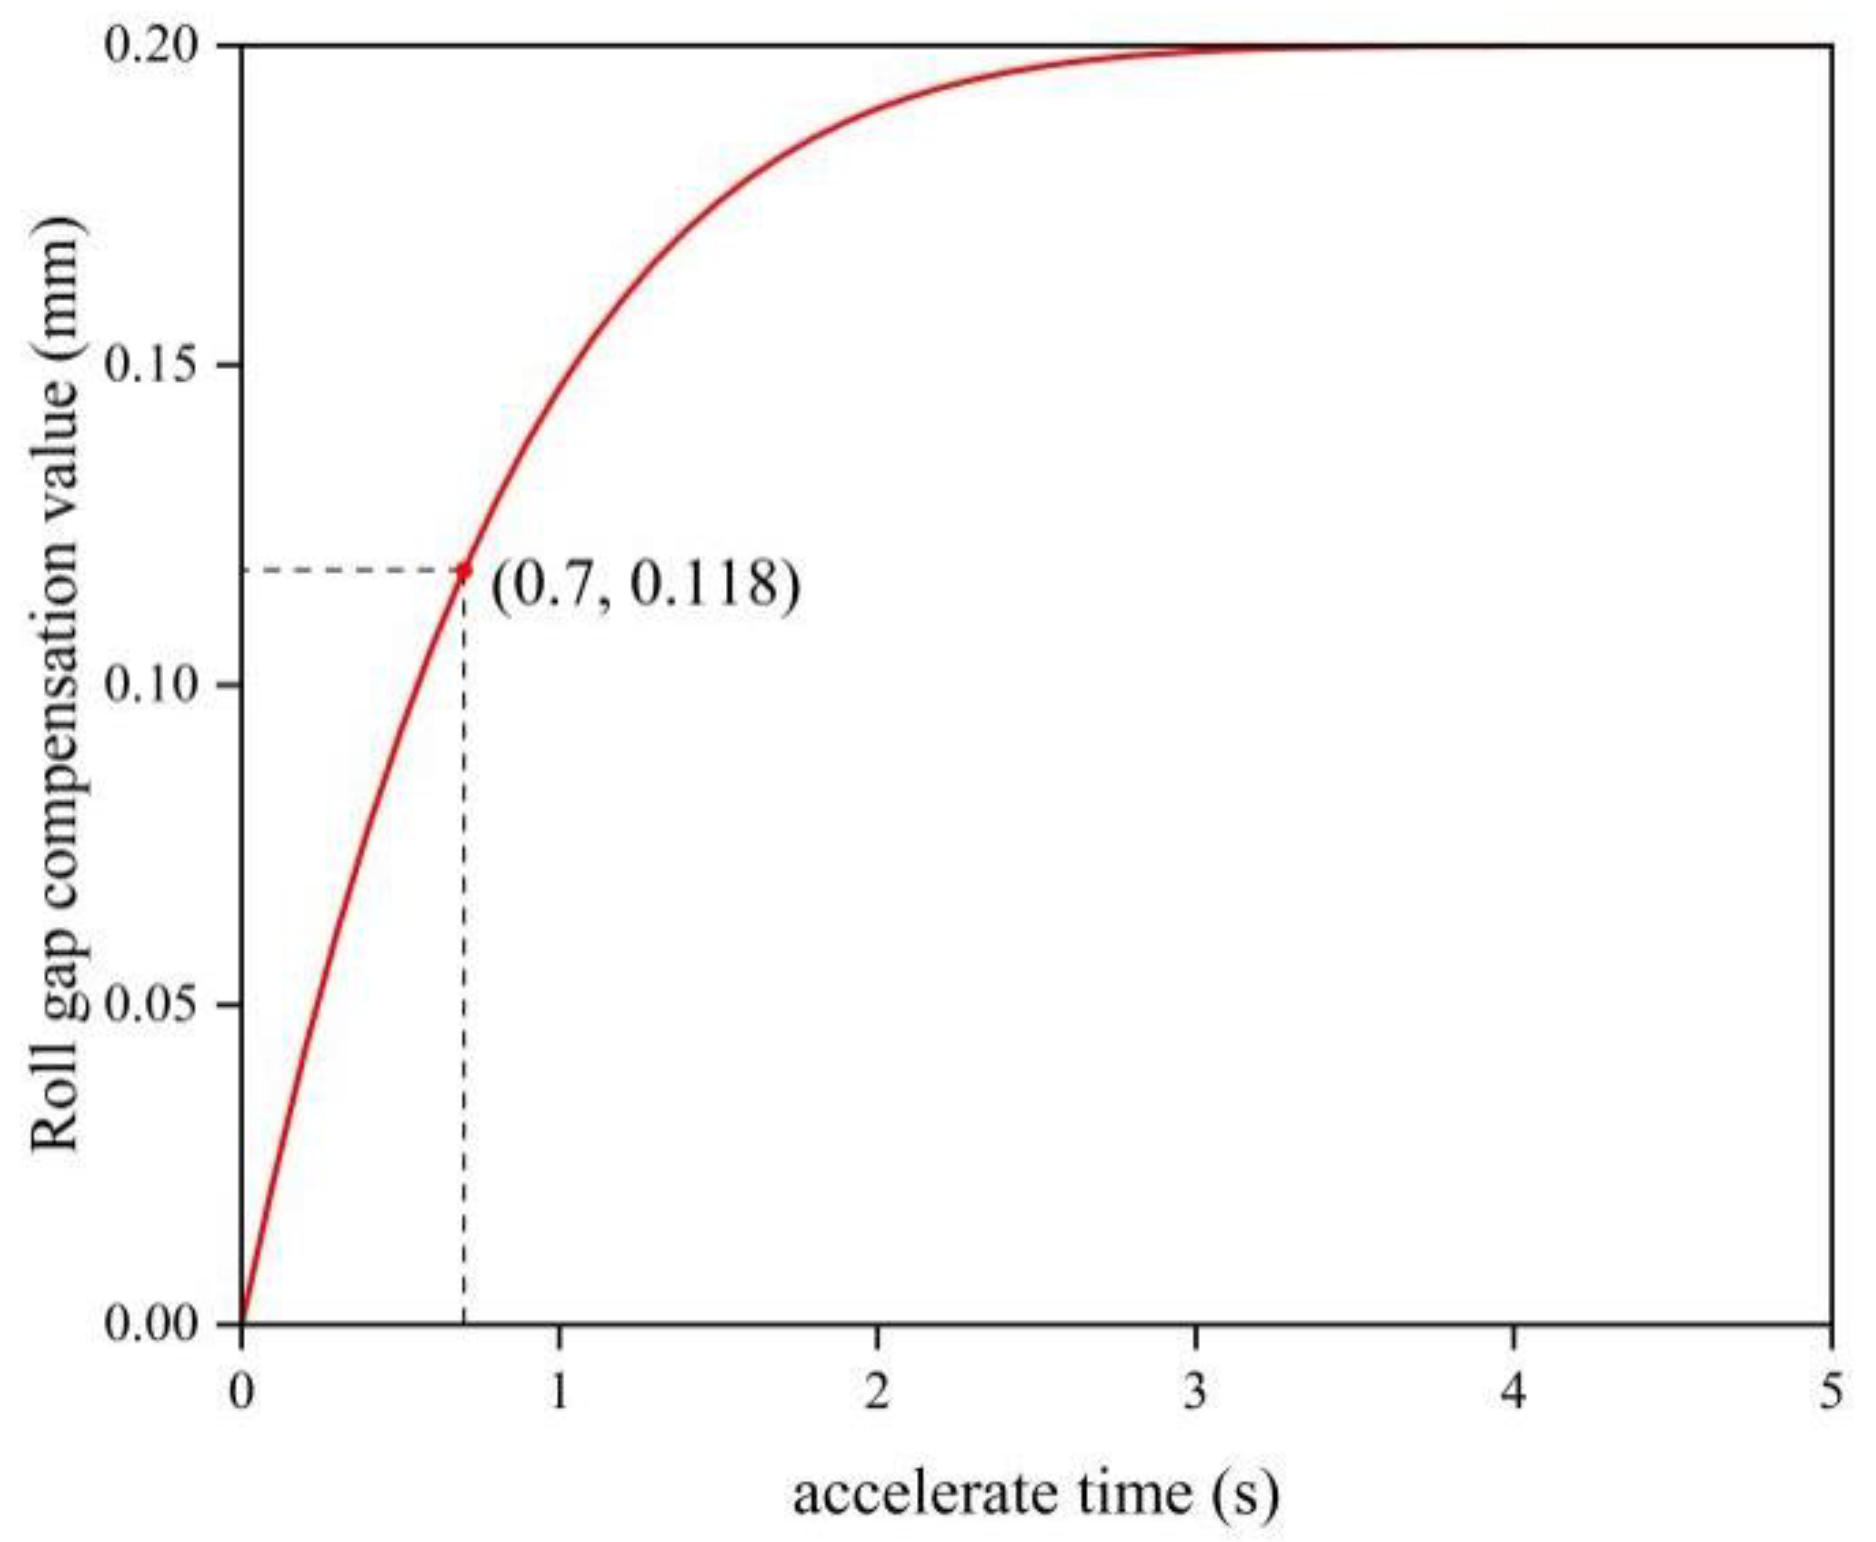
The variation ranges of thickness steepening time and thickness difference change of low-pressure material were 0.52 to 0.96 s and −2.53 to −1.38%. The mean values are 0.7 s and −1.9% (corresponding to a thickness change of 0.118 mm), and the low-pressure material ascending rate of thinning is shown in Table 7.
Table 7.
Thinning of the thickness of the velocity rise of the low-pressure material.
In order to reduce the difference in thickness, when the mill starts to speed up, the roll slit is compensated. The roll slit is lifted up by 0.2 mm during the whole speed-up interval. Where a is the acceleration of the ramp-up section, which is about 23.67 m/(min·s), the low-pressure material ramp-up compensation equation is y = −1.18 × 10⁻⁵(x − 5.07)6 + 0.2. The curve is shown in Figure 5.

Figure 5.
Low-pressure material roll gap compensation equation.
3.5. Optimization of Thickness Variation Induced by Rolling Mill Speed-up
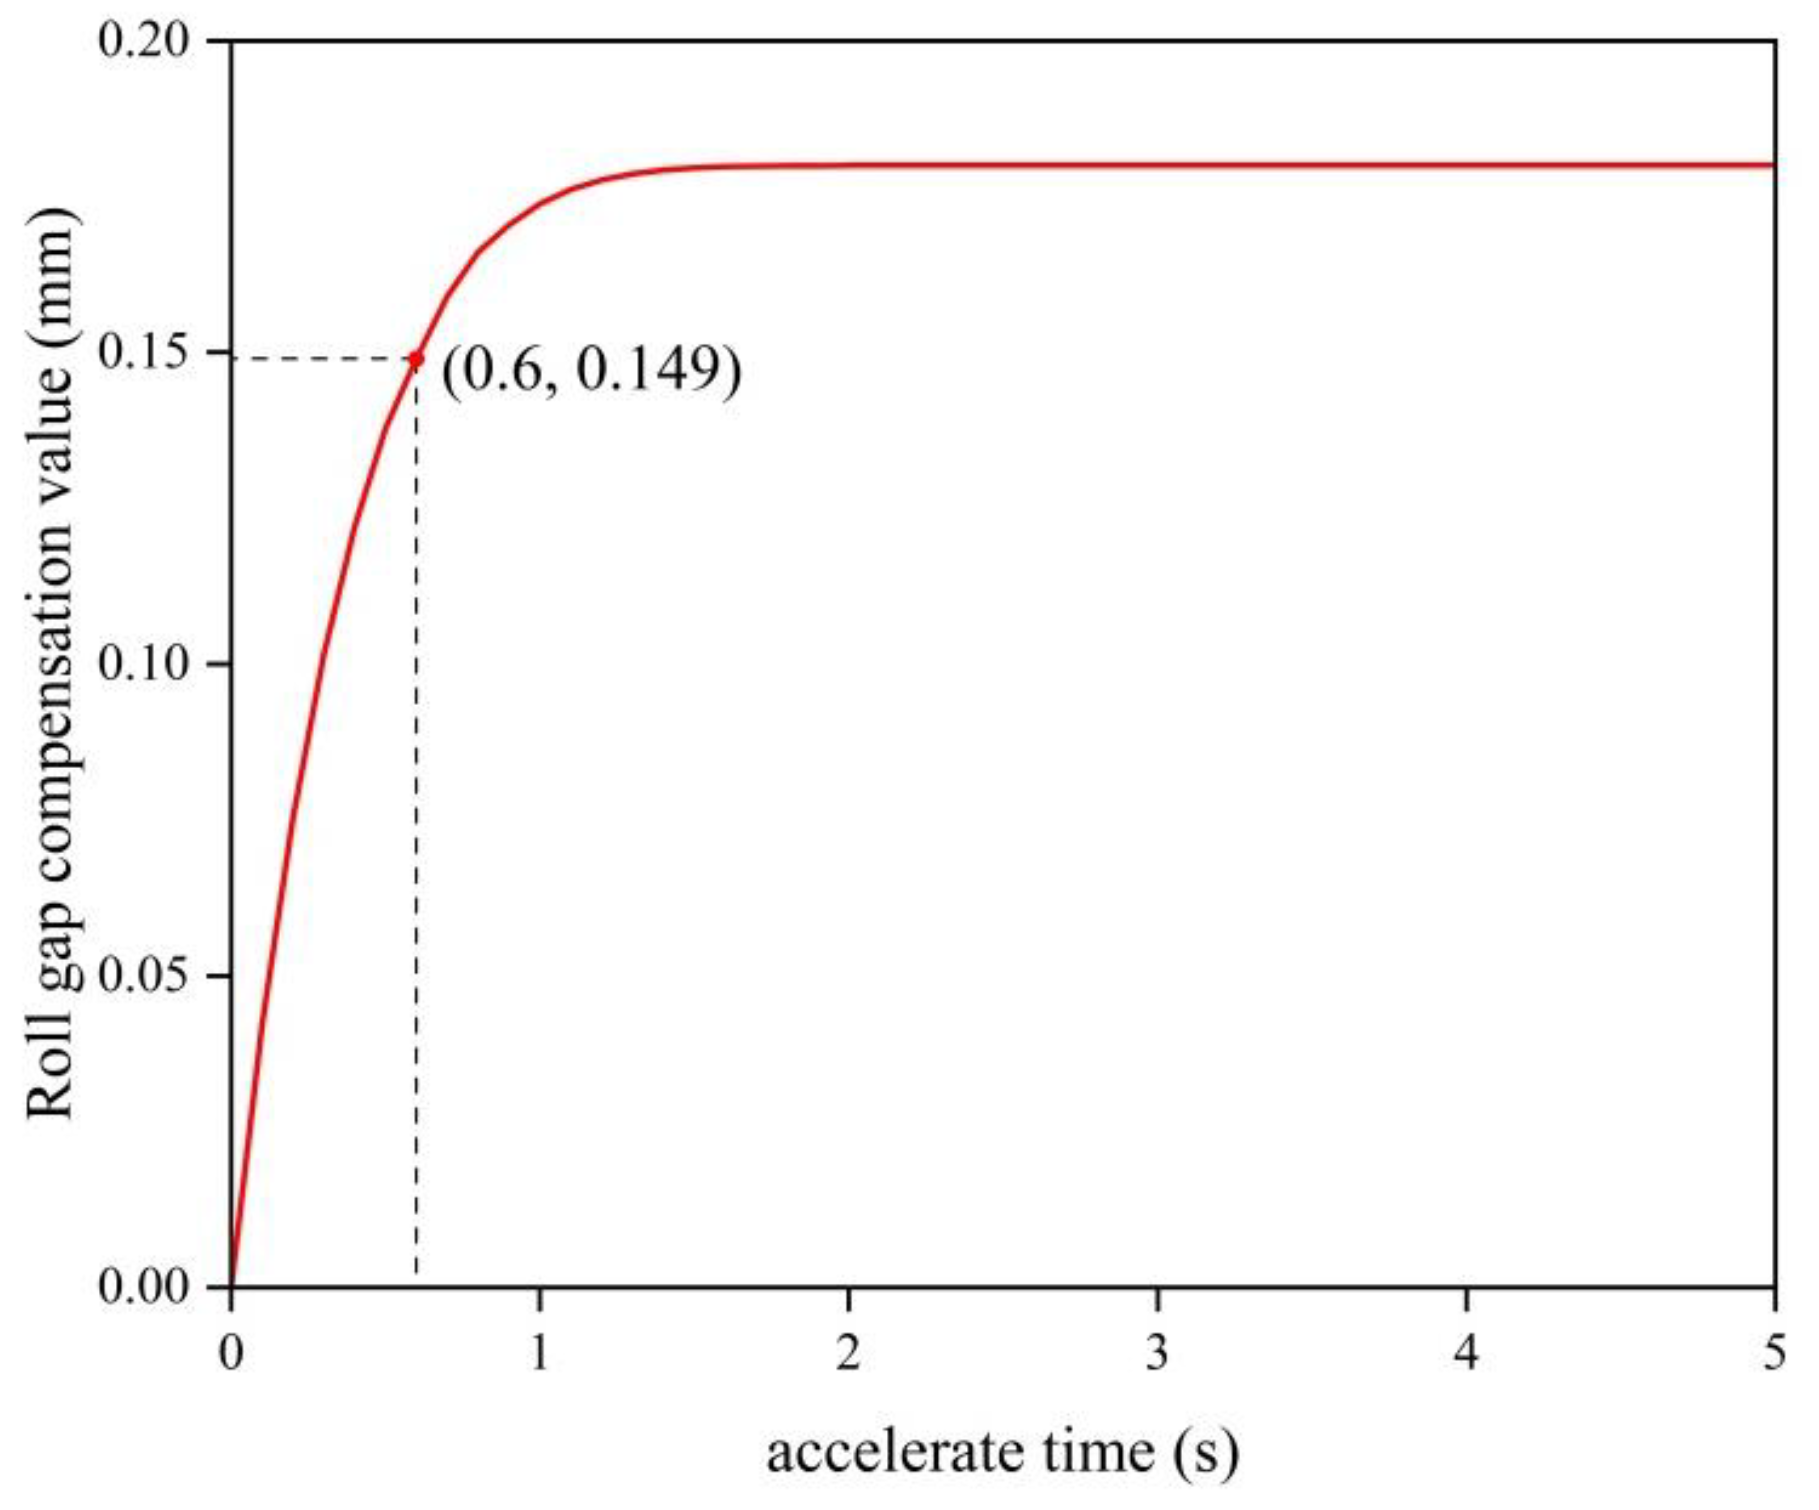
High-pressure material and low-pressure material speed up the thinning situation in the same way. The roll gap compensation equation chooses the rate of change as gradually decreasing six times the curve for compensation. High-pressure material rolling speed from 25 m/min to 80 m/min, the total compensation of the two differences. Statistics under high pressure material thickness steepening time and thickness difference change situation change range of 0.45 to 0.78 s and −4.12 to −1.54%, the average value of 0.6 s and −2.4% (corresponding to the thickness change of 0.149 mm). The high-pressure material lift-off thinning cases are shown in Table 8.
Table 8.
Thinning of the thickness of the velocity rise of the high-pressure material.
Due to the high pressure material, the speed of the first 0.6 s needs to raise the roll seam to 0.149 mm. The high-pressure material in the whole speed interval roll seam needs to be raised by 0.18 mm. The h values in the roll seam compensation equation range from 0.2 to 0.18. Vmin and Vmax are changed to 25 m/min and 80 m/min. The high-pressure material ramp-up compensation equation is y = −1.27 × 10⁻³(x − 2.3)6 + 0.18, and the curve is shown in Figure 6.
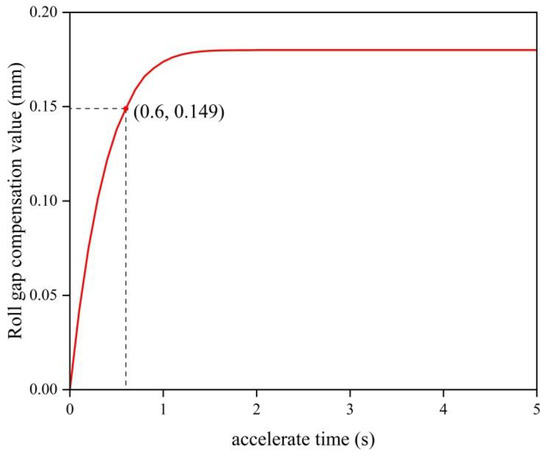
Figure 6.
High-pressure material roll gap compensation equation.
3.6. Variation of Aluminum Foil Thickness
Specific rolling experiments show that when the thickness of aluminum foil is less than the specified thickness, the mill speed-up will lead to a rapid reduction of aluminum foil thickness by 2.4%, as shown in Figure 7a; when the thickness of aluminum foil is greater than the specified value, the mill speed-up will lead to a reduction of aluminum foil thickness by 1.8%, as shown in Figure 7b; and when aluminum foil thickness deviation occurs in the rolling process, the encounter with the mill speed-up will intensify the deviation of the thickness of the aluminum foil. Through the above optimization method, the lifting height of the roll seam is corrected so that when the thickness of the aluminum foil is thicker, it changes by 0.5% in the process of mill acceleration, as shown in Figure 7c, and when the thickness of the aluminum foil is thinner, it changes by only 0.2% in the process of mill acceleration, as shown in Figure 7d. The compensation of the roll gap can effectively control the change in aluminum foil thickness within 1%, reducing the influence of the obvious thinning of aluminum foil thickness caused by the increase in rolling mill speed.
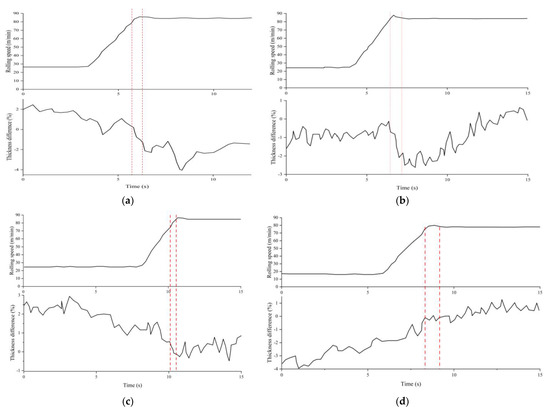
Figure 7.
Variation of head thickness difference during ramp-up: (a) thickness variation in case of thick head; (b) thickness variation in case of thin head; (c) thickness variation after optimized compensation in case of thick head; (d) thickness variation after optimized compensation in case of thin head.
4. Conclusions
This study examines the impact of various factors on the thickness variation of the aluminum foil rolling process. Specifically, it analyzes the influence of the bending roll force size, the compensation coefficient of the bending rolls for the roll gap, the thermal expansion of the rolls, and the speed-up process of the mill. The primary findings can be summarized as follows:
- (1)
- In the process of aluminum foil rolling, it is necessary to maintain a positive bending force or a lesser negative bending force while converting the bending roll force. The ideal compensation coefficient for the roll gap in this operation is determined to be 1.
- (2)
- The adjustment of aluminum foil thickness with a thermal expansion compensation factor of 1.71 demonstrates superior performance compared to a factor of 1.35 when subjected to varying roll temperatures. The compensating equations for low and high pressure materials have been selected as follows: y = −1.18 × 10⁻⁵(x − 5.07)6 + 0.2 and y = −1.27 × 10⁻³(x − 2.3)6 + 0.18. The discrepancy in thickness inside the run-up segment is constrained to a range of ±1% through optimization.
- (3)
- The enhancement of film thickness accuracy is achieved through the reduction of bending force variation and the compensation of the rolls. The prevention of significant fluctuations in the thickness of aluminum foil is achieved by optimizing the coefficient of thermal expansion and establishing compensatory equations for the roll gaps.
- (4)
- The joint optimization of bending roll force setting and roll gap compensation ensures precision in thickness. The optimization approaches are employed to regulate the disparity in thickness observed in the upper section of the hot-rolled aluminum sheet, with the aim of enhancing the yield of the resulting foil.
It has been studied that rolling force, bending force, and thermal expansion in the roll of the aluminum plate in the rolling process produce contour defects. However, the effect on the thickness of the aluminum plate is missing [30]. In this paper, by changing the bending roll force and compensating the roll gap to reduce the convexity and thickness changes in the rolling process of aluminum foil, it can effectively solve the changes in the plate shape of aluminum foil in the rolling process, but this study is only limited to the changes in the rolling parameters, and when the equipment and raw materials change, the setting of the rolling parameters may be inaccurate. In the next step, more rolling experiments can be carried out with different raw materials to further optimize the parameters and improve the shape change of aluminum foil.
Author Contributions
Conceptualization, Z.L.; investigation, X.Z.; writing—original draft preparation, X.Z.; writing—review and editing, Z.L.; project administration, Z.L. All authors have read and agreed to the published version of the manuscript.
Funding
This work was supported by the Science and Technology Development Program of Xinjiang Province, grant number 2022LQ01004.
Data Availability Statement
The data presented in this study are available upon request from the corresponding author. The data are not publicly available due to privacy.
Conflicts of Interest
The authors declare no conflicts of interest.
References
- Zhang, D.; Tan, C.; Ou, T.; Zhang, S.; Li, L.; Ji, X. Constructing advanced electrode materials for low-temperature lithium-ion batteries: A review. Energy Rep. 2022, 8, 4525–4534. [Google Scholar] [CrossRef]
- Kim, T.; Song, W.; Son, D.Y.; Ono, L.K.; Qi, Y. Lithium-ion batteries: Outlook on present, future, and hybridized technologies. J. Mater. Chem. A 2019, 7, 2942–2964. [Google Scholar] [CrossRef]
- Divakaran, A.M.; Minakshi, M.; Bahri, P.A.; Paul, S.; Kumari, P.; Divakaran, A.M.; Manjunatha, K.N. Rational design on materials for developing next generation lithium-ion secondary battery. Prog. Solid State Chem. 2021, 62, 100298. [Google Scholar] [CrossRef]
- Barbosa, J.C.; Gonçalves, R.; Costa, C.M.; Lanceros-Mendez, S. Recent advances on materials for lithium-ion batteries. Energies 2021, 14, 3145. [Google Scholar] [CrossRef]
- Mohamed, N.; Allam, N.K. Recent advances in the design of cathode materials for Li-ion batteries. RSC Adv. 2020, 10, 21662–21685. [Google Scholar] [CrossRef]
- Chai, S.; Xiao, X.; Li, Y.; An, C. Graphene-Coated 1D MoTe2 Nanorods as Anode for Enhancing Lithium-Ion Battery Performance. Chin. J. Struct. Chem. 2022, 41, 2208018–2208024. [Google Scholar]
- Zhu, P.; Gastol, D.; Marshall, J.; Sommerville, R.; Goodship, V.; Kendrick, E. A review of current collectors for lithium-ion batteries. J. Power Sources 2021, 485, 229321. [Google Scholar] [CrossRef]
- Li, J.; Fleetwood, J.; Hawley, W.B.; Kays, W. From materials to cell: State-of-the-art and prospective technologies for lithium-ion battery electrode processing. Chem. Rev. 2021, 122, 903–956. [Google Scholar] [CrossRef]
- Gabryelczyk, A.; Ivanov, S.; Bund, A.; Lota, G. Corrosion of aluminium current collector in lithium-ion batteries: A review. J. Energy Storage 2021, 43, 103226. [Google Scholar] [CrossRef]
- Bonatti, C.; Mohr, D. Anisotropic viscoplasticity and fracture of fine grained metallic aluminum foil used in Li-ion batteries. Mater. Sci. Eng. A 2016, 654, 329–343. [Google Scholar] [CrossRef]
- Li, T.; Bo, H.; Cao, H.; Lai, Y.; Liu, Y. Carbon-coated aluminum foil as current collector for improving the performance of lithium sulfur batteries. Int. J. Electrochem. Sci. 2017, 12, 3099–3108. [Google Scholar] [CrossRef]
- Hu, Z.; Zhu, N.; Wei, X.; Zhang, S.; Li, F.; Wu, P.; Chen, Y. Efficient separation of aluminum foil from mixed-type spent lithium-ion power batteries. J. Environ. Manag. 2021, 298, 113500. [Google Scholar] [CrossRef]
- Zhong, H.; Sang, L.; Ding, F.; Song, J.; Mai, Y. Conformation of lithium-aluminium alloy interphase-layer on lithium metal anode used for solid state batteries. Electrochim. Acta 2018, 277, 268–275. [Google Scholar] [CrossRef]
- Jovanović, M.T.; Nenad, I.L.I.Ć.; Cvijović-Alagić, I.; Maksimović, V.; Slavica, Z.E.C. Multilayer aluminum composites prepared by rolling of pure and anodized aluminum foils. Trans. Nonferrous Met. Soc. China 2017, 27, 1907–1919. [Google Scholar] [CrossRef]
- Liu, X.; Xiao, H. Theoretical and experimental study on the producible rolling thickness in ultra-thin strip rolling. J. Mater. Process. Technol. 2020, 278, 116537. [Google Scholar] [CrossRef]
- Sun, J.L.; Peng, Y.; Liu, H.M. Dynamic characteristics of cold rolling mill and strip based on flatness and thickness control in rolling process. J. Cent. South Univ. 2014, 21, 567–576. [Google Scholar] [CrossRef]
- Hu, Y.; Sun, J.; Peng, W.; Zhang, D. Nash equilibrium-based distributed predictive control strategy for thickness and tension control on tandem cold rolling system. J. Process Control 2021, 97, 92–102. [Google Scholar] [CrossRef]
- Müller, M.; Prinz, K.; Steinboeck, A.; Schausberger, F.; Kugi, A. Adaptive feedforward thickness control in hot strip rolling with oil lubrication. Control Eng. Pract. 2020, 103, 104584. [Google Scholar] [CrossRef]
- Wehr, M.; Stenger, D.; Schätzler, S.; Beyer, R.; Abel, D.; Hirt, G. Online model adaptation in cold rolling for improvement of thickness precision. IFAC-PapersOnLine 2020, 53, 10372–10379. [Google Scholar] [CrossRef]
- Du, X.Z.; Yang, Q.; Lu, C.; Wang, A.L.; Kiet, T.A. Optimization of short stroke control preset for automatic width control of hot rolling mill. J. Iron Steel Res. Int. 2010, 17, 16–20. [Google Scholar] [CrossRef]
- Hu, Y.J.; Sun, J.; Wang, Q.L.; Yin, F.C.; Zhang, D.H. Characteristic analysis and optimal control of the thickness and tension system on tandem cold rolling. Int. J. Adv. Manuf. Technol. 2019, 101, 2297–2312. [Google Scholar] [CrossRef]
- Prinz, K.; Steinboeck, A.; Kugi, A. Optimization-based feedforward control of the strip thickness profile in hot strip rolling. J. Process Control 2018, 64, 100–111. [Google Scholar] [CrossRef]
- Yang, L.; Hu, J.; Ning, L.; Liu, Y. Research on influence of rolling parameters on the rolling process based on numerical simulation. Int. J. Model. Identif. Control 2009, 7, 25–32. [Google Scholar] [CrossRef]
- Jung, C.; Zaefferer, M.; Bartz-Beielstein, T.; Rudolph, G. Metamodel-based optimization of hot rolling processes in the metal industry. Int. J. Adv. Manuf. Technol. 2017, 90, 421–435. [Google Scholar] [CrossRef]
- Hu, Y.; Sun, J.; Shi, H.; Peng, W.; Zhang, D.; Zhang, K. Distributed model predictive control based on neighborhood optimization for thickness and tension control system in tandem cold rolling mill. ISA Trans. 2022, 129, 206–216. [Google Scholar] [CrossRef] [PubMed]
- Liu, G.M.; Di, H.S.; Zhou, C.L.; Li, H.C.; Liu, J. Tension and thickness control strategy analysis of two stands reversible cold rolling mill. J. Iron Steel Res. Int. 2012, 19, 20–25. [Google Scholar] [CrossRef]
- Bagheripoor, M.; Bisadi, H. Effects of rolling parameters on temperature distribution in the hot rolling of aluminum strips. Appl. Therm. Eng. 2011, 31, 1556–1565. [Google Scholar] [CrossRef]
- Zeng, B.; Wu, J.; Zhang, H. Numerical simulation of multi-pass rolling force and temperature field of plate steel during hot rolling. J. Shanghai Jiaotong Univ. (Sci.) 2011, 16, 141–144. [Google Scholar] [CrossRef]
- Jiang, L.Y.; Chen, Y.F.; Liang, J.L.; Li, Z.L.; Wang, T.; Ma, L.F. Modeling of layer thickness and strain for the two-layered metal clad plate rolling with the different roll diameters. J. Mater. Res. Technol. 2023, 28, 3849–3864. [Google Scholar] [CrossRef]
- Liu, C.; Wu, H.; He, A.; Han, W.; Ma, B.; Zhang, H. Formation mechanism and control strategy of M-shaped and W-shaped profile defects in hot rolling of aluminum plate. Metall. Res. Technol. 2023, 120, 111. [Google Scholar] [CrossRef]


Disclaimer/Publisher’s Note: The statements, opinions and data contained in all publications are solely those of the individual author(s) and contributor(s) and not of MDPI and/or the editor(s). MDPI and/or the editor(s) disclaim responsibility for any injury to people or property resulting from any ideas, methods, instructions or products referred to in the content. |
© 2024 by the authors. Licensee MDPI, Basel, Switzerland. This article is an open access article distributed under the terms and conditions of the Creative Commons Attribution (CC BY) license (https://creativecommons.org/licenses/by/4.0/).