Abstract
Due to its excellent performance, 90-10 cupronickel has been widely used as a pipeline for marine engineering. However, due to the harsh service conditions of flowing seawater, the problem of corrosion leakage is extremely serious. One of the most common locations is the welding joint. In this paper, electrochemical impedance spectroscopy, surface morphology analysis techniques (scanning electron spectroscopy, energy disperse spectroscopy, three-dimensional microscopy, Raman spectroscopy, X-ray photoelectron spectroscopy) are used to study the corrosion resistance of 90-10 cupronickel (MZ), heat affected zone (HAZ) and welding zone (WZ). The experimental results show that MZ, HAZ and WZ can form protective corrosion product film in flowing seawater, and that the corrosion resistance increases with the experiment time increasing and achieves the maximum value after 20 days. However, the corrosion resistance of HAZ is smallest due to the low adhesion density of corrosion production formed on HAZ. HAZ is preferentially corroded for minimum corrosion resistance and galvanic corrosion between WZ and HAZ.
1. Introduction
Seawater pipelines used for extinguishing and cooling suffer serious corrosion damage in flowing seawater, including flow-accelerated corrosion and galvanic corrosion [1,2], so the corrosion leakage problem is very severe and seriously threatens the safety and reliability of ships [3]. A 90-10 cupronickel has excellent resistance against flowing seawater as it can autonomously form a dense oxide film in seawater [4,5]. Fourteen years’ field experiments revealed that 90-10 cupronickel has good resistance against both quiet and low flowing seawater [6]; thus, it is widely used as the seawater pipeline of ships. Many studies have been carried out to study cupronickel’s anticorrosion properties, such as the influence of alloy composition on corrosion resistance [7,8,9], the formation of a protective film [10,11,12,13], corrosion resistance increases with increasing Ni content and immersion time [7], and when the Fe content is in the range of 1.0~2.0%, 90-10 cupronickel is the most anticorrosive [4,8,9]. Reference [12] reveals that the corrosion product film formed on the 90-10 cupronickel is rich in Ni and Fe and poor in Cu, and the corrosion resistance is much higher than the un-filmed sample.
However, there is limited flowing velocity for 90-10 cupronickel, which should not be more than 4.4 m/s [14]. Higher velocity induces shear stress exceeding the binding force of the corrosion product film, resulting in the occurrence of localized corrosion or accelerated general corrosion [14,15,16]. In the service condition of flowing seawater, the corrosion leakage problem of the 90-10 cupronickel pipeline still occurs from time to time, especially the corrosion of the welding joint. Research reports that the microstructure of HAZ changes non-uniformly, and corrosion impendence decreases due to the heat influence of the weld. Galvanic corrosion is another reason for the corrosion leakage of welding joints due to the different compositions and microstructures between WZ and HAZ [17,18]. The welding wire contains more elements of Ni and Ti compared to 90-10 cupronickel, leading to different microstructures and different open circuit potential between WZ and HAZ, and there is a risk of accelerating galvanic corrosion.
However, there are few studies on the corrosion behavior and corrosion production properties of 90-10 cupronickel welding joints, especially the influence of flowing velocity and corrosion production on corrosion behavior. In this paper, electrochemical methods, 3D morphology, SEM, EDS and XPS were used to study the influence of flowing velocity and corrosion production on the corrosion behavior of welding joints. Finally, the corrosion mechanism of the welding joint was analyzed.
2. Materials and Experiments
2.1. Materials
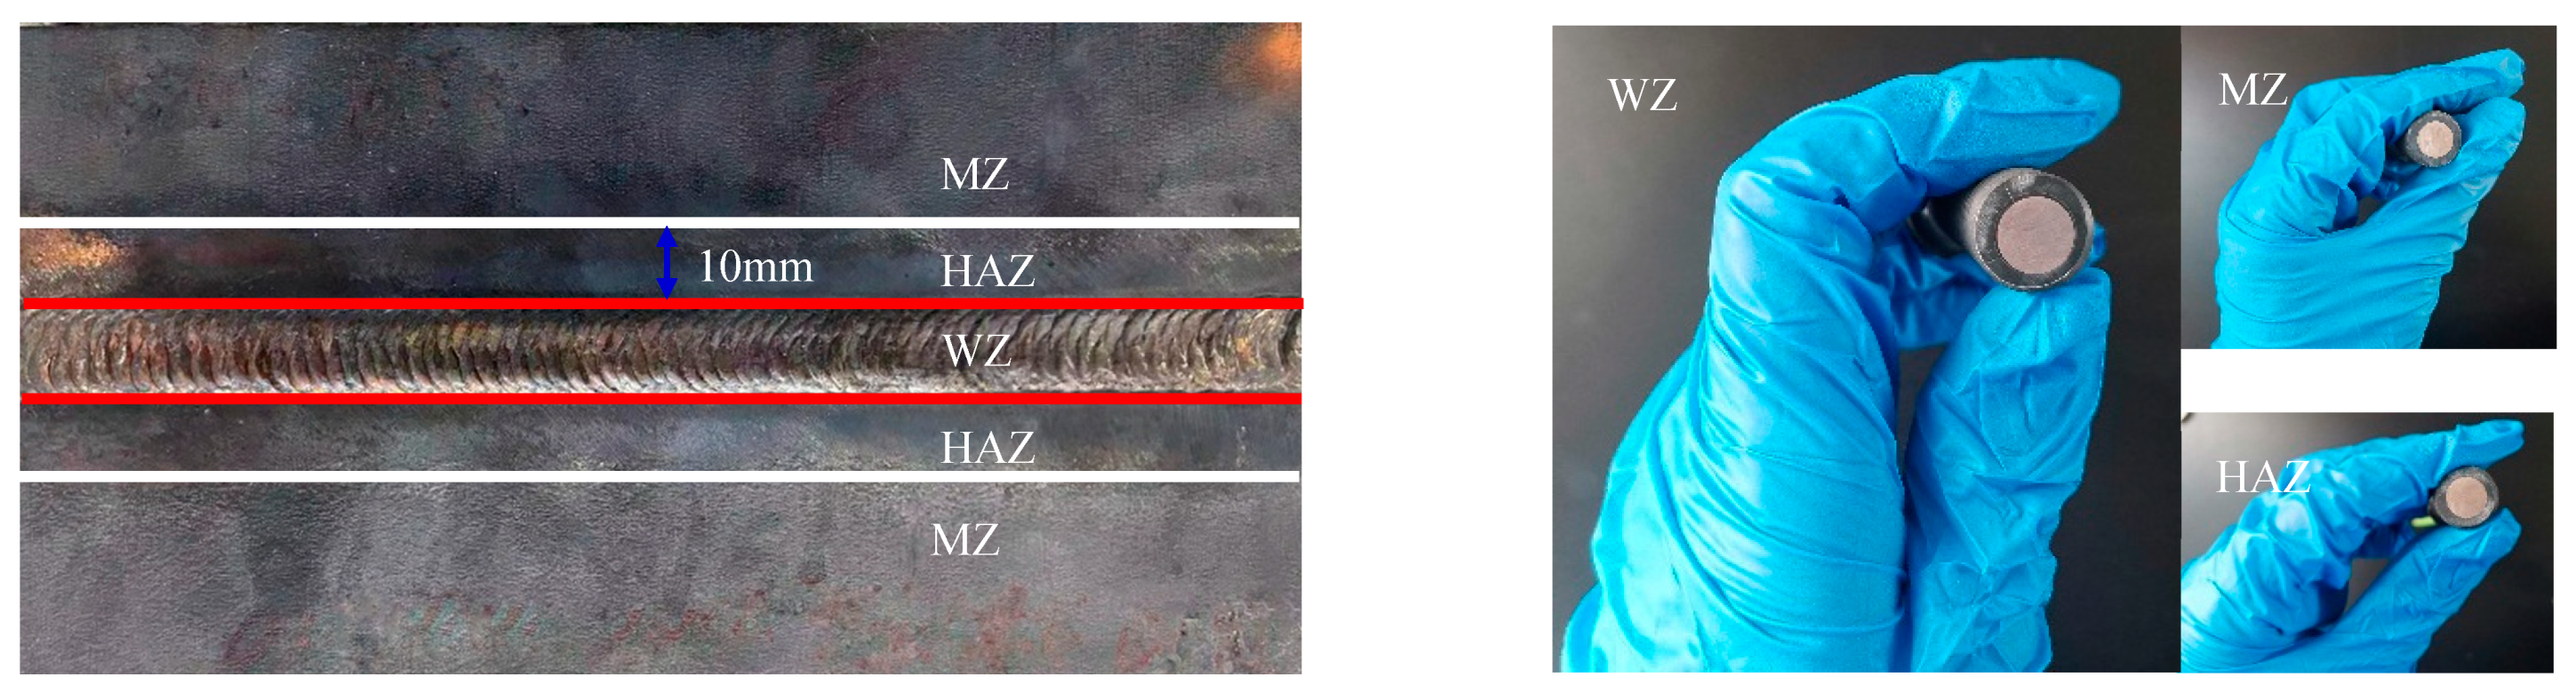
Two 90-10 cupronickel plates were welded by tungsten inert gas welding technology. HSCuNi (Luoyang Ship material research institute, Luoyang, Henan, Chian) was used as the welding material, and the chemical compositions of 90-10 cupronickel and HSCuNi are shown in Table 1. The specimens of MZ, HAZ and WZ were cut from a welded 90-10 cupronickel plate for electrochemical testing, as shown in Figure 1, and the dimension of the specimen was Φ10 mm × 10 mm. One of the circle faces was used as the working surface and the remaining surfaces were sealed with epoxy resin. The working surface was polished using 2000-grid abrasive paper, cleaned with anhydrous ethanol and dried with cold wind.

Table 1.
Chemical compositions of 90Cu-10Ni cupronickel and HSCuNi (wt.%).
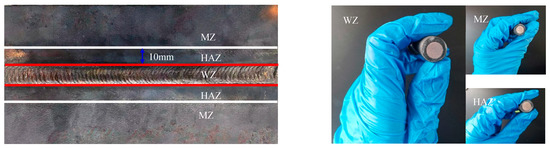
Figure 1.
Schematic diagram of cutting position of MZ, HAZ and WZ specimens.
2.2. Electrochemical Experiments
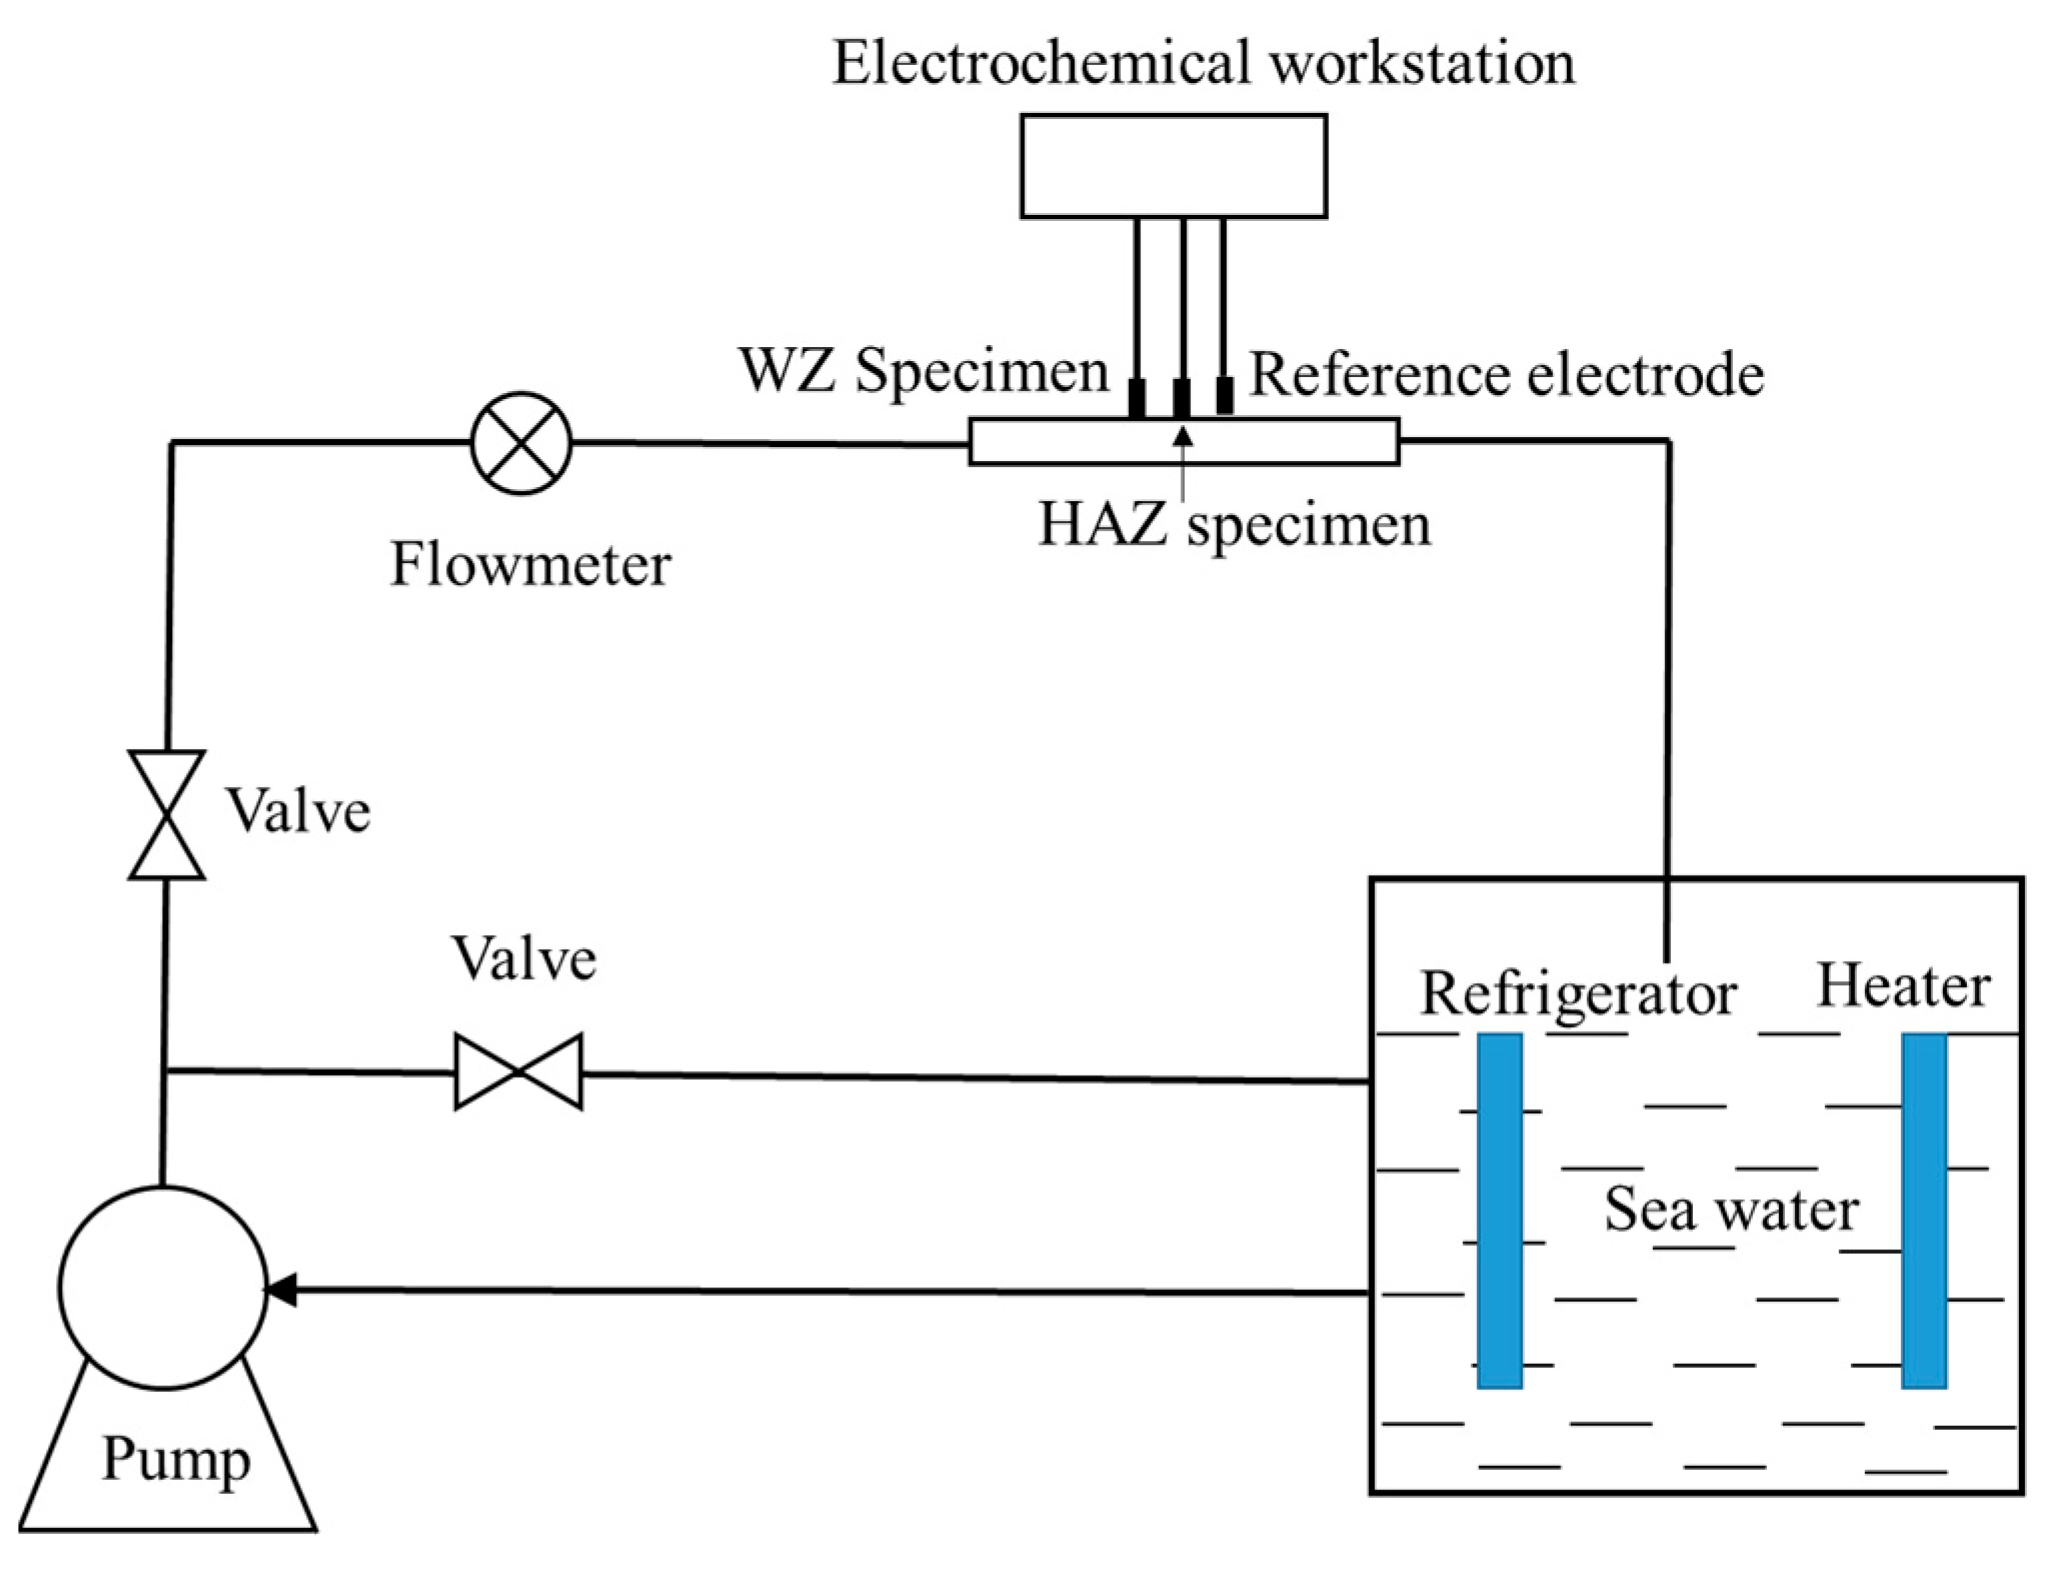
Electrochemical experiments were carried out in a flowing seawater device, as shown in Figure 2. The flowing velocity of seawater was controlled in the range of 0 to 5 m/s by valves and measured in situ by a flowmeter. The temperature was controlled at 20 ± 0.5 °C by a refrigerator and heater. The electrochemical impedance spectrum (EIS, Ivium Technologies, AJ Eindhoven, Netherlands) test was carried out at an Ivium-N-Sart electrochemical workstation after the open circuit potential was stabilized. The EIS frequency signal was set to 1 × 10⁵~1 × 10⁻² Hz and AC amplitude was 10 mV. Ag/AgCl (SSE) was used as the reference electrode and noble metal oxide electrode was selected as the counter electrode.

Figure 2.
Schematic diagram of a device for electrochemical measurement in flowing seawater.
Galvanic potential and current were continuously measured for 30 days at the flowing velocities of 0 m/s, 1 ± 0.1 m/s, 2 ± 0.1 m/s, 3 ± 0.1 m/s, 4 ± 0.1 m/s and 5 ± 0.1 m/s, respectively. The area ratio was 1:1, and the reference electrode was Ag/AgCl. In order to check the data repeatability, two HAZ/WZ couples were prepared for electrochemical experiments.
2.3. Metallographic and Corrosion Production Component Analysis
MZ, HAZ and WZ of 90-10 cupronickel were cut, polished and etched by a mixture of 30 mL CH3COOH (75%), 20 mL HNO3 (65%) and 30 mL CH3CH2CHO. A DMI5000M optical microscope (Leica Camera AG, Germany) was used for metallographic study, and higher resolution examination was carried out by ULTRA55 scanning electron microscope (SEM, Zeiss Microscopy, Jena, Germany) and HIROX KH-8700 3D digital microscope (Shibata Co., Ltd., Tokyo, Japan).
Oxford X-Max energy dispersive spectrometry (EDS, Oxford Instruments, Oxford, UK), HORIBA Labraw HE Evolution Raman spectrum analyzer (Horiba Scientific, Lyon, France) and Thermo K-Alpha+ XPS energy spectrum analyzer (ThermoFisher Scientific, Waltham, MA, USA) were used to characterize the chemical compositions of corrosion production on MZ, HAZ and WZ before and after corrosion. The XPS sputtering method was used to analyze the chemical compositions of corrosion production at various depths, and Al was used to produce Ka (1486.6 eV) radiation.
2.4. Scanning Kelvin Probe Test
The SKP test was conducted on Ametec’s VersaSCAN electrochemical scanning workstation (Ametek Scientific Instruments, Philadelphia, USA), and all tests were carried out at room temperature. During the experiments, the vibration amplitude of the scanning probe was 30 μm, and the average distance between the scanning probe and the specimen was 100 μm. The total scanning range was 14 mm × 6 mm, and the step size was 300 μm.
3. Results
3.1. Metallography Study
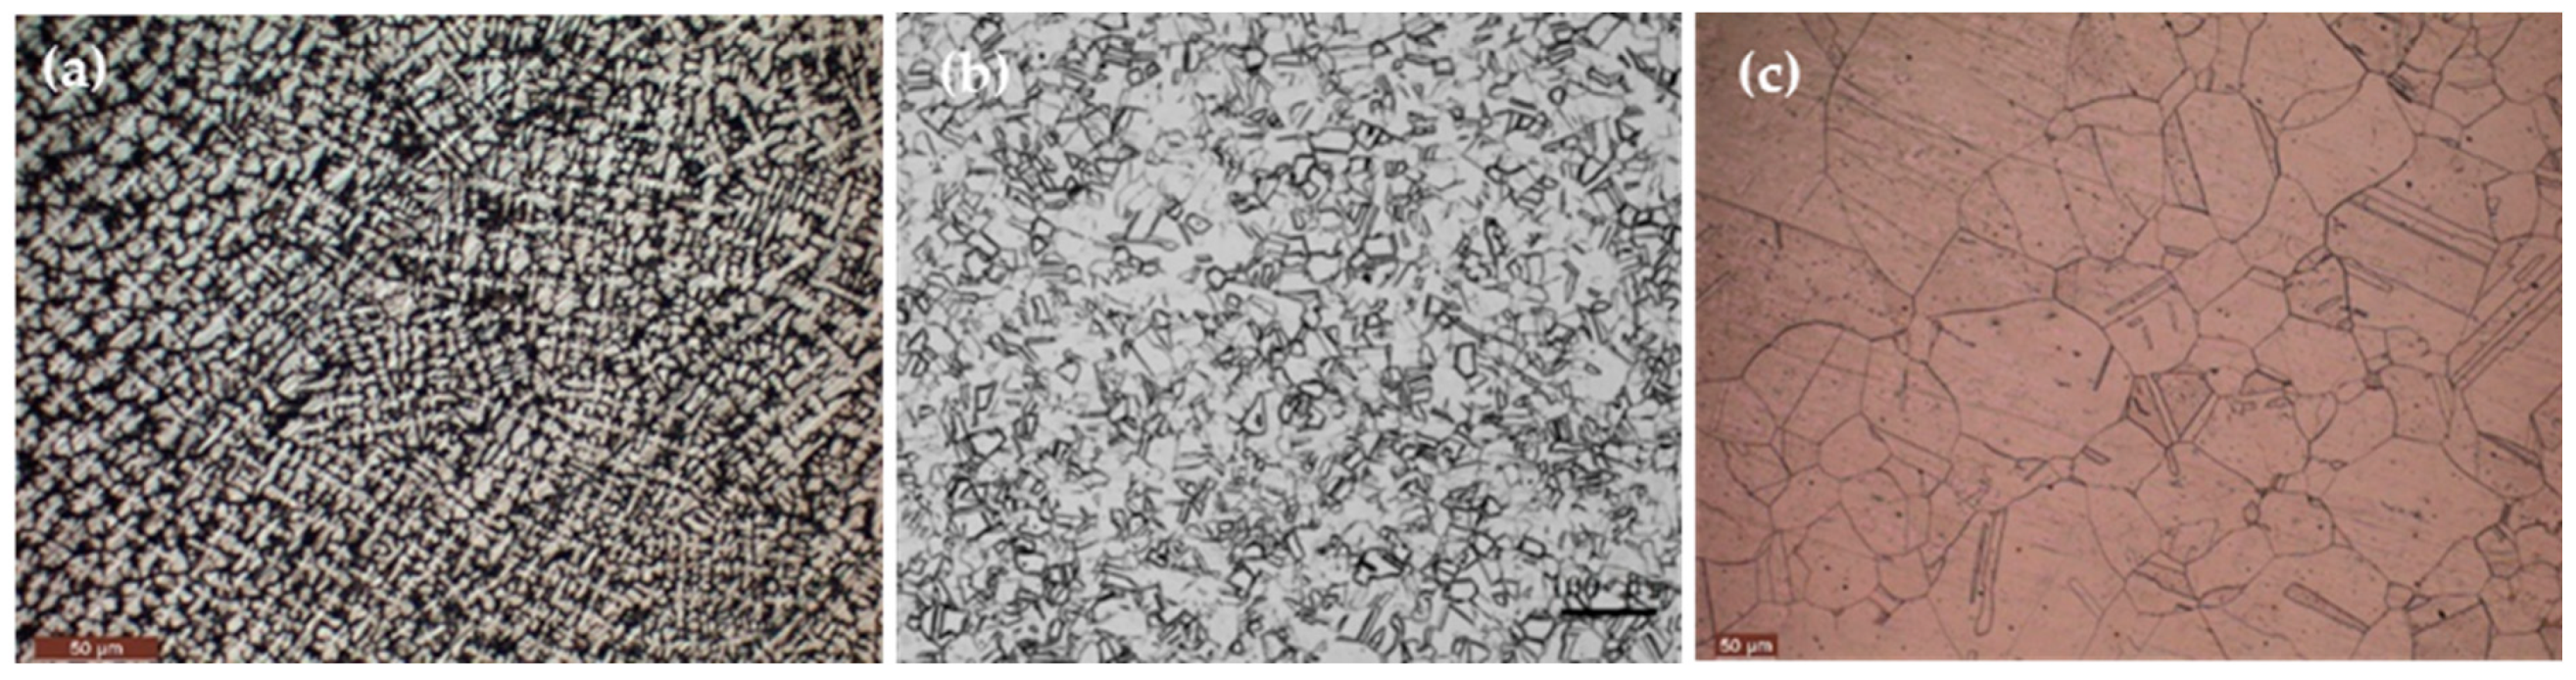
The metallography of WZ, MZ and HAZ is shown in Figure 3. Figure 3a clearly shows that the metallographic structure of WZ is single α phase with cell crystals between the dendrites, and the grain size range is 15~25 μm. Compared to the grains’ size of 90-10 cupronickel, as shown in Figure 3b, the crystal grains of HAZ shown in Figure 3c are coarser, and the size of some grains is bigger than 100 μm, indicating the grains’ size of HAZ is more non-uniform, which is affected by the high temperature of welding. Usually, the more uniform the grain size, the higher the corrosion resistance of metal with the same chemical composition, so the corrosion resistance of HAZ may be depressed by a high welding temperature.
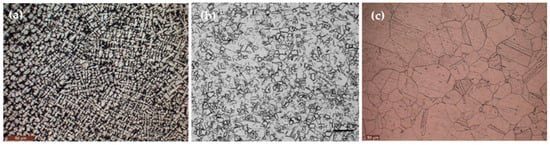
Figure 3.
Metallographic photos of WZ and HAZ of 90-10 cupronickel: (a) WZ, (b) MZ, (c) HAZ.
3.2. EIS Analysis
3.2.1. MZ
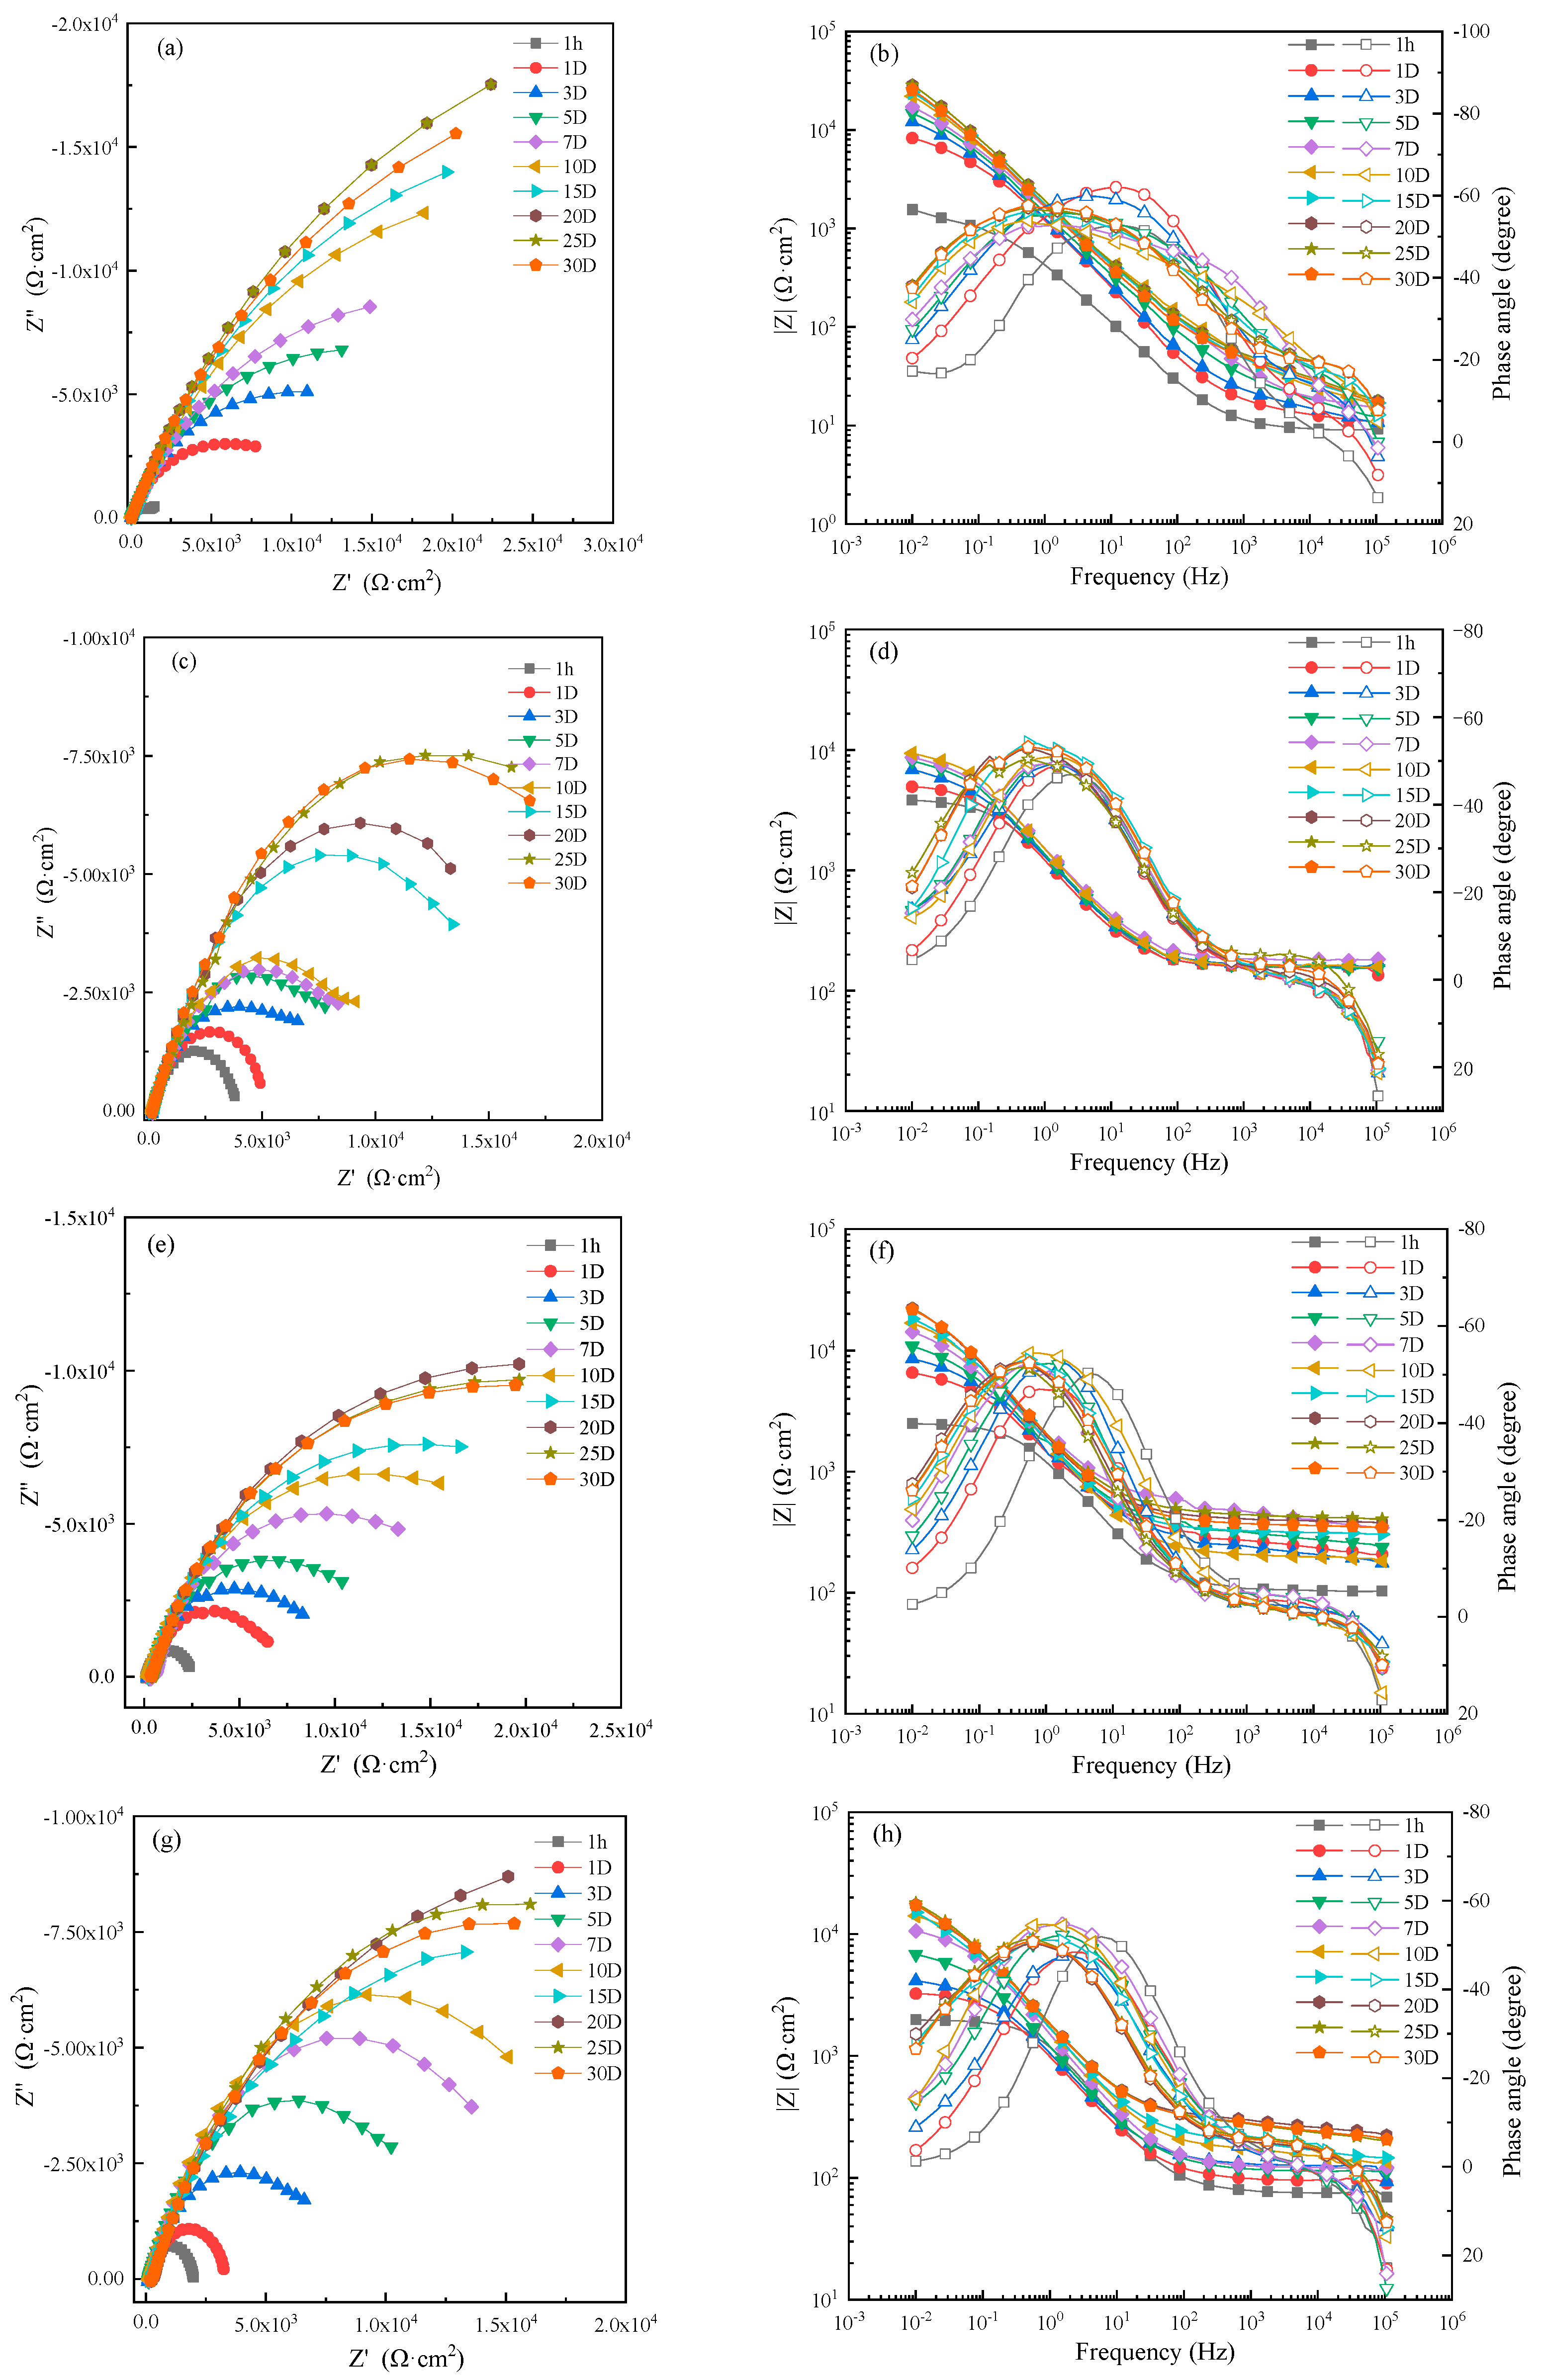
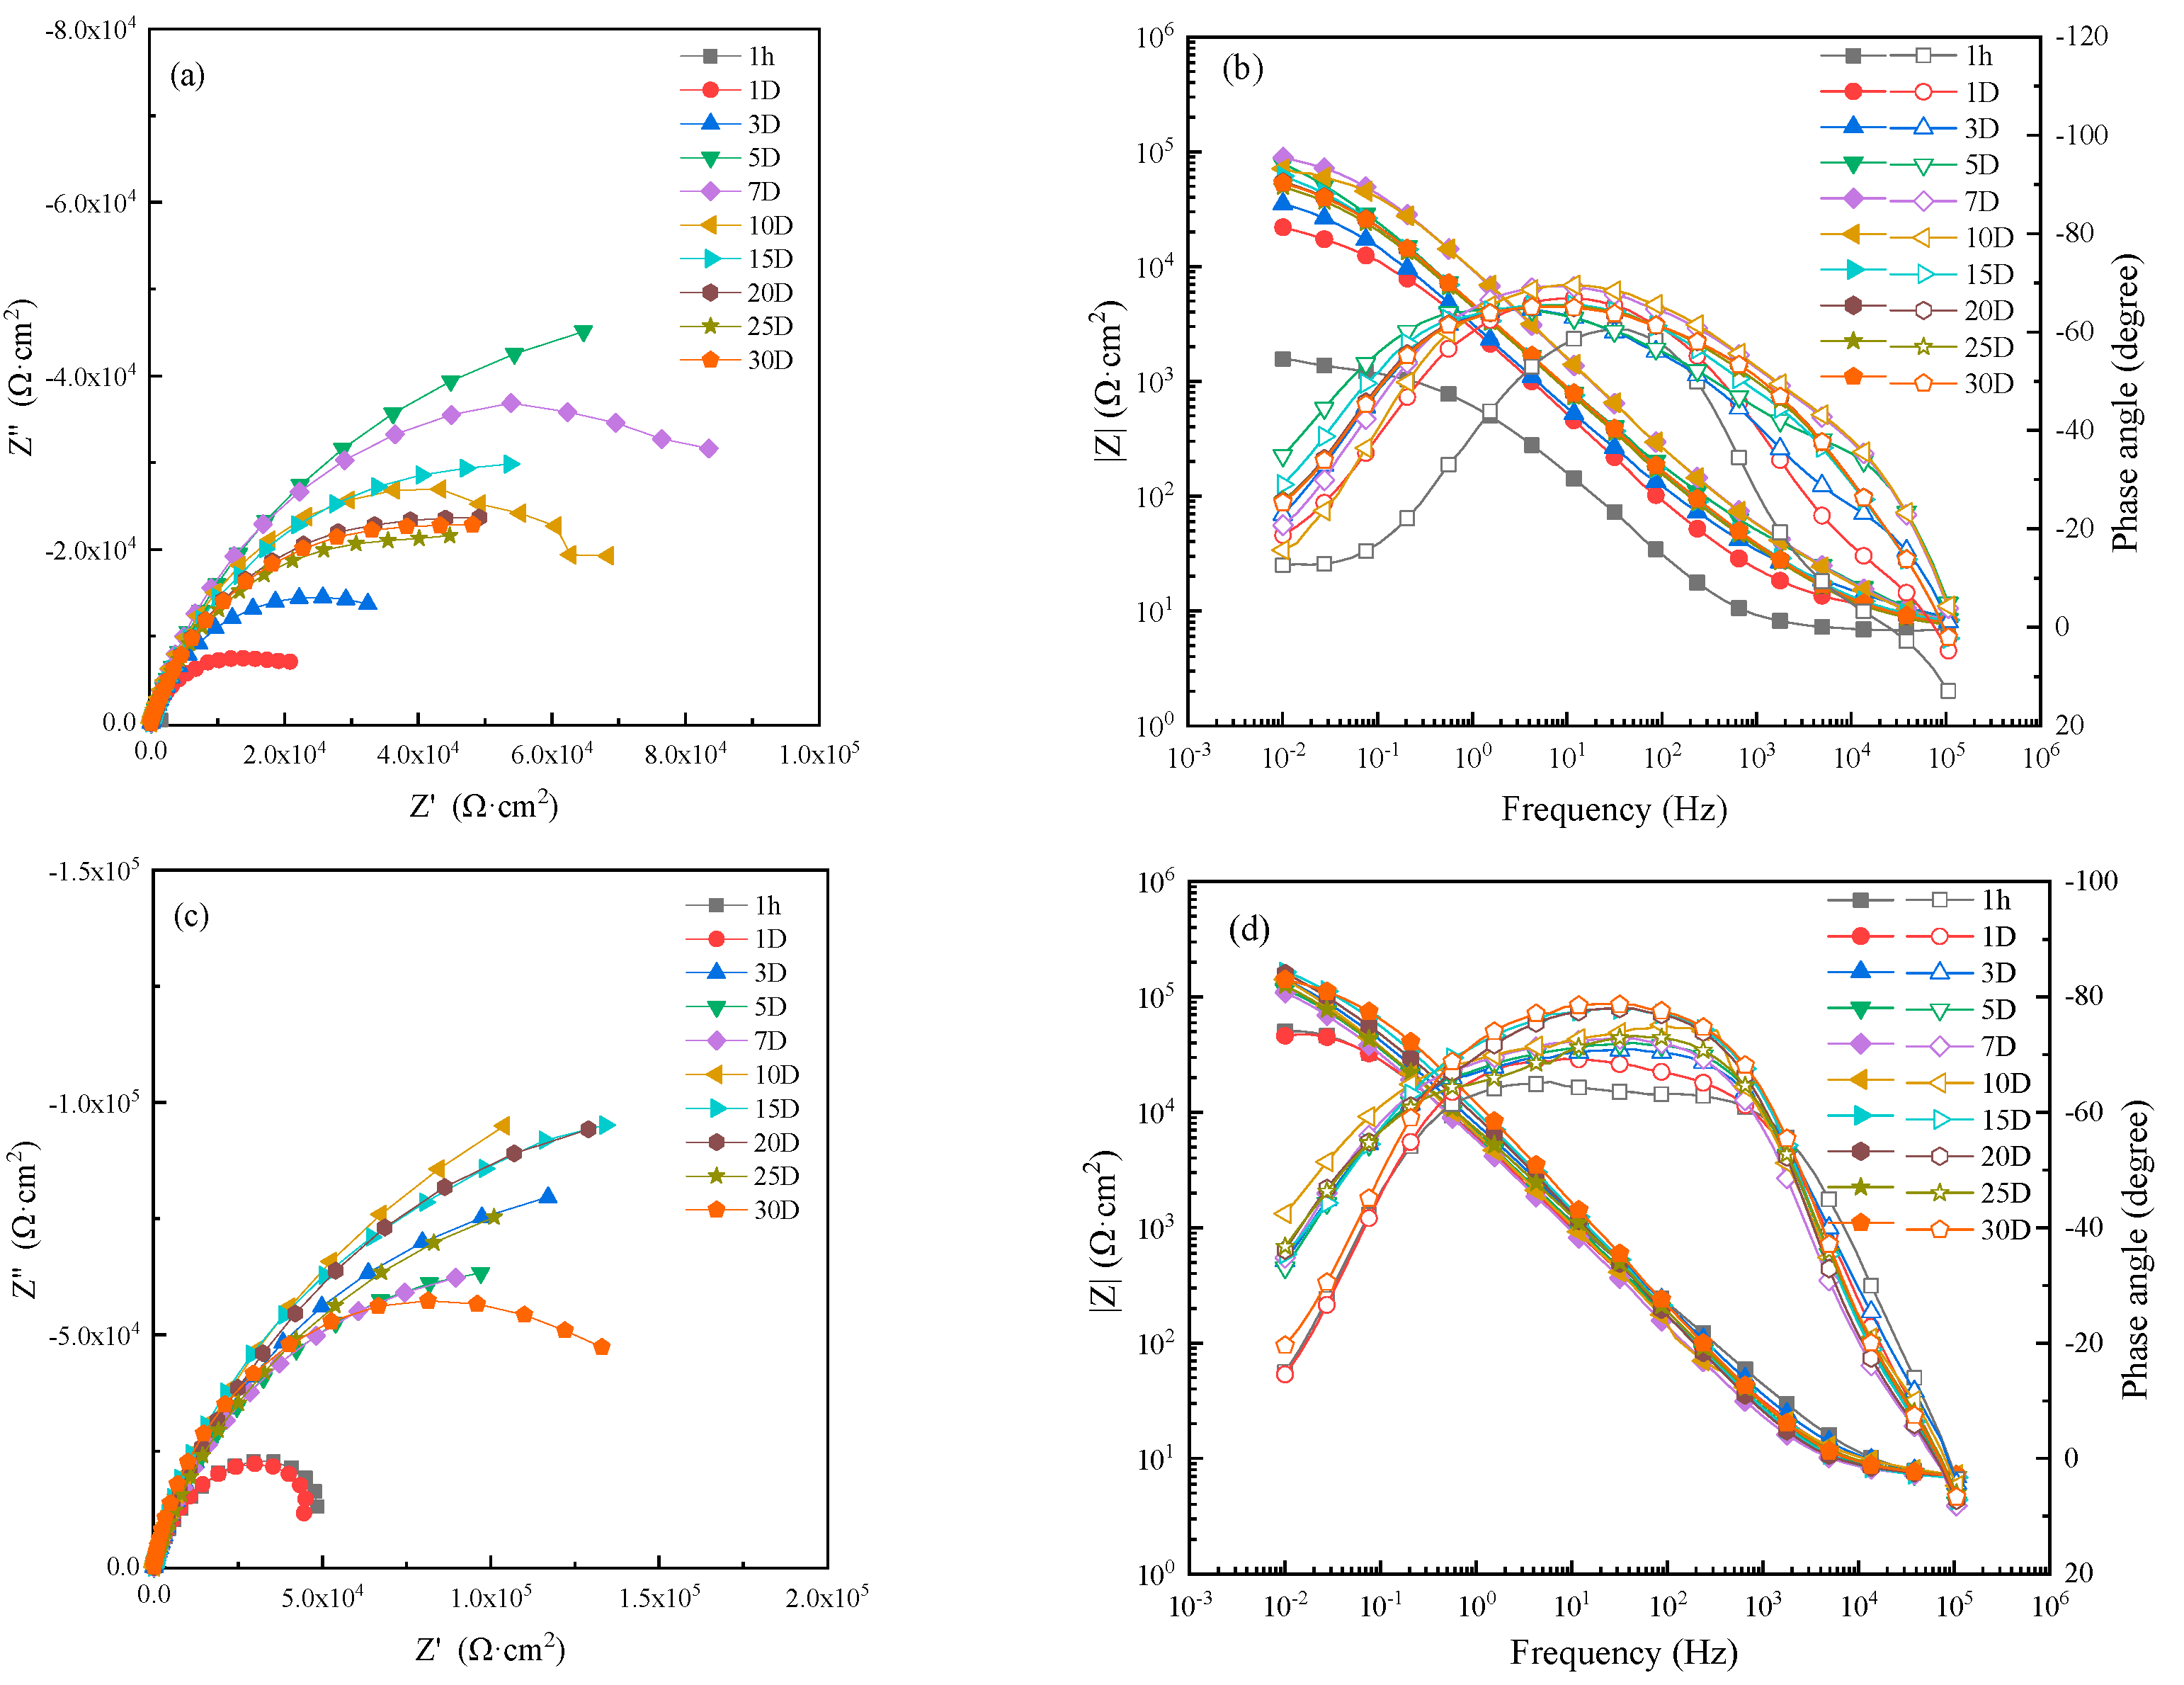
EIS of MZ samples in 0 m/s (static), 1 ± 0.1 m/s, 3 ± 0.1 m/s and 5 ± 0.1 m/s seawater for different immersion times were carried out to analyze the corrosion resistance of corrosion production, and the experimental results are shown in Figure 4. The corrosion resistance of MZ in different flowing rates of seawater increased with increasing immersion time and then stabilized after 20 days. That is to say, the corrosion rate of MZ gradually decreased during the first 20 days, and stable corrosion product films formed on the surface of MZ after 20 days.
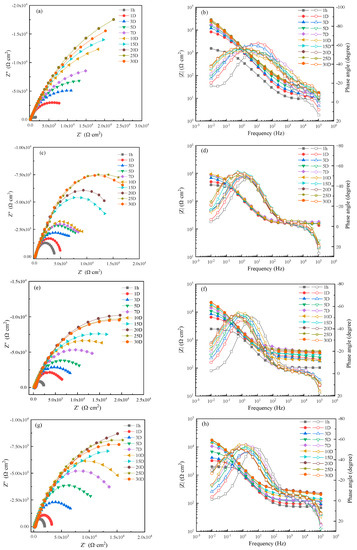
Figure 4.
Electrochemical impedance spectra of MZ in seawater: (a,c,e,g) Nyquist diagrams and (b,d,f,h) Bode diagrams in static, 1 m/s, 3 m/s, 5 m/s seawater.
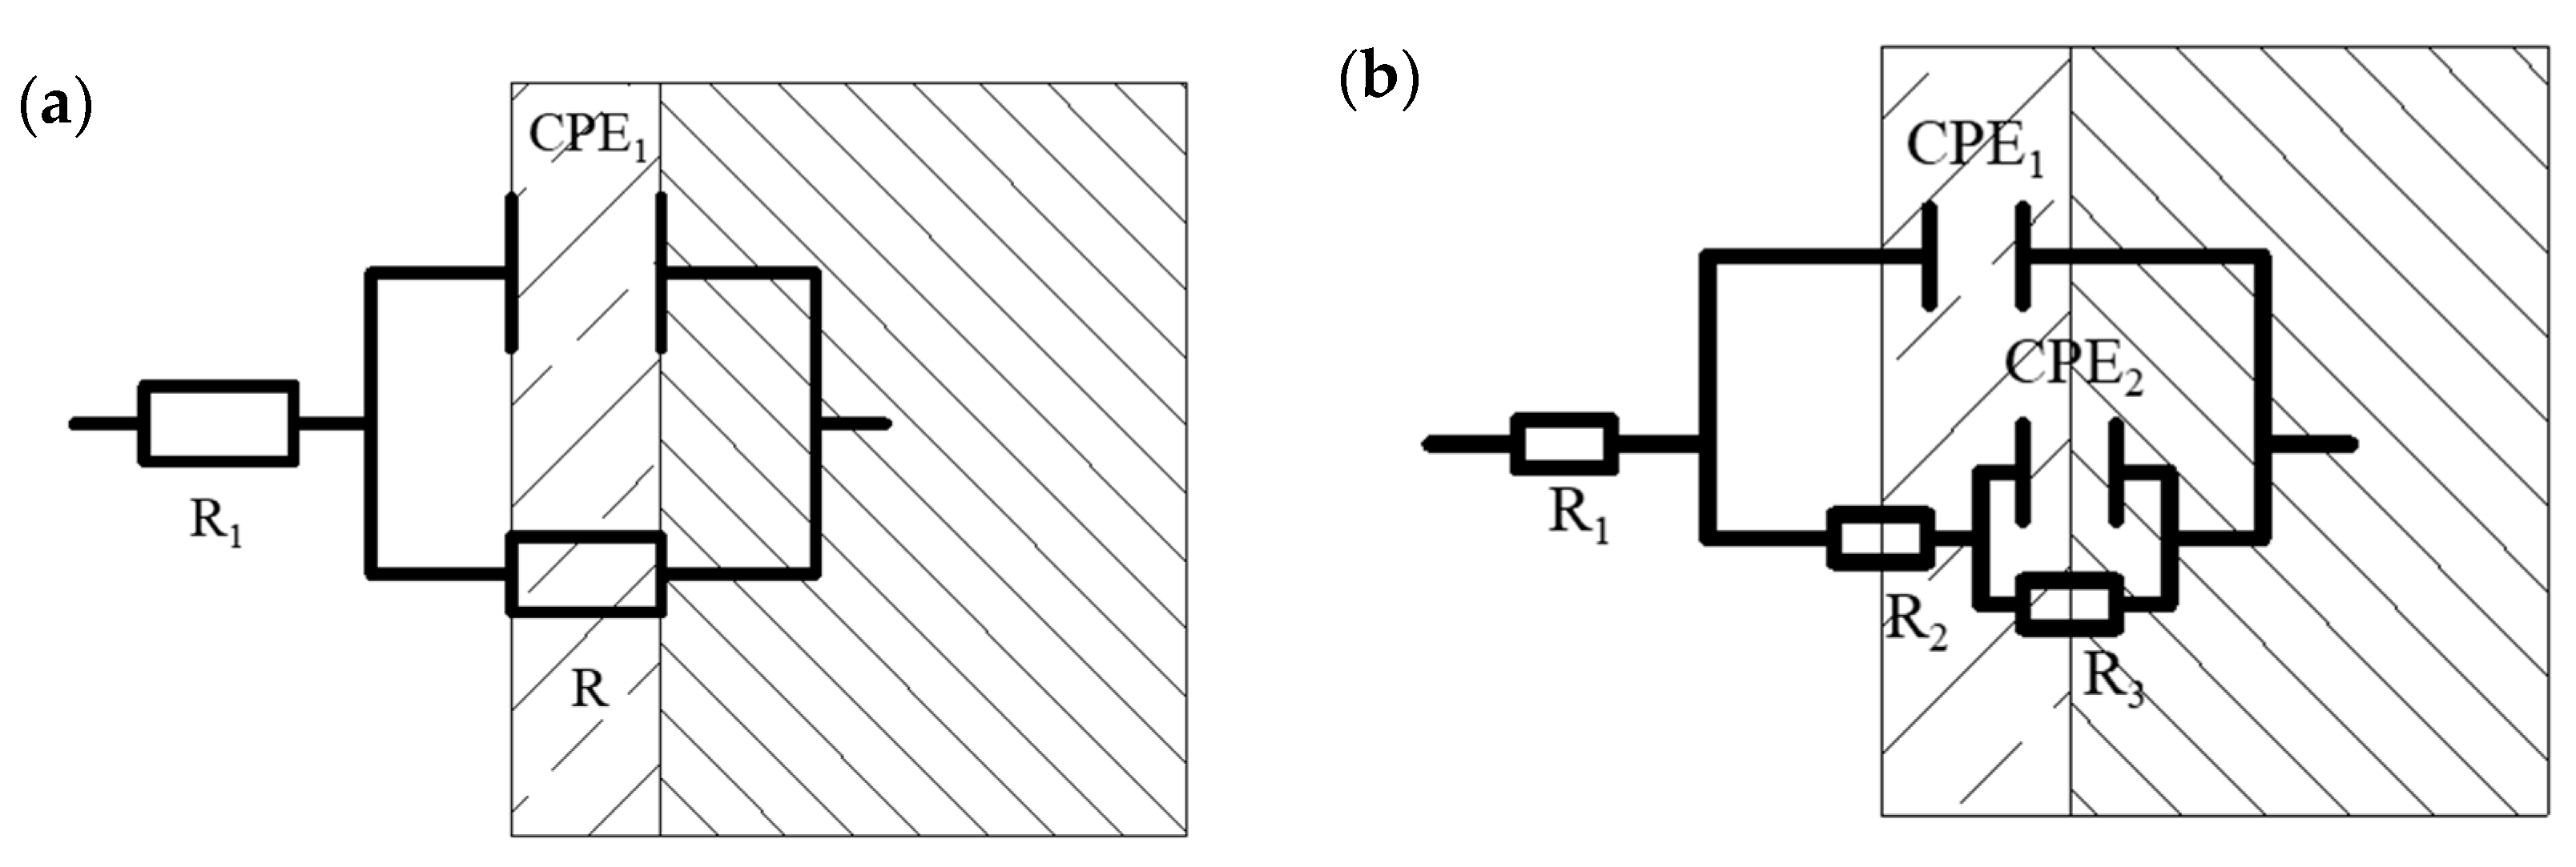
When the specimens of MZ were immersed in seawater for 1 hour, there was no corrosion production; Nyquist and Bode diagrams both presented a one time constant. With experimental processing, the Bode diagrams showed two time constants. The EIS measured after 1 hour with a one-time constant was fitted by the equivalent circuit shown in Figure 5a, and the equivalent circuit, shown in Figure 5b, was used to fit the EIS measured after 1 day [19,20,21,22]. R1 is solution resistance. CPE1 and CPE2 represent the production film capacitance and double electric capacitance, respectively. R2 and R3 represent the production film resistance and charge transfer resistance, respectively, and the total resistance R is calculated by R2 + R3.
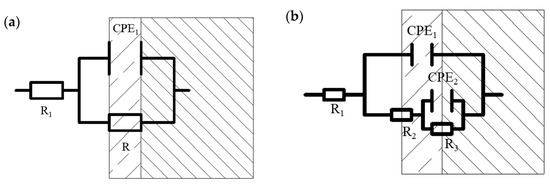
Figure 5.
Equivalent circuits for electrochemical impedance spectra analysis: (a) equivalent circuit for samples without corrosion production; (b) equivalent circuit for samples with corrosion production.
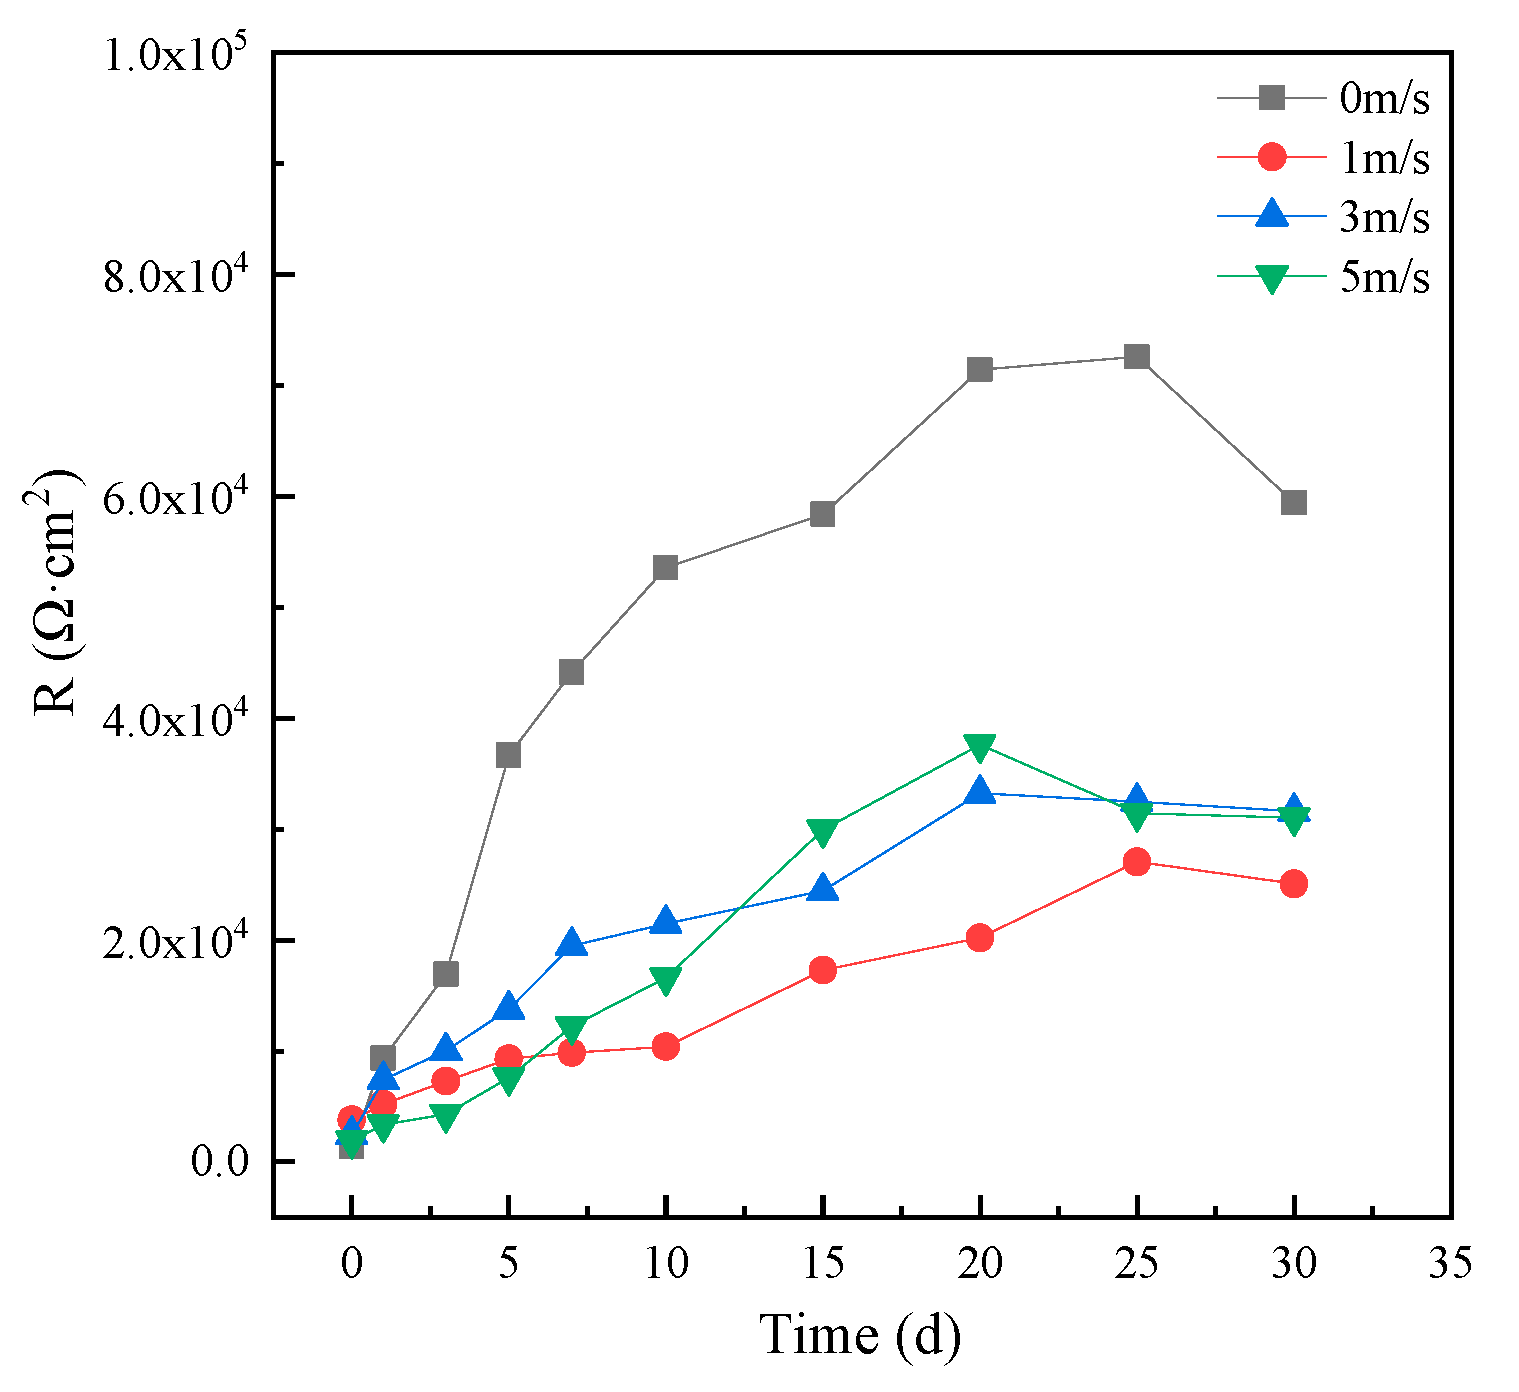
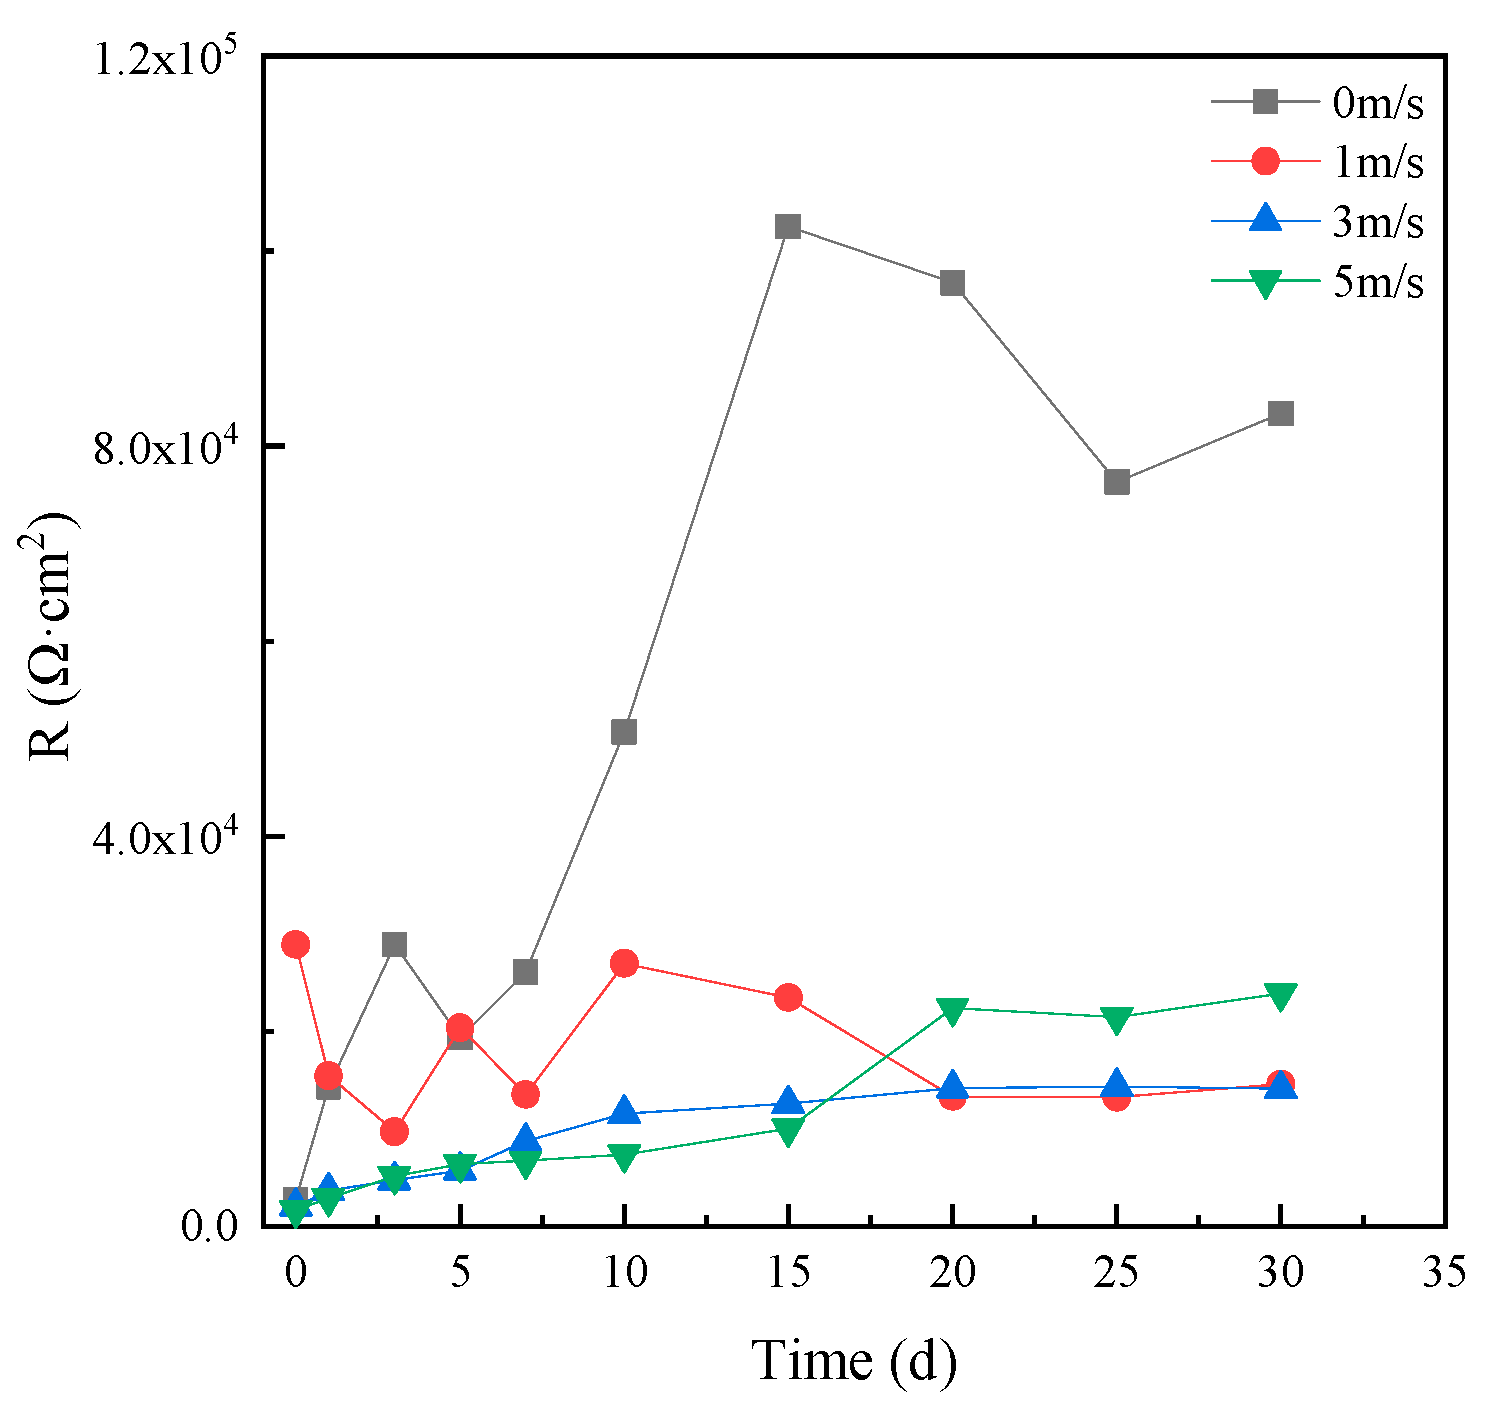
Figure 6 shows the corrosion resistance of MZ in different flowing rates of seawater, varying with time. It can be seen that the corrosion resistance of MZ in static seawater was the biggest; that is to say, the corrosion rate of MZ in static seawater was the smallest. The corrosion resistance of MZ in 1 ± 0.1 m/s, 3 ± 0.1 m/s and 5 ± 0.1 m/s flowing rate seawater was similar, and the steady value of corrosion resistance was more than 2.0 × 10⁴ Ω cm2 in flowing seawater, which was over six times the initial corrosion resistance. The results indicate that MZ has good corrosion resistance in flowing seawater.

Figure 6.
Corrosion resistance of MZ in different flowing seawater varying with time.
3.2.2. HAZ
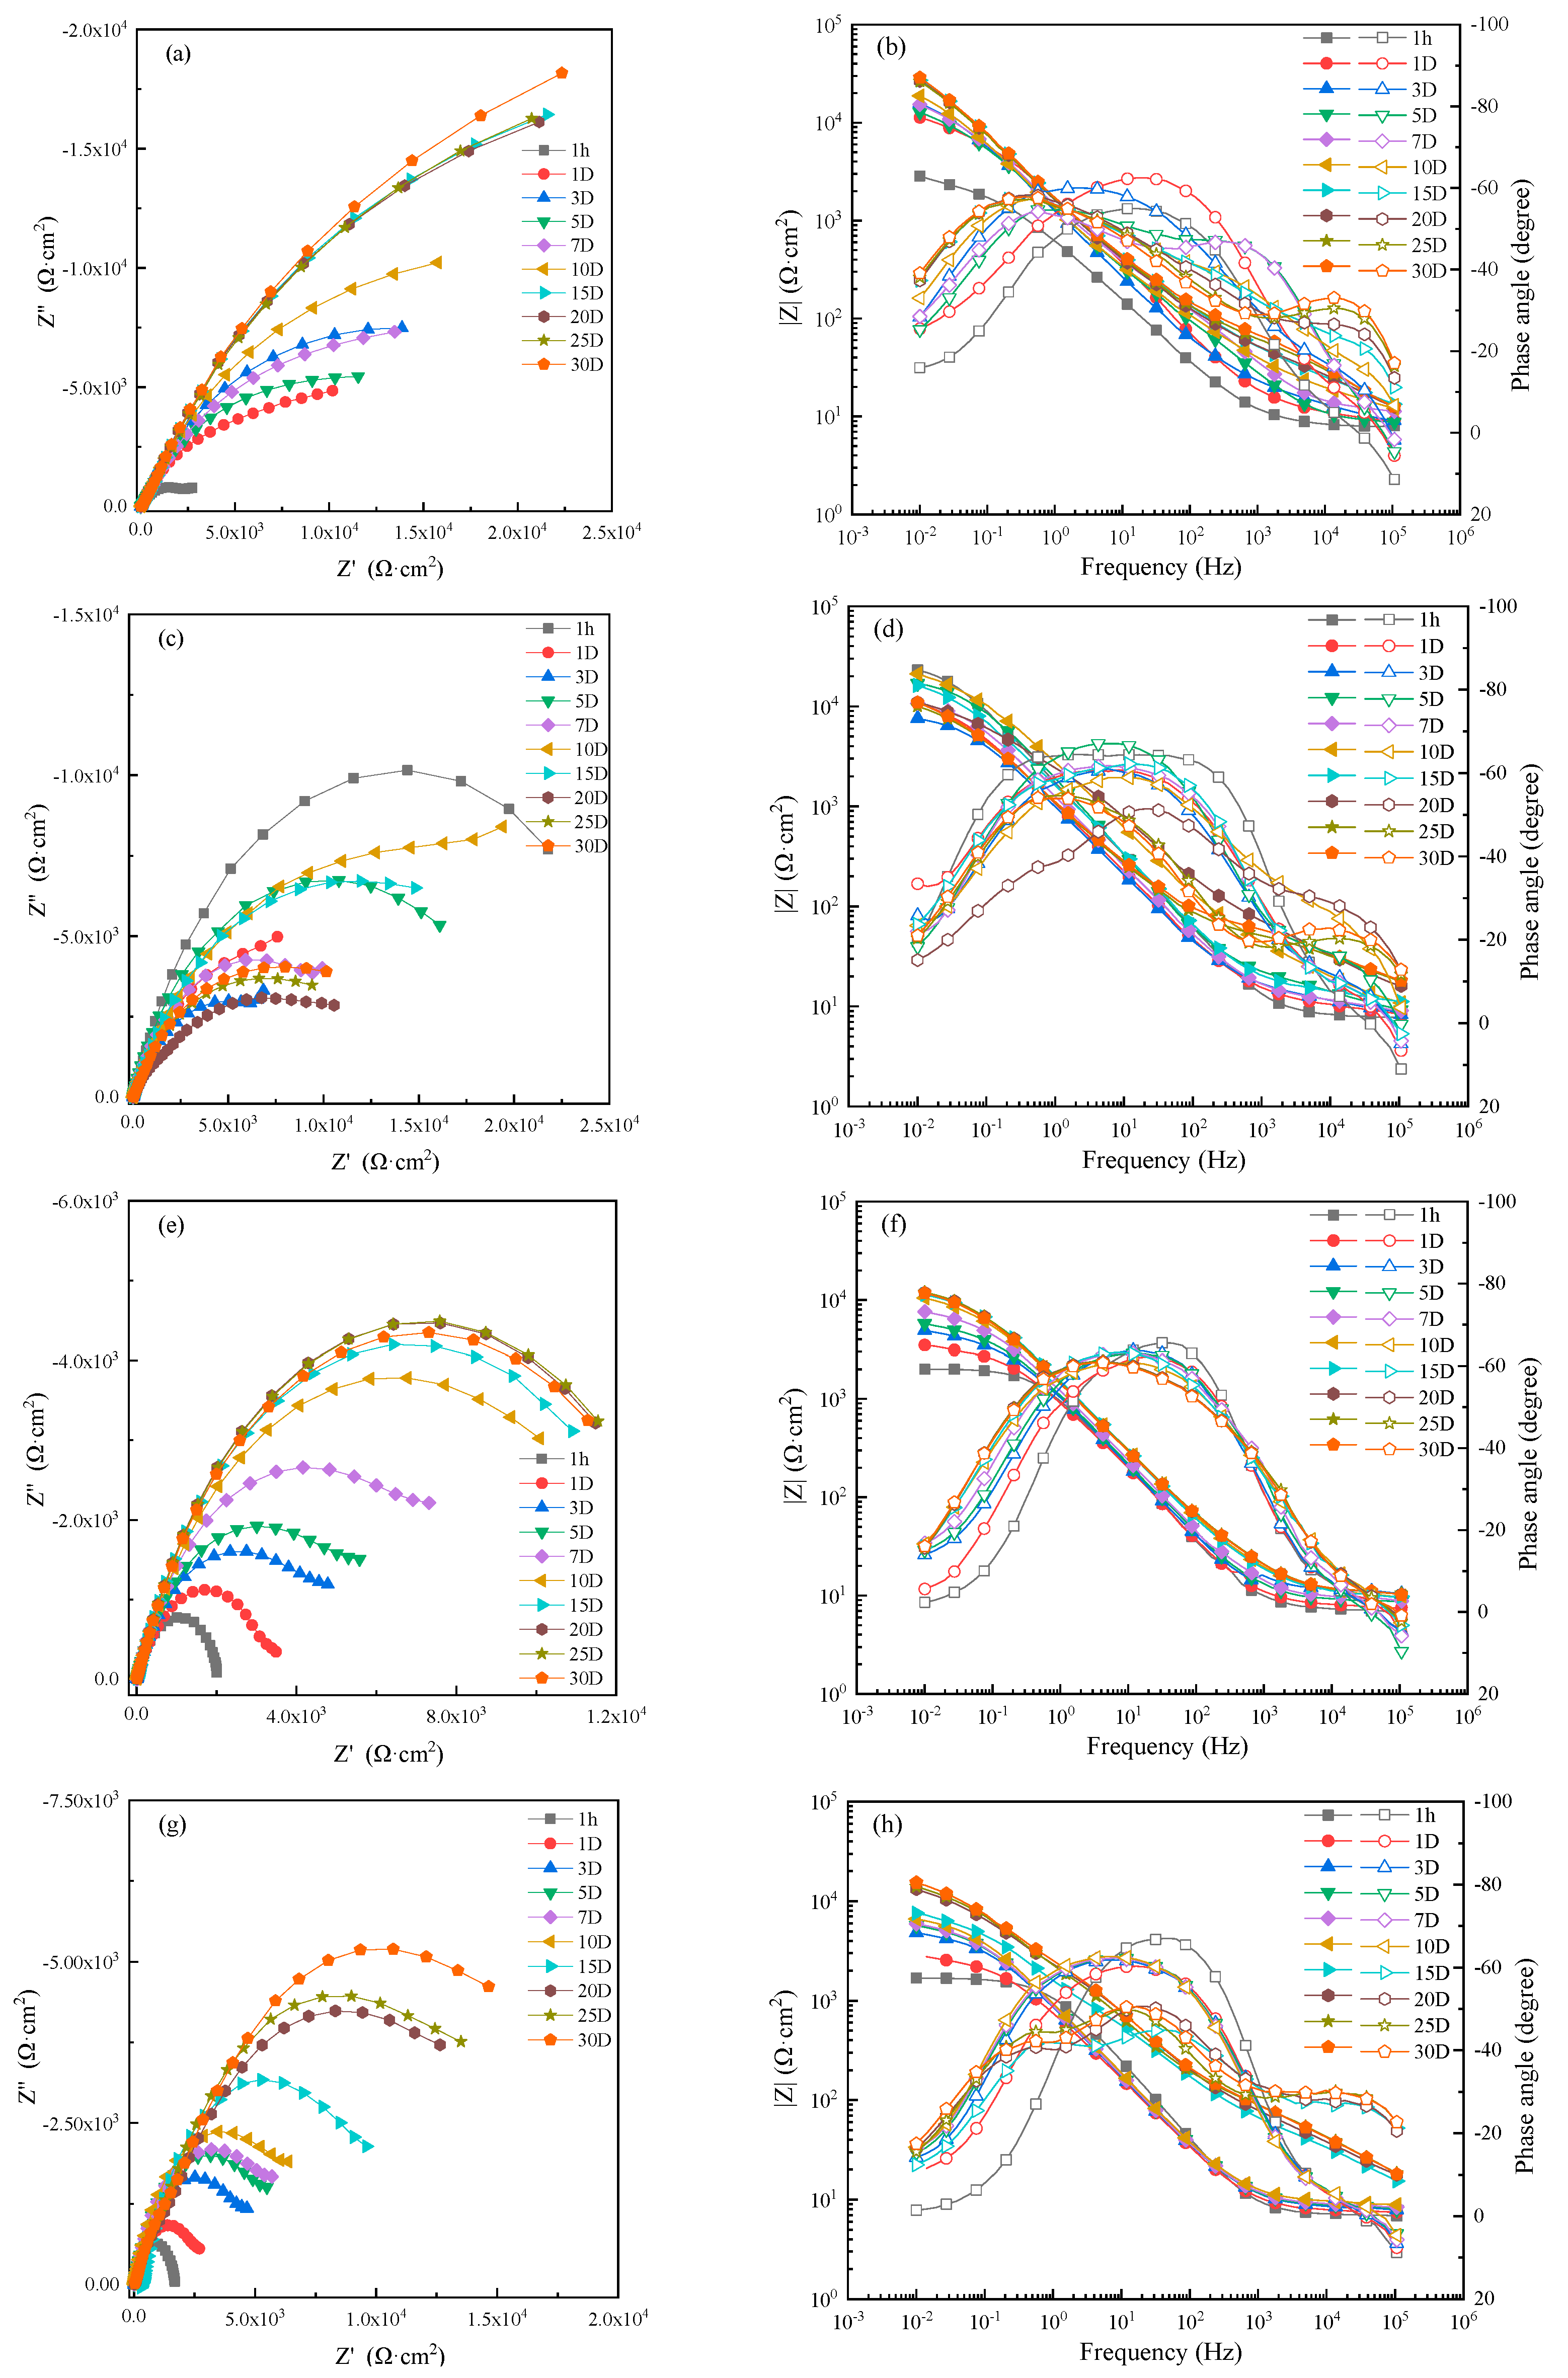
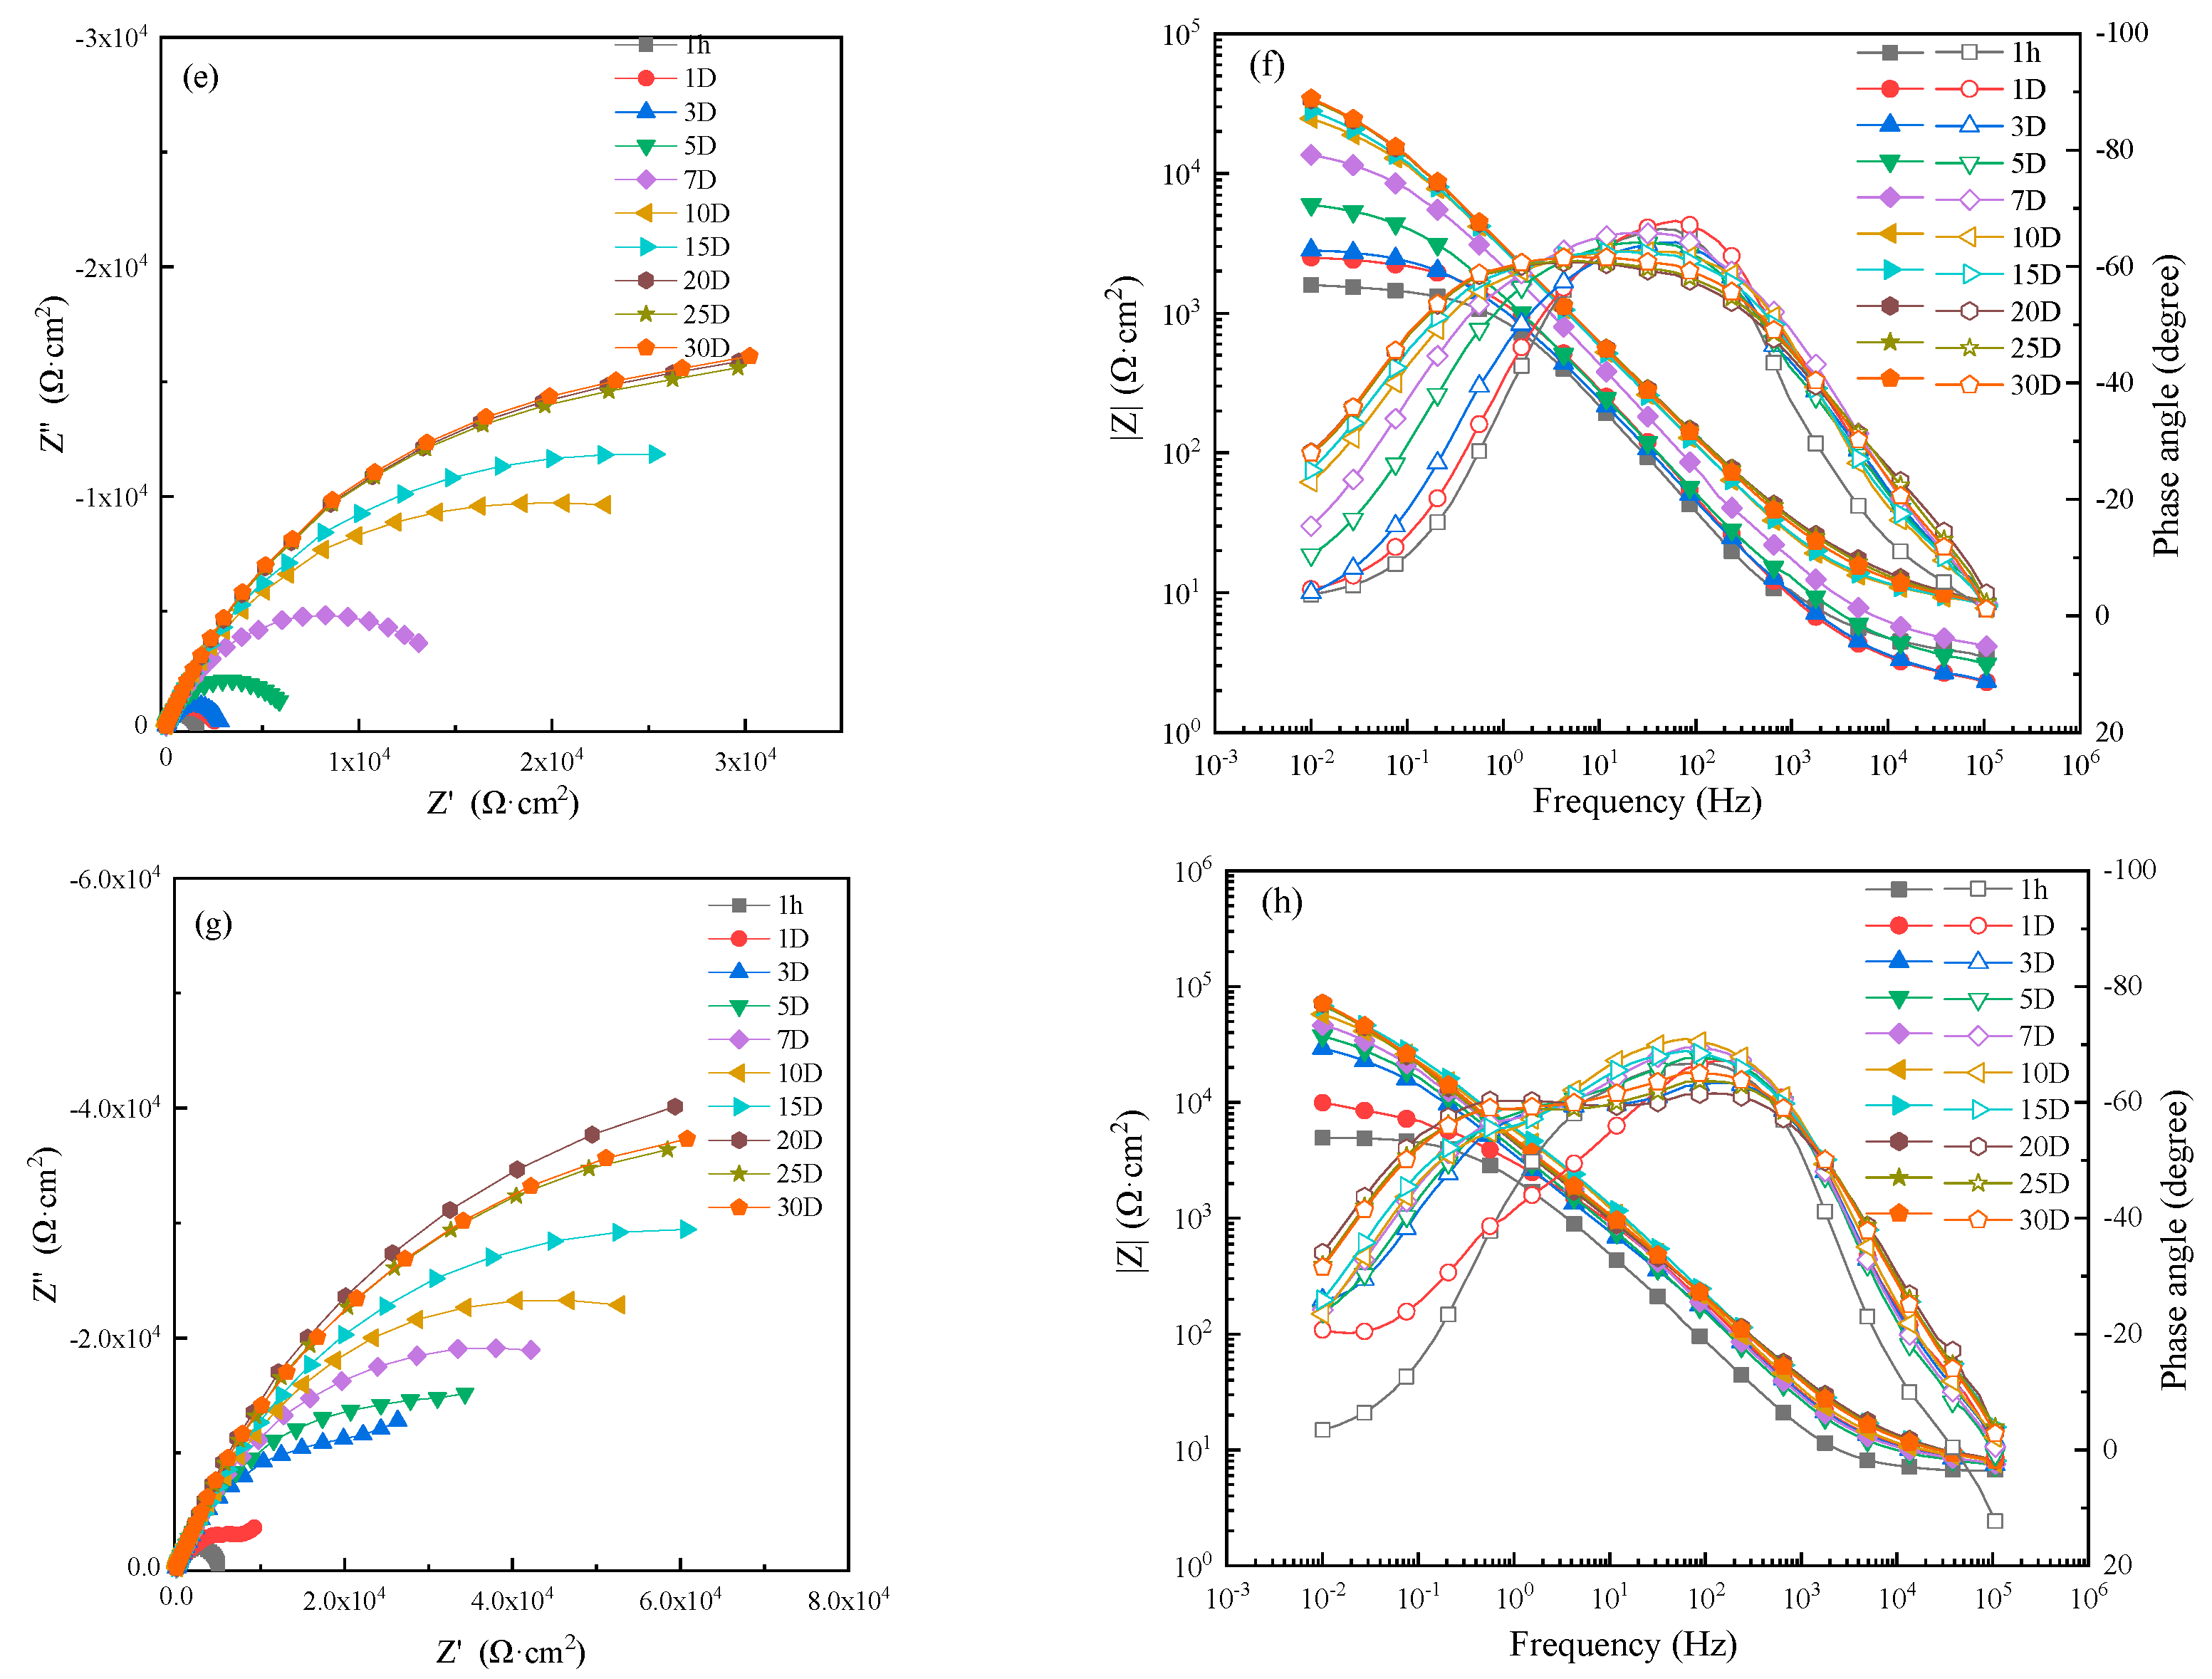
Figure 7 shows the EIS of HAZ specimens in 0 m/s, 1 ± 0.1 m/s, 3 ± 0.1 m/s and 5 ± 0.1 m/s seawater. The corrosion resistance of HAZ at different flowing rates first increased and then gradually stabilized after 20 days. That is to say, the protective production film was formed on HAZ, and the corrosion rate was inhibited after 20 days.

Figure 7.
Electrochemical impedance spectra of HAZ in seawater: (a,c,e,g) Nyquist diagrams and (b,d,f,h) Bode diagrams in static, 1 m/s, 3 m/s, 5 m/s seawater.
An EIS of 1 hour was fitted by the equivalent circuit shown in Figure 5a and those after 1 day were fitted with the equivalent circuit shown in Figure 5b. Then, the corrosion resistance R of HAZ was calculated according to the fitting results, which are shown in Figure 8. The corrosion resistance of HAZ in static seawater was also the biggest compared to that in flowing seawater. However, the corrosion resistance of HAZ in flowing seawater was smaller than that of MZ; that is to say, the corrosion resistance of HAZ was smaller than that of MZ.

Figure 8.
Corrosion resistance of HAZ in different flowing seawater varying with time.
3.2.3. WZ
The EIS of WZ in different flowing seawater is shown in Figure 9. From Nyquist and Bode diagrams, we can know that due to the formation of corrosion production, the corrosion resistance of WZ increased with increasing time.
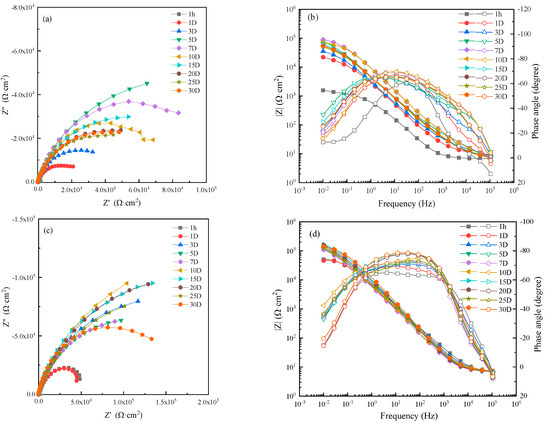

Figure 9.
Electrochemical impedance spectra of WZ in seawater: (a,c,e,g) Nyquist diagrams and (b,d,f,h) Bode diagrams in static, 1 m/s, 3 m/s, 5 m/s seawater.
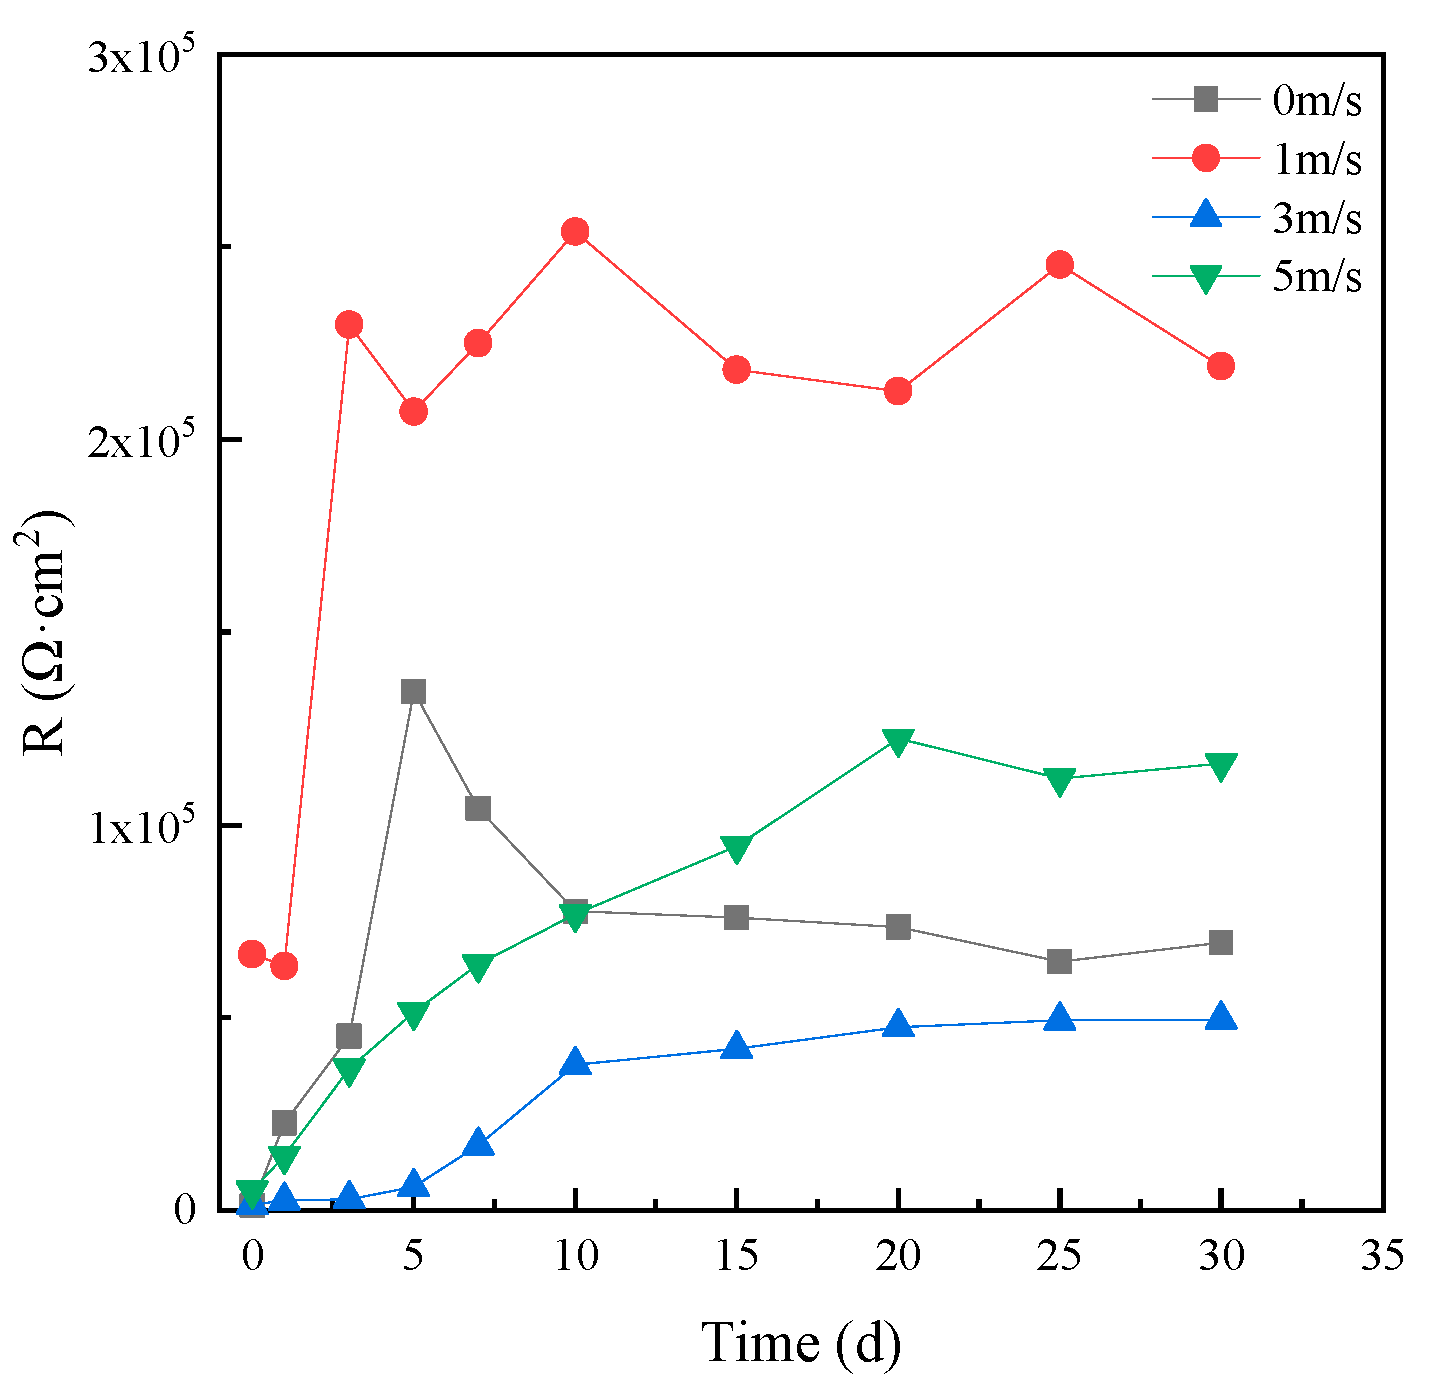
In order to analyze the variation of corrosion resistance with immersion time and flowing rate, an EIS of 1 hour was fitted by the equivalent circuit shown in Figure 5a, and those after 1 day were fitted with the equivalent circuit shown in Figure 5b. The fitting results are shown in Figure 10. The corrosion resistance in 1 ± 0.1m/s flowing seawater was the biggest, and intact corrosion production film was formed after 3 days. In other conditions, a relatively intact production film was formed after 10–20 days, indicating that the protective corrosion production film formed on WZ was more easy and faster than that of MZ and HAZ.

Figure 10.
Corrosion resistance of WZ in different flowing seawater varying with time.
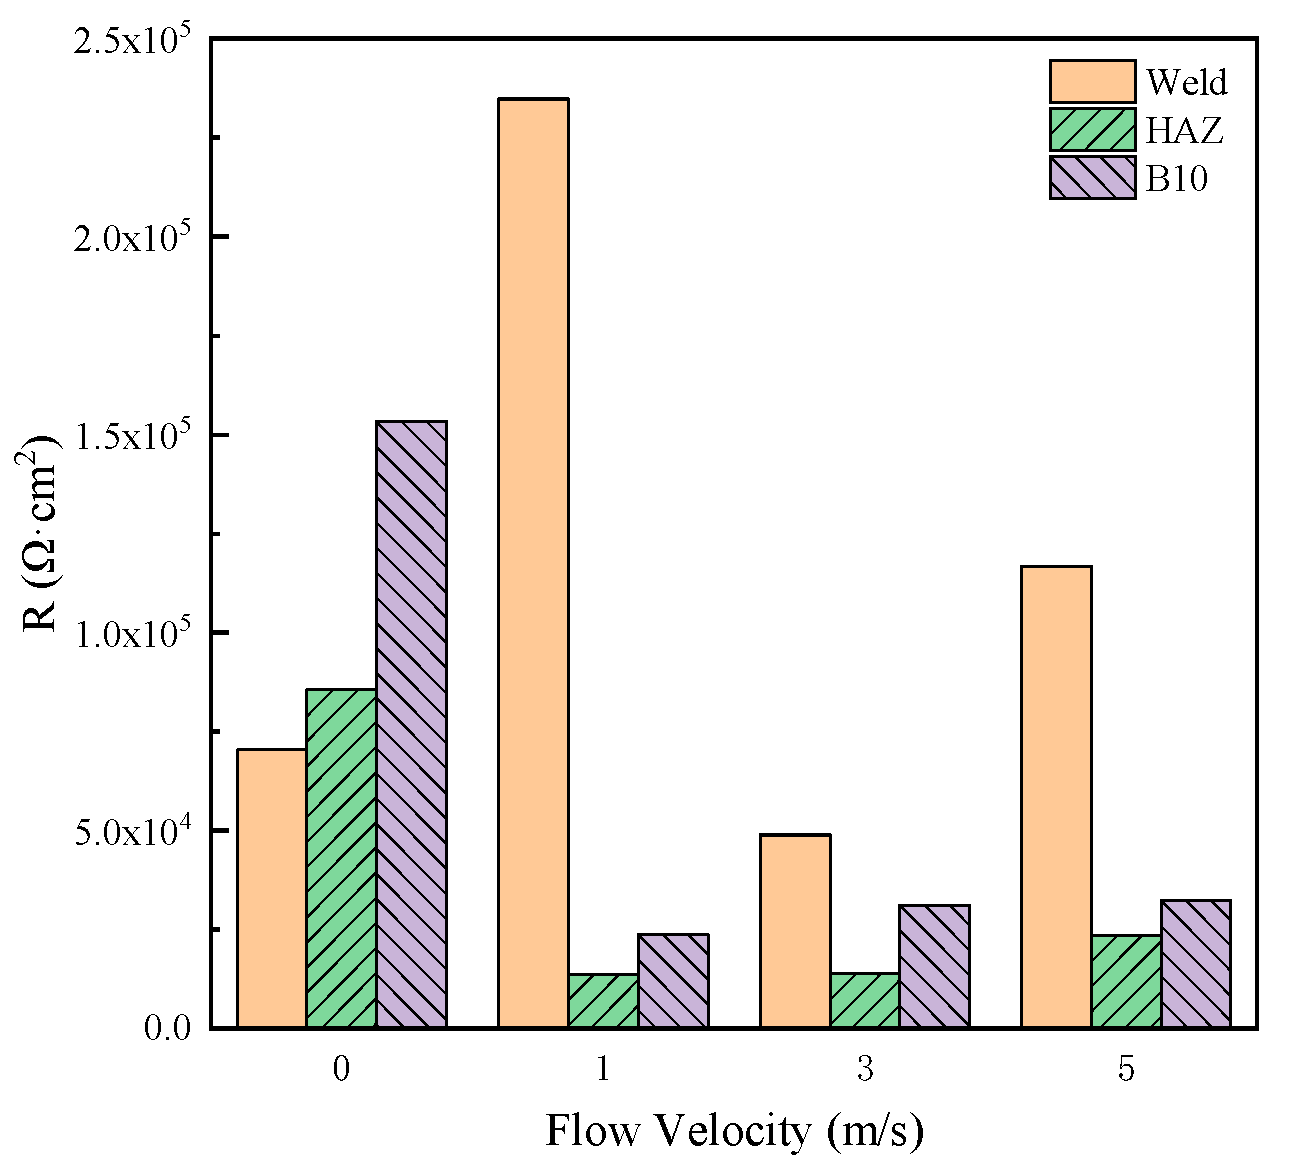
The mean values of corrosion resistance of MZ, HAZ and WZ during 20–30 days were calculated and shown in Figure 11. It can be seen that when the corrosion production deposits on the surface of MZ, HAZ and WZ, the corrosion resistance was more than 1.4 × 10⁴ Ωcm2, indicating that MZ, HAZ and WZ all had good anticorrosion properties in seawater. In the different flowing rates of seawater, the corrosion resistance of WZ was the biggest, and the corrosion resistance of HAZ was the smallest, so HAZ preferentially corroded in flowing seawater.
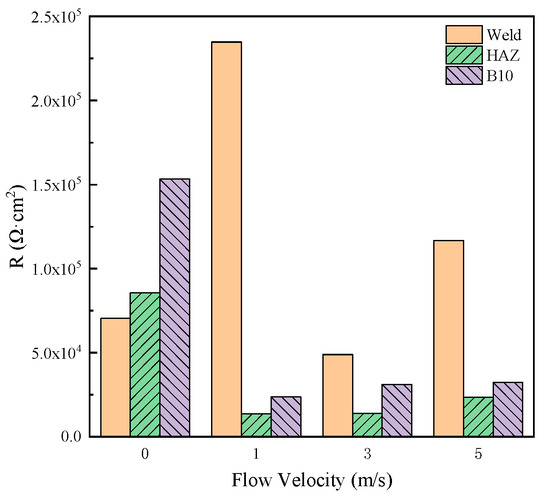
Figure 11.
Comparison of corrosion resistance of three zones of 90-10 cupronickel welded joints in different flowing rates of seawater.
3.3. Galvanic Corrosion between HAZ and WZ
3.3.1. Scanning Kelvin Probe Results
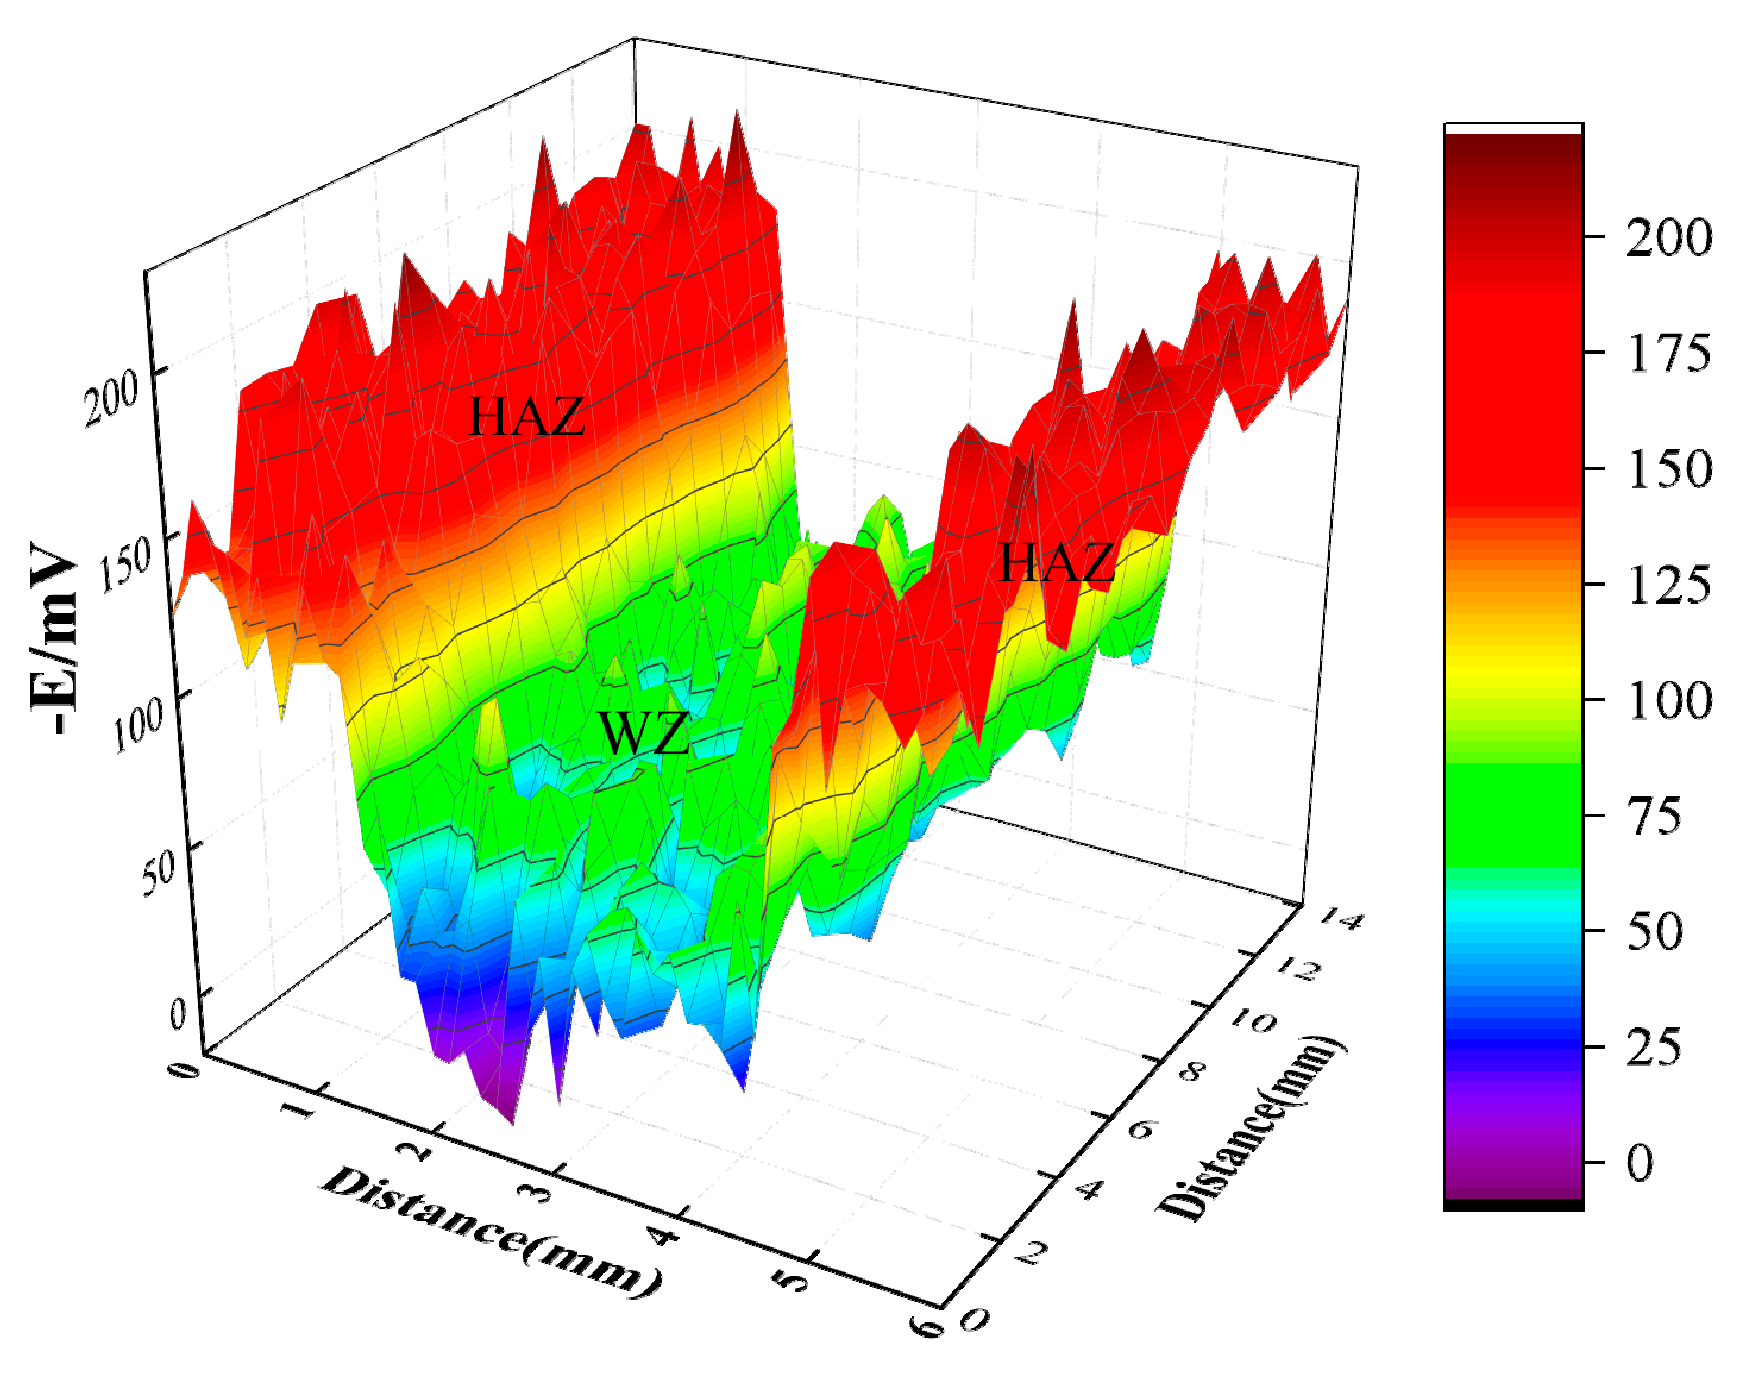
Due to the higher Ni content of HSCuNi than 90-10 cupronickel, a potential difference exists between HAZ and WZ. SKP is a nondestructive method used to determine the relative work function, and the relationship between open circuit potential and work function is linear; therefore, in this paper, SKP was used to determine the distribution of work function on the surface of WZ and HAZ. In Figure 12, the experimental results of SKP showed that the average work function of WZ and HAZ was about −80 mV and −160 mV, respectively, and there was an obvious potential difference between them, so galvanic corrosion occurred between WZ and HAZ in seawater, and the corrosion rate of HAZ was accelerated for the more negative potential.

Figure 12.
Work potential distribution of welding joints.
3.3.2. Galvanic Potential and Current Testing
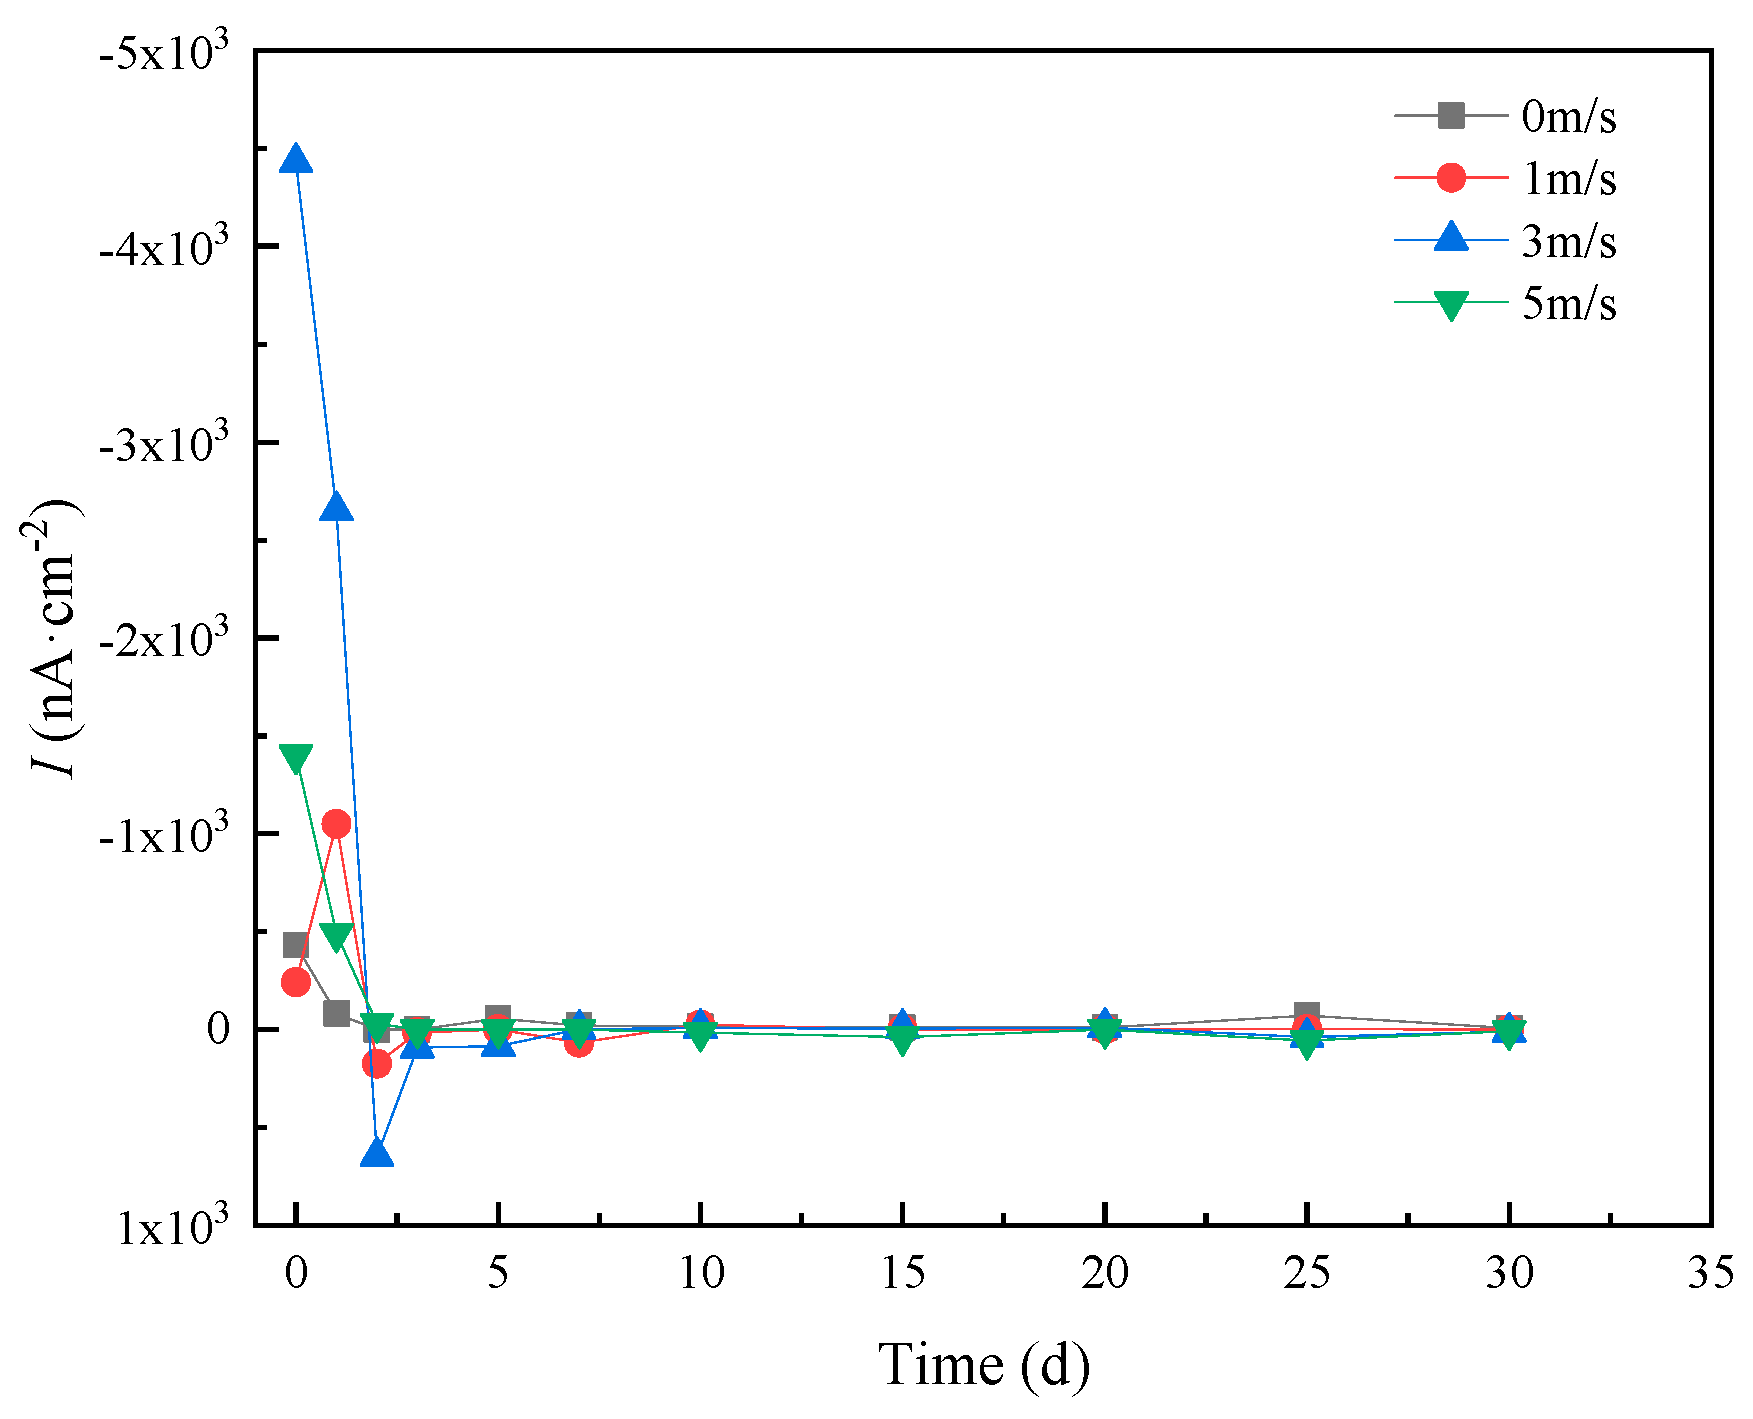
HAZ and WZ were connected with an area ratio of 1:1, then the galvanic current was measured in different flowing rates of seawater, and the measuring result is shown in Figure 13. From Figure 13, we can see that galvanic current density quickly decreased with time, increasing due to the formation of protective corrosion production. After 3 days, the galvanic current density was nearly zero, indicating that galvanic corrosion did not occur. However, at the beginning of the experiment, the galvanic current density was 4.43 μA/cm2 in 5 m/s seawater, that is to say, galvanic corrosion occurred without protective corrosion production. The initial galvanic current increased with the increasing seawater flowing rate. Duplicate experiments of galvanic corrosion experimental results showed good agreement, and the error range of galvanic current density was from 1.2–4.8%.

Figure 13.
Variation of galvanic current between HAZ and WZ with time and flowing rate.
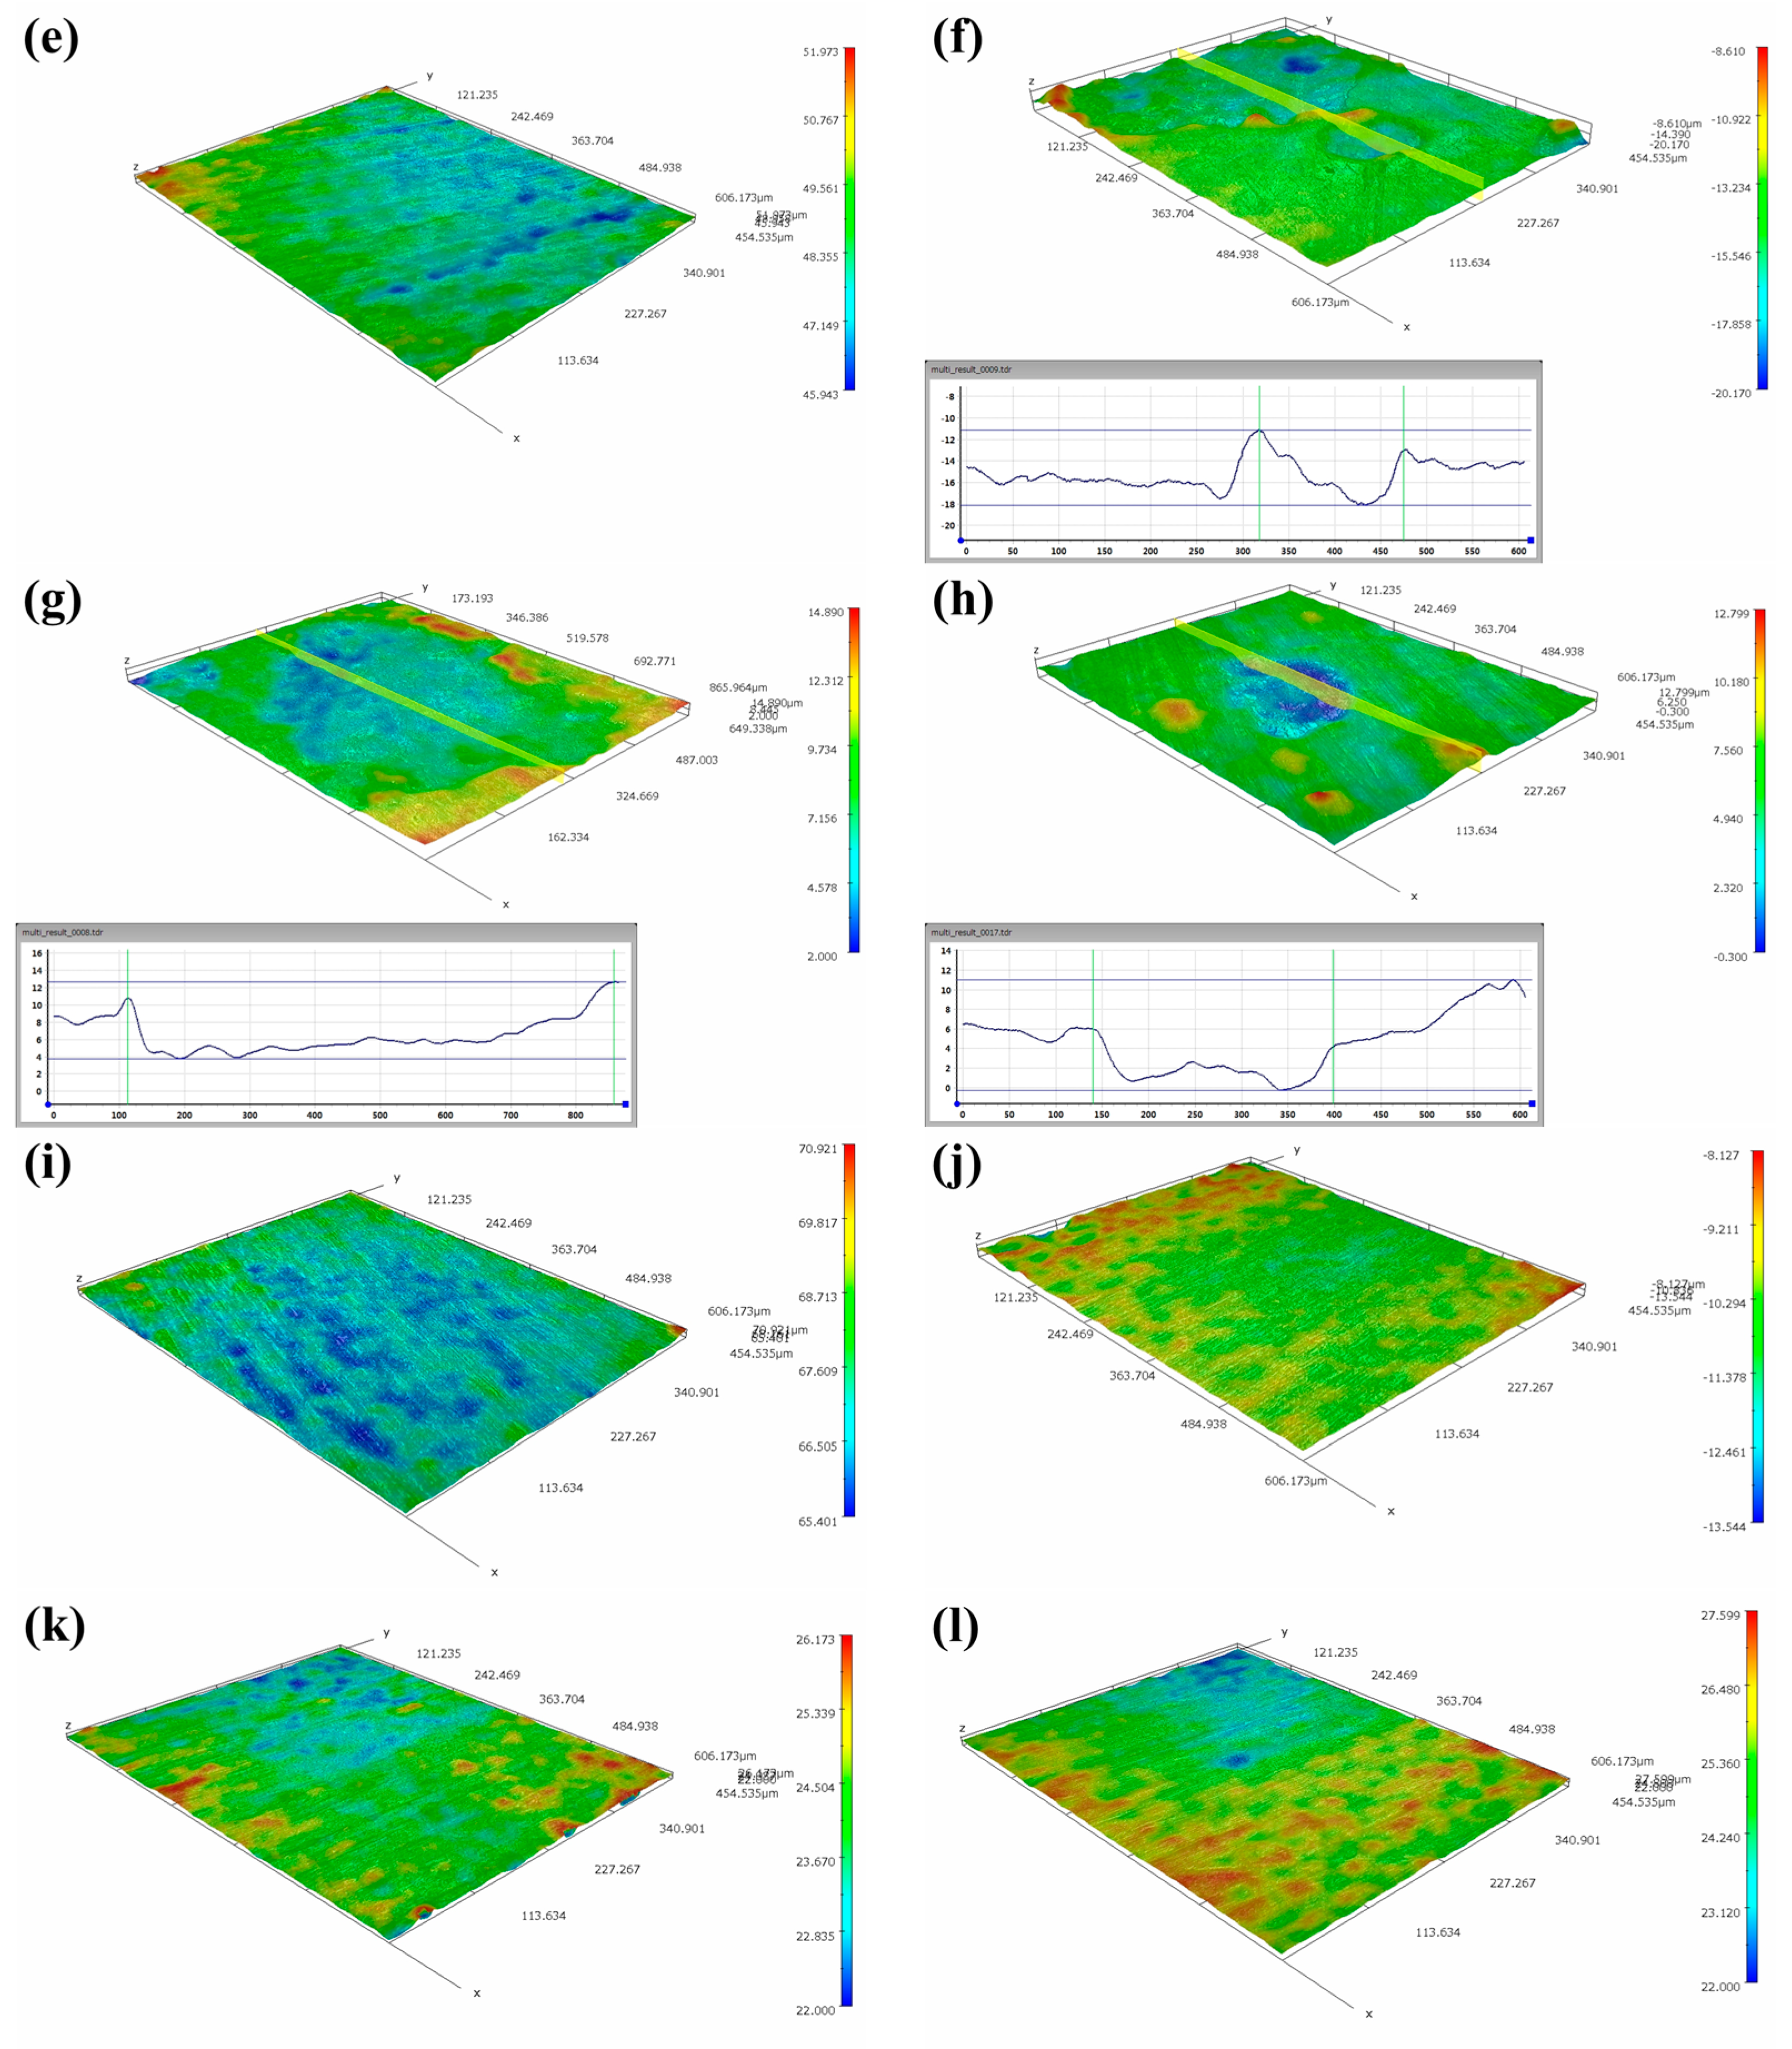
3.4. Corrosion Morphologies of Corrosion Production
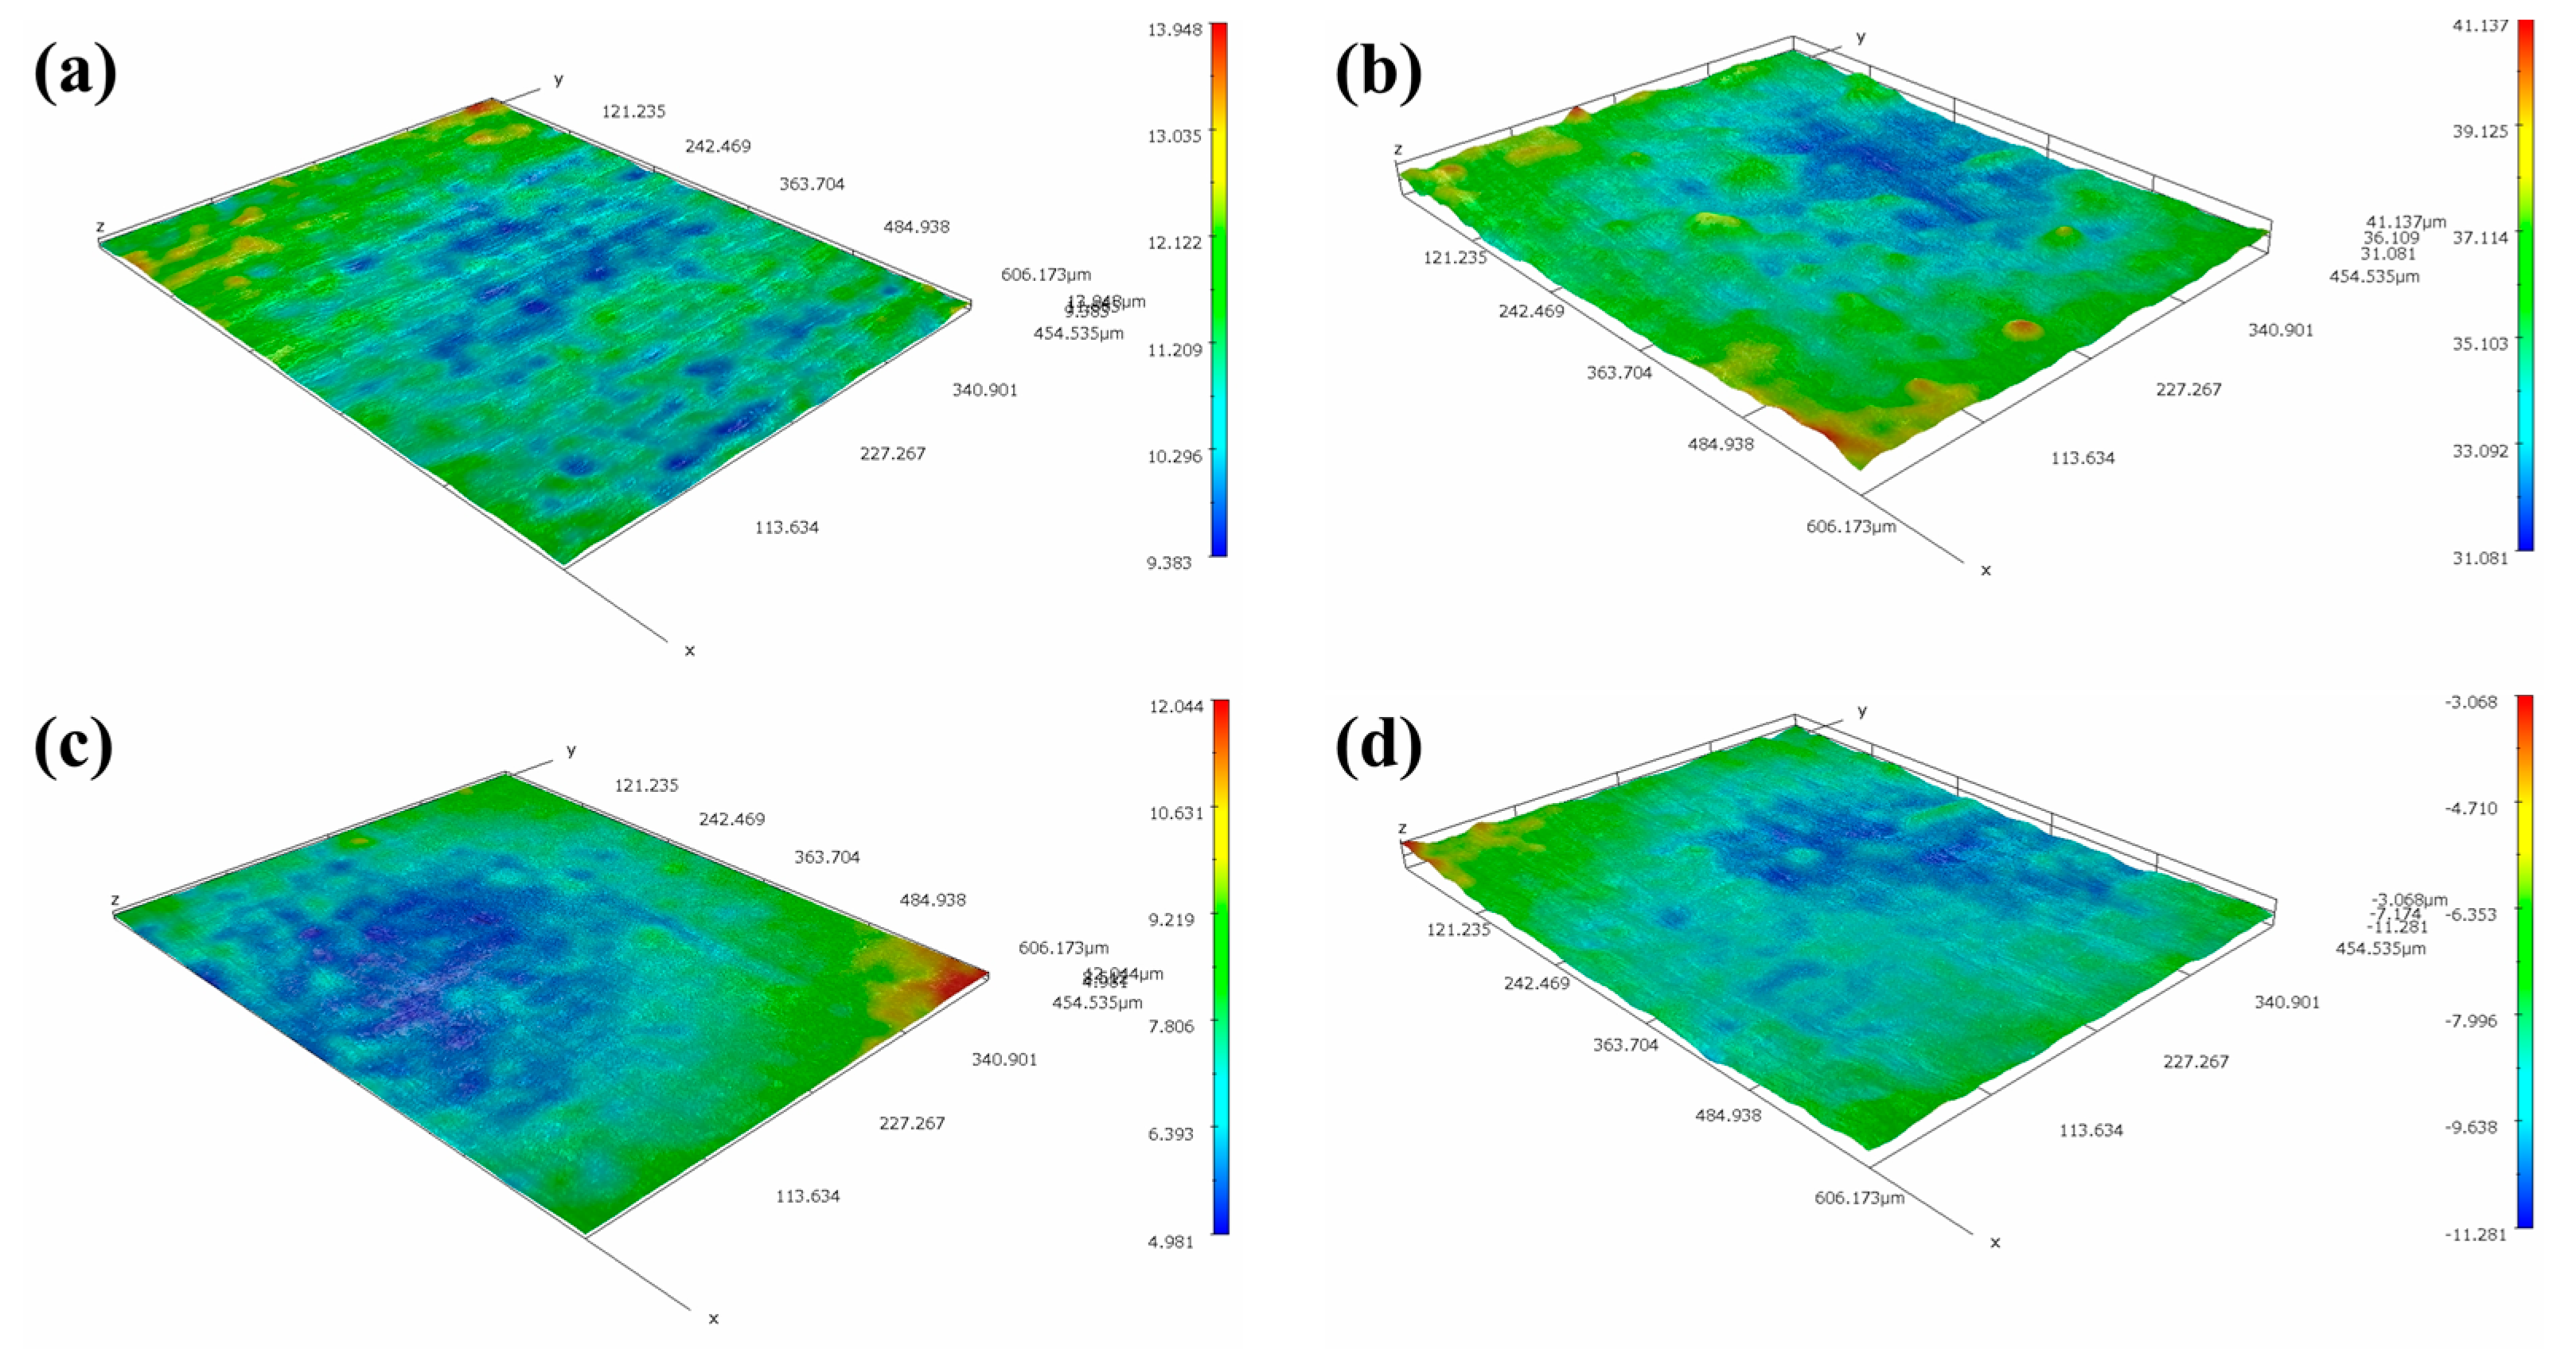
The optical 3D morphologies of MZ, HAZ and WZ in different flowing rates of seawater are shown in Figure 14. It can be seen that the surfaces of MZ and WZ were relatively flat after corrosion in different flowing rates of seawater for 30 days, indicating that MZ and WZ had good anticorrosion performance in flowing seawater. However, the morphologies of corroded HAZ were obviously different. In static seawater, the surface of the HAZ was relatively flat, but pits were clearly observed after being corroded in flowing seawater for 30 days. According to the electrochemical impedance data, the corrosion resistance of HAZ was the smallest among the three regions of welding joints. The depths of corrosion pits in different flowing rates of seawater are shown in Table 2. The higher the flowing rate of seawater, the smaller the pit depth.
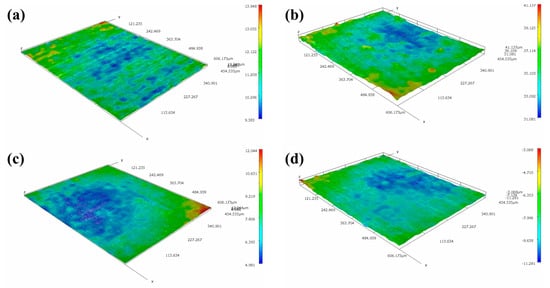

Figure 14.
Three-dimensional morphologies of MZ, HAZ and WZ corroded in different flowing rate seawater: (a,e,i) 0 m/s, (b,f,j)1 m/s, (c,g,k) 3 m/s, (d,h,l) 5 m/s.
Table 2.
Depth of pits of HAZ corroded in different flowing rates of seawater for 30 days.
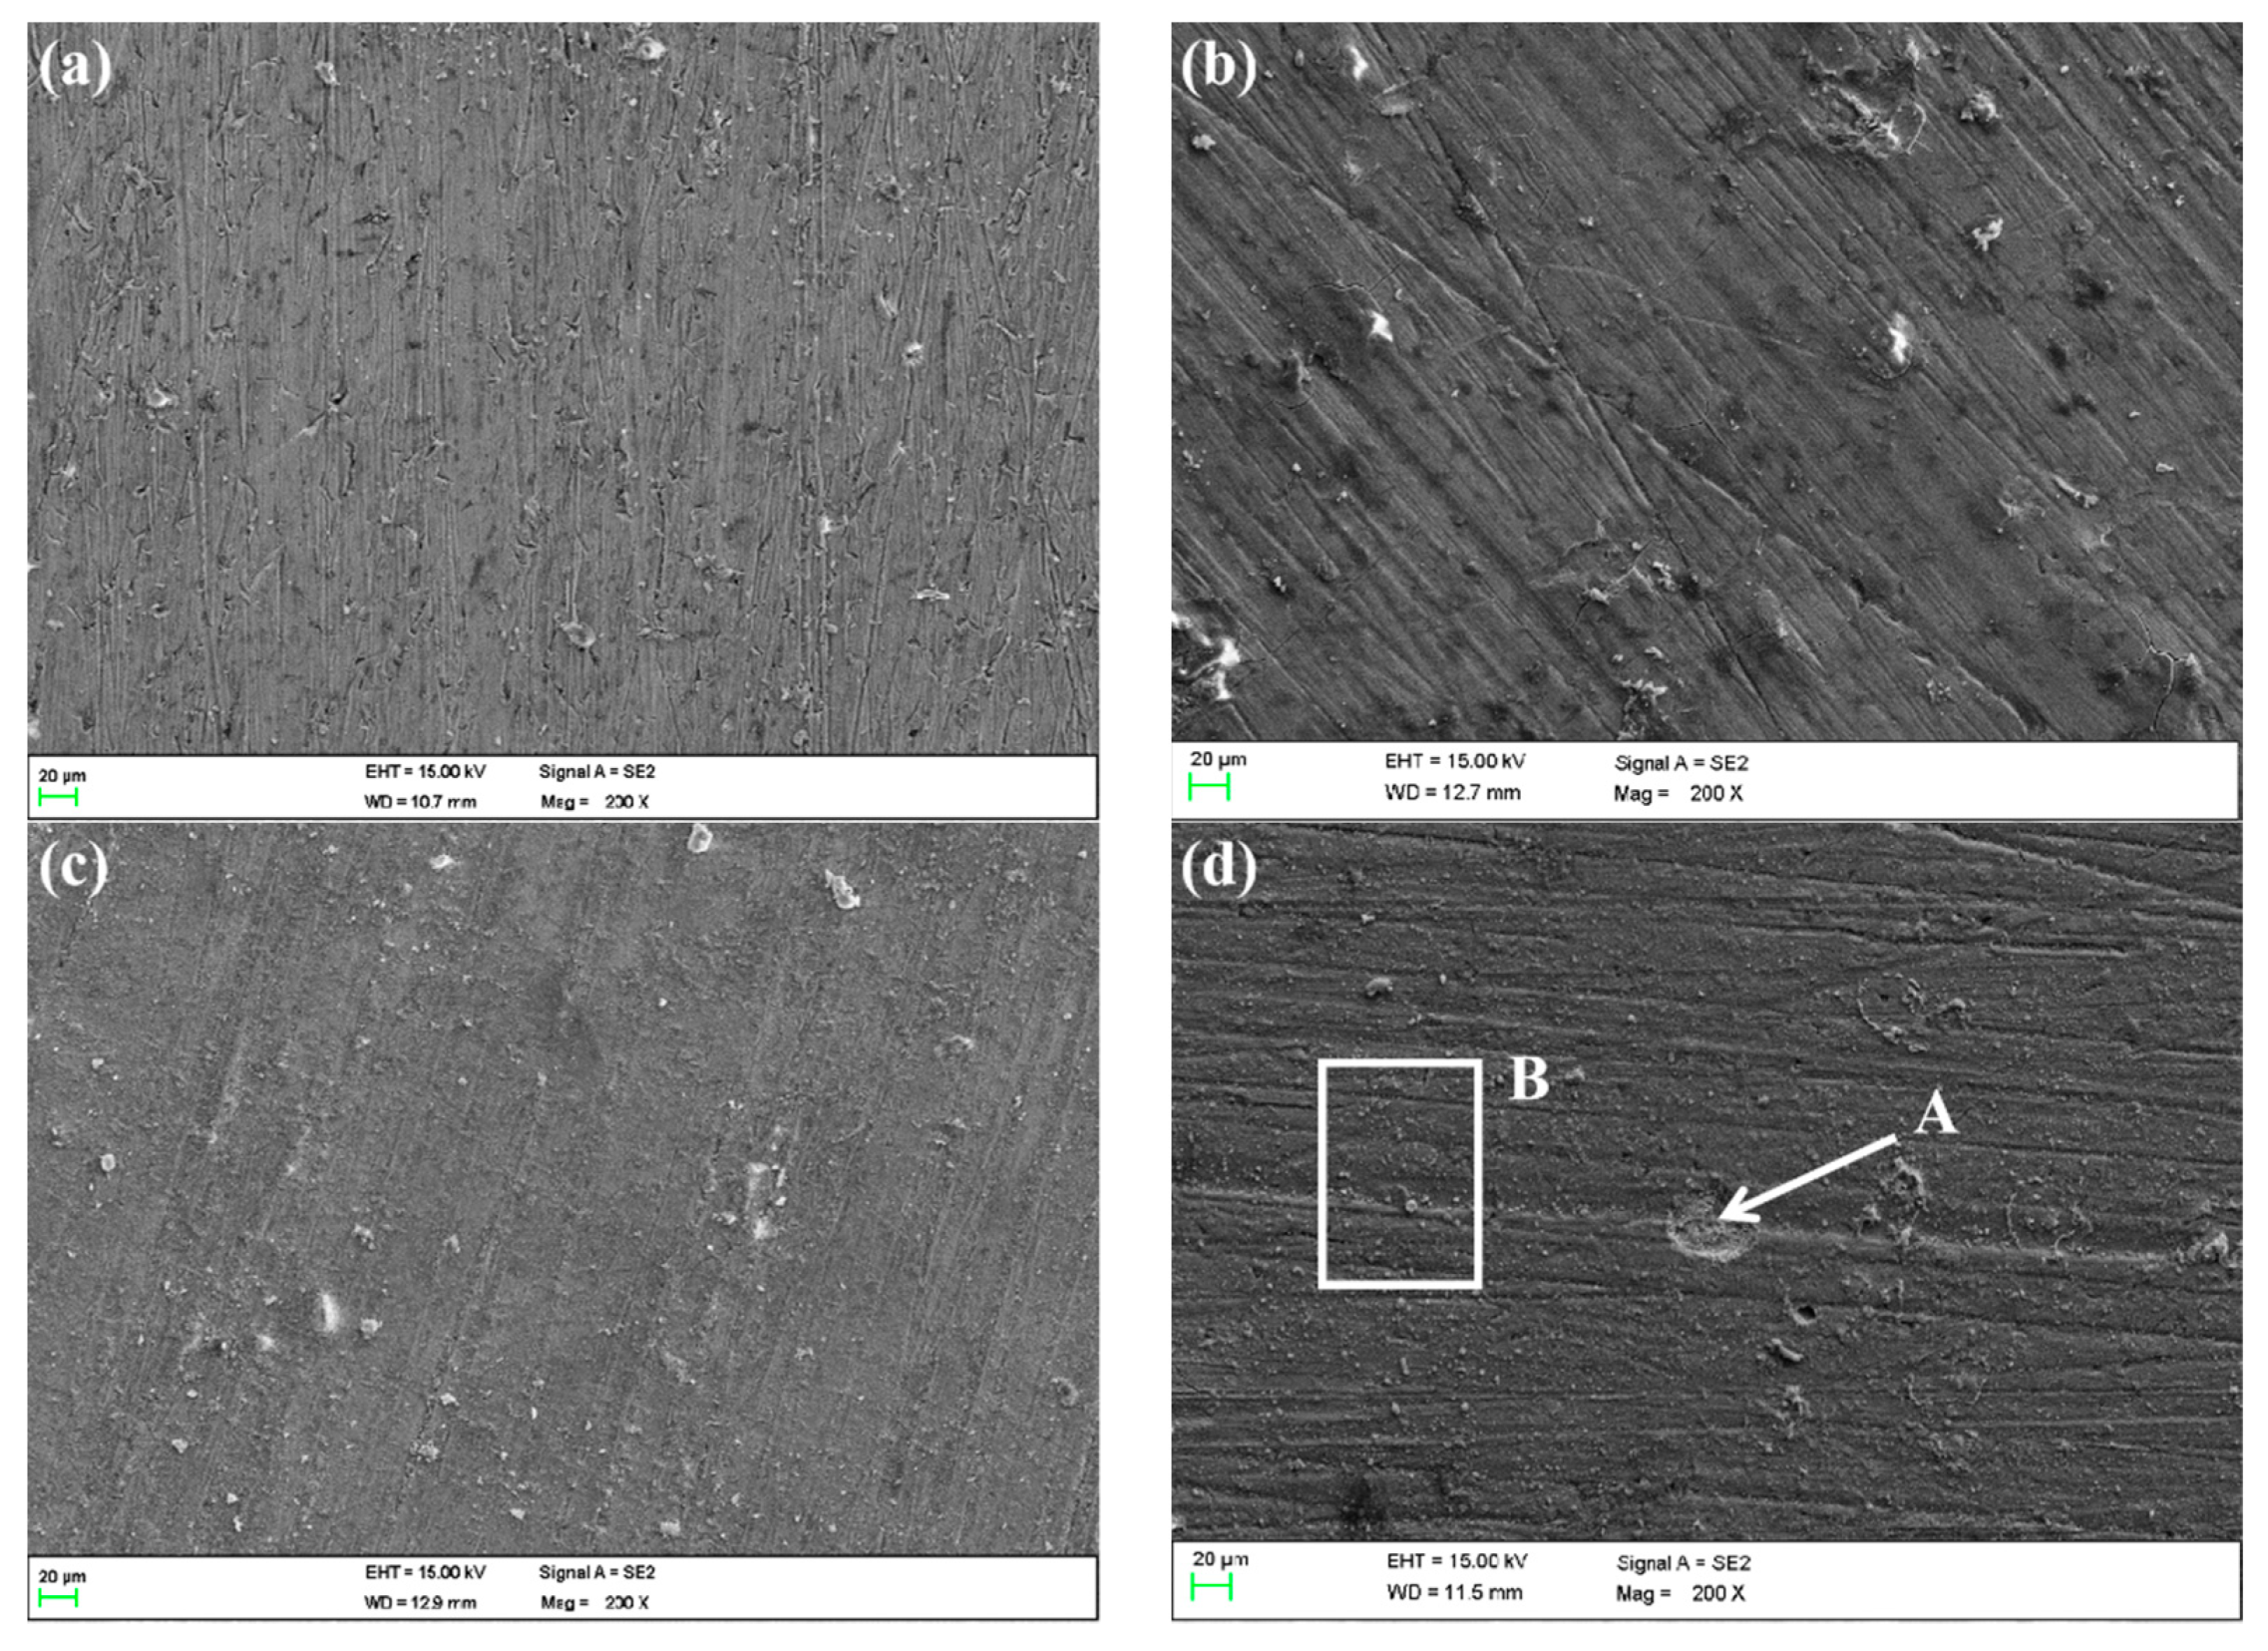
The SEM images of MZ after corrosion are shown in Figure 15. They suggest that the corrosion of MZ in different flowing rates of seawater for 30 days is slight. The whole surface was covered by corrosion production according to EDS analysis, as shown in Table 3. However, the corrosion production film was not intact on the surface of MZ corroded in 5 ± 0.1 m/s seawater, as shown in Figure 15d, and the oxygen content in defect A was lower than that of B; that is to say, the formation of defect A was because of the exfoliation of corrosion production.

Figure 15.
SEM images of MZ surfaces in different flowing rates of seawater: (a) 0 m/s, (b) 1 m/s, (c) 3 m/s, (d) 5 m/s.
Table 3.
Elemental composition of MZ at different flowing rates of seawater (at%).
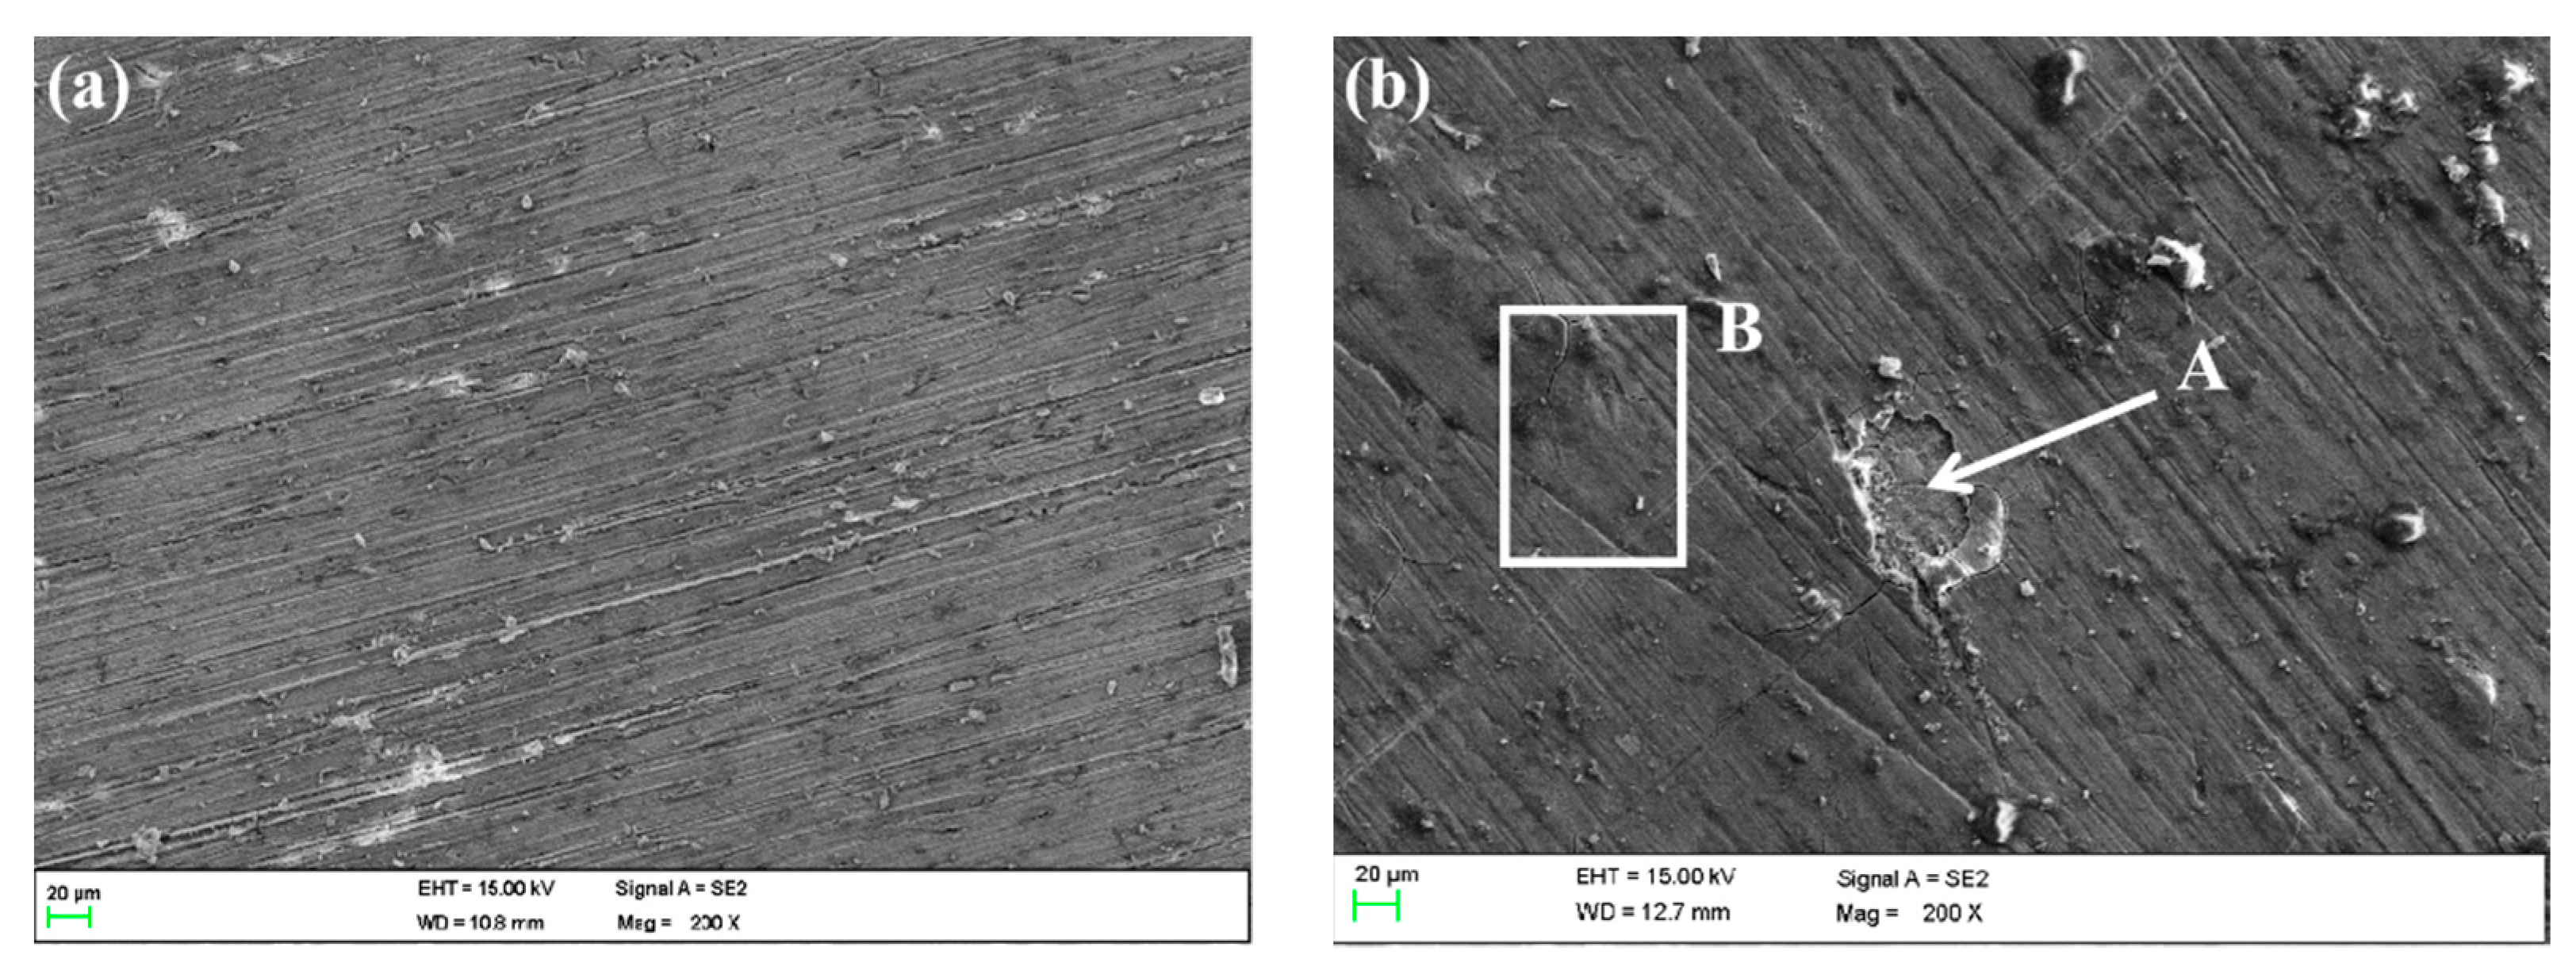
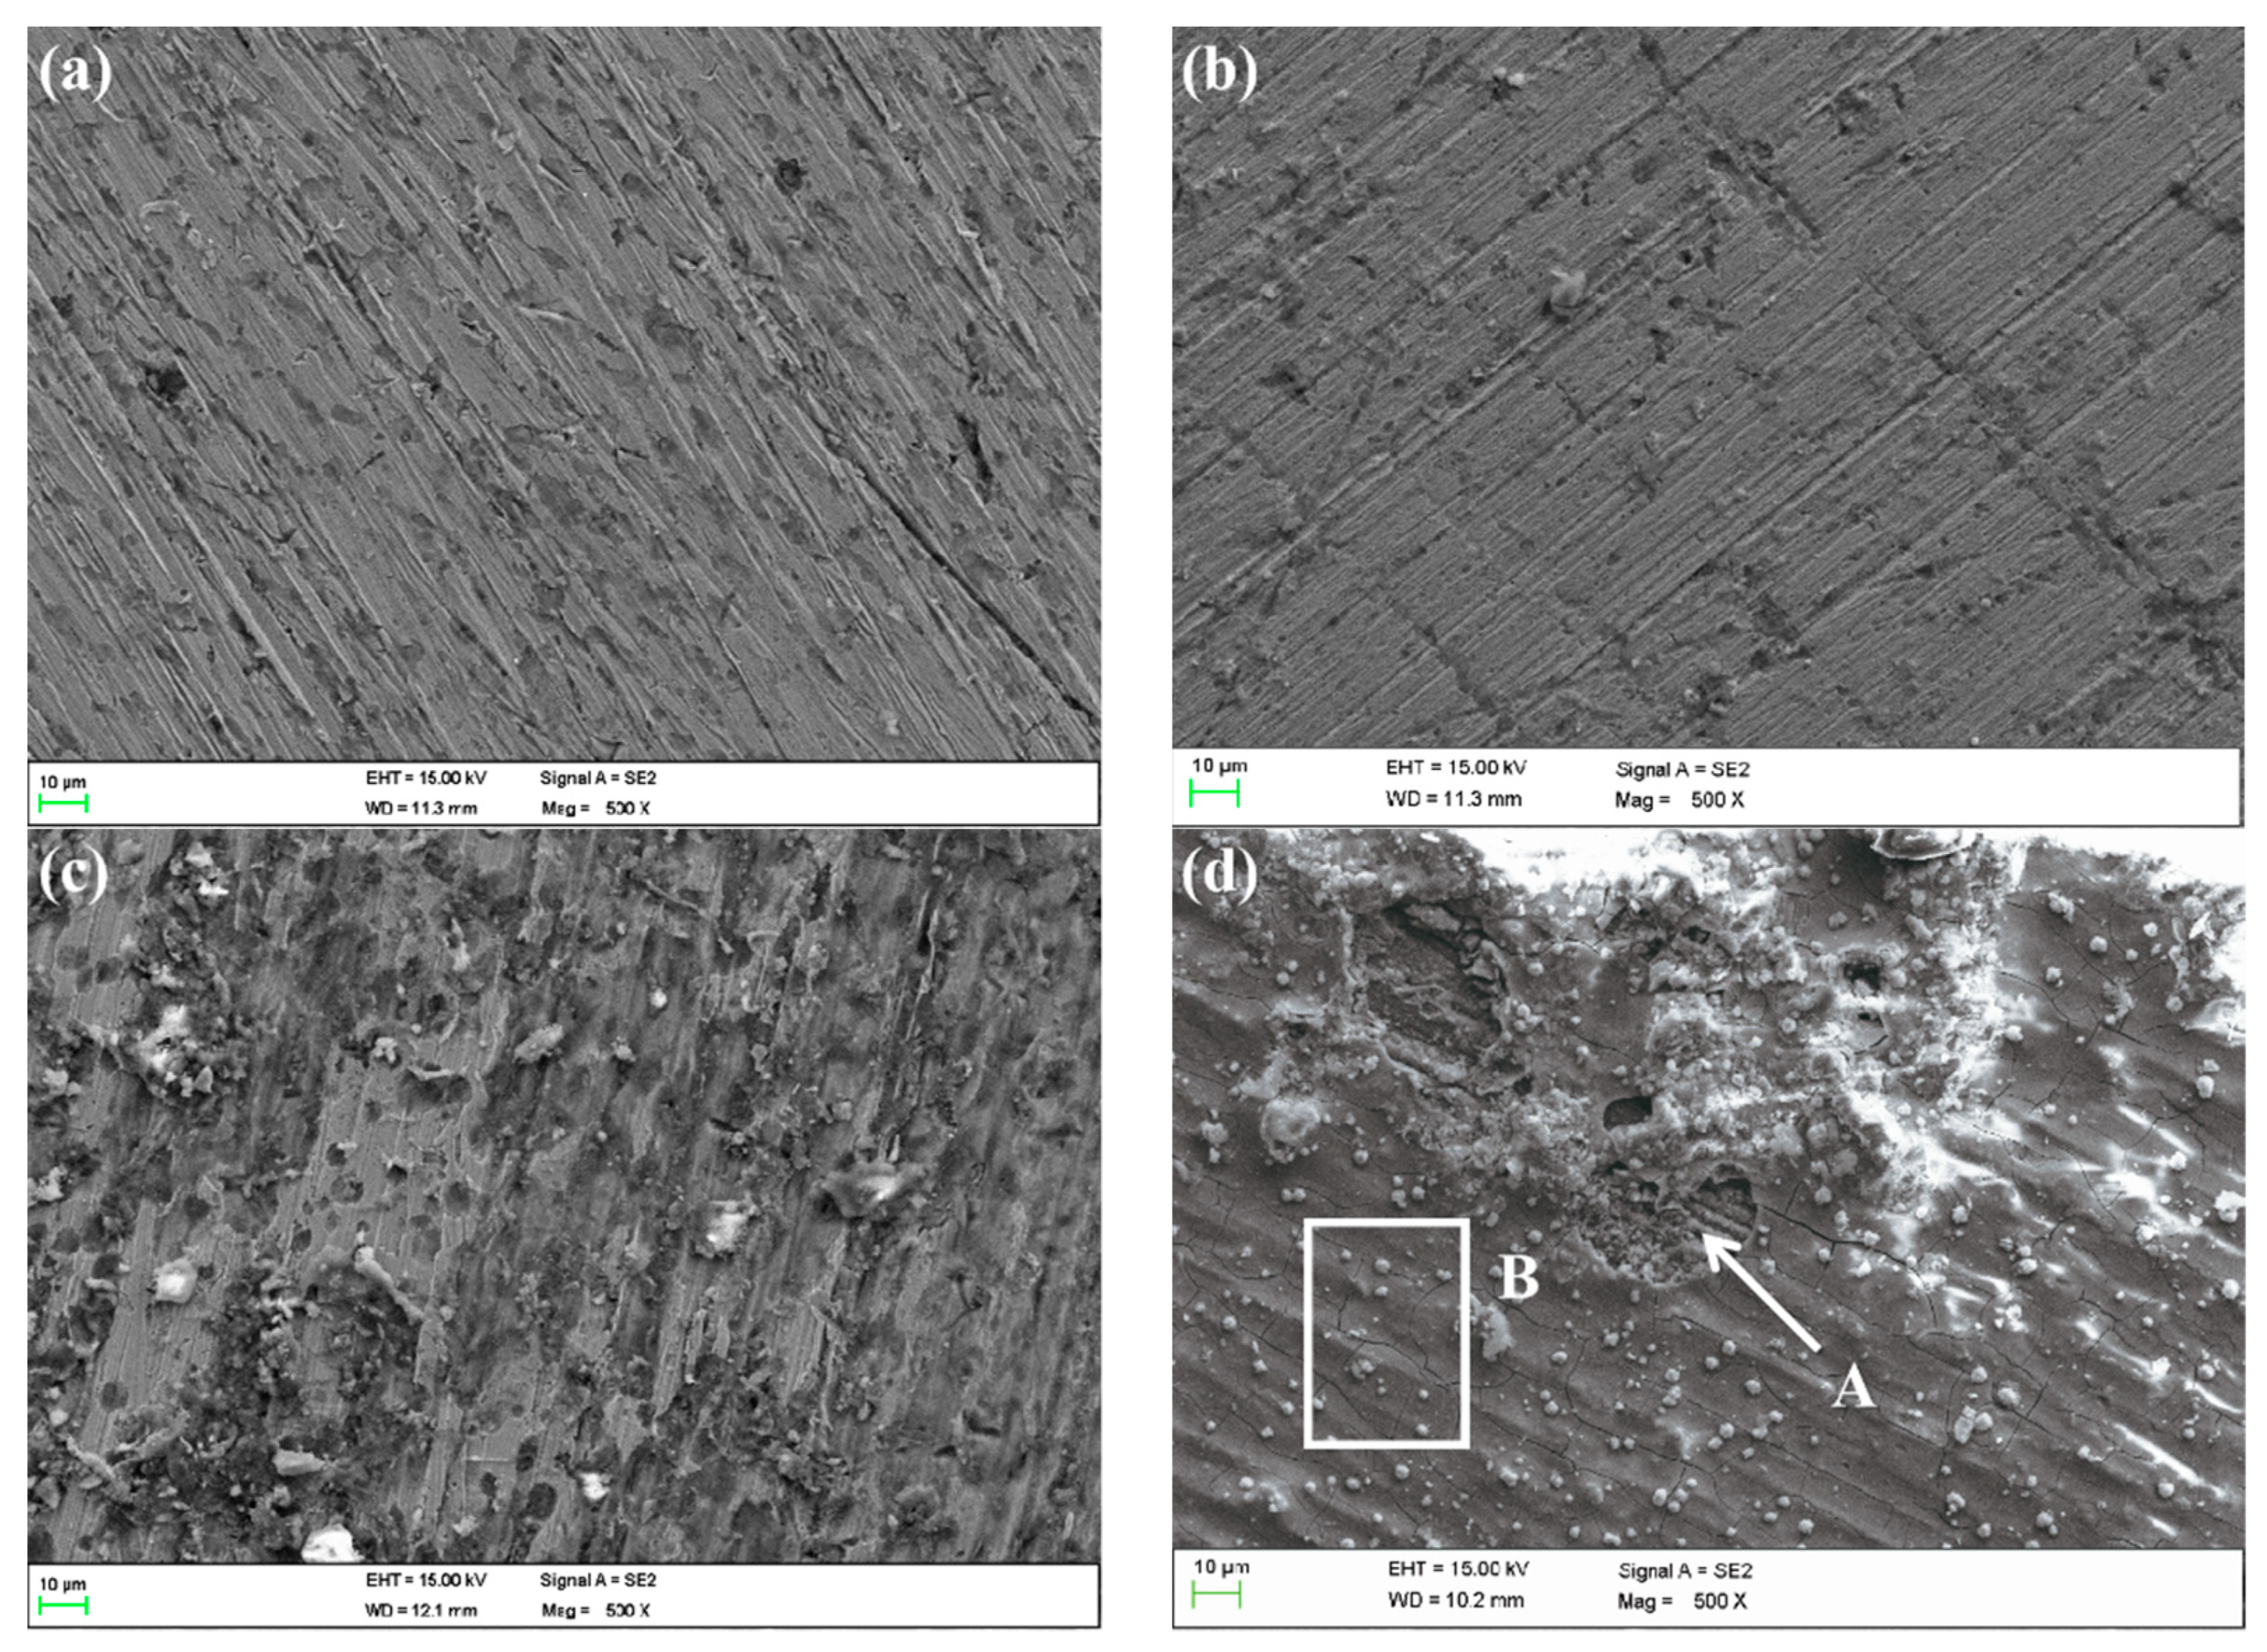
Figure 16 shows the SEM morphologies of HAZ after corroding in different flowing rate seawater for 30 days. There were obvious defects on the surface of HAZ corroded in 1 ± 0.1 m/s, 3 ± 0.1 m/s and 5 ± 0.1 m/s seawater, and the damage area increased with the flowing rate increase.


Figure 16.
SEM morphology of HAZ surface in different flowing rates of seawater: (a) 0 m/s, (b) 1 m/s, (c) 3 m/s, (d) 5 m/s.
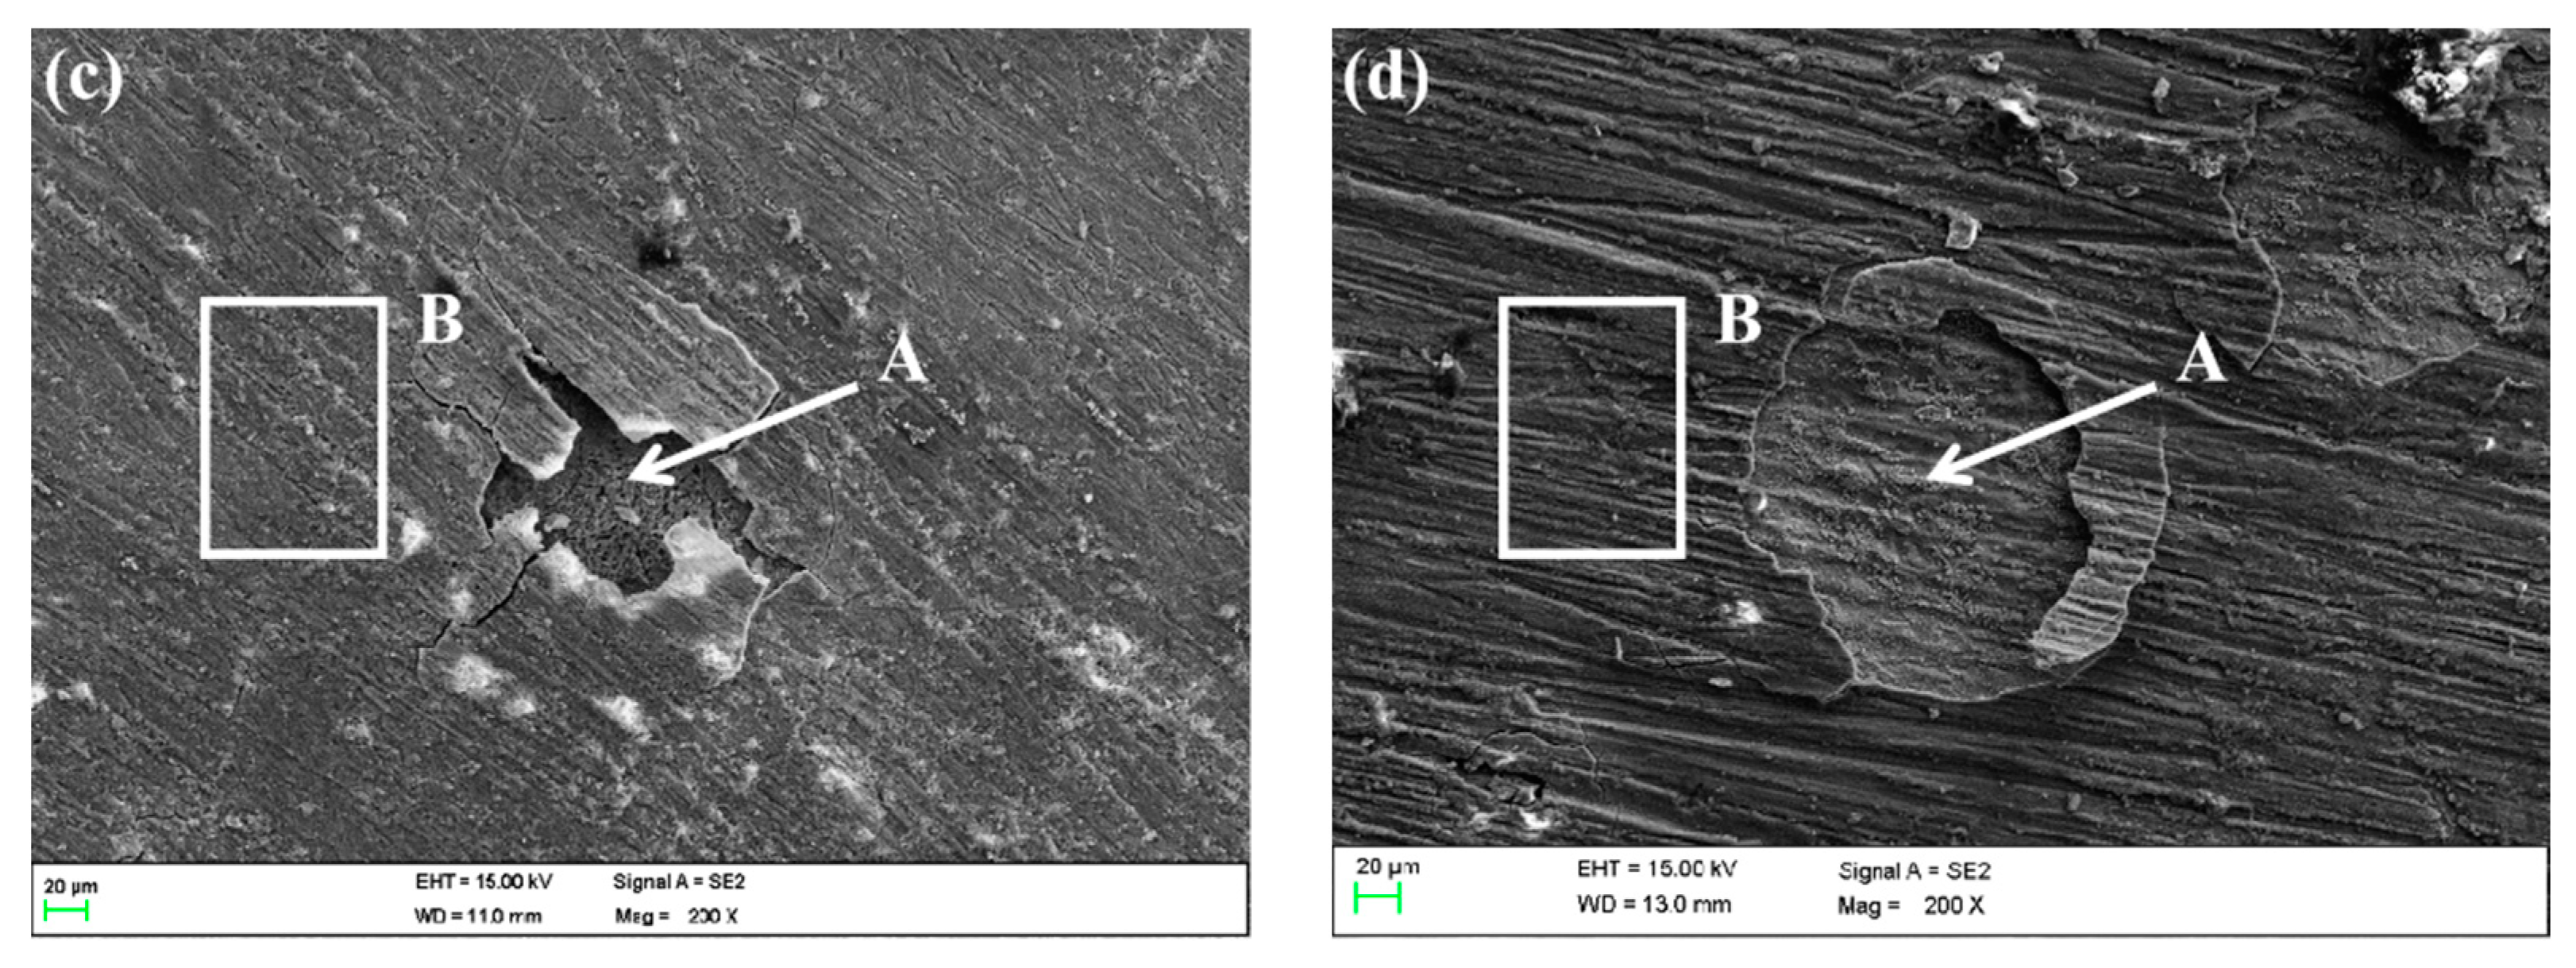
The corrosion morphologies of WZ were similar to those of MZ; the corrosion production film was relatively complete except that in 5 ± 0.1 m/s seawater, as shown in Figure 17.

Figure 17.
SEM morphology of WZ surface in different flowing rates of seawater: (a) 0 m/s, (b) 1 m/s, (c) 3 m/s, (d) 5 m/s.
3.5. Composition of Corrosion Production Analysis
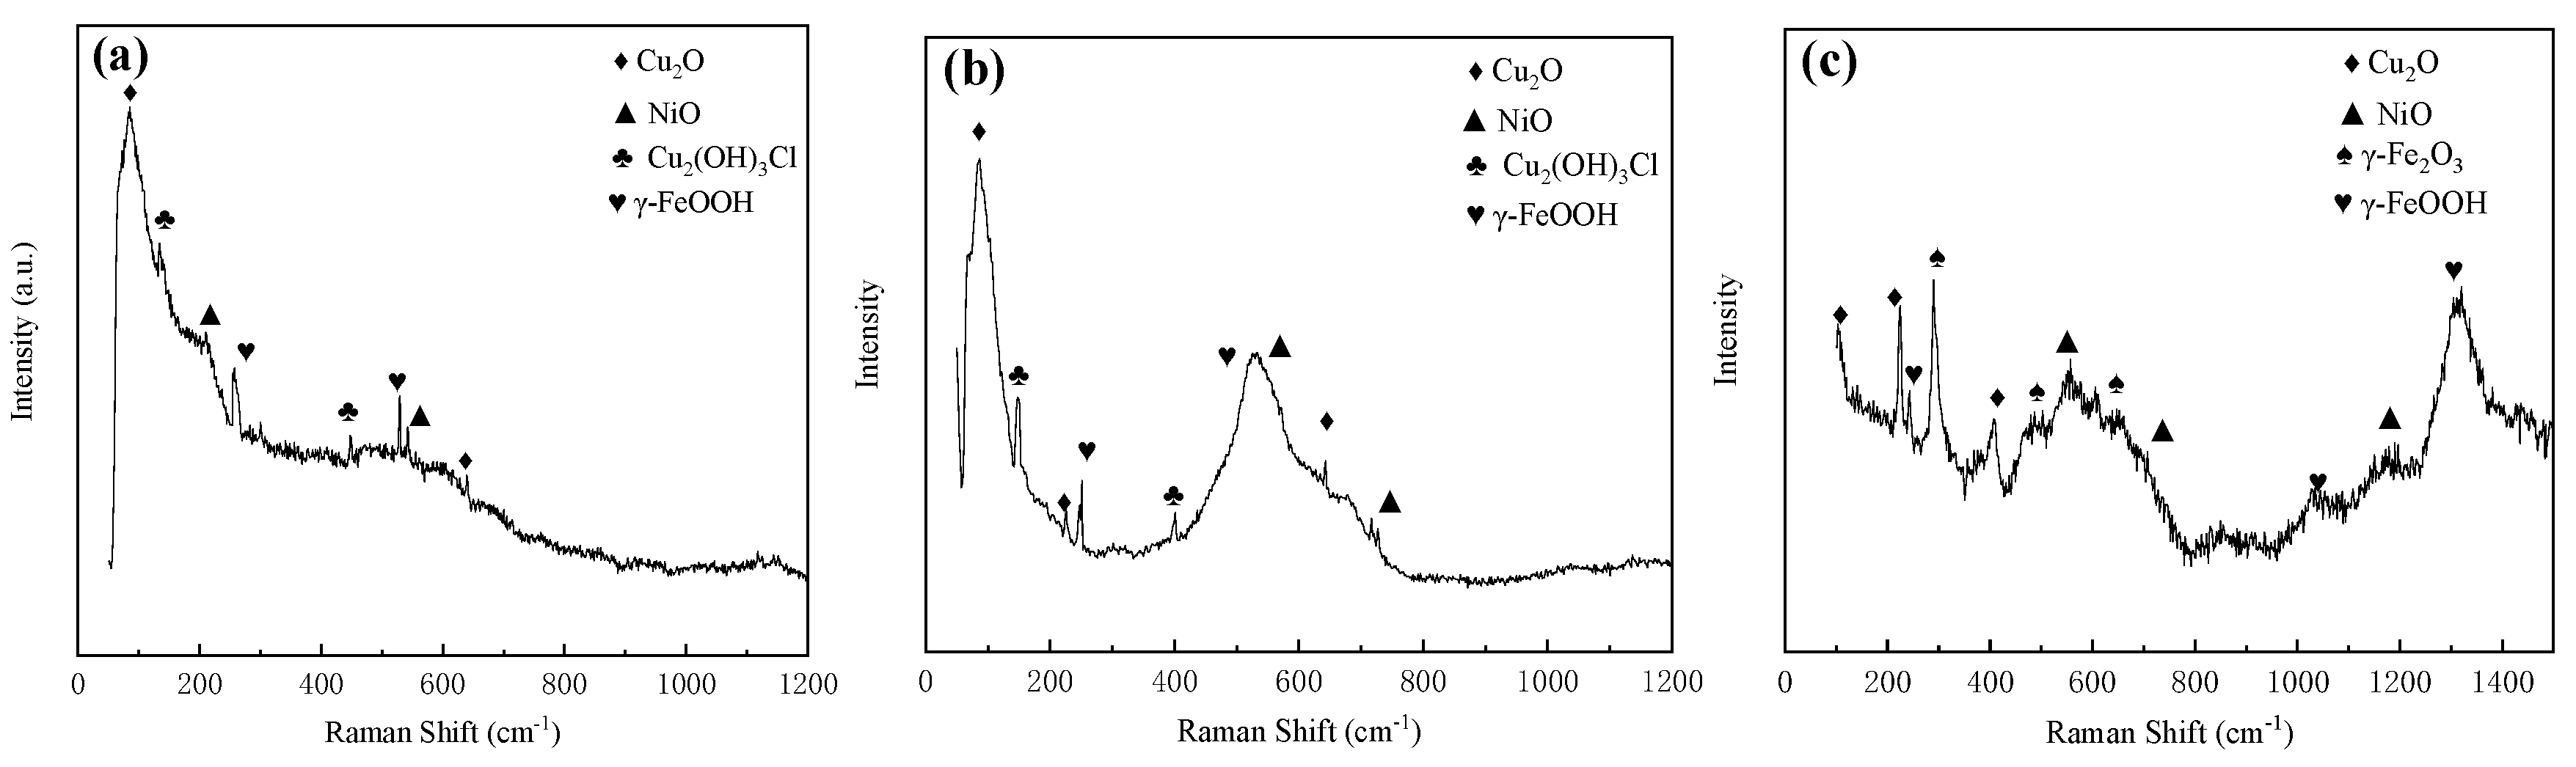
The compositions of corrosion production of MZ, HAZ and WZ were analyzed by Raman spectroscopy, and the results are shown in Figure 18. According to the peak of Raman spectroscopy, the corrosion production consisted of Cu2O (96 cm−1, 220 cm−1, 410 cm−1, 639 cm−1), NiO (210 cm−1, 543 cm−1, 722 cm−1), Cu2(OH)3Cl (153 cm−1, 400 cm−1, 447 cm−1), γ-Fe2O3 (300 cm−1, 515 cm−1, 645 cm−1) and γ-FeOOH (255 cm−1, 528 cm−1, 645 cm−1, 1057 cm−1, 1307 cm−1).

Figure 18.
Raman spectra of corrosion production: (a) MZ, (b) HAZ and (c) WZ.
The literature reports [23] that the outer layer of corrosion production is mainly Cu2(OH)3Cl, which is loose and has nearly no protective effect on the substrate. The inner layer contains Cu2O, NiO and γ-FeOOH, which is dense and protects the substrate from corrosion. According to Raman spectroscopy analysis results, Cu2(OH)3Cl, Cu2O, NiO and γ-FeOOH all exist on the surface of MZ, HAZ and WZ.
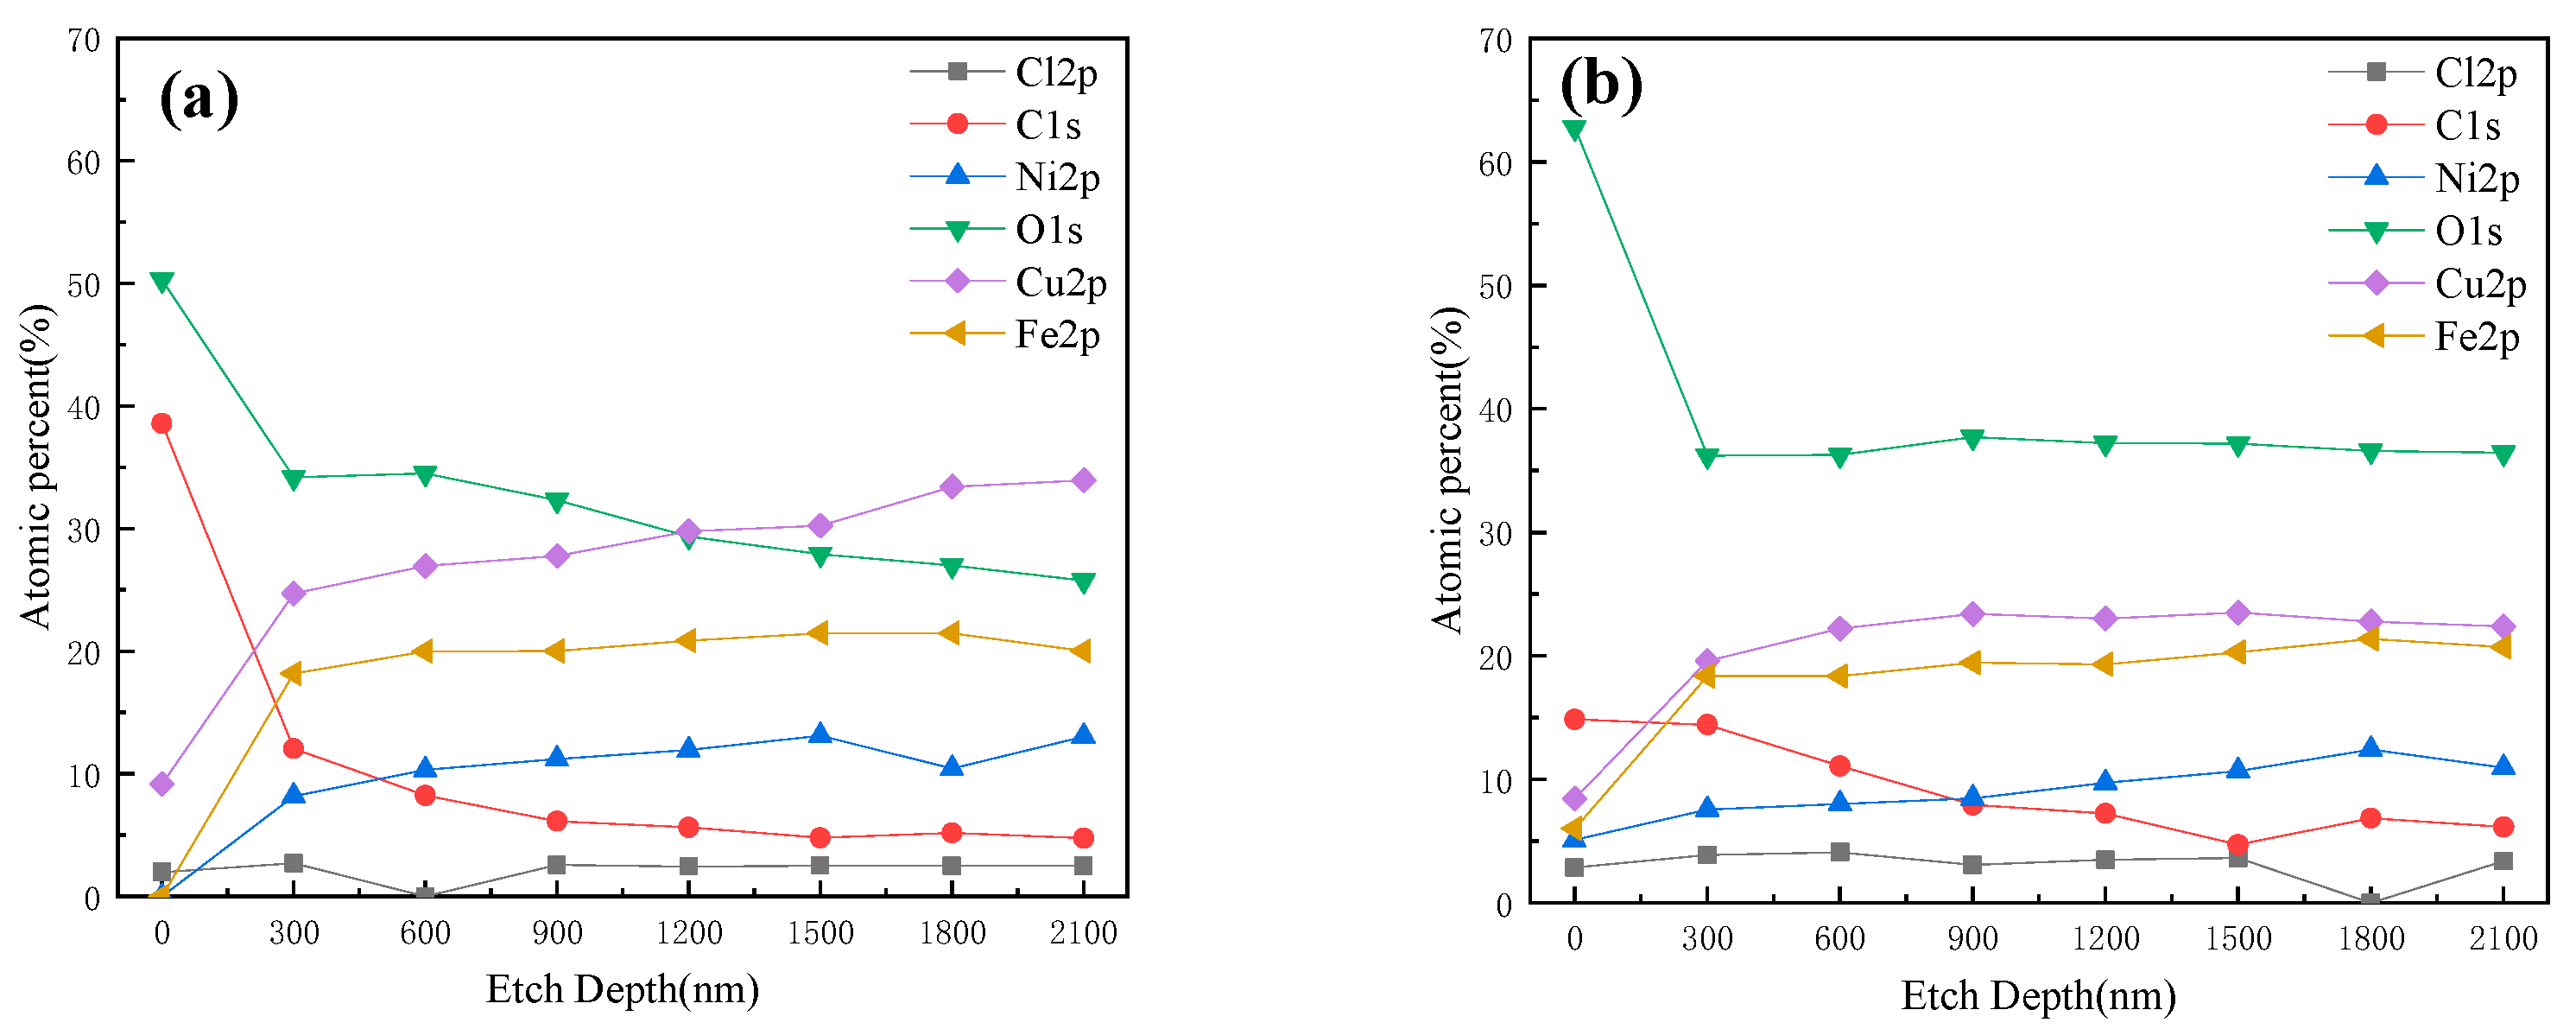
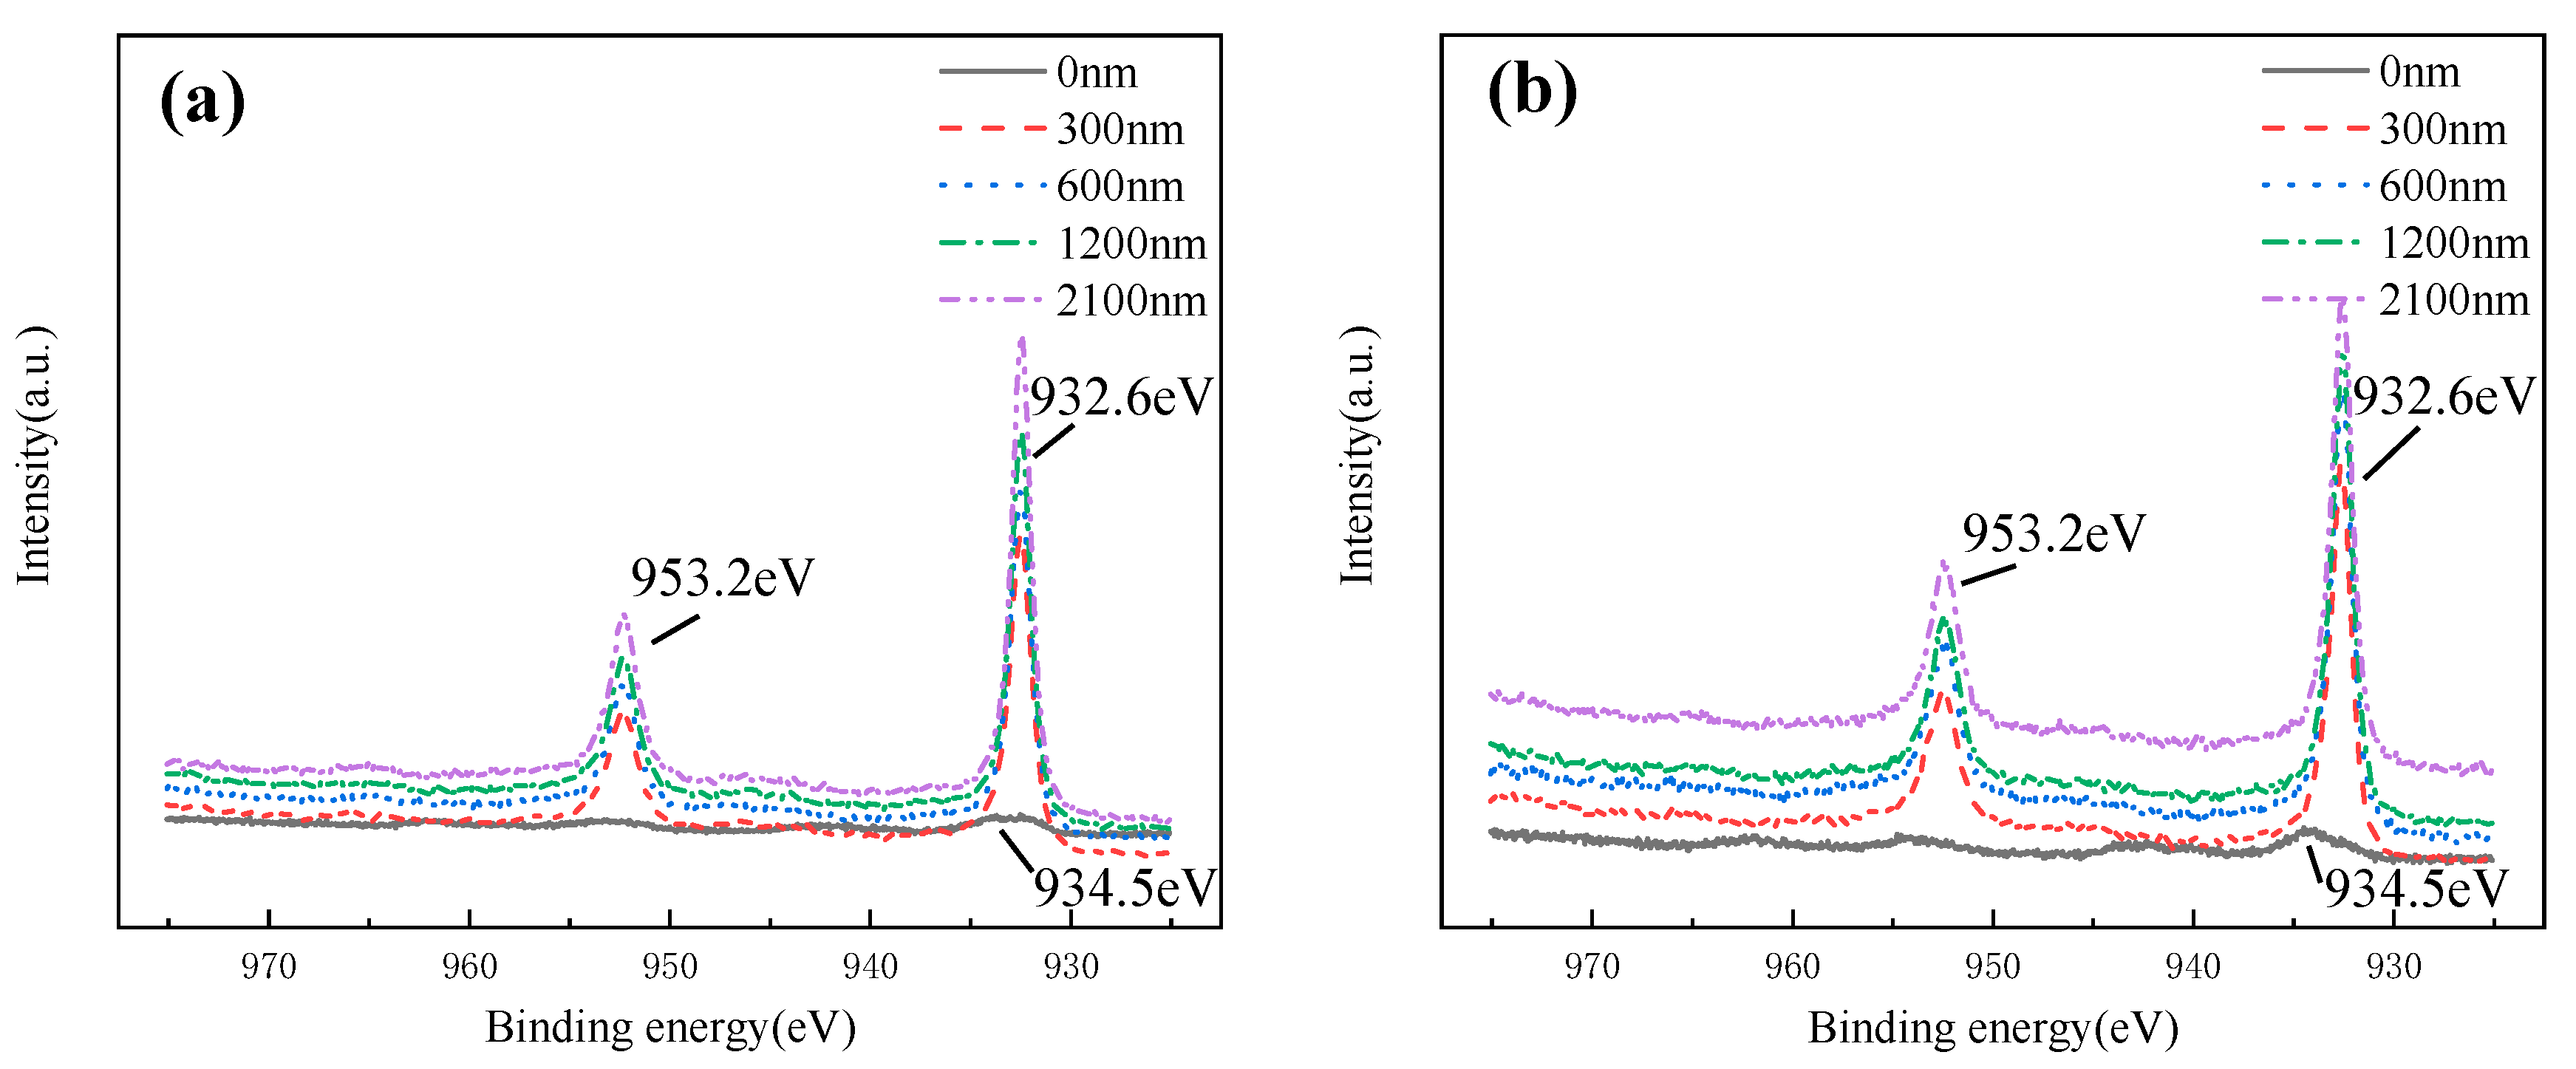
XPS profiles of Cu, O, Cl, Ni and Fe within the sputtering depth of 0–2100 nm of HAZ are shown in Figure 19 after corroding in 3 ± 0.1 m/s and 5 ± 0.1 m/s seawater for 30 days. According to XPS experimental results, the O content was relatively high on the surface of corrosion production, and it dropped sharply at 300 nm depth, indicating that most O remained on the surface. The content of Cu, Ni and Fe all increased with increasing depth, indicating that the inner layer contained more Cu, Ni and Fe. The O content of corrosion production formed in 5 ± 0.1 m/s seawater was more than that formed in 3 ± 0.1 m/s seawater, and the Cu content was smaller, and Ni and Fe were similar.

Figure 19.
XPS depth profiles of Cu, O, Cl, Ni and Fe of HAZ corroded for 30 days in flowing seawater: (a) 3 m/s, (b) 5 m/s.
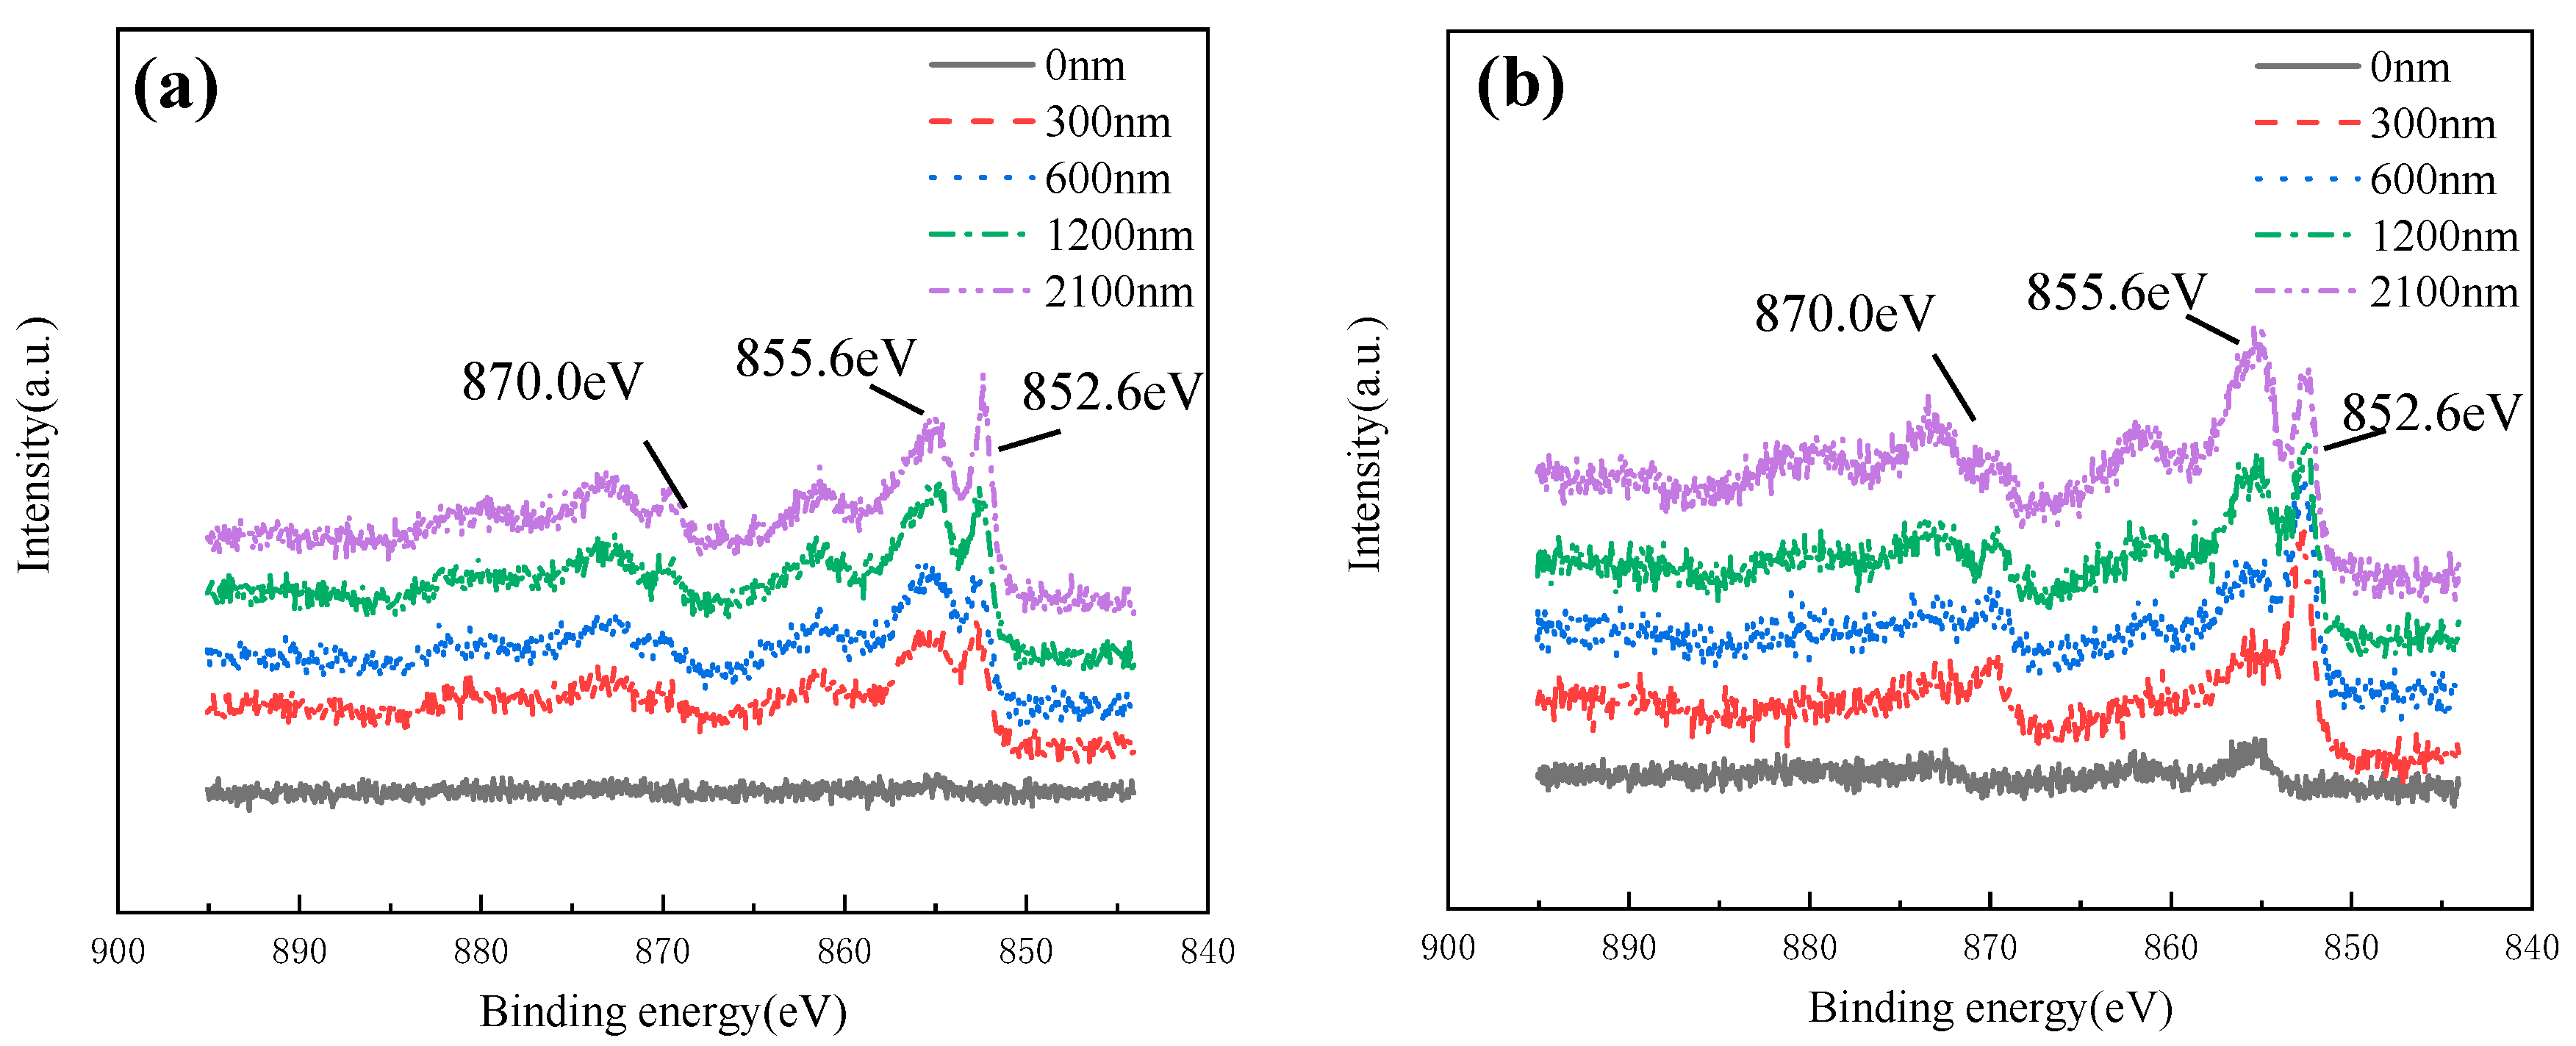
Figure 20 shows the Ni 2p spectral lines of HAZ at different depths after corroded in 3 ± 0.1 m/s and 5 ± 0.1 m/s seawater for 30 days. It was found that Ni mainly exists in the form of Ni(II) (855.6 eV) on the surface of the production film, while in the depth range of 300~2100 nm, Ni(852.5 eV) and Ni(II) (855.6 eV) were both found, indicating that the Ni element existed in the form of Ni and Ni(II) in the inner layer. Combined with the analysis of Raman spectral data, Ni(II) existed in the form of NiO.
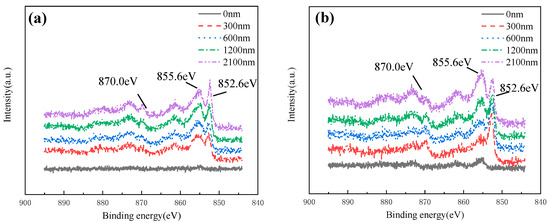
Figure 20.
Ni 2p XPS spectra of HAZ corroded in flowing seawater: (a) 3 m/s, (b) 5 m/s.
Cu 2p at different depths of corrosion production is shown in Figure 21. A small amount of Cu (II) (2p 3/2 peak binding energy ~934.5 eV) existed in the out layer. In the depth ranging from 300 nm to 2100 nm, Cu mainly existed in the form of Cu (I) (2p 3/2 peak binding energy ~932.6 eV, 2p 1/2 peak binding energy ~953.2 eV). Combined with Raman spectral data analysis, Cu (I) and Cu (II) existed in the forms of Cu2O and Cu2(OH)3Cl, respectively. Cu2(OH)3Cl was the main composition of out layer production, while the inner layer was mainly Cu2O.

Figure 21.
Cu 2P spectral lines of HAZ corroded in flowing seawater: (a) 3 m/s, (b) 5 m/s.
4. Discussion
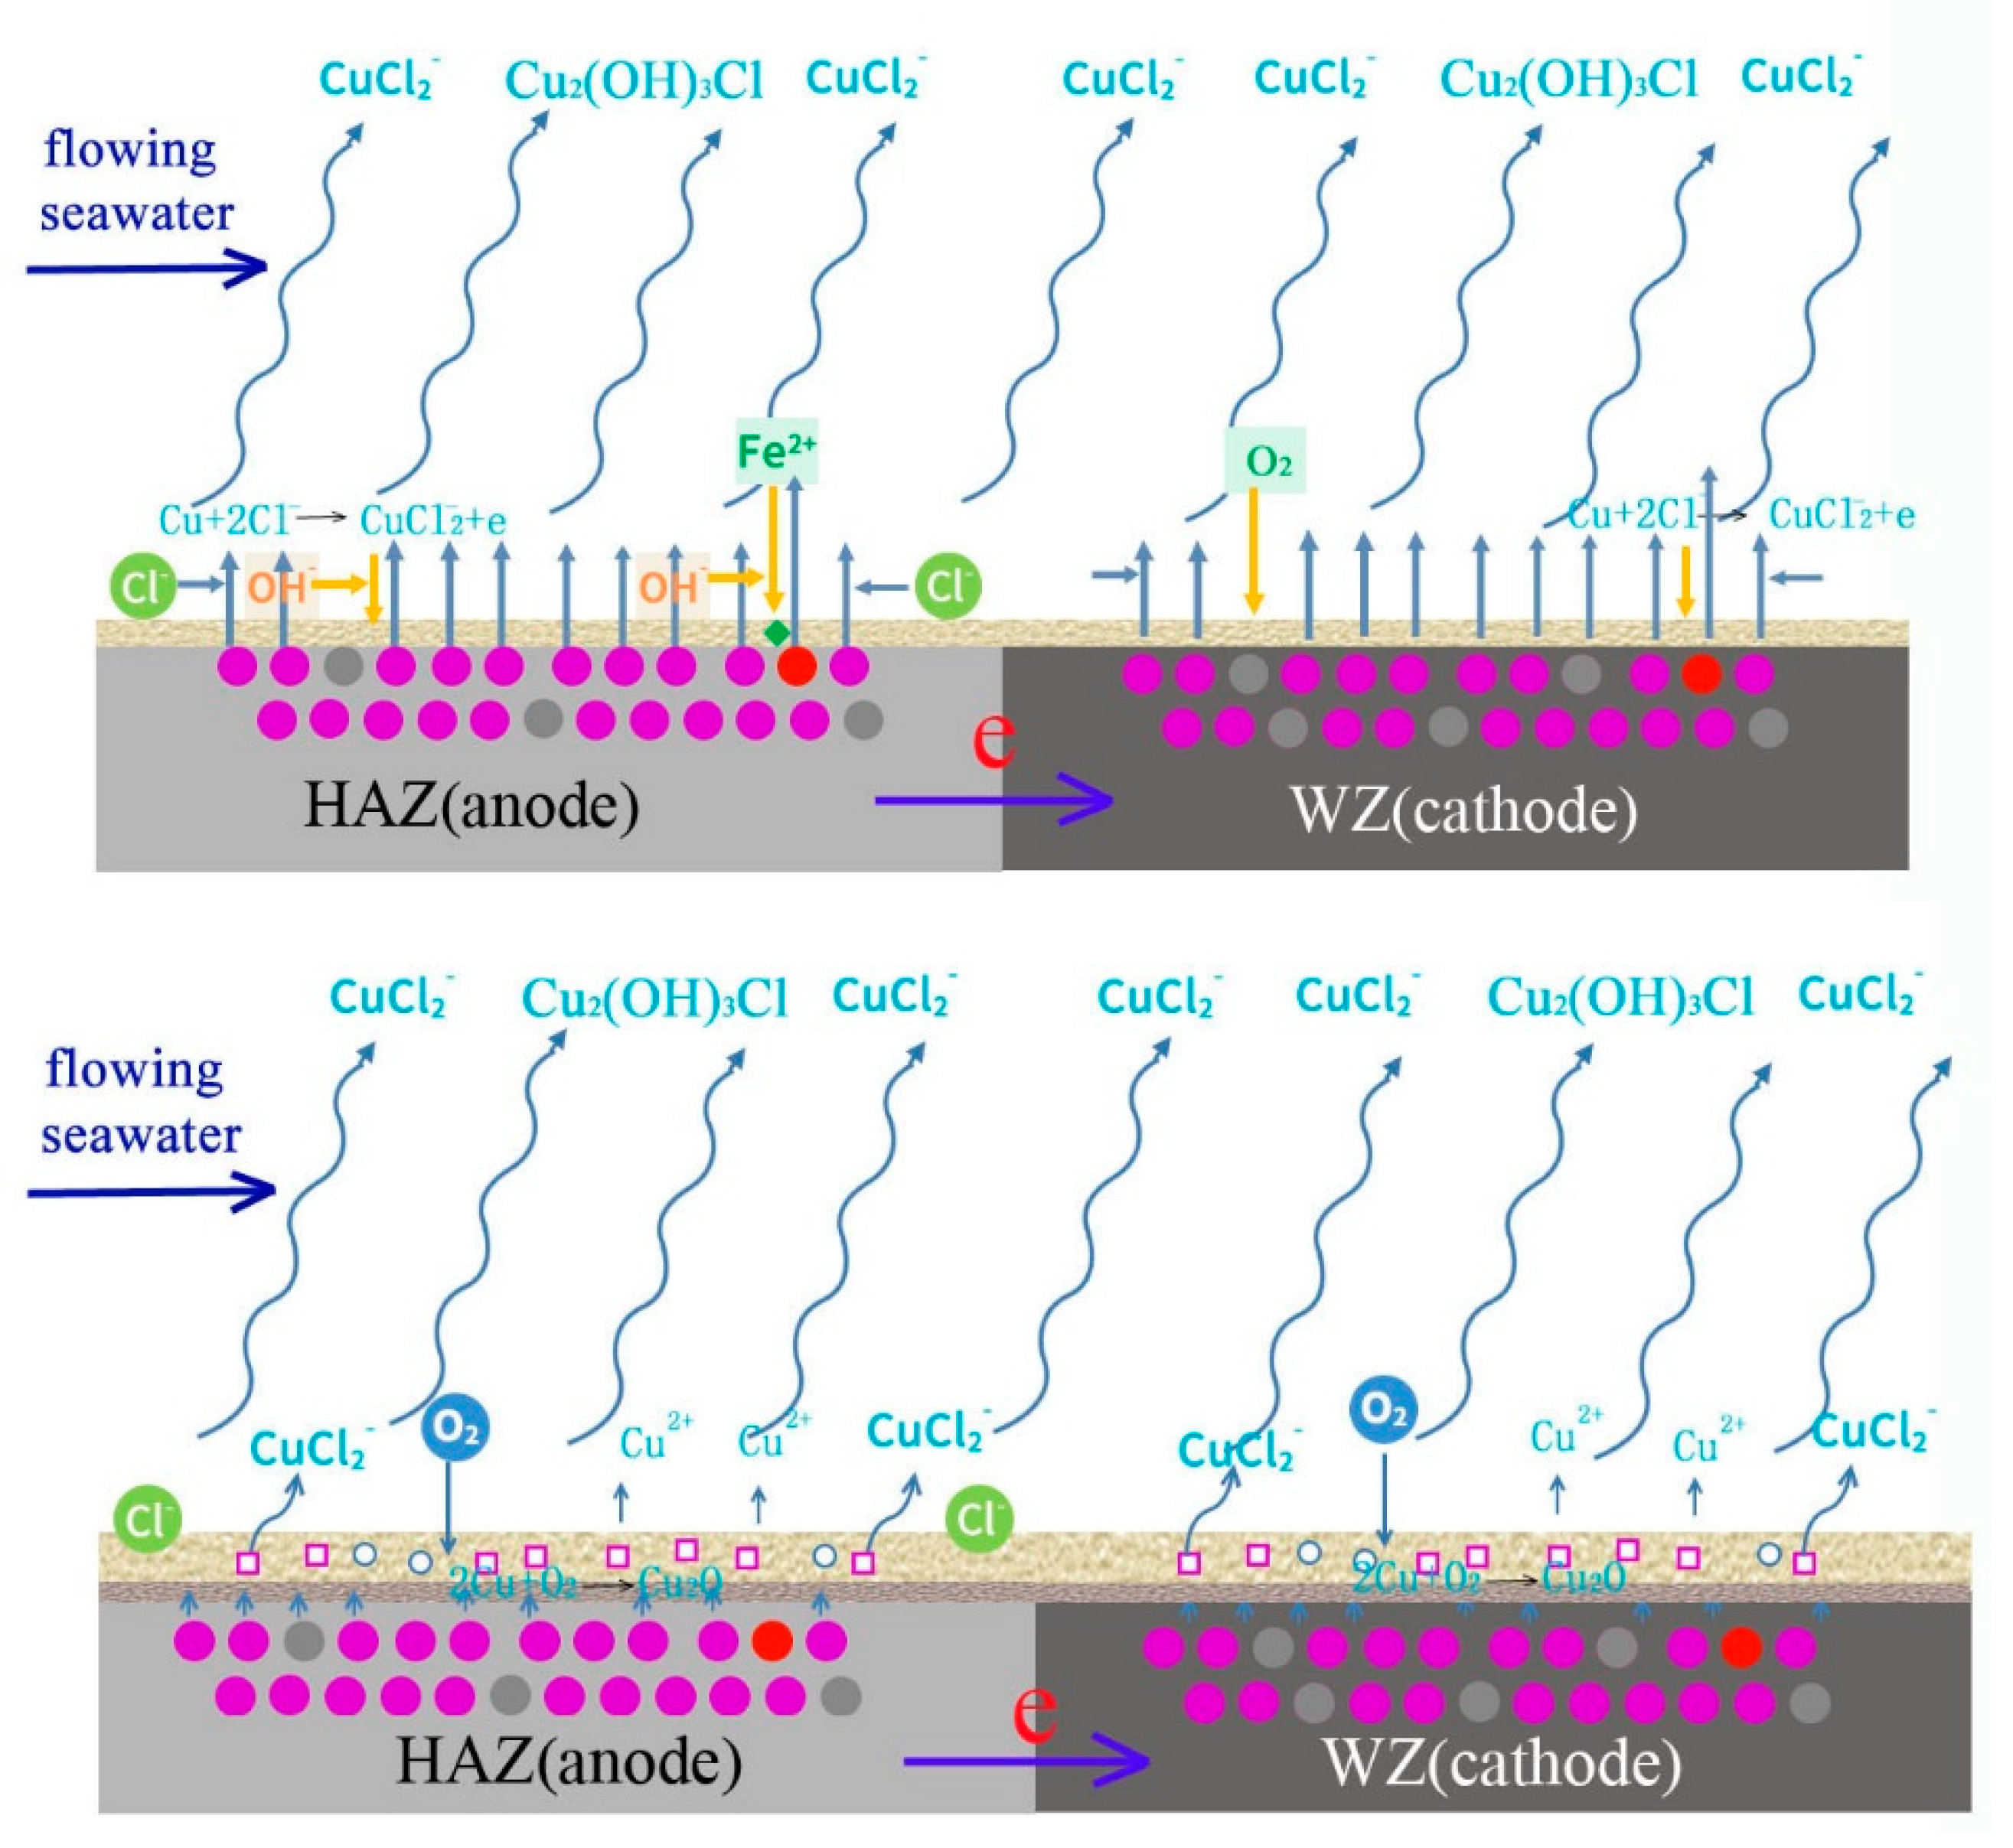
The corrosion process of welding is shown in Figure 22. In the initial period, the corrosion of HAZ is accelerated because it acts anode coupled to WZ, and there is no protective corrosion production. The main reactions are shown as follows.
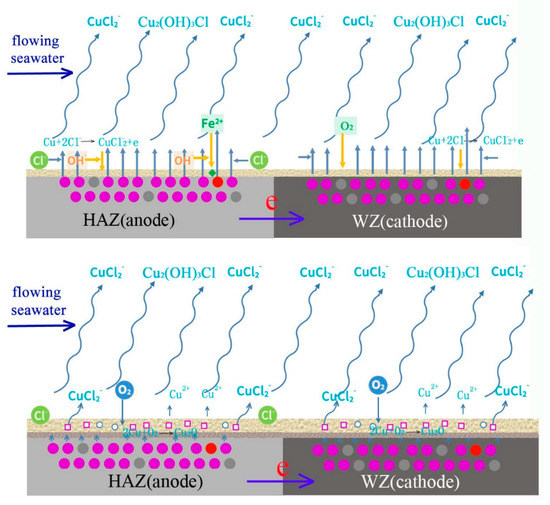

Figure 22.
Schematic diagram of corrosion mechanism of cupronickel welding.
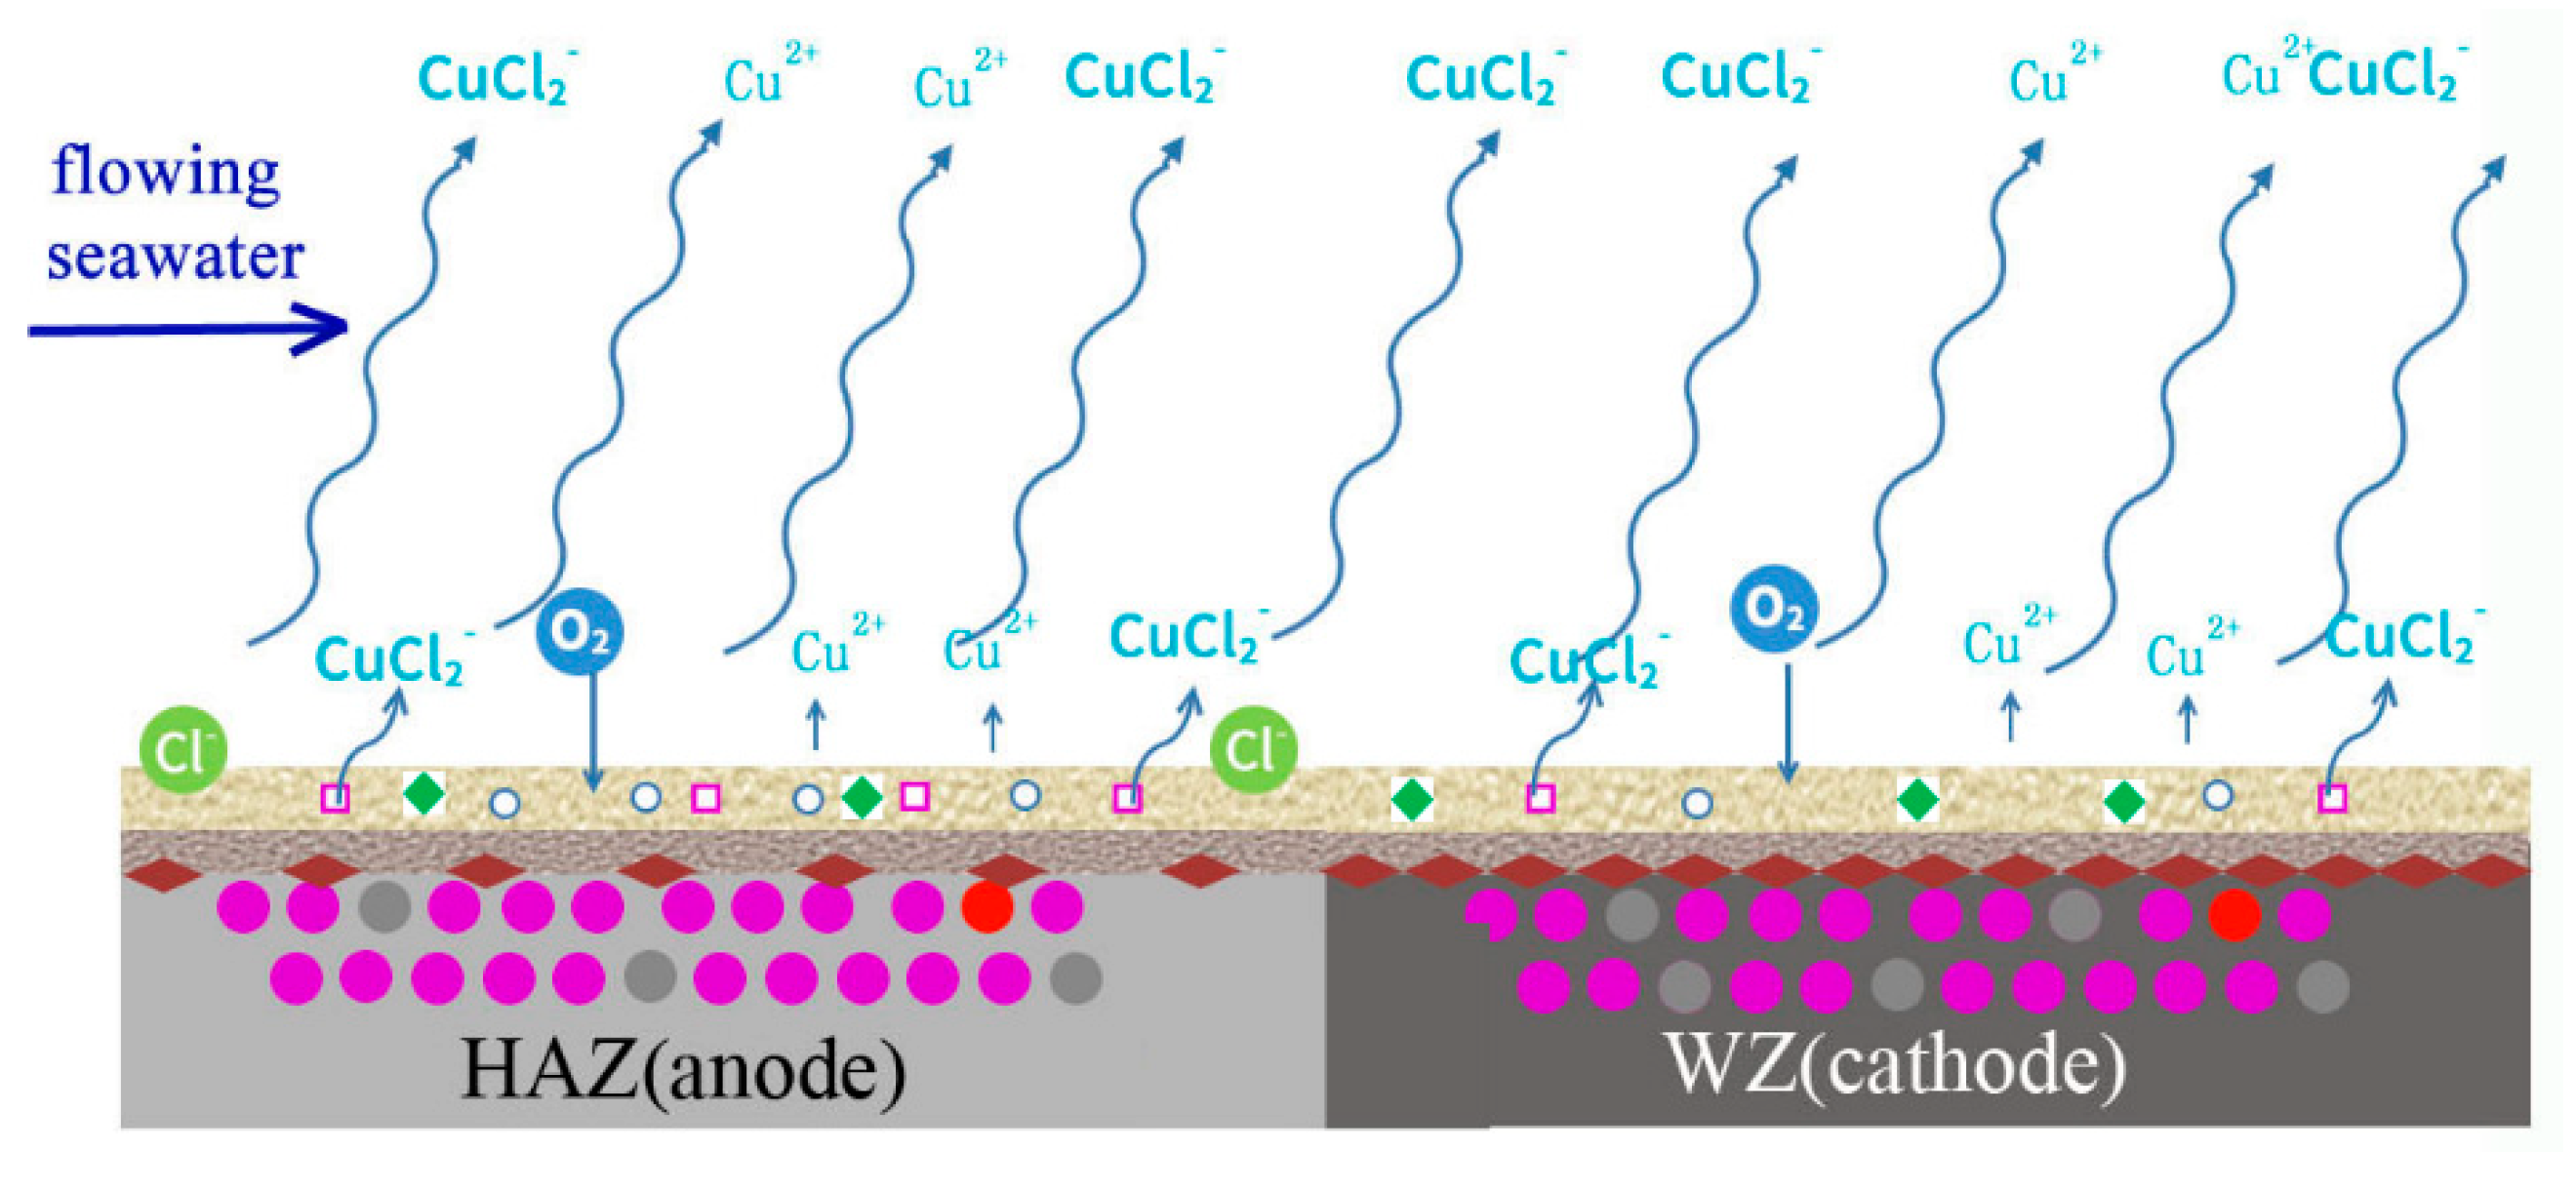
With the deposition of corrosion production, a protective film forms on the surfaces of HAZ and WZ, and galvanic corrosion is inhibited. Due to the shearing force of flowing seawater and the low adhesion of out layer production, most of Cu2(OH)3Cl is washed away and mainly Cu2O deposits on the surface of HAZ and WZ. Then, corrosion reactions mainly occur at Cu2O pores, cation vacancies and electron holes.
With the corrosion of HAZ and WZ, the thickness of corrosion production increases and more NiO is generated to occupy Cu2O cation vacancies and electron holes. The protective performance is further improved, and the corrosion rates of HAZ and WZ decrease. Due to the adhesion of corrosion production deposited on HAZ being lower than those on WZ, they easily fall off and the corrosion of HAZ is faster than that of WZ.
The corrosion of HAZ is induced by two reasons: galvanic corrosion between HAZ and WZ in the initial stage, and corrosion resistance decreases due to the falling off of corrosion production in high flowing rate seawater.
5. Conclusions
(1) HAZ is preferentially corroded for the minimum corrosion resistance and galvanic corrosion between WZ and HAZ; HAZ is more easily corrosion failure compared to MZ and WZ.
(2) The corrosion resistance of MZ, HAZ and WZ is obviously influenced by the immersion time and flowing rate of seawater; the corrosion resistance of corrosion production reaches the biggest value after 20 days.
(3) The corrosion production of HAZ is more easily peeled by the flowing seawater and the corrosion resistance of HAZ is the smallest, which is the main reason for HAZ preferential corrosion in flowing seawater.
Author Contributions
Conceptualization, S.X.; Methodology, S.X. and D.Z.; Data curation, S.B., R.L. and Y.L.; Validation, J.H.; Writing—original draft preparation, S.B., R.L. and Y.L.; Writing—review & editing, S.X. and J.Q. All authors have read and agreed to the published version of the manuscript.
Funding
This research received no external funding.
Data Availability Statement
Not applicable.
Conflicts of Interest
The authors declare no conflict of interest.
References
- Hodgkiess, T.; Vassiliou, G. Complexities in the erosion corrosion of copper–nickel alloys in saline water. Desalination 2005, 183, 235–247. [Google Scholar] [CrossRef]
- Barik, R.C.; Wharton, J.A.; Wood, R.J.K.; Stokes, K.R. Galvanic corrosion of nickel–aluminium bronze coupled to titanium or Cu–15Ni alloy in brackish seawater. In Corrosion Behaviour and Protection of Copper and Aluminium Alloys in Seawater; Woodhead Publishing: Sawston, UK, 2007; Volume 49, pp. 128–141. [Google Scholar]
- Schleich, W. Typical failures of CuNi 90/10 seawater tubing systems and how to avoid them. In Proceedings of the EUROCORR 2004: Long Term Prediction and Modeling of Corrosion, Nice, France, 12–16 September 2004; Volume 29, pp. 285–296. [Google Scholar]
- Stewart, W.C.; Laque, F.L. Corrosion resisting characteristics of iron modified 90:10 cupronickel alloy. Corrosion 1952, 8, 259–277. [Google Scholar] [CrossRef]
- Powell, C.A.; Michels, H.T. Copper-nickel alloys for seawater corrosion resistance and anti-fouling—A state of the art review. In Proceedings of the Corrosion 2000: Annual Corrosion Conference, Orlando, FL, USA, 26–31 March 2000. [Google Scholar]
- Efird, K.D.; Anderson, D.B. Sea water corrosion of 90-10 and 70-30 Cu-Ni: 14 year exposures. Mater. Perform. 1975, 14, 37–40. [Google Scholar]
- Badawy, W.A.; Ismail, K.M.; Fathi, A.M. Effect of Ni content on the corrosion behavior of Cu–Ni alloys in neutral chloride solutions. Electrochim. Acta 2005, 50, 3603–3608. [Google Scholar] [CrossRef]
- Drolenga, L.P.; Ijsseling, F.P.; Kolster, B.H. The influence of alloy composition and microstructure on the corrosion behaviour of Cu-Ni alloys in seawater. Mater. Corros. 1983, 34, 167–178. [Google Scholar] [CrossRef]
- Zubeir, H.M. The role of iron content on the corrosion behavior of 90Cu-10Ni alloys in 3.5% NaCl solutions. Anti-Corros. Meth. Mater. 2012, 59, 195–202. [Google Scholar] [CrossRef]
- Ijsseling, F.P.; Drolenga, L.P.; Kolster, B.H. Influence of temperature on corrosion product film formation on CuNi10Fe in the low temperature range: Part 1: Corrosion rate as a function of temperature in well aerated sea water. Br. Corros. J. 1982, 17, 162–167. [Google Scholar] [CrossRef]
- Admiraal, L.F.; Ijsseling, P.; Kolster, B.H. Influence of temperature on corrosion product film formation on CuNi10Fe in the low temperature range: Part 2: Studies on corrosion product film formation and properties in relation to microstructure and iron content. Br. Corros. J. 1986, 21, 33–44. [Google Scholar] [CrossRef]
- Ma, A.; Jiang, S.; Zheng, Y. Corrosion product film formed on the 90/10 copper–nickel tube in natural seawater: Composition/structure and formation mechanism. Corros. Sci. 2015, 91, 245–261. [Google Scholar] [CrossRef]
- Kear, G.; Barker, B.D.; Stokes, K. Electrochemical corrosion behaviour of 90-10 Cu-Ni alloy in chloride-based electrolytes. J. Appl. Electrochem. 2004, 34, 659–669. [Google Scholar] [CrossRef]
- Efird, K.D. Effect of fluid dynamics on the corrosion of copper base alloys in Sea Water. Corrosion 1977, 33, 3–8. [Google Scholar] [CrossRef]
- Lee, C.M.; Bond, S.; Woollin, P. Preferential weld corrosion: Effects of weldment microstructure and composition. In Proceedings of the Corrosion 2005: Annual Corrosion Conference, Houston, TX, USA, 3–7 April 2005. [Google Scholar]
- Hu, S.B.; Liu, L.; Cui, Y. Influence of hydrostatic pressure on the corrosion behavior of 90/10 coppernickel alloy tube under alternating dry and wet condition. Corros. Sci. 2019, 146, 202–212. [Google Scholar] [CrossRef]
- Zhang, D.L.; Liu, R.; Liu, Y.S. Multiscale Characterization of Seawater Pipe Erosion of B10 Copper-nickel Alloy Welded Joints. Sci. Rep. 2022, 12, 123–355. [Google Scholar] [CrossRef] [PubMed]
- Jafari, H.; Nourouzi, S.; Aval, H.J. A Study on the Microstructure and Mechanical Properties of Dissimilar Joints of Copper-nickel Alloy and Austenitic Stainless Steel Welded by GTAW Process. Modares Mech. Eng. 2017, 17, 49–58. [Google Scholar]
- Duarte, T.; Meyer, Y.A.; Osório, W.R. The Holes of Zn Phosphate and Hot Dip Galvanizing on Electrochemical Behaviors of Multicoatings on Steel Substrates. Metals 2022, 12, 863. [Google Scholar] [CrossRef]
- Meyer, Y.A.; Bonatti, R.S.; Bortolozo, A.D.; Osório, W.R. Electrochemical behavior and compressive strength of Al-Cu/xCu composites in NaCl solution. J. Solid State Electrochem. 2021, 25, 1303–1317. [Google Scholar] [CrossRef]
- Meyer, Y.A.; Menezes, I.; Bonatti, R.S.; Bortolozo, A.D.; Osório, W.R. EIS investigation on the corrosion behavior of steel bars embedded into modified concretes with eggshell contents. Metals 2022, 12, 417. [Google Scholar] [CrossRef]
- Keerthiga, G.; Vijayshankar, D.; Prasad, M.J.N.V.; Peron, M.; Albinmousa, J.; Raman, R.K.S. Electrochemical Corrosion Resistance of Mg Alloy ZK60 in Different Planes with Respect to Extrusion Direction. Metals 2022, 12, 782. [Google Scholar] [CrossRef]
- Efird, K.D. The Synergistic Effect of Ni and Fe on the Sea Water Corrosion of Copper Alloys. Corrosion 1977, 33, 347–350. [Google Scholar] [CrossRef]
Disclaimer/Publisher’s Note: The statements, opinions and data contained in all publications are solely those of the individual author(s) and contributor(s) and not of MDPI and/or the editor(s). MDPI and/or the editor(s) disclaim responsibility for any injury to people or property resulting from any ideas, methods, instructions or products referred to in the content. |
© 2023 by the authors. Licensee MDPI, Basel, Switzerland. This article is an open access article distributed under the terms and conditions of the Creative Commons Attribution (CC BY) license (https://creativecommons.org/licenses/by/4.0/).