Abstract
In this work, the effects of Ce content (0.1%, 0.2%, and 0.3 wt%) on the microstructures and mechanical properties of Al-Cu-Li alloys were investigated. The results show that the grains of Al-Cu-Li alloy are refined by adding Ce element. When Ce content is less than 0.1%, the ultimate strength of the alloy increases with the increase of Ce content. However, the ultimate strength of the alloy decreases when Ce content is above 0.1%. For Al-Cu-Li alloy with different Ce content, the aging precipitation of T1 and θ′ phases play the main strengthening role. When Ce content increases from 0.1 to 0.3%, dynamic recrystallization is promoted during hot deformation. The recrystallization of the alloys is inhibited after T6 treatment with the increase of Ce content, which can be attributed to existence of the Al8Cu4Ce phases on the grain boundary. This work provides an economical and convenient method for improving the properties of Al-Cu-Li alloys by Ce addition.
1. Introduction
In order to meet the requirement of some components with high-performance and lightweight, aluminum–lithium alloys have been applied in the fields of aerospace and transportation owing to their advantages, such as low density, low fatigue crack growth rate, high specific strength, and good high-temperature and low-temperature properties [1,2,3,4,5]. So far, three generations of aluminum–lithium alloys have been developed. The third-generation aluminum–lithium alloys, including 2195, 2050, 2099, 2198, and 2199, have been successfully used to produce the carrier rocket tank and aircraft skins, a weight reduction of about 10–20%, and a strength increase of about 15–20% [6,7]. Currently, many researchers are devoted to developing fourth-generation aluminum–lithium alloys.
Rare earth micro-alloying is one of the important methods to produce novel aluminum–lithium alloys. Some rare earth elements such as Ce, Sc, and Er could be utilized as the beneficial alloying additions in Al-Cu-Li based alloys to improve their microstructures and mechanical properties [8]. Suresh et al. [9] found that the grain was refined, and precipitation kinetics were enhanced by adding Sc to AA2195 alloy. Yu et al. [10] found that the recrystallization was restrained, and the strength of the alloy increased by adding 0.1 wt% Er to Al-3Li-1Cu-0.1Zr alloy. However, Sc, as an effective rare earth refiner, is limited by its high price [11]. Due to the high proportion of Ce content in rare earth minerals, Ce elements are mostly obtained when refining useful rare earth elements. The effects of Ce element on the microstructure of aluminum alloy are as follows [12,13]. Firstly, the diffusion of the main elements for the alloy is hindered and the coarsening of the primary phase is delayed because of the addition of Ce element. Secondly, the primary AlCuCe phase acts as a nucleating agent and increases the region of compositional supercooling, which finally reduces the distance between the secondary dendrites. Thirdly, τ1 (Al8Cu4Ce) [14,15,16] phase dispersion occurs during homogenization and thermomechanical processes, which inhibits recrystallization during the subsequent heat treatment. Chaubey et al. [17] found that the morphology of the precipitates changed from spherical to needle-like and the resistance from dislocation movement increased when the Ce content changed from 0.1% to 0.4% (mass fraction). Meanwhile, the strength of the alloy changed with the increase of Ce content. Yu et al. [18] found that the strength of the alloy increased by adding 0.2% Ce to Al-5.87Cu-1.31Li alloy. Ma et al. [19] found the strength of the alloy decreased when the Ce content of Al-4.24Cu-1.26Li alloy was about 0.11%.
Generally, the properties of aluminum alloys can be improved by means of inhibiting recrystallization. The strength and fracture toughness of aluminum alloy has been greatly improved by inhibiting recrystallization of the alloy, increasing the number of small grains and fibrous microstructures [20,21,22,23]. For Al-Cu-Li alloys, recrystallization inhibition can avoid intergranular fracture by reducing lithium segregation at the low angle grain boundary (LAGBs) and then improving the strength of the alloy [24,25]. Yu et al. [26] found that the addition of Ce element inhibited recrystallization of the alloy and improved the yield strength and fracture toughness by adding 0.29wt% Ce to Al-Cu-Li-0.13Zr alloy.
Nowadays, the effect of Ce element on the mechanical property and inhibition recrystallization of aluminum lithium alloy has not been systematically studied. In order to clarify the micro-alloying effect of the Ce element, Al-3.5Cu-1.2Li alloys with different Ce content were fabricated in our work. The mechanical properties and microstructural evolution of the alloy after rolling and heat treatment were investigated in this paper. The feasibility of Ce addition to improve the alloy strength and the addition of optimal Ce addition are discussed in detail. This study can provide an economical and convenient method for performance enhancement.
2. Experimental Materials and Procedures
The experimental materials were Al-3.5Cu-1.2Li-0.5Mg-0.3Mn-0.3Zn-0.11Zr (wt.%) with different Ce contents, as shown in Table 1. The alloys in this paper were called AL1-AL4, respectively, according to the Ce contents. In order to fabricate the alloys, pure Al, Li, Zn, Mg, and master alloys of Al-Cu, Al-Mn, and Al-Zr were melted in a high-purity graphite crucible inside a vacuum high-frequency induction furnace and were poured into the pre-heated mold. Then, the experimental ingots of AL1-AL4 were obtained.

Table 1.
Chemical composition of experimental alloys (wt.%).
The experimental plates of AL1-AL4 alloy with dimensions of 110 mm × 40 mm × 20 mm were taken from the ingot by Electrospark Wire-Electrode Cutting (BMG Co., Ltd., Suzhou, China). The specimens were heat treated at a temperature of 470 °C for 8 h and a temperature of 520 °C for 24 h, and then cooled in air. The specimens were rolled at a temperature of 420 °C until the thickness of the specimens was 4 mm and the deformation extent of the specimen was about 80%. After the rolling process, the specimens were solution-treated at a temperature of 500 °C for 2 h and quenched in water within 3 s. Then, the specimens were age-treated at a temperature of 175 °C for 24 h.
In order to carry out the microstructure observation and mechanical property measurement, the specimens were machined along the rolling direction (RD), normal direction (ND), and transverse direction (TD). The tensile properties of the alloys after heat treatment were measured with a CMT-5105 testing machine (WANCE Co., Ltd., Shenzhen, China) at rate of 2 mm/min. The results were obtained from the average value of five tensile specimens in the same condition.
The microstructures of the specimens were characterized using an optical microscope (OM, Zeiss, Primotech, Berlin, Germany), the X-ray diffraction (XRD, Bruker, Karlsruhe, Germany), the electron back-scatter diffraction (EBSD, Carl Zeiss, Oberkoichen, Germany), and a JEOL-2100F transmission electron microscope (TEM, FEI Company, Hillsboro, OR, USA). The samples for OM observation were mechanically ground, then etched in standard Keller’s reagent (1 mL HF + 1.5 mL HCl + 2.5 mL HNO3 + 95 mL H2O). The samples for EBSD observation were firstly mechanically ground and then electrochemically polished in the mixed 10% HClO4 and 90% C2H5OH solution at a temperature of −20 °C. In order to perform the TEM analysis, the specimens were mechanically thinned to thicknesses of about 60 μm, punched into foils of 3 mm in diameter, and electro-polished in 30% HNO3 and 70% CH3OH solution below −30 °C. The analysis was performed at an acceleration voltage of 200 kV. Positions and dimensions of the specimen for microstructure observation and tensile test are shown in Figure 1.
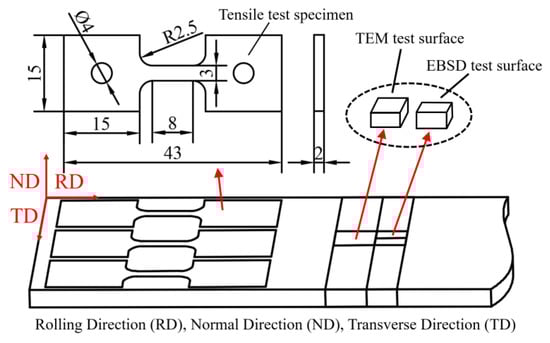
Figure 1.
Positions and dimensions of the specimens for microstructure observation and tensile test.
3. Results and Discussion
3.1. Microstructures of As-Cast Alloys
Figure 2 illustrates the optical micrographs of as-cast AL1, AL2, AL3, and AL4 alloys. It can be seen that the α-Al dendrites were refined with the addition of Ce. As shown in Figure 2a, the coarse dendrite microstructure can be seen in the as-cast microstructure of the AL1 alloy. For AL2 alloy, the dendrites are still relatively coarse, but the dendrites were refined compared to AL1 alloy, as shown in Figure 2b. With the increase of Ce content, the dendrites were further refined, and the secondary dendrites arm spacing was reduced at the same time, as shown in Figure 2c,d. The coarse dendrites were refined, and the secondary dendrites arm spacing was reduced with the increase of Ce content.
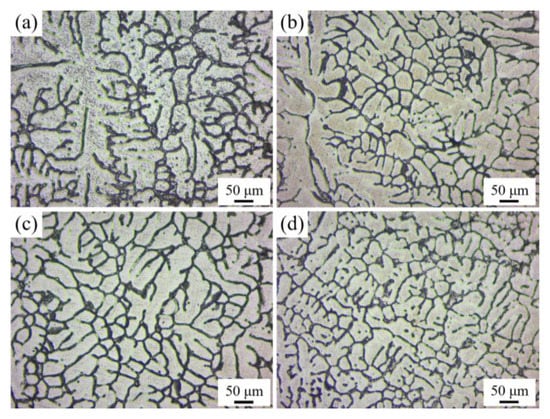
Figure 2.
Optical micrographs of the as-cast alloys with different Ce contents (a) AL1; (b) AL2; (c) L3; and (d) AL4.
Optical micrographs of AL1-AL4 alloys after homogenization treatment are shown in Figure 3. It can be found that the dendritic structures almost disappear after homogenization treatment. Most of the secondary phases in as-cast alloy have been dissolved into α-Al matrix.
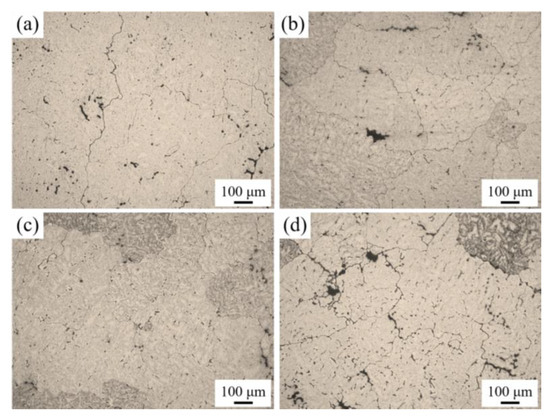
Figure 3.
Optical micrographs of homogenized alloys with different Ce contents (a) AL1; (b) AL2; (c) AL3; and (d) AL4.
3.2. Microstructures of the Alloys after Hot Rolling
To investigate the effect of Ce element after rolling process on the microstructures of AL1-AL4 alloys, EBSD analysis was used in our work. Figure 4 shows the inverse pole figures and orientation maps of four alloys after 80% rolling reduction. Low angle grain boundaries (LAGB) are marked with white lines, which are defined as misorientation 3° ˂ θ ˂ 15°. High angle grain boundaries (LAGB) are marked with black lines, which are defined as misorientation θ ˃ 15°. Different crystal orientations are represented by different colors.
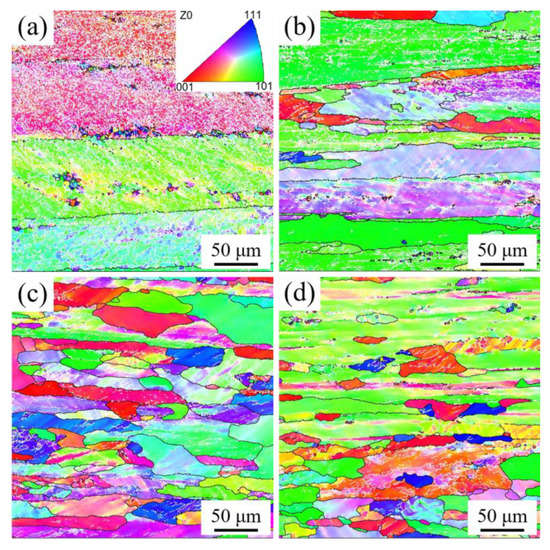
Figure 4.
Orientation maps and inverse pole figure (a) AL1; (b) AL2; (c) AL3; (d) AL4.
As shown in Figure 4a, the grains of AL1 alloy are elongated significantly after hot rolling with fibrous shape along the rolling direction, exhibiting a large aspect ratio. There are a large number of LAGB in the fibrous shape grains, which indicates the presence of a few recrystallization grains during hot rolling. When the Ce addition is 0.1%, the microstructures keep elongated grains and the number of grain increased, as shown in Figure 4b. Meanwhile, it can be seen that some recrystallized structures appear, and the degree of recrystallization increases compared with AL1 alloy. With the increase of Ce content to 0.2%, the number of coarse elongated grains of the alloy decreased. The grain aspect ratios reduce and grain shape tends to spheroidize, as shown in Figure 4c. When the Ce content increases to 0.3%, the grain size of the AL4 alloy changes slightly, as shown in Figure 4d. However, the low angle grain boundary is significantly lower than that in Figure 4c.
Figure 5 illustrates the microstructures of AL1-AL4 alloys after hot rolling. The deformation grains, sub-structured grains (recovered with sub-grains), and recrystallized grains of four alloys are shown in Figure 5 in three colors (red, yellow, and blue, respectively). According to average misorientation angles, these grains are classified as recrystallized grains when their average misorientation angle is above 15°, and as sub-structured grains if their average misorientation angle is between 3° and 15°. The grains are defined as deformation grains when their average misorientation angle is below 3°.
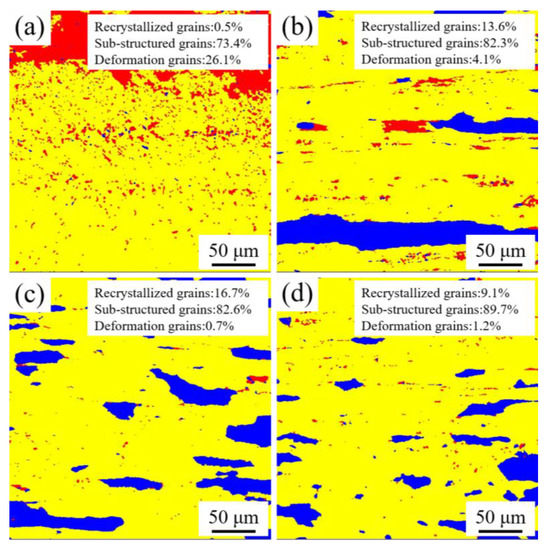
Figure 5.
Microstructures of the alloys after rolling process (a) AL1; (b) AL2; (c) AL3; (d) AL4.
The dynamic recrystallization degree of AL1 alloy is about 0.5% after the rolling process, as shown in Figure 5a. The deformation structure of the alloy changes with the increase of Ce content, as shown in Figure 5b. An incomplete recrystallization consisting of substructure grains, recrystallization grains, and deformation grains appears when the Ce content is 0.1%. The degree of recrystallization of AL2 alloy increases from 0.5% to 13.6%. When the Ce content increases to 0.2%, the degree of recrystallization of the alloy increases slightly, as shown in Figure 5c. However, when the Ce content reaches 0.3%, the degree of recrystallization of AL4 alloy decreases from 16.7% to 9.1%.
Figure 6 illustrates the misorientation distributions and the fractions of HAGBs of AL1-AL4 alloys. The misorientation below 3° has been removed from Figure 6. It can be found that the fraction of LAGBs is much higher than that of HAGBs. For AL1 alloy, the average misorientation angle is 2.5°, and the fraction of HAGBs is 2.4% as shown in Figure 6a. When the Ce content increases from 0.1%, 0.2%, to 0.3%, the fractions of HAGBs are 5.6%, 10.3%, and 8.2%, respectively. Meanwhile, the average misorientation angles are 3.0°, 4.6°, and 4.0°, respectively, as illustrated in Figure 6b–d.
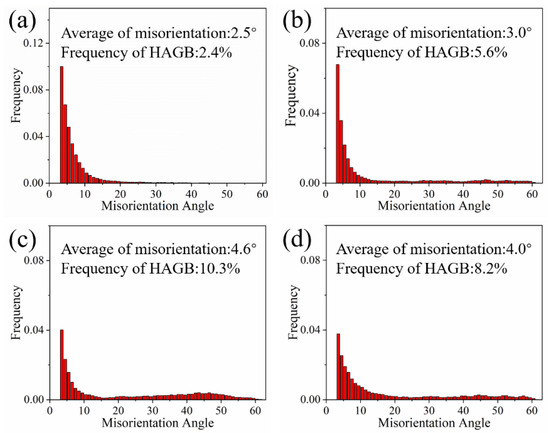
Figure 6.
Distribution of misorientation angles of the alloys (a) AL1; (b) AL2; (c) AL3; (d) AL4.
Figure 7 illustrates the TEM images of AL1 and AL2 alloys after the rolling process. AL1 alloy exhibits typical deformed microstructure with a large number of dislocation structures after hot rolling. Compared with AL1 alloy, there are more dislocation structures in the AL2 alloy, as shown in Figure 7b. From Figure 7c, it can be seen that the dislocations entangle together and form a dislocation wall and sub-grains. The boundary of sub-grains is shown in Figure 7d.
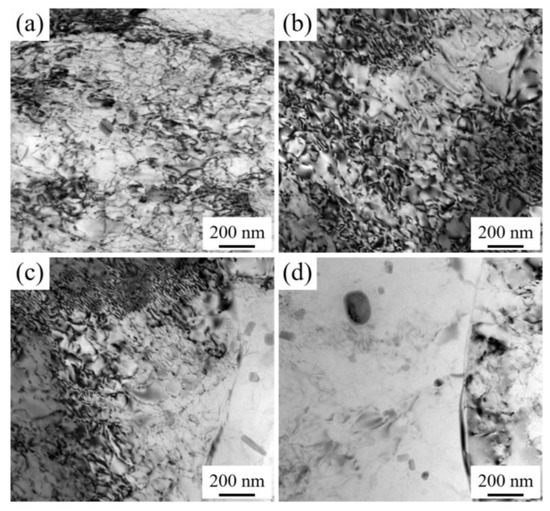
Figure 7.
TEM images of the alloys after hot rolling (a) AL1; (b–d) AL2.
3.3. Microstructure and the Mechanical Properties of the Alloys after T6 Treatment
To obtain the microstructure morphologies and the extent of recrystallization of the alloys, EBSD analysis was carried out for the alloys with different Ce contents after T6 treatment. Figure 8 shows the inverse pole figure and orientation maps of AL1- AL4 alloys after T6 treatment. For AL1 alloy without Ce element, there are many elongated grains, and the average grain size is 51 μm, as shown in Figure 8a. From Figure 8b,c and d, the microstructure of AL2, AL3, and AL4 alloys changes gradually. The recrystallization grains occur at the triangle boundary, the grains size decrease, and the number increases with the increase of Ce contents. The average grain sizes are 44 μm, 43 μm, and 39 μm, respectively. As can be seen, the grains of the alloys are refined and spheroridized with the increase of Ce content after T6 treatment.
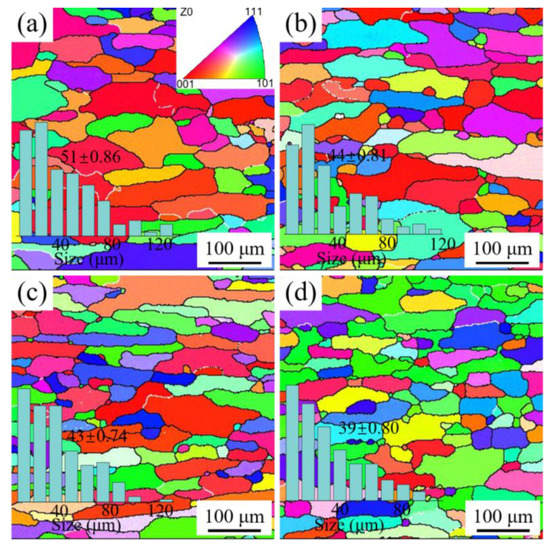
Figure 8.
Orientation maps and inverse pole figure of the alloys after T6 treatment (a) AL1; (b) AL2; (c) AL3; (d) AL4.
Figure 9 illustrates the recrystallized microstructure of AL1-AL4 alloys after T6 treatment. Similar to Figure 5, the deformation grains, sub-structured grains (recovered with sub-grains), and recrystallized grains of the four alloys are shown in three colors (red, yellow, and blue, respectively). From Figure 9, the degree of recrystallization of the alloys decreases significantly with the increase of Ce content. For AL1 alloy, the fraction of recrystallization is relatively low, and the fractions of recrystallization grains and sub-structured grains are 82.07%, and 17.92%, respectively, as shown in Figure 9a. It can be observed in Figure 9b that the fractions of recrystallization grains and sub-structured grains of AL2 alloy are 96.96% and 3.03%, respectively. It indicates that the recrystallization grains increase by adding Ce content to Al-Cu-Li alloy, which is helpful to refine microstructure of the alloy. However, when Ce content reaches 0.2% and 0.3%, the fractions of recrystallization are 76.24% and 45.47%, respectively, as illustrated in Figure 9c,d. Therefore, when Ce content is above critical value, the degree of recrystallization decreases with the increase of Ce content.
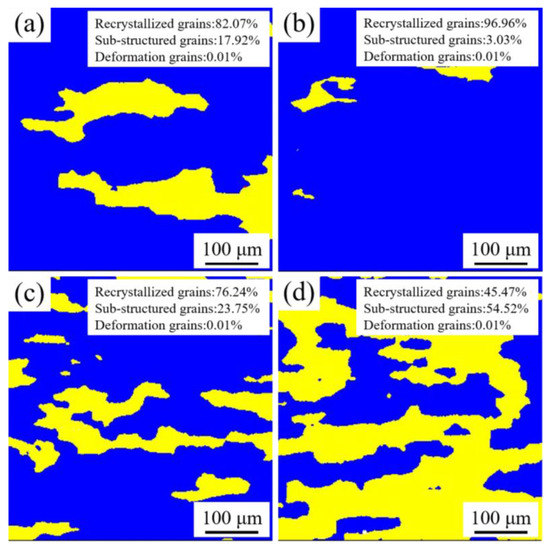
Figure 9.
Recrystallized maps of the alloys after T6 treatment (a) AL1; (b) AL2; (c) AL3; (d) AL4.
Figure 10 shows the misorientation distributions and the fraction of HAGBs of AL1-AL4 alloys after T6 treatment. The misorientation below 3° has been removed from Figure 10. Compared with Figure 6, it is clear that the LAGBs have transformed into HAGBs. The fraction of HAGBs for AL1 alloy is 30.5%, and the average misorientation angle is 12.5°, as shown in Figure 10a. When the Ce content of the alloy changes from 0.1%, 0.2%, to 0.3%, the fractions of HAGBs are 42.4%, 24.9%, and 28.5%, respectively. Meanwhile, the average misorientation angles are 18.1°, 10.4°, and 11.5°, respectively, as shown in Figure 10b–d.
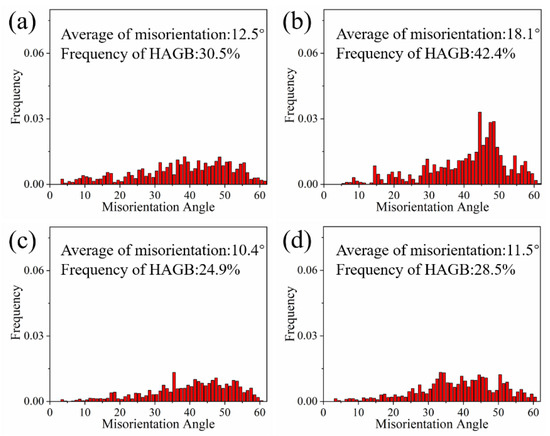
Figure 10.
Distribution of misorientation angles of the alloys after T6 treatment (a) AL1; (b) AL2; (c) AL3; (d) AL4.
To clarify the effects of Ce enrichment particles in Al-Cu-Li alloys on inhibition of recrystallization. The Ce enrichment phases were investigated by XRD, and the results are shown in Figure 11. The XRD patterns clearly show the presence of Al8Cu4Ce phases in AL2-AL4 alloys after T6 treatment. The improved recrystallization resistance achieved by Ce addition can be attributed to the formation of these Al8Cu4Ce phases in Al-Cu-Li alloy [26]. These Al8Cu4Ce particles might exert a Zener pressure on the grain boundary, which would retard their migration and inhibit recrystallization [27].
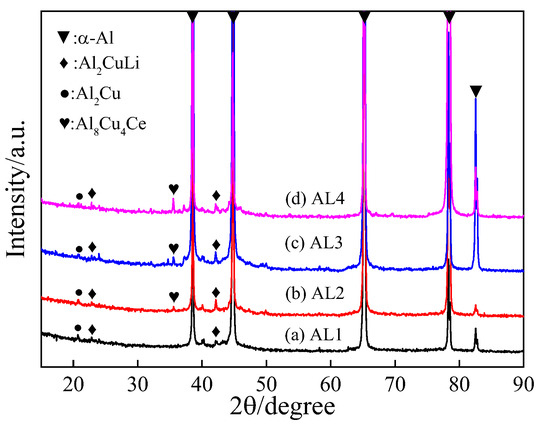
Figure 11.
XRD patterns of the alloys after T6 treatment (a) AL1; (b) AL2; (c) AL3; (d) AL4.
Figure 12 shows the selected area electron diffraction (SAED) spectra, TEM bright-field and dark-field images of AL2 alloy with 0.1% Ce and the AL1 alloy without Ce element. As shown in Figure 12a, it can be found that there are bright θ′ phases in the SAED spectrum along the direction of ˂100˃ of AL2 alloy, and the θ′ phases distributed uniformity. It indicates that a large number of θ′ phases have precipitated in AL2 alloy. Figure 12b shows the θ′ phases appear in the TEM bright field image along the direction of ˂100˃ of AL1 alloy. However, the number and density of θ′ phases are relatively fewer compared with AL2 alloy. Bright T1 phases can be observed in the SAED spectrum along the direction of ˂112˃ of AL2 alloy, and there are T1 phases parallel to each other in dark-field, as shown in Figure 12c. This indicates that a large number of T1 phases have precipitated in AL2 alloy. From Figure 12d, T1 phases appear in the TEM dark field image along the direction of <112> of AL1 alloy. The aging precipitated phases in AL1 alloy are T1 and θ′. Compared with AL1 alloy, T1 and θ′ phases in AL2 alloy are distributed uniformly.
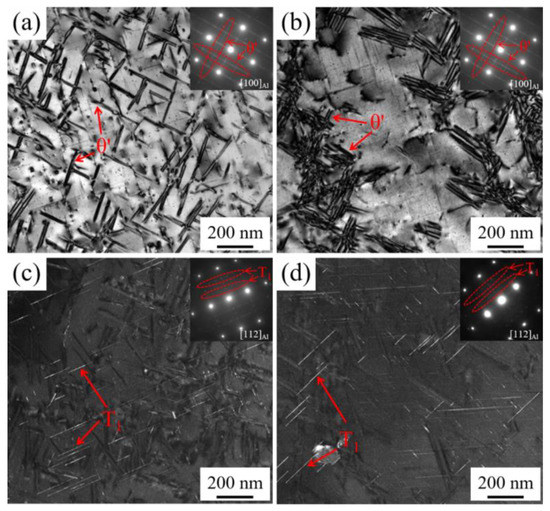
Figure 12.
SAED patterns and dark field (DF) and bright field (BF) TEM images of AL2 (a), (c), and AL1 (b), (d) alloys (a), (b) θ′ precipitates (direction parallels to <100>Al); (c), (d) T1 precipitates (direction parallels to <112>Al).
The mechanical properties of AL1-AL4 alloys after T6 treatment are illustrated in Figure 13. It can be found that the ultimate tensile strength increases with the increase of Ce content when the Ce content is less than 0.1%. However, the ultimate tensile strength of the alloy decreases when the Ce content increase to 0.2% and 0.3%. The yield strength exhibits the same trend, while the change of elongation is not obvious, as shown in Figure 13b. Compared with AL1 alloy, when Ce content is 0.1%, the ultimate tensile strength of AL2 alloyincreasese from 484 MPa to 514 MPa.
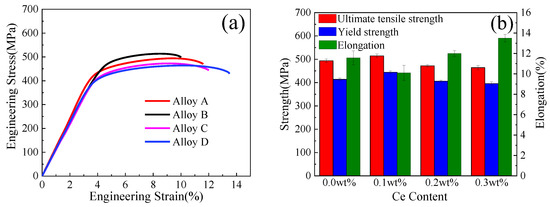
Figure 13.
Tensile test of the alloys after T6 treatments. (a) Engineering stress–strain curves; (b) Tensile properties curves.
3.4. Discussion of Effecting Mechanism
The above results show that the microstructure evolution and the tensile properties of the alloys are mainly related to the Ce content, the grain size and number, and the distribution of the main precipitated phases. Some studies [28,29] show that the Al-Cu-Li alloy is strengthened mainly by T1 and θ′ phases precipitated from the solid solution matrix during the aging process. The strengthening effect depends on the size, morphology, and volume fraction of the precipitate phases. Because the radius of Ce atoms (0.182 nm) is larger than that of Al atoms (0.143 nm), it is easy to lead to lattice distortion and increasing of the energy, when Ce atoms solute to the Al matrix in the form of a supersaturated solid solution. After solid solution treatment, many supersaturated vacancies are accumulated around Ce atoms, which results in reducing the lattice distortion energy and vacancy formation energy at a low energy level [30]. The vacancy clusters are located in the preferential nucleation positions of the primary phase T1 due to introducing the dislocations [31]. Therefore, the nucleation of T1 phase is promoted by the Ce atomic clusters, as shown in Figure 12.
The Ce element usually exists in the form of solid solution, and segregates at grains and phase boundaries, and rare earth compounds in Al-Cu-Li alloys. From Figure 7, it can be observed that the density of dislocations increased when 0.1% Ce was added into the AL1 alloy, and thus the contributions of dislocation strengthening increased. Additionally, the coarse dendrites were refined, and the secondary dendrites arm spacing was reduced with the increase of Ce content. The grains of T6 treated alloys are also refined, as shown in Figure 2 and Figure 8. This is because the solid solubility of Ce element in Al alloys is very small. In the process of solidification, Ce elements easily gather at the front of the solid–liquid interface. This results in the redistribution of solute elements and increases the composition supercooling of the liquid phase, thus intensifying the branching process, refining the dendrite shape, and reducing the dendrite spacing. In addition, some compounds formed from Ce, Al, and other elements hinder the grain growth at grain boundary. Some research shows that the second Al8Cu4Ce particles form during solidification of Al-Cu-Ce alloys, which can promote the non-uniform nucleation [32]. The Al8Cu4Ce particles are broken due to the rolling process, but these broken particles still cannot be completely dissolved during the solid solution treatment, which can hinder the grain boundary migration during the subsequent recrystallization process, thus refining the recrystallized grain. The relationship between the strength increasement and grain refinement can be expressed by the following equation [33]:
The value of for aluminum alloys is 0.04 Mpa × m1/2, and the Equation (1) shows that the strength of the alloy can be improved by grain refinement. From Figure 13, it can be seen that the strength of AL2 alloy is higher than that of AL1 alloy.
From Figure 6, it can be observed that the fraction of HAGBs increases from 2.4% to 8.2% with the increase of Ce content. With the increase of HAGBs, the fraction of recrystallization grains increases from 0.5% to 9.1% (Figure 5). At the same time, the average misorientation angle of the alloy increases from 2.5° to 4.0°. These results indicate that the addition of Ce element can promote dynamic recrystallization of the alloy during deformation. From Figure 9, it can be clearly observed that the fraction of recrystallized grains decreases gradually with the increase of Ce content, from 96.96% of AL2 alloy to 45.47% of AL4 alloy after T6 treatment. The reason for this is that static recrystallization of the alloy during heat treatment can be hindered due to the Ce element, which can be attributed to the formation of a large number of small Al8Cu4Ce phases. These Al8Cu4Ce phases become smaller sizes after rolling deformation with large reduction. Due to the high temperature stability of Al8Cu4Ce phase, it is hard to redissolve during heat treatment, which hinders recrystallization by pinning dislocation and sub-grain migration [34,35].
The more Ce content of the alloy there is, the more insoluble Al8Cu4Ce particles are. The Al8Cu4Ce phase particles can refine the microstructure and hinder recrystallization of the alloys after adding little amounts of Ce. To a certain extent, it is beneficial to improve the mechanical property of the alloys. However, with the increase of Ce content, many Cu atoms of the alloy exist in the form of Al8Cu4Ce particles after solid solution treatment, rather than in the solid solution matrix as solid solution Cu atoms, which leads to decreasing the mechanical properties of AL3 alloy and AL4 alloy. The addition of trace amounts of Ce can improve the binding energy of Cu atoms in the matrix. The Ce element in the matrix reduces the diffusivity of solute atoms Cu and Mg during aging and effectively inhibits the coplanar slip, which improves the mechanical property of the alloy.
4. Conclusions
The purpose of this study is to investigate the effect of Ce alloying on the microstructure and mechanical properties of Al-Cu-Li alloys. The following conclusions are drawn from the present study:
(1) The dendrites are refined, and the secondary dendrites arm spacing is reduced by the as-cast alloys with the increase of Ce content. The average recrystallized grain size of four alloys after T6 treatment are 51μm, 44μm, 43μm, and 39μm, respectively, when Ce content is added from 0.0% to 0.3%. The Al8Cu4Ce particles can promote nucleation during solidification, while the particles are difficult to dissolve into the solid solution matrix during subsequent treatment, which can hinder grain boundary migration during recrystallization and refine the recrystallized grains.
(2) The recrystallization of the alloys is inhibited during T6 treatment with the increase of Ce content. This can be attributed to the existence of the Al8Cu4Ce phases at the grain boundary. The aging precipitation T1 and θ′ phases of the alloys are promoted by adding Ce element to the alloy.
(3) With the addition of Ce content from 0.1% to 0.3%, the ultimate tensile strength and yield strength of the alloy after T6 treatment firstly increase and then decrease. The ultimate tensile strength is a maximum of 514 MPa when Ce content is 0.1%.
Author Contributions
Conceptualization, Y.L.; methodology, J.W.; software, X.D.; validation, X.D. and Y.L.; formal analysis, D.Z.; investigation, X.D.; resources, Y.L. and J.W.; data curation, X.D. and X.L.; writing—original draft preparation, X.D.; writing—review and editing, X.D., Y.L., and J.W.; visualization, X.D.; supervision, Y.L.; project administration, Y.L., J.W.; funding acquisition, Y.L. All authors have read and agreed to the published version of the manuscript.
Funding
This research is supported by the National Science Foundation of China (No.51975404), the Postgraduate Research & Practice Innovation Program of Jiangsu Province (SJCX21_1304), the Changzhou Sci&Tech Program (CJ20220061), and the Major Project of Education Department, Jiangsu Province (No.18KJA430007).
Institutional Review Board Statement
Not applicable.
Informed Consent Statement
Informed consent was obtained from all subjects involved in the study.
Data Availability Statement
Not applicable.
Conflicts of Interest
The authors declare no conflict of interest.
References
- Rioja, R.J.; Liu, J. The evolution of Al-Li base products for aerospace and space applications. Metall. Mater. Trans. A 2012, 43, 3325–3337. [Google Scholar] [CrossRef]
- Williams, J.C.; Starke, E.A., Jr. Progress in structural materials for aerospace systems. Acta Mater. 2003, 51, 5775–5799. [Google Scholar] [CrossRef]
- Araullo-Peters, V.; Gault, B.; de Geuser, F.; Deschamps, A.; Cairney, J.M. Microstructural evolution during ageing of Al–Cu–Li–x alloys. Acta Mater. 2014, 66, 199–208. [Google Scholar] [CrossRef]
- Abd El-Aty, A.; Xu, Y.; Guo, X.; Zhang, S.-H.; Ma, Y.; Chen, D. Strengthening mechanisms, deformation behavior, and anisotropic mechanical properties of Al-Li alloys: A Review. J. Adv. Res. 2018, 10, 49–67. [Google Scholar] [CrossRef]
- Ma, P.P.; Zhan, L.H.; Liu, C.H.; Wang, Q.; Li, H.; Liu, D.B.; Hu, Z.G. Pre-strain-dependent natural ageing and its effect on subsequent artificial ageing of an Al-Cu-Li alloy. J. Alloys Compd. 2019, 790, 8–19. [Google Scholar] [CrossRef]
- Peng, Z.W.; Li, J.F.; Sang, F.J.; Chen, Y.L.; Zhang, X.H.; Zheng, Z.Q.; Pan, Q.L. Structures and tensile properties of Sc-containing 1445 Al-Li alloy sheet. J. Alloys Compd. 2018, 747, 471–483. [Google Scholar] [CrossRef]
- Zhang, J.; Liu, Z.M.; Shi, D.F. Hot compression deformation behavior and microstructure of as-cast and homogenized AA2195 Al-Li alloy. Metals 2022, 12, 1580. [Google Scholar] [CrossRef]
- Meng, L.; Zheng, X.L. Tension characteristics of notched specimens for Al-Li-Cu-Zr alloy sheets with various cerium contents. Metall. Mater. Trans. A 1996, 27, 3089–3094. [Google Scholar] [CrossRef]
- Suresh, M.; Sharma, A.; More, A.M.; Nayan, N.; Suwas, S. Effect of Scandium addition on evolution of microstructure, texture and mechanical properties of thermo-mechanically processed Al-Li alloy AA2195. J. Alloys Compd. 2018, 740, 364–374. [Google Scholar] [CrossRef]
- Yu, T.F.; Li, B.C.; Medjahed, A.; Hou, L.G.; Wu, R.Z.; Zhang, J.H.; Sun, J.F.; Zhang, M.L. Impeding effect of the Al3(Er,Zr,Li) particles on planar slip and intergranular fracture mechanism of Al-3Li-1Cu-0.1Zr-X alloys. Mater. Charact. 2019, 147, 146–154. [Google Scholar] [CrossRef]
- Liu, T.; Dong, Q.; Fu, Y.N.; Yang, J.; Zhang, J.; Sun, B.D. Effect of addition of La and Ce on solidification behavior of Al-Cu alloys. Mater. Lett. 2022, 324, 132653. [Google Scholar] [CrossRef]
- Xiao, D.H.; Wang, J.N.; Ding, D.Y.; Yang, H.L. Effect of rare earth Ce addition on the microstructure and mechanical properties of an Al–Cu–Mg–Ag alloy. J. Alloys Compd. 2003, 352, 84–88. [Google Scholar] [CrossRef]
- Zakharov, V.V. Special features of crystallization of scandium-alloyed aluminum alloys. Met. Sci. Heat Treat. 2012, 53, 414–419. [Google Scholar] [CrossRef]
- Belov, N.A.; Khvan, A.V.; Alabin, A.N. Microstructure and phase composition of Al–Ce–Cu Alloys in the Al-Rich corner. Mater. Sci. Forum 2006, 519–521, 395–400. [Google Scholar] [CrossRef]
- Belov, N.A.; Khvan, A.V. The ternary Al–Ce–Cu phase diagram in the aluminum-rich corner. Acta Mater. 2007, 55, 5473–5482. [Google Scholar] [CrossRef]
- Bo, H.; Jin, S.; Zhang, L.G.; Chen, X.M.; Chen, H.M.; Liu, L.B.; Zheng, F.; Jin, Z.P. Thermodynamic assessment of Al–Ce–Cu system. J. Alloys Compd. 2009, 484, 286–295. [Google Scholar] [CrossRef]
- Chaubey, A.K.; Mohapatra, S.; Jayasankar, K.; Pradhan, S.K.; Satpati, B.; Sahay, S.S.; Mishra, B.K.; Mukherjee, P.S. Effect of cerium addition on microstructure and mechanical properties of Al-Zn-Mg-Cu alloy. Trans. Indian Inst. Met. 2009, 62, 539–543. [Google Scholar] [CrossRef]
- Yu, X.X.; Yin, D.F.; Yu, Z.M. Effects of cerium and zirconium microalloying addition on the microstructures and tensile properties of novel Al-Cu-Li alloys. Rare Met. Mater. Eng. 2016, 45, 1917–1923. [Google Scholar]
- Ma, Y.L.; Li, J.F. Variation of aging precipitates and mechanical strength of Al-Cu-Li alloys caused by small addition of rare earth elements. J. Mater. Eng. Perform. 2017, 26, 4329–4339. [Google Scholar] [CrossRef]
- Fang, H.C.; Chen, K.H.; Zhang, Z.; Zhu, C.J. Effect of Yb additions on microstructures and properties of 7A60 aluminum alloy. Trans. Nonferrous Met. Soc. China 2008, 18, 28–32. [Google Scholar] [CrossRef]
- Fang, H.C.; Chao, H.; Chen, K.H. Effect of recrystallization on intergranular fracture and corrosion of Al–Zn–Mg–Cu–Zr alloy. J. Alloys Compd. 2015, 622, 166–173. [Google Scholar] [CrossRef]
- Qin, C.; Gou, G.Q.; Che, X.L.; Chen, H.; Chen, J.; Li, P.; Gao, W. Effect of composition on tensile properties and fracture toughness of Al–Zn–Mg alloy (A7N01S-T5) used in high speed trains. Mater. Des. 2016, 91, 278–285. [Google Scholar] [CrossRef]
- Cong, F.G.; Zhao, G.; Jiang, F.; Tian, N.; Li, R.F. Effect of homogenization treatment on microstructure and mechanical properties of DC cast 7X50 aluminum alloy. Trans. Nonferrous Met. Soc. China 2015, 25, 1027–1034. [Google Scholar] [CrossRef]
- Pasang, T.; Symonds, N.; Moutsos, S.; Wanhill, R.J.H.; Lynch, S.P. Low-energy intergranular fracture in Al–Li alloys. Eng. Fail. Anal. 2012, 22, 166–178. [Google Scholar] [CrossRef]
- Ma, J.; Yan, D.S.; Rong, L.J.; Li, Y.Y. Effect of Sc addition on microstructure and mechanical properties of 1460 alloy. Prog. Nat. Sci. Mater. Int. 2014, 24, 13–18. [Google Scholar] [CrossRef]
- Yu, X.X.; Dai, H.; Li, Z.T.; Sun, J.; Zhao, J.F.; Li, C.Q.; Liu, W.W. Improved recrystallization resistance of Al–Cu–Li–Zr alloy through Ce addition. Metals 2018, 8, 1035. [Google Scholar] [CrossRef]
- Zuo, J.R.; Hou, L.G.; Shi, J.T.; Cui, H.; Zhuang, L.Z.; Zhang, J.S. The mechanism of grain refinement and plasticity enhancement by an improved thermomechanical treatment of 7055 Al alloy. Mater. Sci. Eng. A 2017, 702, 42–52. [Google Scholar] [CrossRef]
- da Costa Teixeira, J.; Cram, D.G.; Bourgeois, L.; Bastow, T.J.; Hill, A.J.; Hutchinson, C.R. On the strengthening response of aluminum alloys containing shear-resistant plate-shaped precipitates. Acta Mater. 2008, 56, 6109–6122. [Google Scholar] [CrossRef]
- Deschamps, A.; Decreus, B.; De Geuser, F.; Dorin, T.; Weyland, M. The influence of precipitation on plastic deformation of Al–Cu–Li alloys. Acta Mater. 2013, 61, 4010–4021. [Google Scholar] [CrossRef]
- Wang, W.T.; Zhang, X.M.; Gao, Z.G.; Jia, Y.Z.; Ye, L.Y.; Zheng, D.W.; Liu, L. Influences of Ce addition on the microstructures and mechanical properties of 2519A aluminum alloy plate. J. Alloys Compd. 2010, 491, 366–371. [Google Scholar] [CrossRef]
- Kumar, K.S.; Brown, S.A.; Pickens, J.R. Microstructural evolution during aging of an Al-Cu-Li-Ag-Mg-Zr alloy. Acta Mater. 1996, 44, 1899–1915. [Google Scholar] [CrossRef]
- Yu, X.X.; Yin, D.F.; Yu, Z.M.; Zhang, Y.R.; Li, S.F. Effects of cerium addition on solidification behaviour and intermetallic structure of novel Al–Cu–Li alloys. Rare Met. Mater. Eng. 2016, 45, 1423–1429. [Google Scholar]
- Hansen, N. Hall–Petch relation and boundary strengthening. Scr. Mater. 2004, 51, 801–806. [Google Scholar] [CrossRef]
- Yu, X.X.; Yin, D.F.; Yu, Z.M.; Zhang, Y.R.; Li, S.F. Microstructure evolution of novel Al-Cu-Li-Ce alloys during homogenization. Rare Met. Mater. Eng. 2016, 45, 1687–1694. [Google Scholar]
- Balducci, E.; Ceschini, L.; Messieri, S.; Wenner, S.; Holmestad, R. Thermal stability of the lightweight 2099 Al-Cu-Li alloy: Tensile tests and microstructural investigations after overaging. Mater. Des. 2017, 119, 54–64. [Google Scholar] [CrossRef]
Disclaimer/Publisher’s Note: The statements, opinions and data contained in all publications are solely those of the individual author(s) and contributor(s) and not of MDPI and/or the editor(s). MDPI and/or the editor(s) disclaim responsibility for any injury to people or property resulting from any ideas, methods, instructions or products referred to in the content. |
© 2023 by the authors. Licensee MDPI, Basel, Switzerland. This article is an open access article distributed under the terms and conditions of the Creative Commons Attribution (CC BY) license (https://creativecommons.org/licenses/by/4.0/).