Article

Mechanical Response of CNT/2024Al Composite to Compression and Tension at Different Strain Rates

1
Key Laboratory of Advanced Technologies of Materials, Ministry of Education, Southwest Jiaotong University, Chengdu 610031, China
2
MOE Key Laboratory of Impact and Safety Engineering, Ningbo University, Ningbo 315211, China
3
State Key Laboratory of Metal Matrix Composites, School of Materials Science and Engineering, Shanghai Jiaotong University, Shanghai 200240, China
*
Author to whom correspondence should be addressed.
Metals 2023, 13(2), 254; https://doi.org/10.3390/met13020254
Submission received: 26 November 2022 / Revised: 7 January 2023 / Accepted: 23 January 2023 / Published: 28 January 2023
(This article belongs to the Special Issue Deformation Dynamics of Heterogeneous Metallic Materials)

Abstract

:
Compressive and tensile properties of a carbon nanotube (CNT) reinforced 2024Al composite are investigated under quasi-static and dynamic compression as well as quasi-static tension, along three different directions (extrusion, normal and transverse directions). Upon compression, yield and fracture strengths of the composite show negligible strain rate effect and mechanical anisotropy as manifested in the compressive stress–strain curves. Fractography and profilometry show that fracture surfaces are rough shear fracture planes for quasi-static compression; however, smooth conical fracture surfaces are observed for dynamic compression as a result of more homogeneous damage nucleation and growth, leading to high ductility under high strain rate loading. Pronounced mechanical anisotropy is observed for the composite under quasi-static tensile loading. Ductility or fracture strain is the highest along the normal direction, because debonding along the particle and lamellar interfaces is suppressed along this direction. In situ optical imaging along with digital image correlation is utilized to obtain the deformation dynamics of the composite along the three different directions. Stripe-shaped strain localizations appear in the strain fields along the extruded and tangential directions, while the strain fields are approximately uniformly distributed along the normal direction, consistent with the stress–strain curves.

1. Introduction

Metal matrix composities (MMCs) are considered as attractive advanced structural materials for their excellent mechanical properties [1,2,3,4,5,6]. Carbon nanotubes (CNTs) with extremely high aspect ratios have emerged as an ideal reinforcement for composites due to their superior mechanical and physical properties as well as light weight [3,6,7]. Incorporating CNTs into Al matrix to produce high-performance MMCs is of great interest given the promising applications to lightweight structures in aerospace and automotive industries [8,9,10]. Understanding deformation and damage of CNT-reinforced aluminum (Al) matrix composites (AMCs) is critical to safer usage of CNT-reinforced AMCs, and materials/structural design.
Although extensive studies have been devoted to CNT-reinforced AMCs in the past decades, relevant research mainly focused on synthesis and processing techniques, microstructural characterizations and general mechanical properties of CNT-reinforced AMCs [8,11,12]. For instance, Choi et al. [8] adopted ball-milling and hot-rolling to produce CNT-reinforced AMCs with four different multi-walled CNT (MWCNT) volume fractions, and verified MWCNTs can dramatically enhance the toughness. Bustamante et al. [13] studied a 2024Al alloy produced by mechanical alloying and strengthened by CNT dispersion, and discussed the effect of CNTs concentration and milling time on the microstructure of the CNT-reinforced AMCs.
However, ball milling and hot extrusion, as the most commonly used powder metallurgy methods for the preparation of CNT-enhanced AMCs [6,7,8,9,13], can induce mechanical anisotropy in the CNT-enhanced AMCs [2,14,15]. The mechanical anisotropy is important for structural design optimization and has been systematically investigated in Al alloys [16,17] and particle reinforced Al alloy composites [2]. Microstructural anisotropy of the CNT-reinforced 2024 alloy can induce anisotropy in spall strength and damage modes under plate impact loading [5]. In addition, Wang et al. [12,18] found that the addition of CNTs leads to an increased strain rate sensitivity in comparison with pure Al. Nevertheless, the mechanical anisotropy and strain rate effect for the CNT-reinforced AMCs under compression and tension loading are not fully understood. The deformation dynamics of CNT-reinforced 2024Al alloy under quasi-static tension have not been reported.
In this work, the mechanical properties of a carbon nanotube (CNT) reinforced 2024Al composite (CNT/2024Al) are investigated under compression and tension along three different directions, the extrusion direction (ED), the transverse direction ( TD) and the normal direction (ND). Compressive and tensile stress–strain curves are measured to derive the yield strength, fracture strength and fracture strain of the CNT/2024Al composite. Digital image correlation (DIC) is adopted for strain field mapping during quasi-static tension. Postmortem analyses are characterized with white light interferometer and scanning electron microscopy (SEM) to obtain fracture morphologies. The microstructure–property relationships, anisotropy and underlying damage mechanisms are discussed.

2. Materials and Methods

2.1. Materials

The CNT/2024Al composite is fabricated with the flake powder metallurgy and hot extrusion. The diameter and length of the MWCNTs are 15–40 nm and 1–5 μ m, respectively. The average diameters of the Al, Cu and Mg flake powders are approximately 18 μ m, 4 μ m and 14 μ m, respectively. These raw materials are 99.9 wt% purity. Powder processing is based on the shift-speed ball milling and conducted in a planetary ball mill in a stainless-steel jar filled with Ar atmosphere. Firstly, 1.5 wt% CNTs and 93.5 wt% pure Al powders are mixed with 0.5 wt% stearic acid (analytical reagent), and milled at a constant speed of 135 rpm for 8 h. Then 4.0 wt% Cu and 1.0 wt% Mg flake powders are added to the milling jar and milled at a constant speed of 270 rpm for 1 h. After ball milling, the mixed particles are cold pressed into cylinders (inner diameter 120 mm) at 500 MPa, and then hot extruded into plates (the cross-sectional area of these plates is 50 mm × 18 mm) after being sintered in vacuum at 570 C for 4 h. These plates are further processed via solution treatment at 530 C for 3 h and then quenched rapidly in ice water. Finally, these plates are executed artificial aging treatment at 130 C for 24 h with an air atmosphere. More fabrication details can be found elsewhere [5].
Figure 1a–c shows the SEM micrographs of an initial CNT/2024Al sample after electrolysis. White particles appear in the micrographs for all three directions. These particles are rich in oxygen, and are probably oxides formed in the electrolysis process, which are prone to concentrate in the pits and grooves resulted from interfaces. These white dots or traces can be used to mark the layered distribution of microstructures. Therefore, the CNT/2024Al composite exhibits a lamellar microstructure aligned lengthwise along the ED direction (schematics of the lamellar microstructure are illustrated in Figure 2c,d). Some other initial microstructural characterizations including X-ray diffraction, Raman spectroscopy and electron backscattered diffraction of the CNT/2024Al composite can be found in our previous study [5]. The grains are approximately equiaxial in the TD-ND plane, and elongated along the ED in the ED-TD and ED-ND planes. The average grain sizes are 0.77 ± 0.29 μ m, 1.02 ± 0.49 μ m and 1.02 ± 0.51 μ m in the TD-ND, ED-ND and ED-TD planes, respectively. Grain orientations in the three planes are similar.

2.2. Dynamic and Quasi-Static Compression

MTS and SHPB devices are applied to investigate the mechanical properties of the CNT/2024Al composite. For dynamic loading (Figure 2a), the striker bar (1), incident bar (3) and transmission bar (5) of the SHPB are all fabricated with high-strength steel. They are 12.7 mm in diameter, and 200 mm, 1000 mm and 1000 mm in length, respectively. To smooth the pulse, a rubber pulse shaper [19] (2) with a diameter of 6 mm and a thickness of 0.8 mm is used. The specimen is sandwiched between the incident and transmission bars before loading. The dimensions of the cylindrical specimens are 3.2 mm (gauge length) in length and 3.5 mm in diameter. After the striker impacts the incident bar, an elastic wave is generated and propagates through the incident bar (along the x-axis, Figure 2a). When the incident wave arrives at the interface between the incident bar and the specimen, it is partially reflected owing to impedance mismatch, while the rest is transmitted into the transmission bar. The incident, reflected and transmitted waves are recorded by strain gauges (6). The incident and transmitted waves are used to derive the stress ( σ s ), strain ( ε s ) and strain rate ( ε ˙ s ) histories of the sample with the following equations [20]:
σ s = E t ε t A t A s ,
ε ˙ s = 2 C 0 L s ( ε t ε i ) ,
ε s = 2 C 0 L s 0 t ( ε t ε i ) d τ ,
where E, A, C 0 , L s and t are the Young’s modulus, cross-sectional area, elastic velocity of the bar, gauge length of the sample and time, respectively. Subscripts i, t and s denote the incident bar, transmission bar and sample, respectively. The stopper-ring technique [21] is adopted to limit the extent of deformation during dynamic compression. The stopper ring is made of high strength steel. The outer and inner diameters of the ring are 18.0 mm and 13.2 mm, respectively. The height of the ring is adjusted according to the desired strain level.
To investigate the strain rate effect of the CNT/2024Al composite, quasi-static compressive loading is conducted with a commercial material test system (SUNS UMT5105X, Shenzhen, China). The dimensions of the cylindrical specimen for quasi-static compressive loading are 5.0 mm (gauge length) in length and 3.0 mm in diameter.
To investigate possible anisotropy, the specimens are loaded along the ED, TD and ND, respectively. The sample preparation scheme and loading directions (the red arrows) are illustrated in Figure 2c (compression) and Figure 2d (tension), respectively. Both of the postmortem samples of the dynamic and quasi-static loading are characterized with SEM (FEI Quanta 250, Join Honors Tech Co., Ltd., Beijing, China) and optical profilometer (ZYGO NewView 8000, ZYGO Co., Ltd., Shanghai, China).

2.3. Quasi-Static Tension

A miniature MTS with in situ optical imaging is adopted to investigate the tensile properties of CNT/2024Al composite. As schematically shown in Figure 2b, a dog-bone-shaped sample (8) is held by collets of the MTS (9). The dimensions of the sample perpendicular to the z-axis are 2.5 mm (gauge length) × 1.0 mm (gauge width), and the thickness along the z-direction is 1.0 mm. All of the tensile samples are sprayed with a random pattern of black and white paint for DIC measurements. More details about DIC can be found elsewhere [22,23]. During tensile loading, the stress and optical images of the sample are recorded by stress gauge of the MTS and a camera (10; MV-GEC1200C-TPO, Medvision Tech Co., Ltd., Shanghai, China), respectively. To plot the true strain–stress curves, each image during deformation is correlated with the initial image and the resultant displacement fields are smoothed and processed to obtain true strain data. We perform quasi-static tension along the ED, TD and ND directions of the CNT/2024Al composite. The fracture surfaces of postmortem samples are characterized with SEM.

3. Results and Discussion

3.1. Compression Stress–Strain Curves

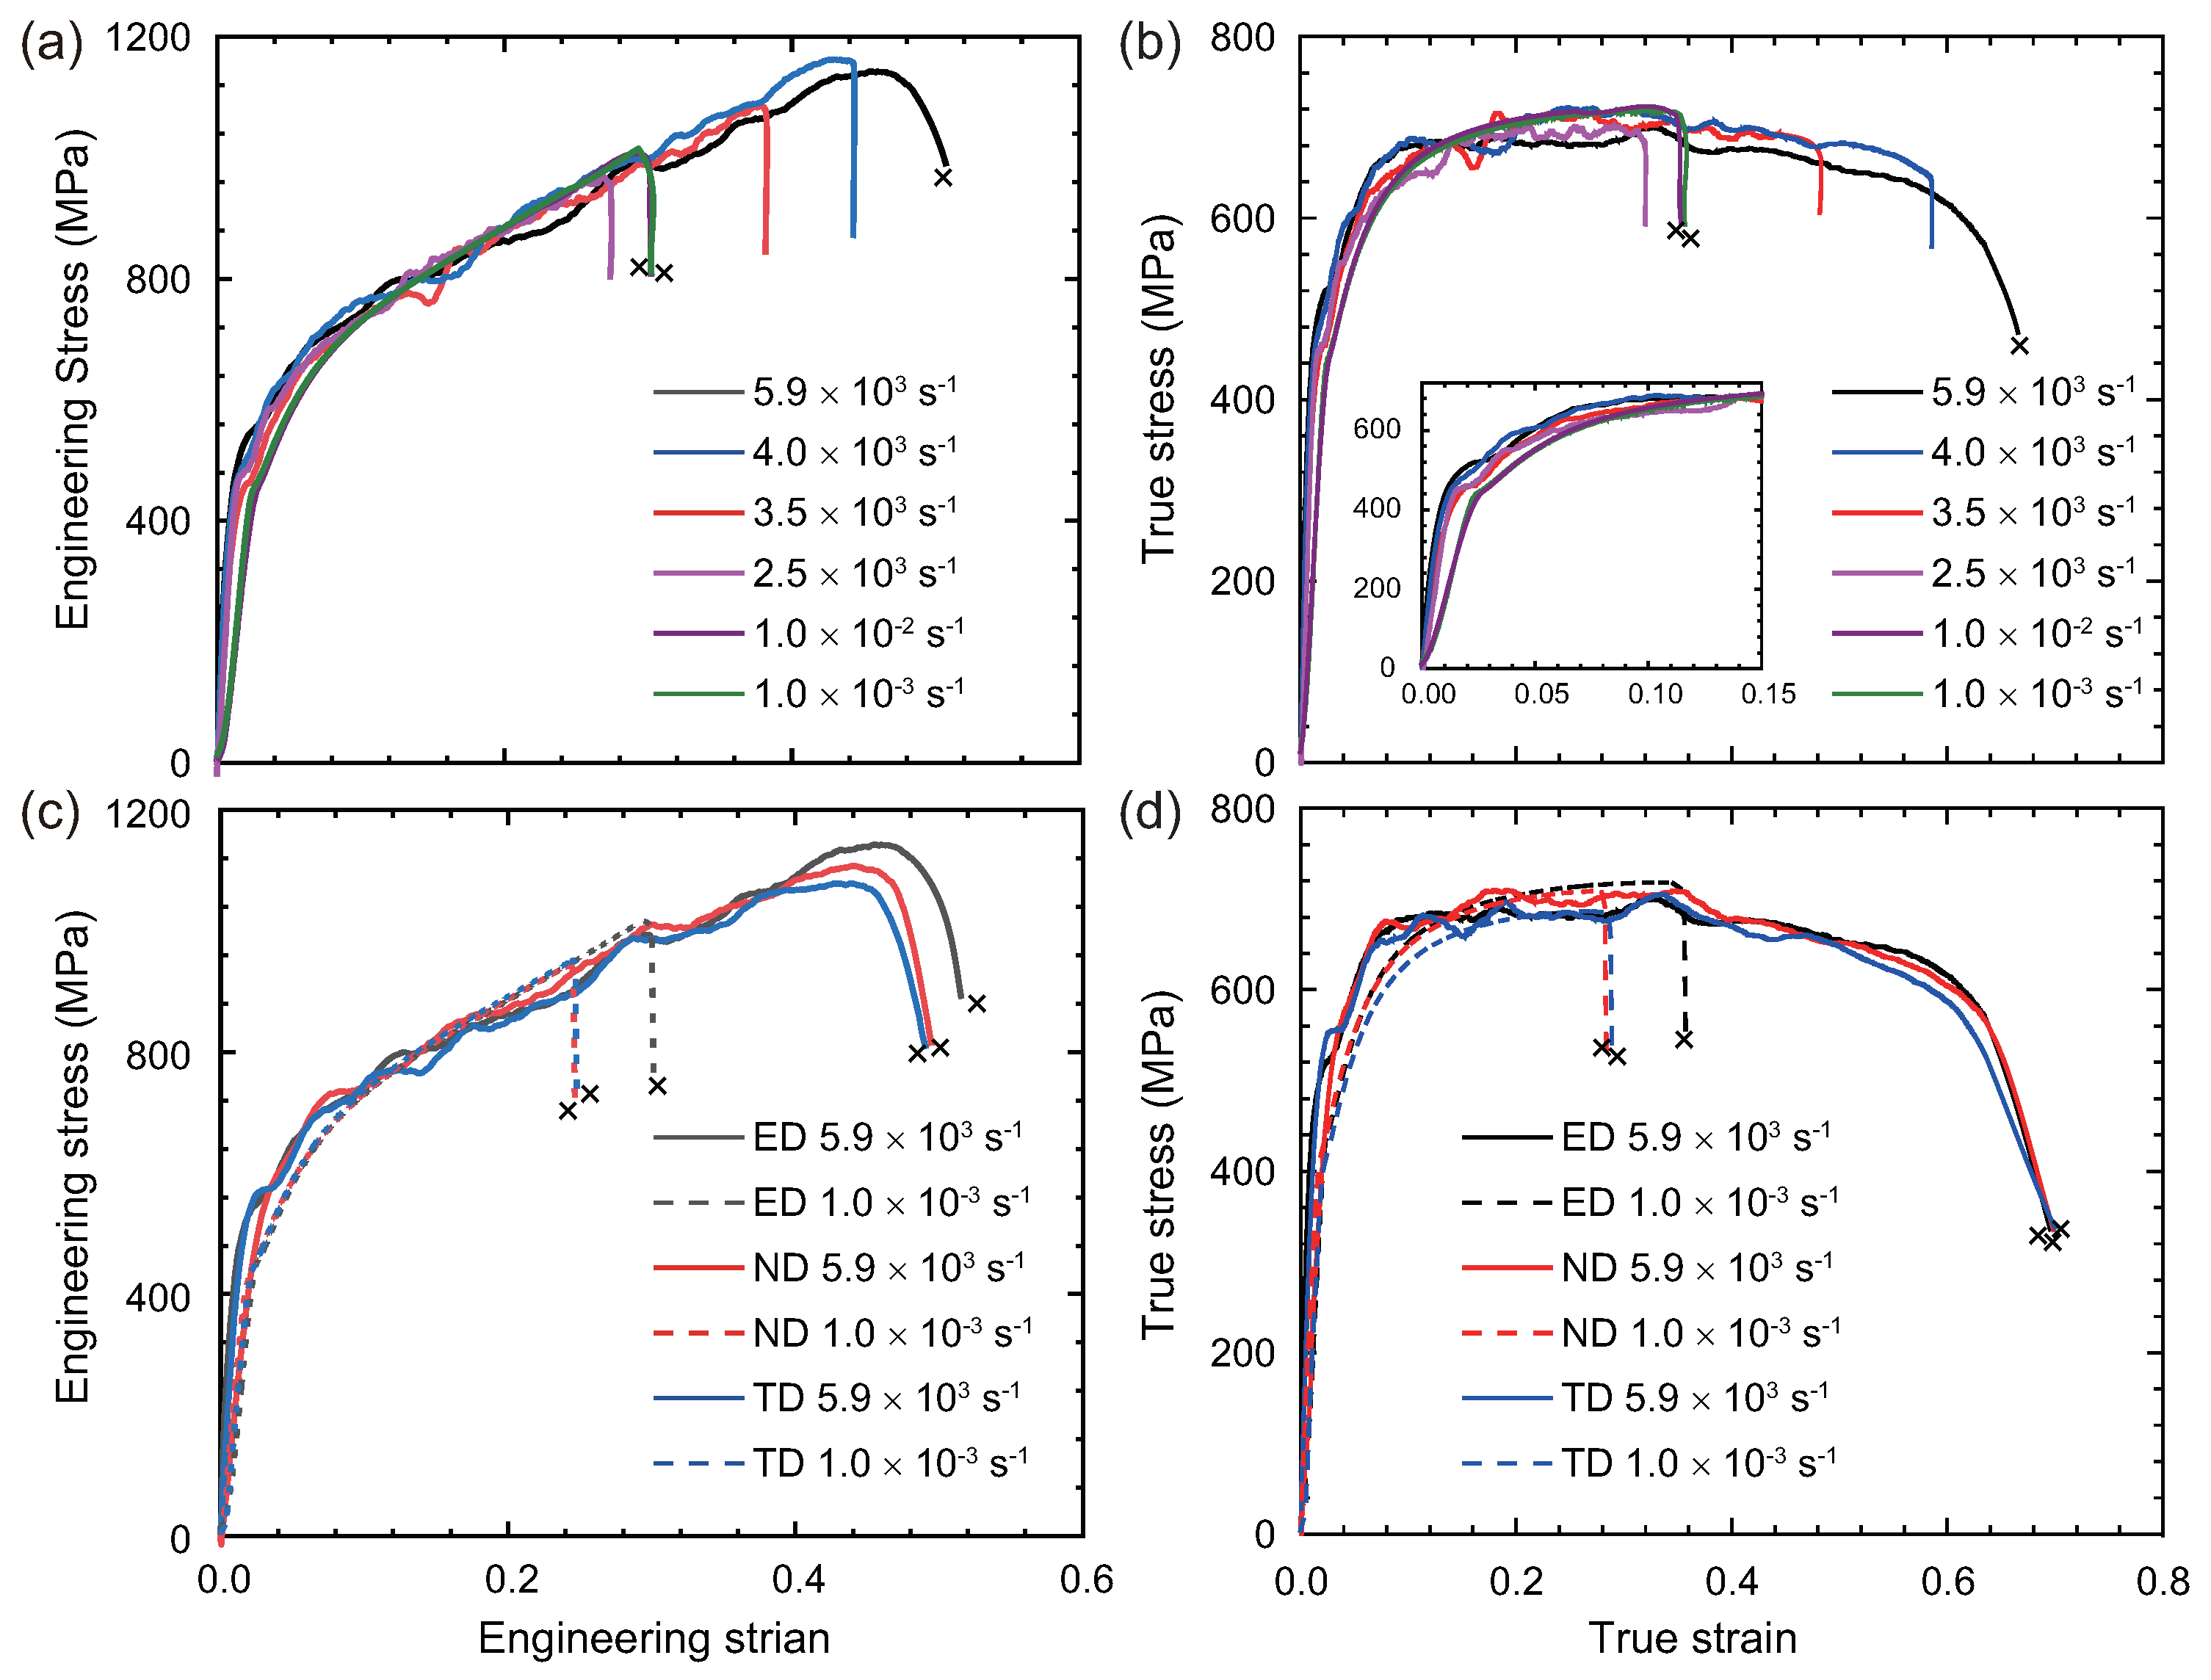
The engineering stress–strain curves (Figure 3a) and true stress–strain curves (Figure 3b) of the CNT/2024Al composite for compression along the ED are obtained under strain rates ranging from 1.0 × 10 3 s 1 to 5.9 × 10 3 s 1 . As show in Figure 3b, the curves essentially coincide for strain below 30%, indicating a weak strain rate effect on its flow stress, likely because the matrix material 2024Al is insensitive to strain rate [24]. Strain hardening (inset of Figure 3b) is observed for the CNT/2024Al composite under dynamic and quasi-static compression after yield. The strain hardening rate decreases with the increase of strain. In addition, strain softening is observed for samples loaded at strain rates higher than 3.5 × 10 3 s 1 before failure occurs. In contrast, samples show no strain softening, but abrupt failure under quasi-static compression.
In order to investigate the effect of microstructural anisotropy, the engineering stress–strain curves (Figure 3c) and true stress–strain curves (Figure 3d) of the CNT/2024Al composite are also obtained under dynamic (5.9 × 10 3 s 1 ) and quasi-static (10 3 s 1 ) compression along the TD and ND. As shown in Figure 3d, the true stress–strain curves for loading along the ED, TD and ND under dynamic and quasi-static compressive loading are similar, indicating a weak anisotropy in the compressive properties. In addition, as shown in Figure 4a, the fracture strain under high strain rate loading (5.9 × 10 3 s 1 ) is about twice that under quasi-static loading for the three loading directions, suggesting an excellent ductility under high strain rate loading.
The yield strength of the CNT/2024Al composite in the ED direction varies in a narrow range of 441–487 MPa (Figure 4b and Table 1). The yield strength of the CNT/2024Al composite is higher than that of the 2024Al matrix [24], possibly caused by the high dislocation storage capability of the elongated ultrafine grains [5,25]. The yield strength and flow stress at at 5% strain of the CNT/2024Al composite are plotted as a function of strain rate in Figure 3c, and can be well described by a Cowper–Symonds model [26]:
σ y σ y 0 * = 1 + ε ˙ ε ˙ c 1 p ,
where σ y 0 * is the yield strength at ε ˙ ε ˙ c , ε ˙ c is the characteristic strain rate, and p is the rate-sensitivity related parameter. The model parameters fitted from the experimental data are: σ y 0 * = 440 MPa, ε ˙ c = 9.6 × 10 4 s 1 and p = 1.17 for the yield stress, and σ y 0 * = 551 MPa, ε ˙ c = 1.2 × 10 5 s 1 and p = 1.33 for the flow stress at 5% strain.

3.2. Compression Fracture Analysis

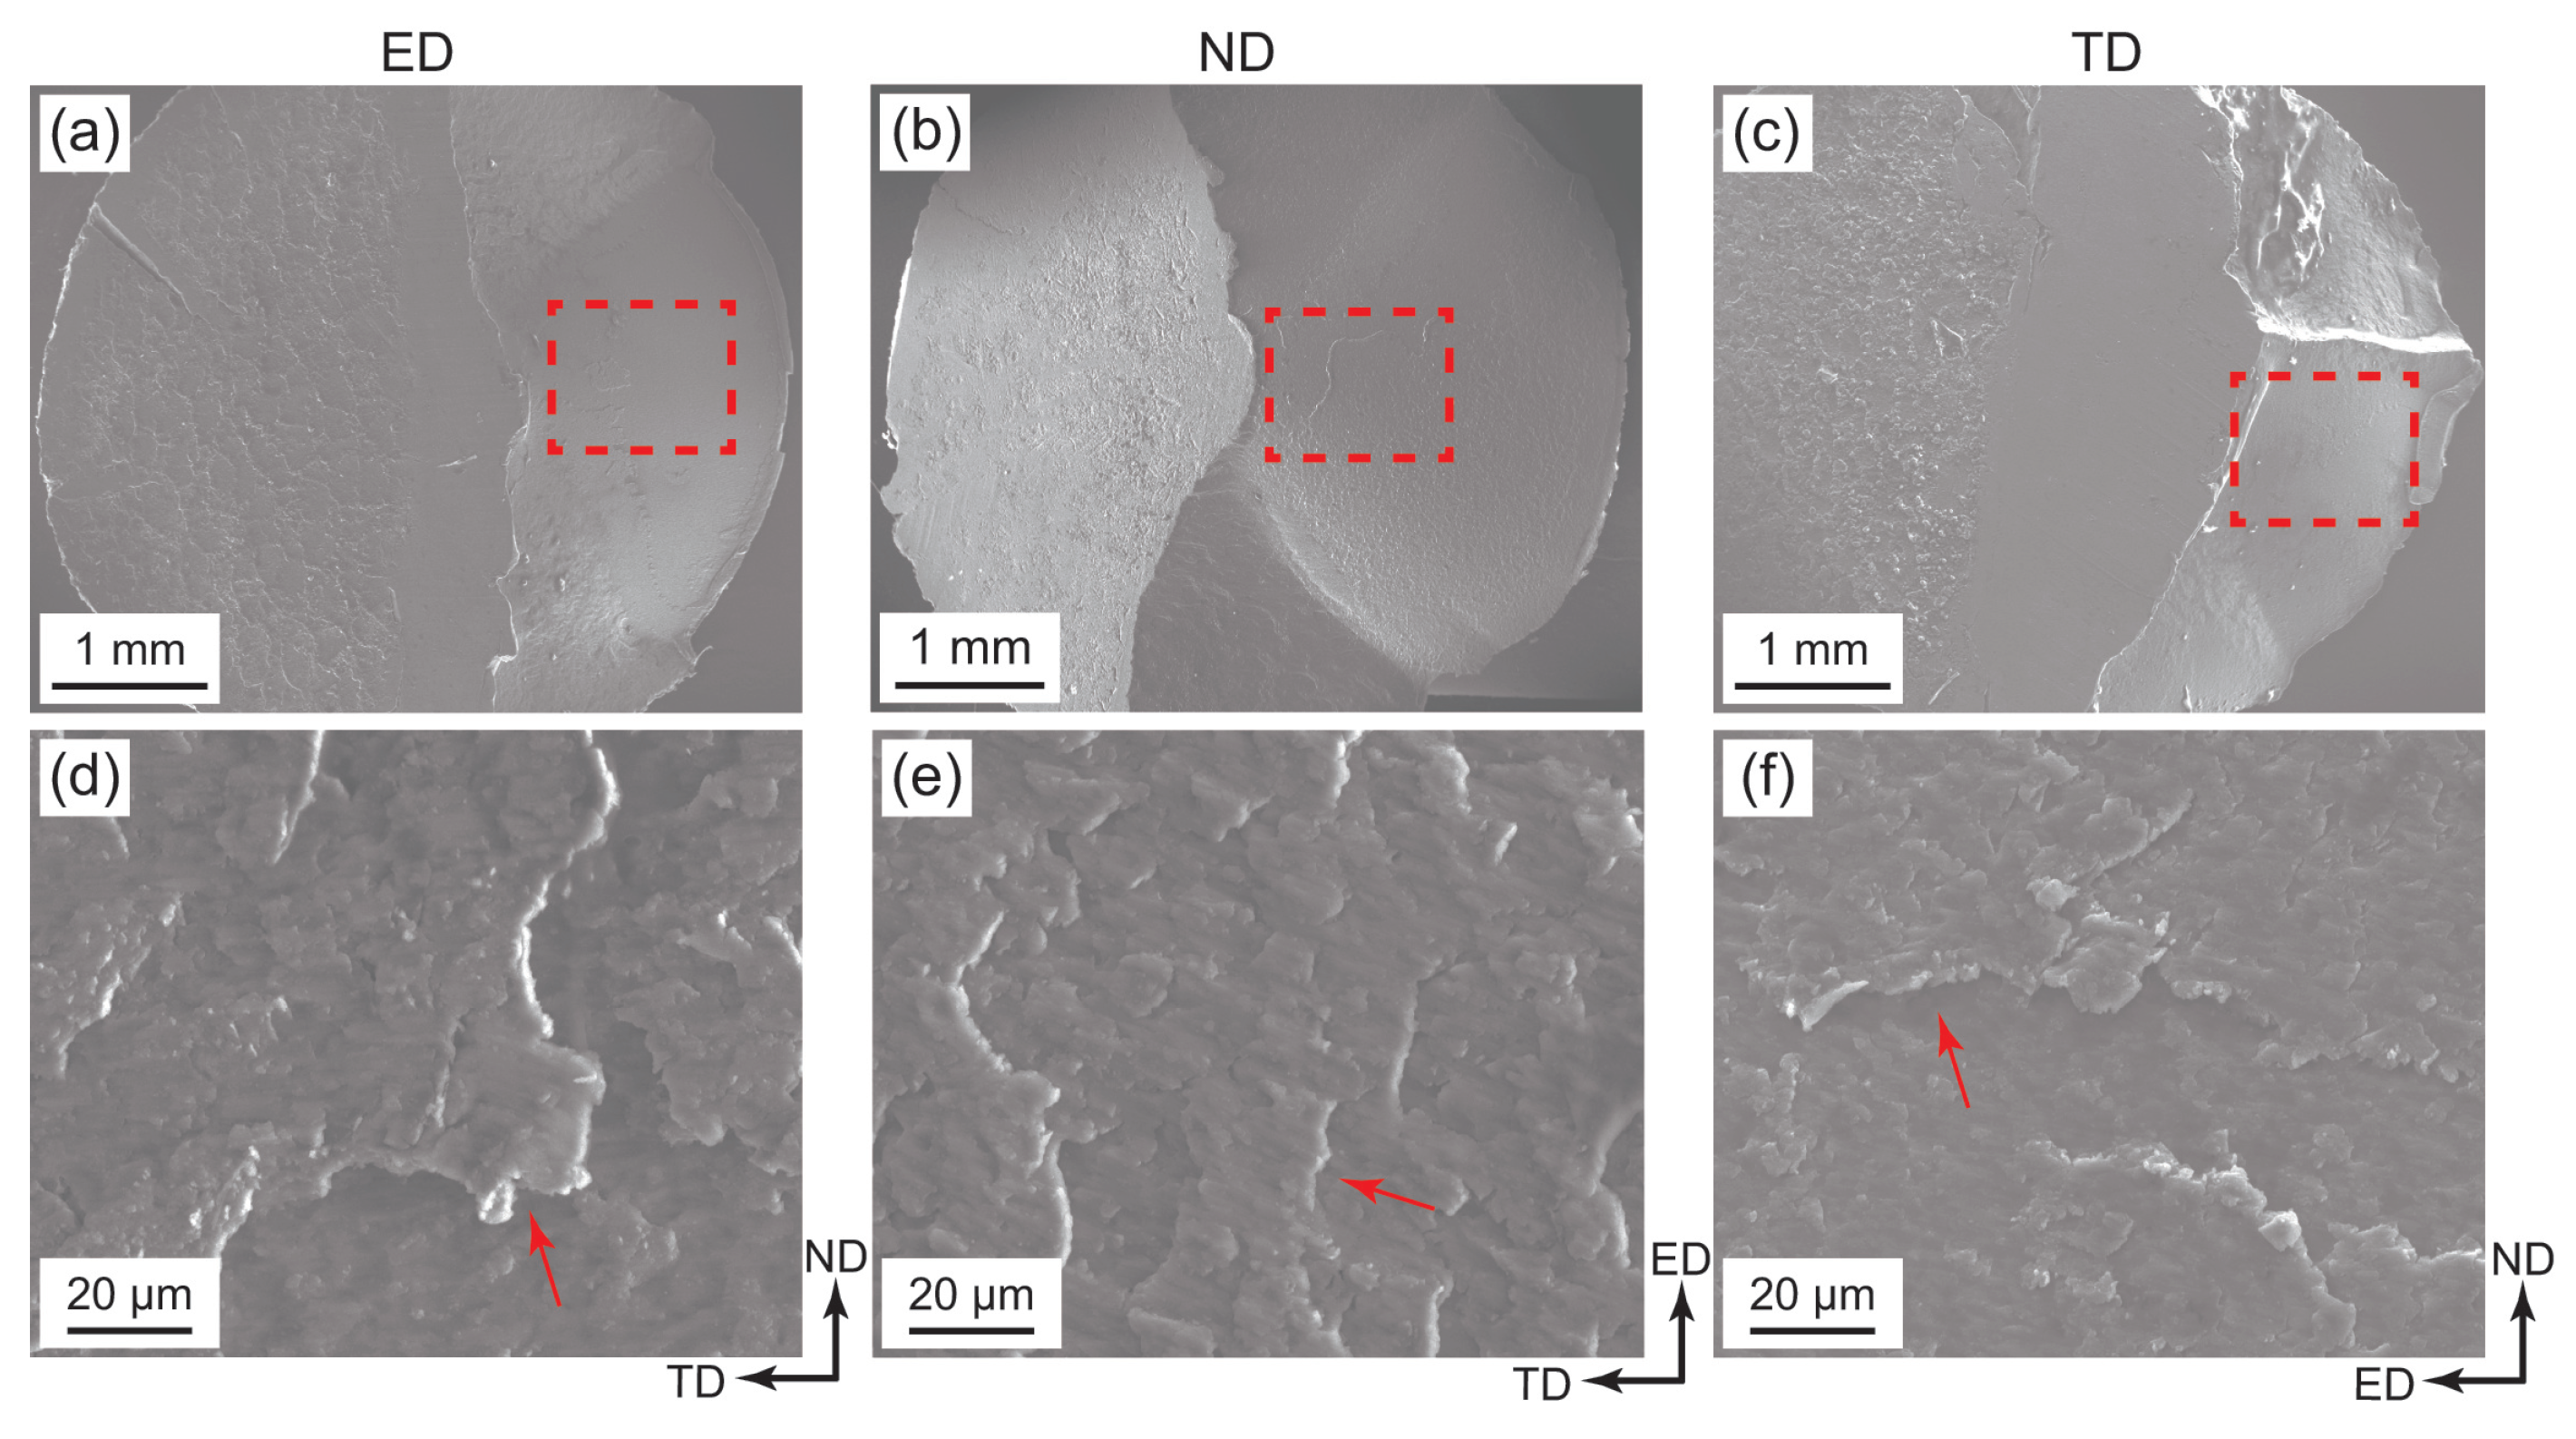
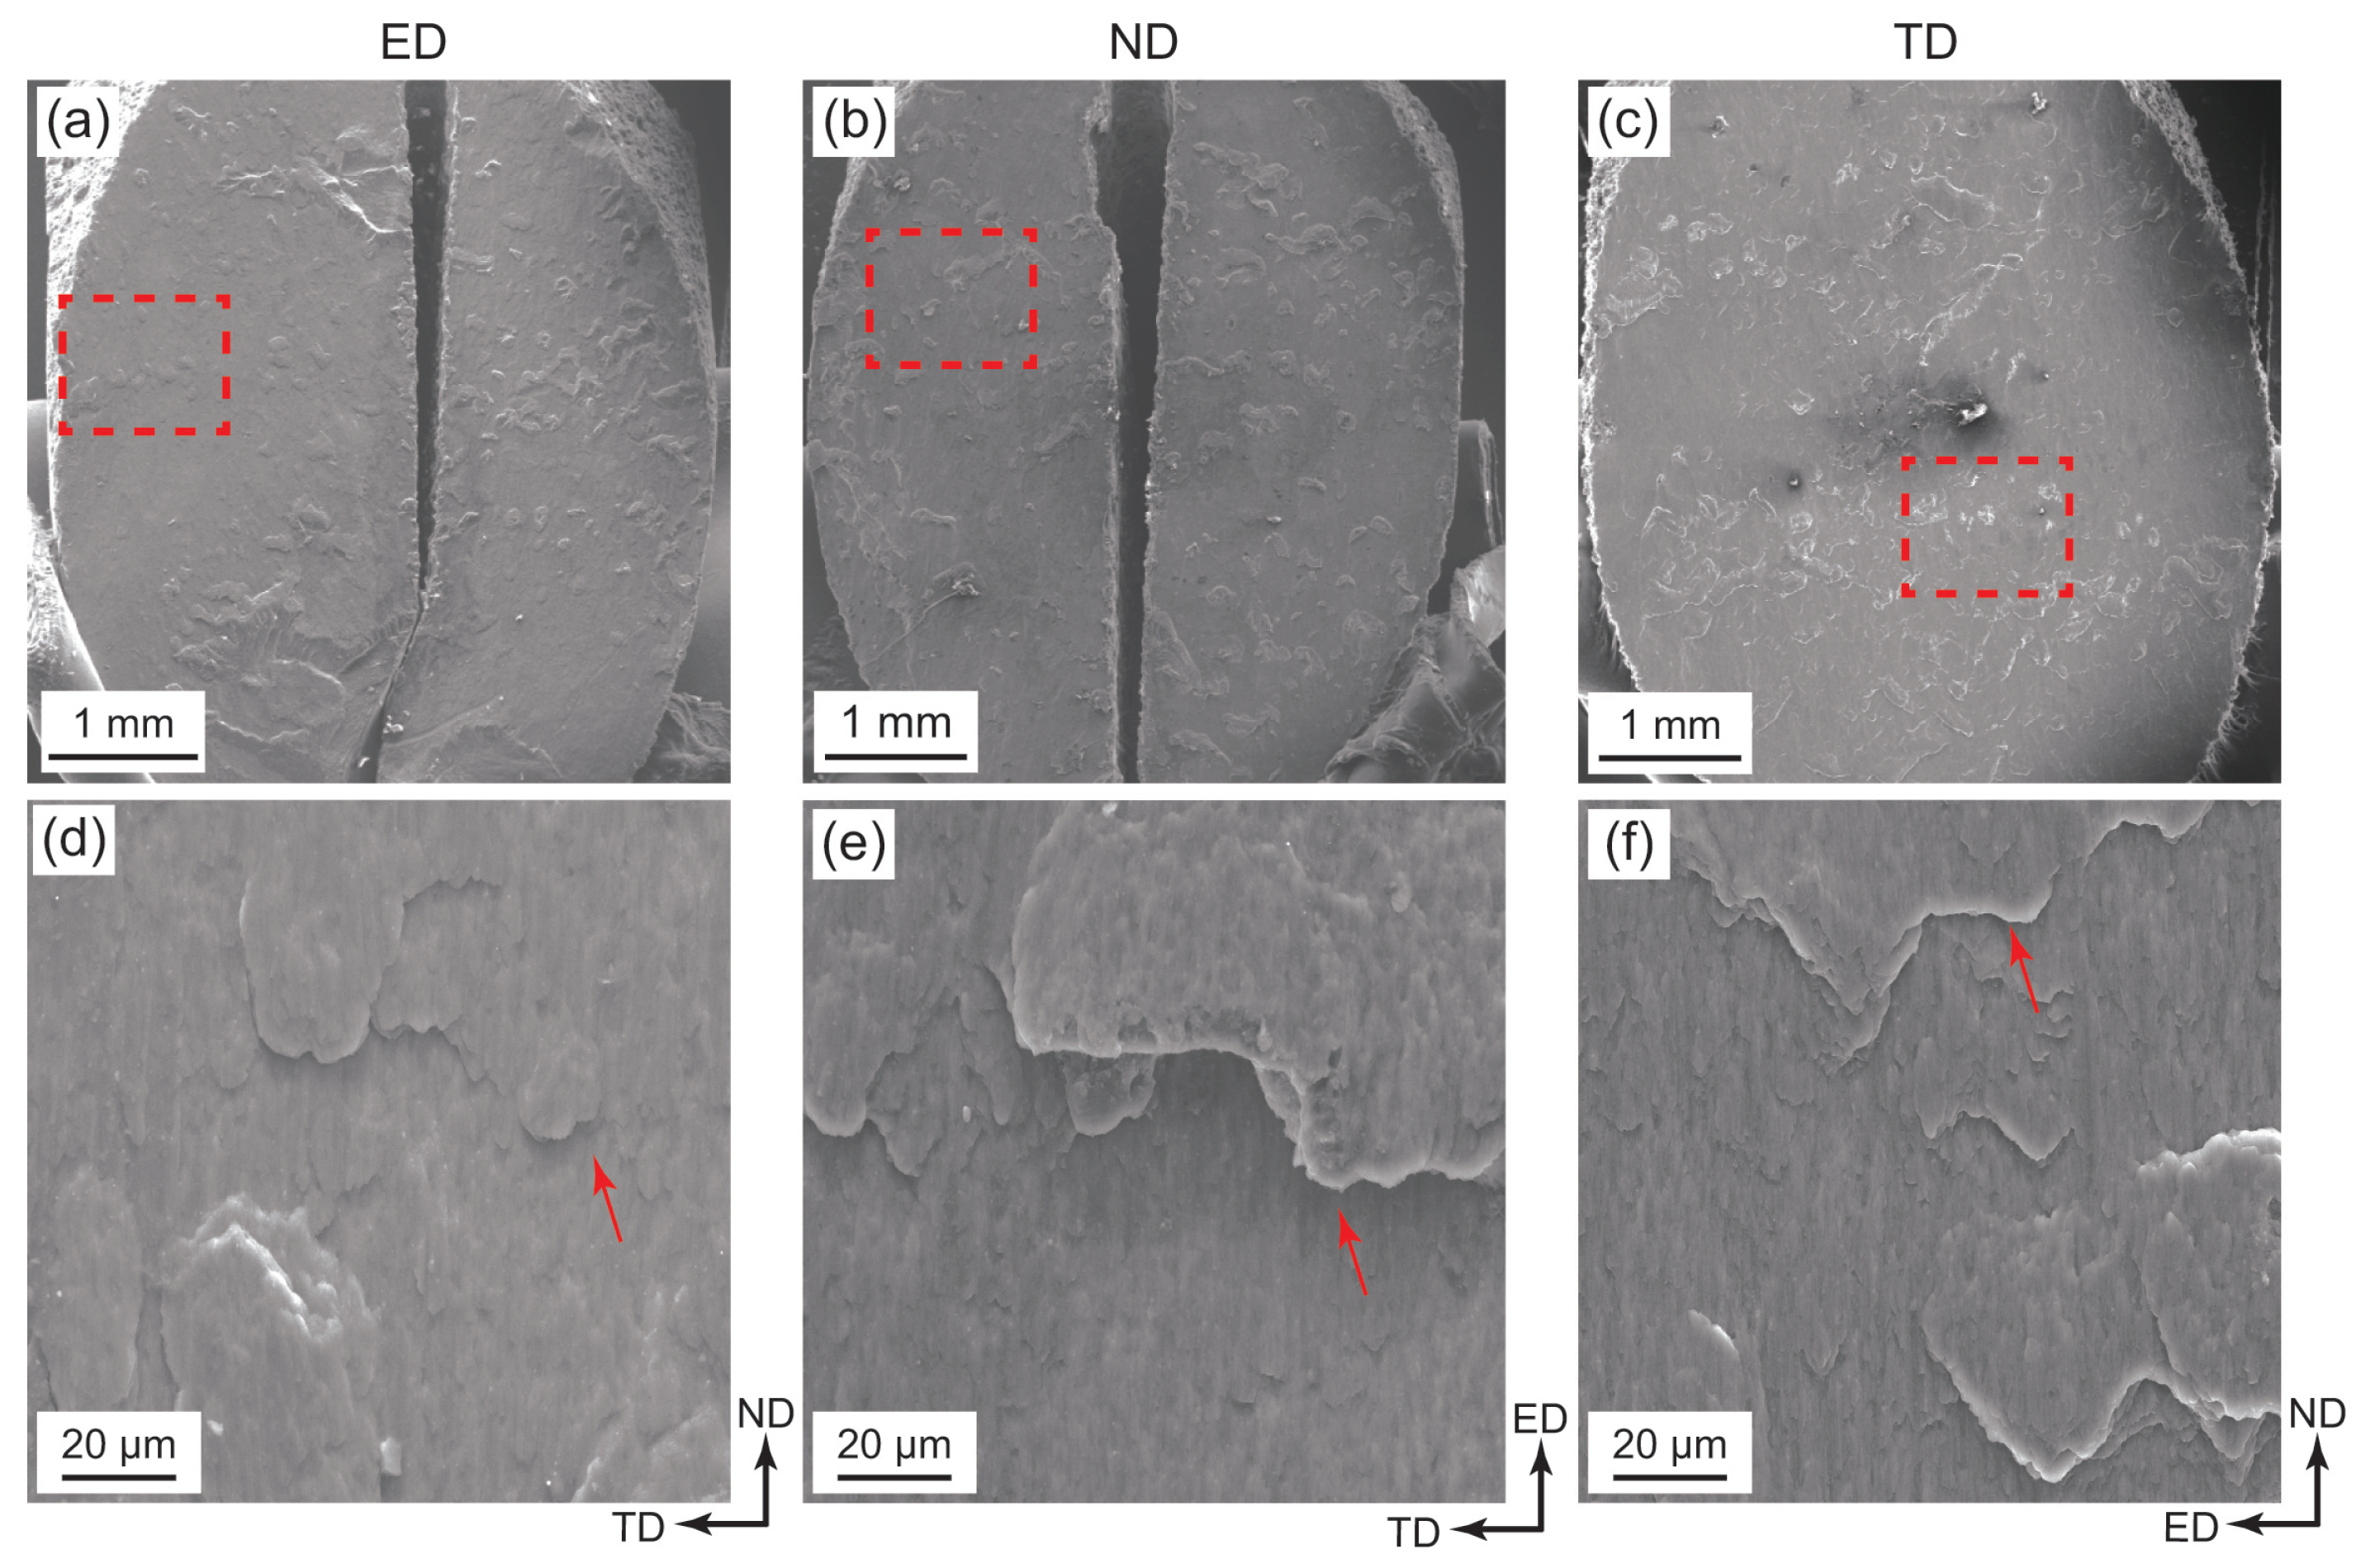
Postmortem SEM analyses are conducted on the CNT/2024Al composite specimens after dynamic (5.9 × 10 3 s 1 ) and quasi-static (1.0 × 10 3 s 1 ) compression along the three directions. The specimens are deformed to ε 60 % (controlled with the stop ring to protect fracture surfaces) for dynamic compression, and to failure for quasi-static compression. The corresponding fractographs are presented in Figure 5 and Figure 6, respectively. The fracture morphology for dynamic compression show quite different characteristics from that for quasi-static compression. Conical fracture surfaces at 45 to the loading direction are observed for dynamic compression along the three loading directions, but shear fracture planes at 45 to the loading directions are observed under quasi-static compression, indicating a change in the fracture mechanism with increasing strain rate. Figure 5d–f and Figure 6d–f are magnified views of the fracture surfaces indicated by the rectangles in Figure 5a–c and Figure 6a–c, respectively. A large number of scaly features (marked by the arrows) are observed, as a result of the cracks propagating along the interfaces of lamellar structures.
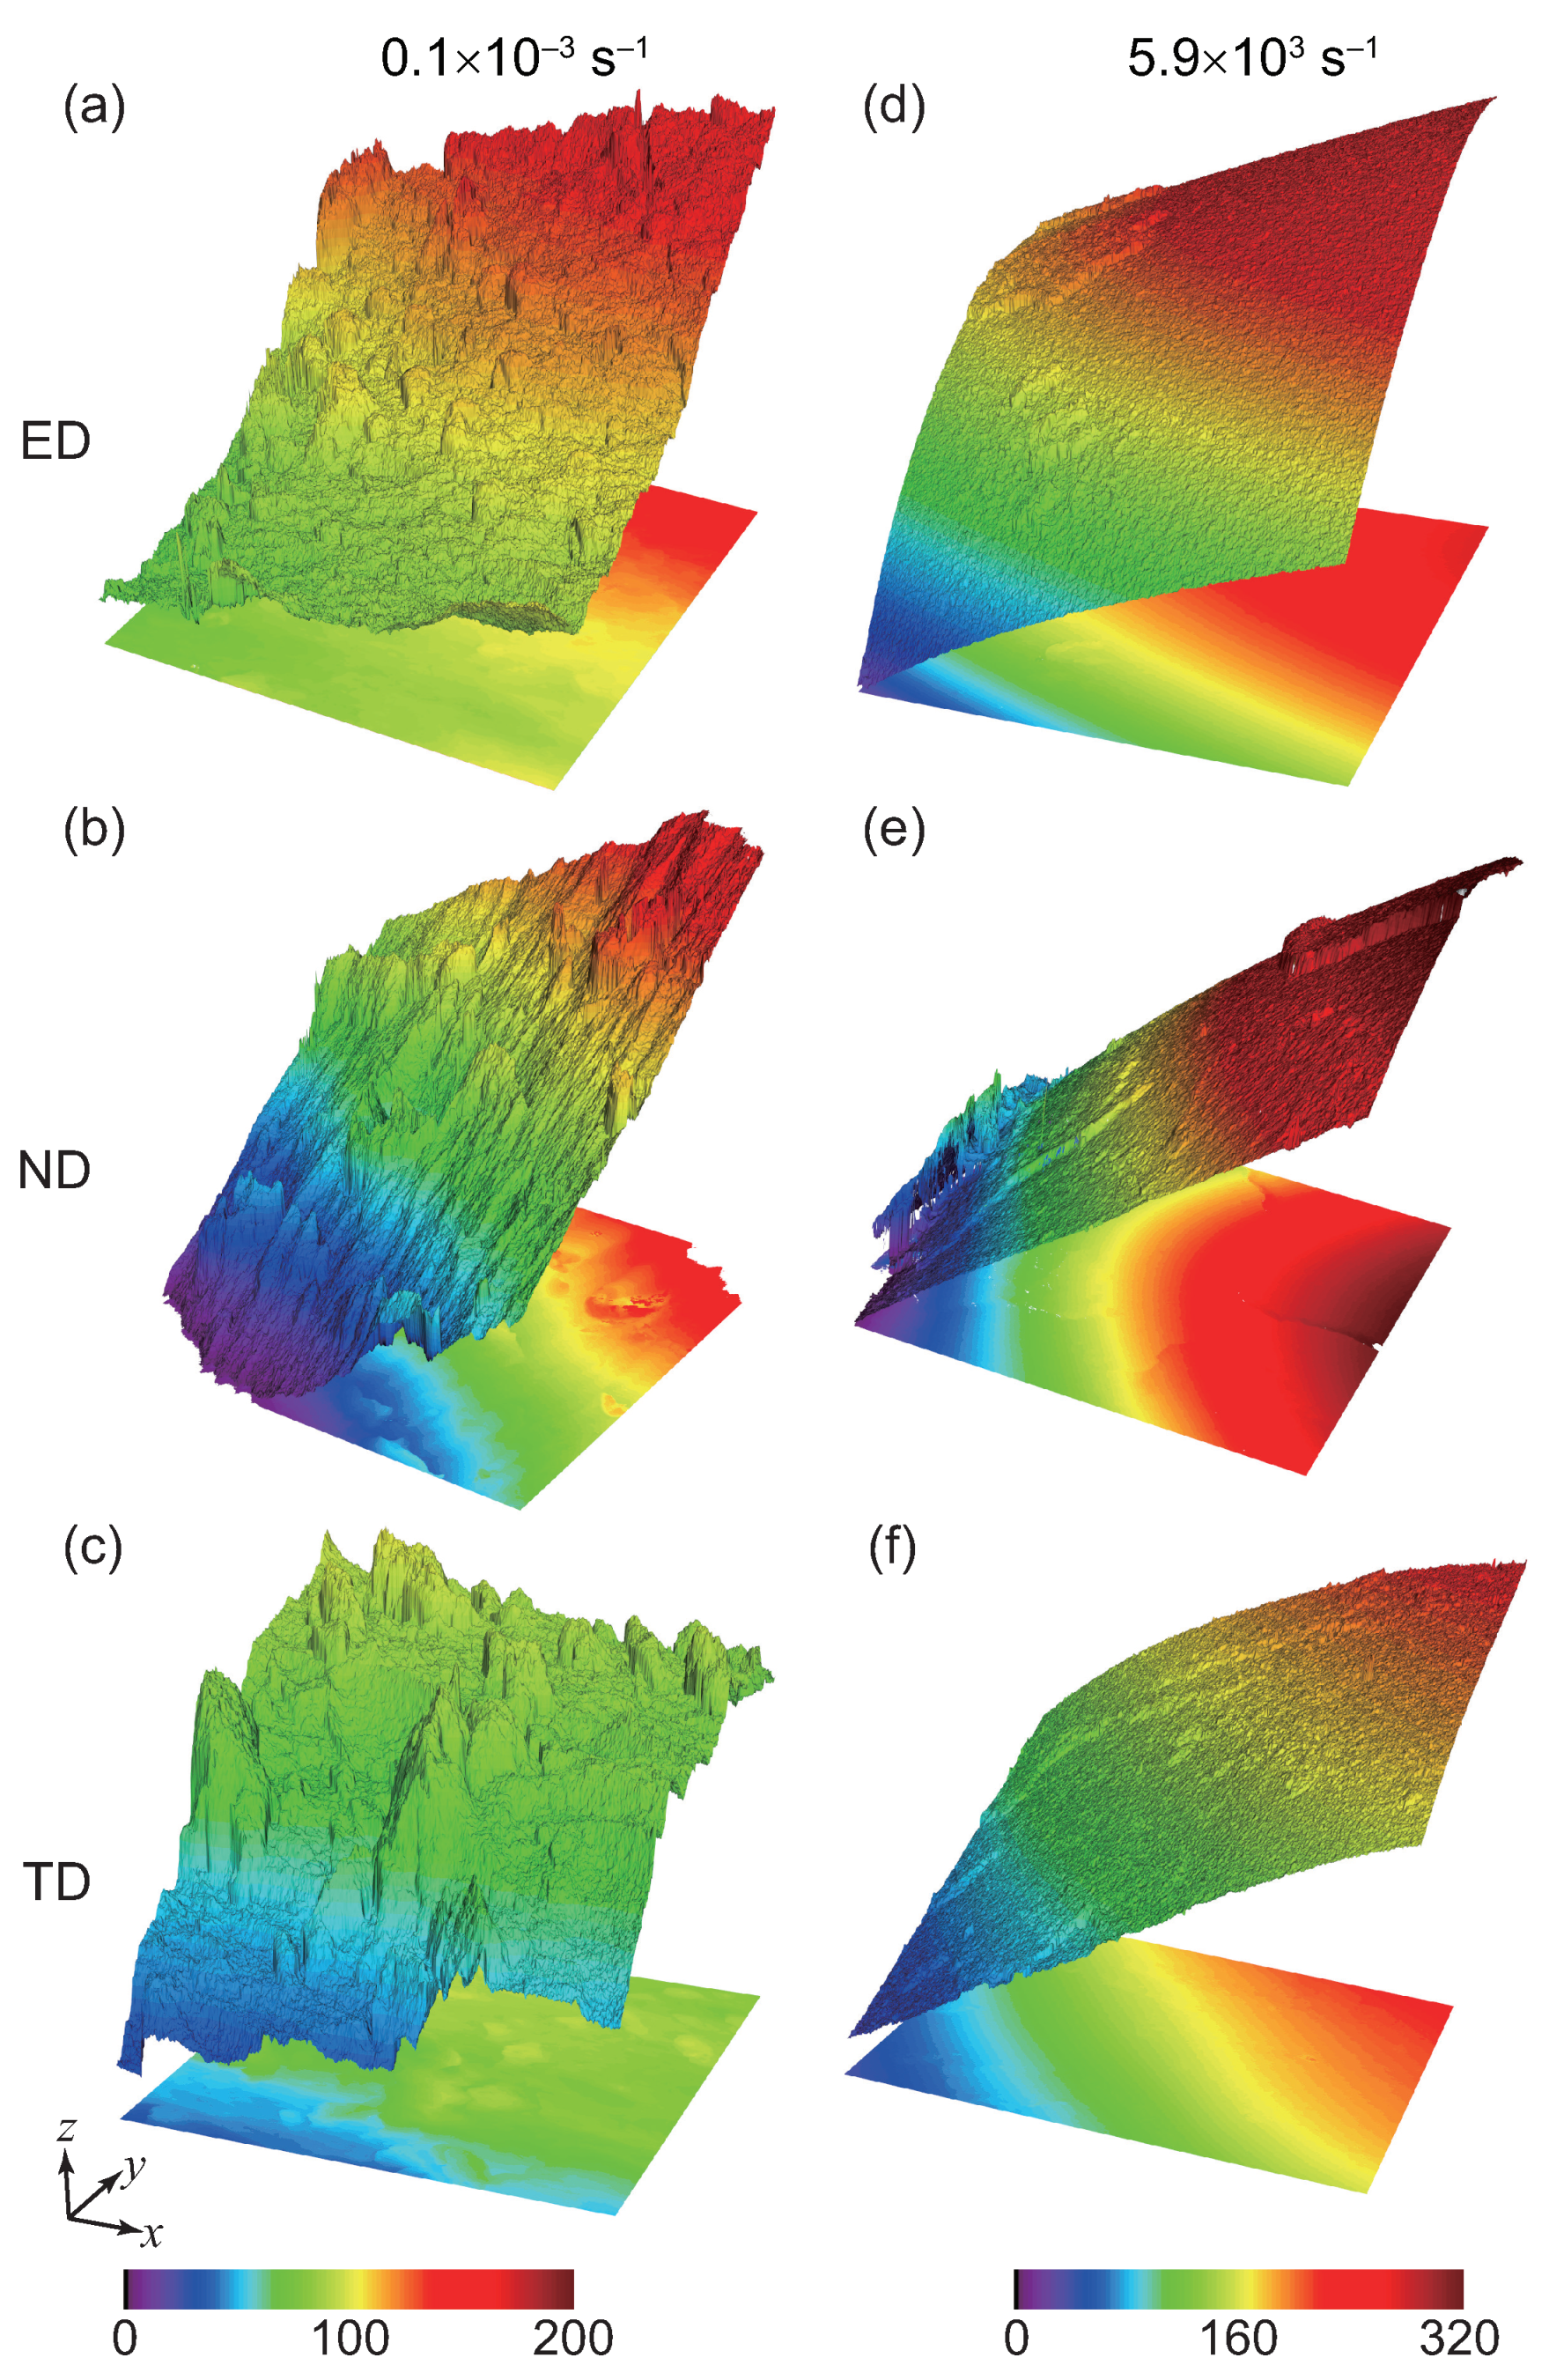
White light interference analysis is also carried out on the fracture surfaces of the CNT/2024Al composite. The 3D profiles and corresponding 2D projections for dynamic and quasi-static compression the three directions are shown in Figure 7. The projected dimensions are all approximately 834 × 834 μ m 2 . For dynamic compression, smooth curved fracture surfaces are observed, whereas the fracture surfaces for the quasi-static compression are much rougher and do not form a curved fracture surface, consistent with the SEM analyses in Figure 5 and Figure 6.
As the compressive loading proceeds, plastic deformation is localized along the direction of the maximum shear stress, i.e., 45 to the loading direction [24,27], and results in the formation of a 45 shear planes under compression [24,28]. Deformation and fracture under compressive loading depend on microstructures of a composite [29,30]. Although the CNT/2024Al composite shows a lamellar microstructure, the particle size is at the micrometer scale (∼10 μ m), the differences in average grain sizes and grain orientations in all directions are negligible [5]; shear deformation and fracture can take place in any planes oriented 45 to the loading direction. Therefore, microstructural anisotropy of the CNT/2024Al composite can be ignored under compression. This is the reason why the fracture morphology (Figure 5 and Figure 6) and compressive stress–strain curves (Figure 3) at similar strain rates exhibit negligible anisotropy.
Given the initial microstructures [5], the deformation rate and driving force are high under dynamic compressive loading, and deformation occurs in a more homogeneous manner. Fracture occurs along the direction of the maximum shear stress, resulting in smooth conical fracture surfaces (Figure 7d–f). In addition, “homogeneous” deformation indicates the synergistic effect of flake particles [29], likely giving rise to the higher fracture strain under dynamic compressive loading. However, quasi-static compression allows deformation to nucleate and grow in weak zones given the longer time scale involved [29], and tend to form macro crack surfaces at 45 to the loading direction. The propagation of a macroscopic crack formed by localized deformation zones induces a rough fracture surface (Figure 7a–c) under quasi-static compression.

3.3. Tensile Loading and Strain Field Mapping

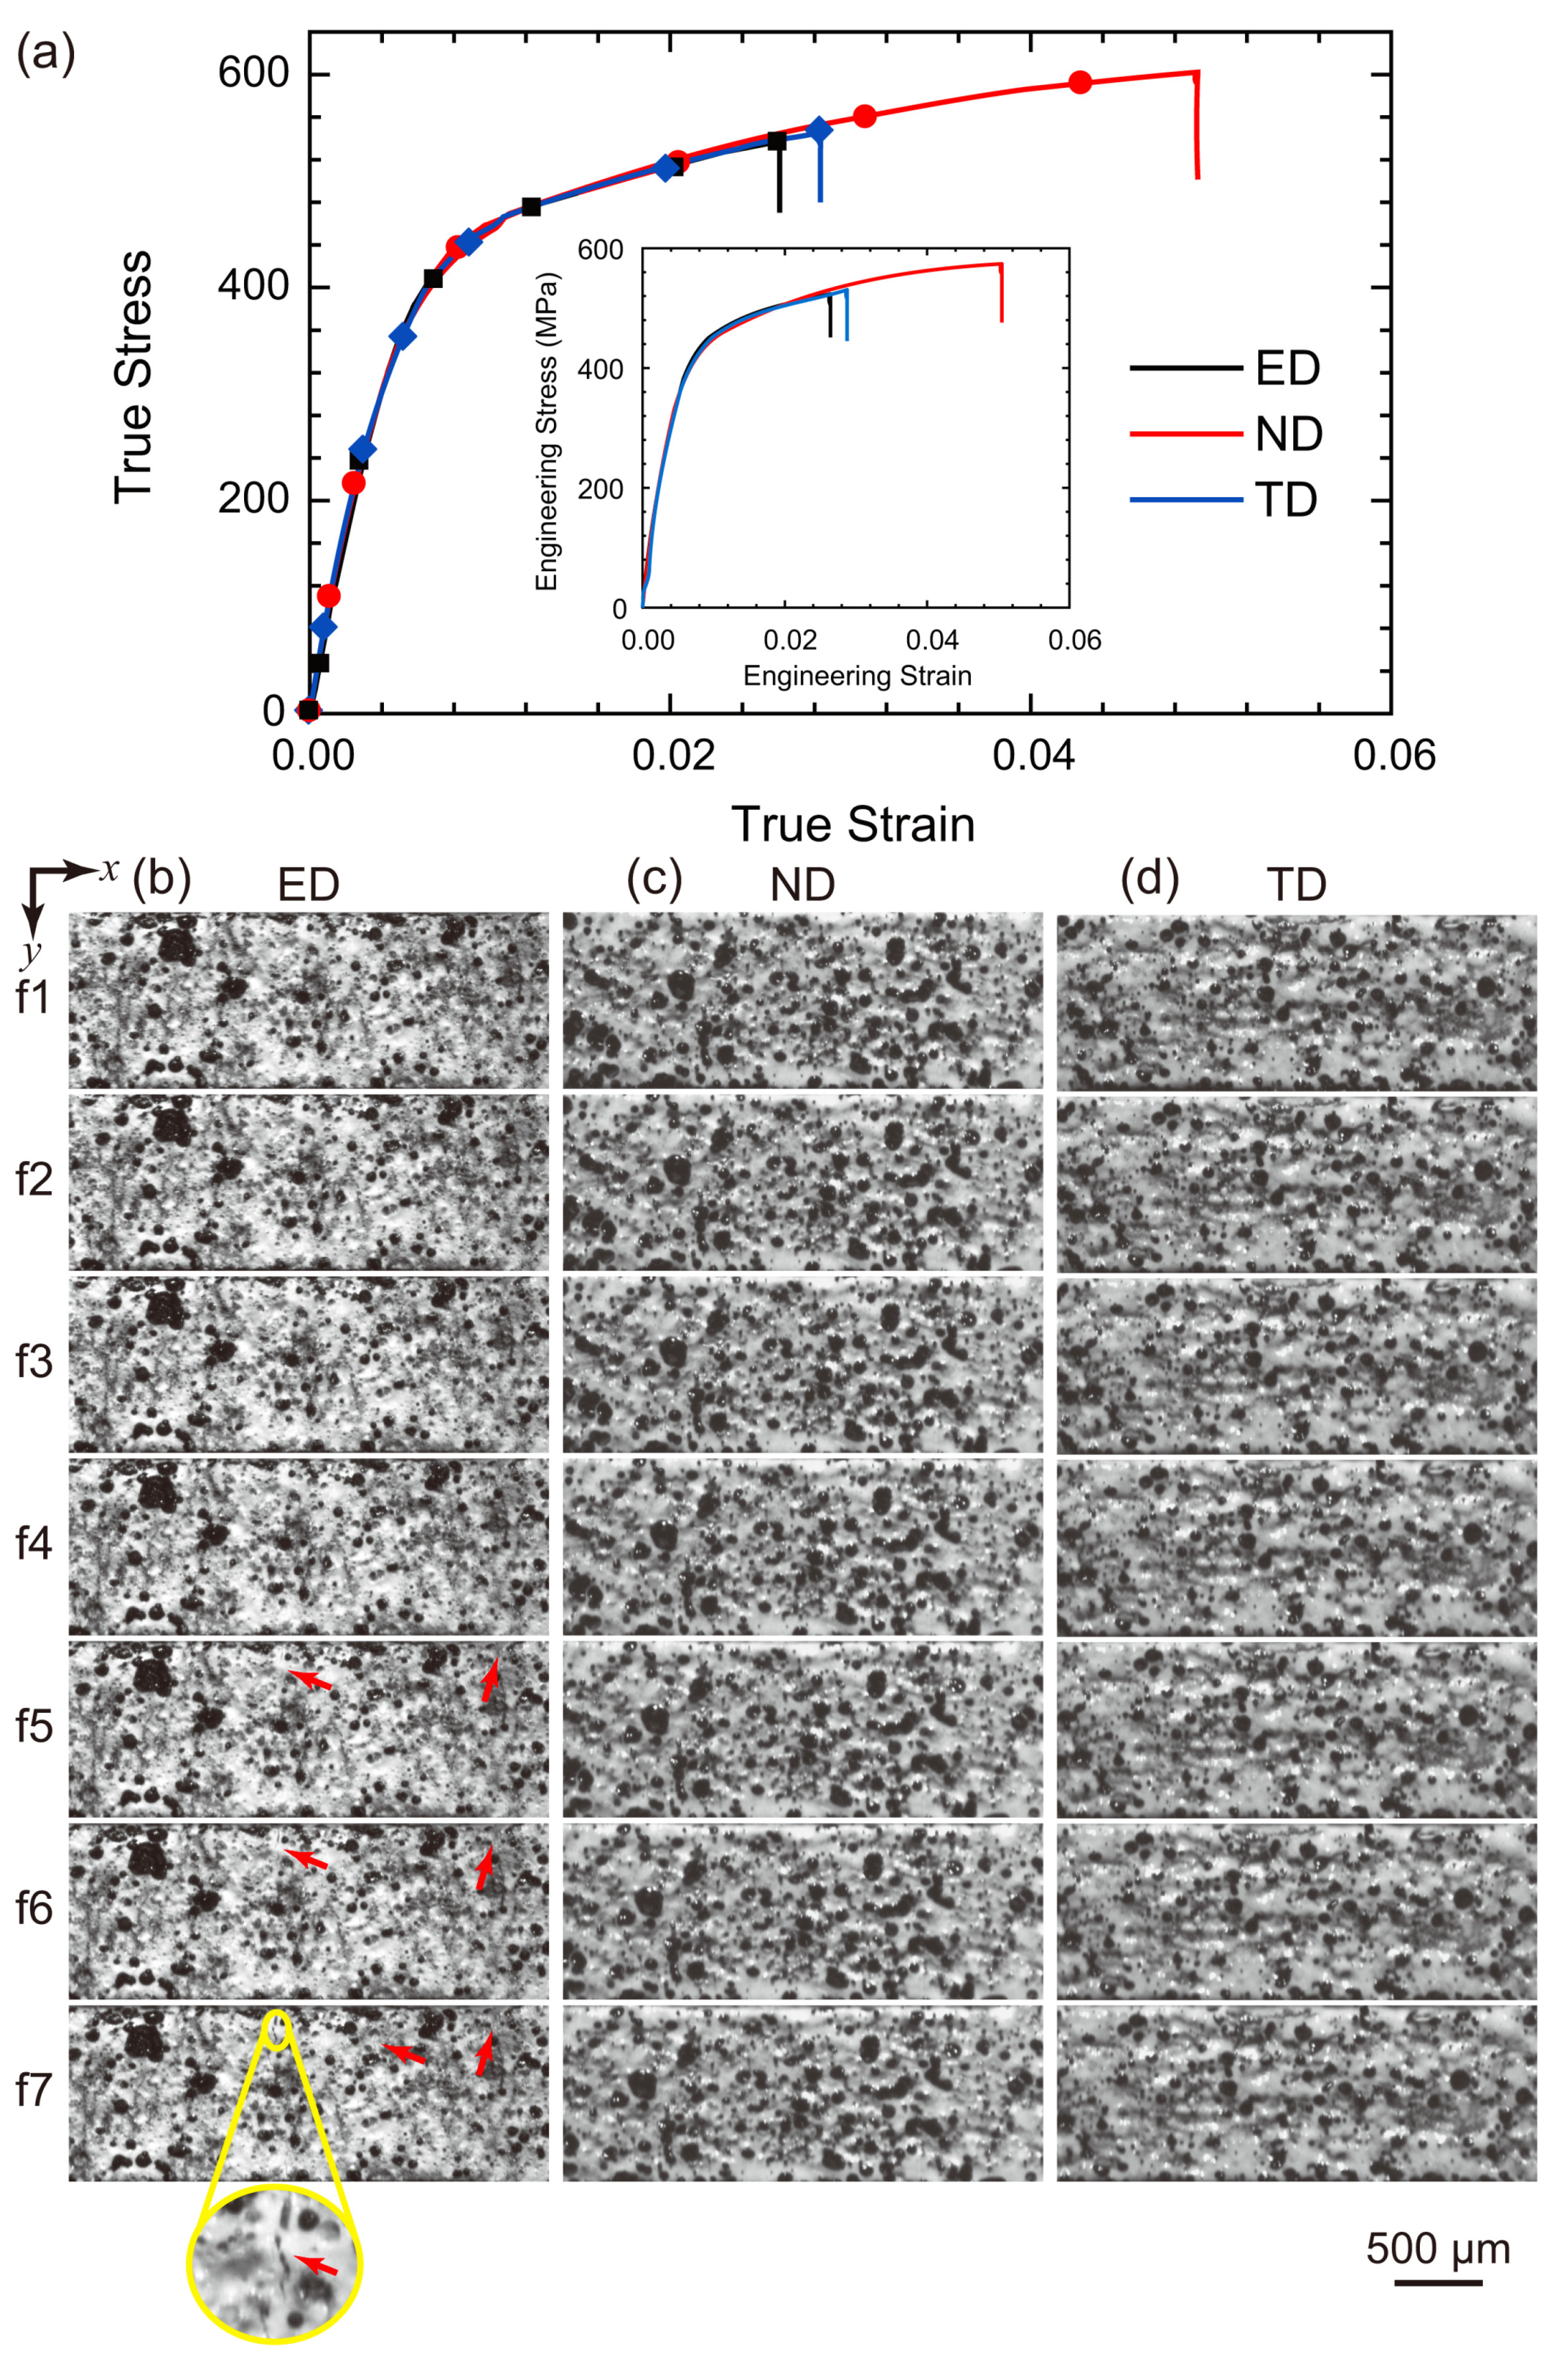
Quasi-static tensile (×10 3 s 1 ) tests with in situ optical imaging are conducted on the CNT/2024Al composite along the ED, TD and ND. The true strain–stress curves are presented in Figure 8a. The inset of Figure 8a is corresponding engineering stress–strain curves. As shown in Figure 8a, the elastic regions for the ED, TD and ND directions essentially coincide. The specimens for the ED-, TD- and ND-loading have a similar yield strength of ∼480 MPa. Strain hardening is observed for all the three loading directions (Figure 8a). The fracture stress and strain are different for the three loading directions; the ND direction exhibits the highest fracture strength and strain. Meanwhile, the fracture strains for the three directions under quasi-static tension are far lower than those under quasi-static compression, showing a considerable tension and compression asymmetry. This may be due to the weak bonding at flake particle interfaces which gives rise to interface debonding instead of shear failure under tension.
Figure 8b–d are the snapshots for tensile loading along the ED, TD and ND (frames f1–f7, marked in Figure 8a). The frame rate and the exposure time are set as 1 Hz and 1 s, respectively. The central area (∼2 mm × 0.8 mm) of the sample gauge section is chosen for imaging. The average size of the speckle formed by black and white paint is 18 μ m. The speckles move along the loading direction with the samples, which can be seen more clearly in the supplementary movies (Supplementary Materials: Movie_ED.avi, Movie_TD.avi, Movie_ND.avi). For the ED-loading, cracks appear at frame 5 (marked by the arrows) after the CNT/2024Al composite yields, and the cracks grow and propagate as strain increases, as illustrated in an enlarged view at frame f7. For the ND- and TD-loading, the overall deformation processes are similar and no visible cracks are found in the snapshots. In addition, no obvious necking is observed in the snapshots prior to failure for all the three loading directions.
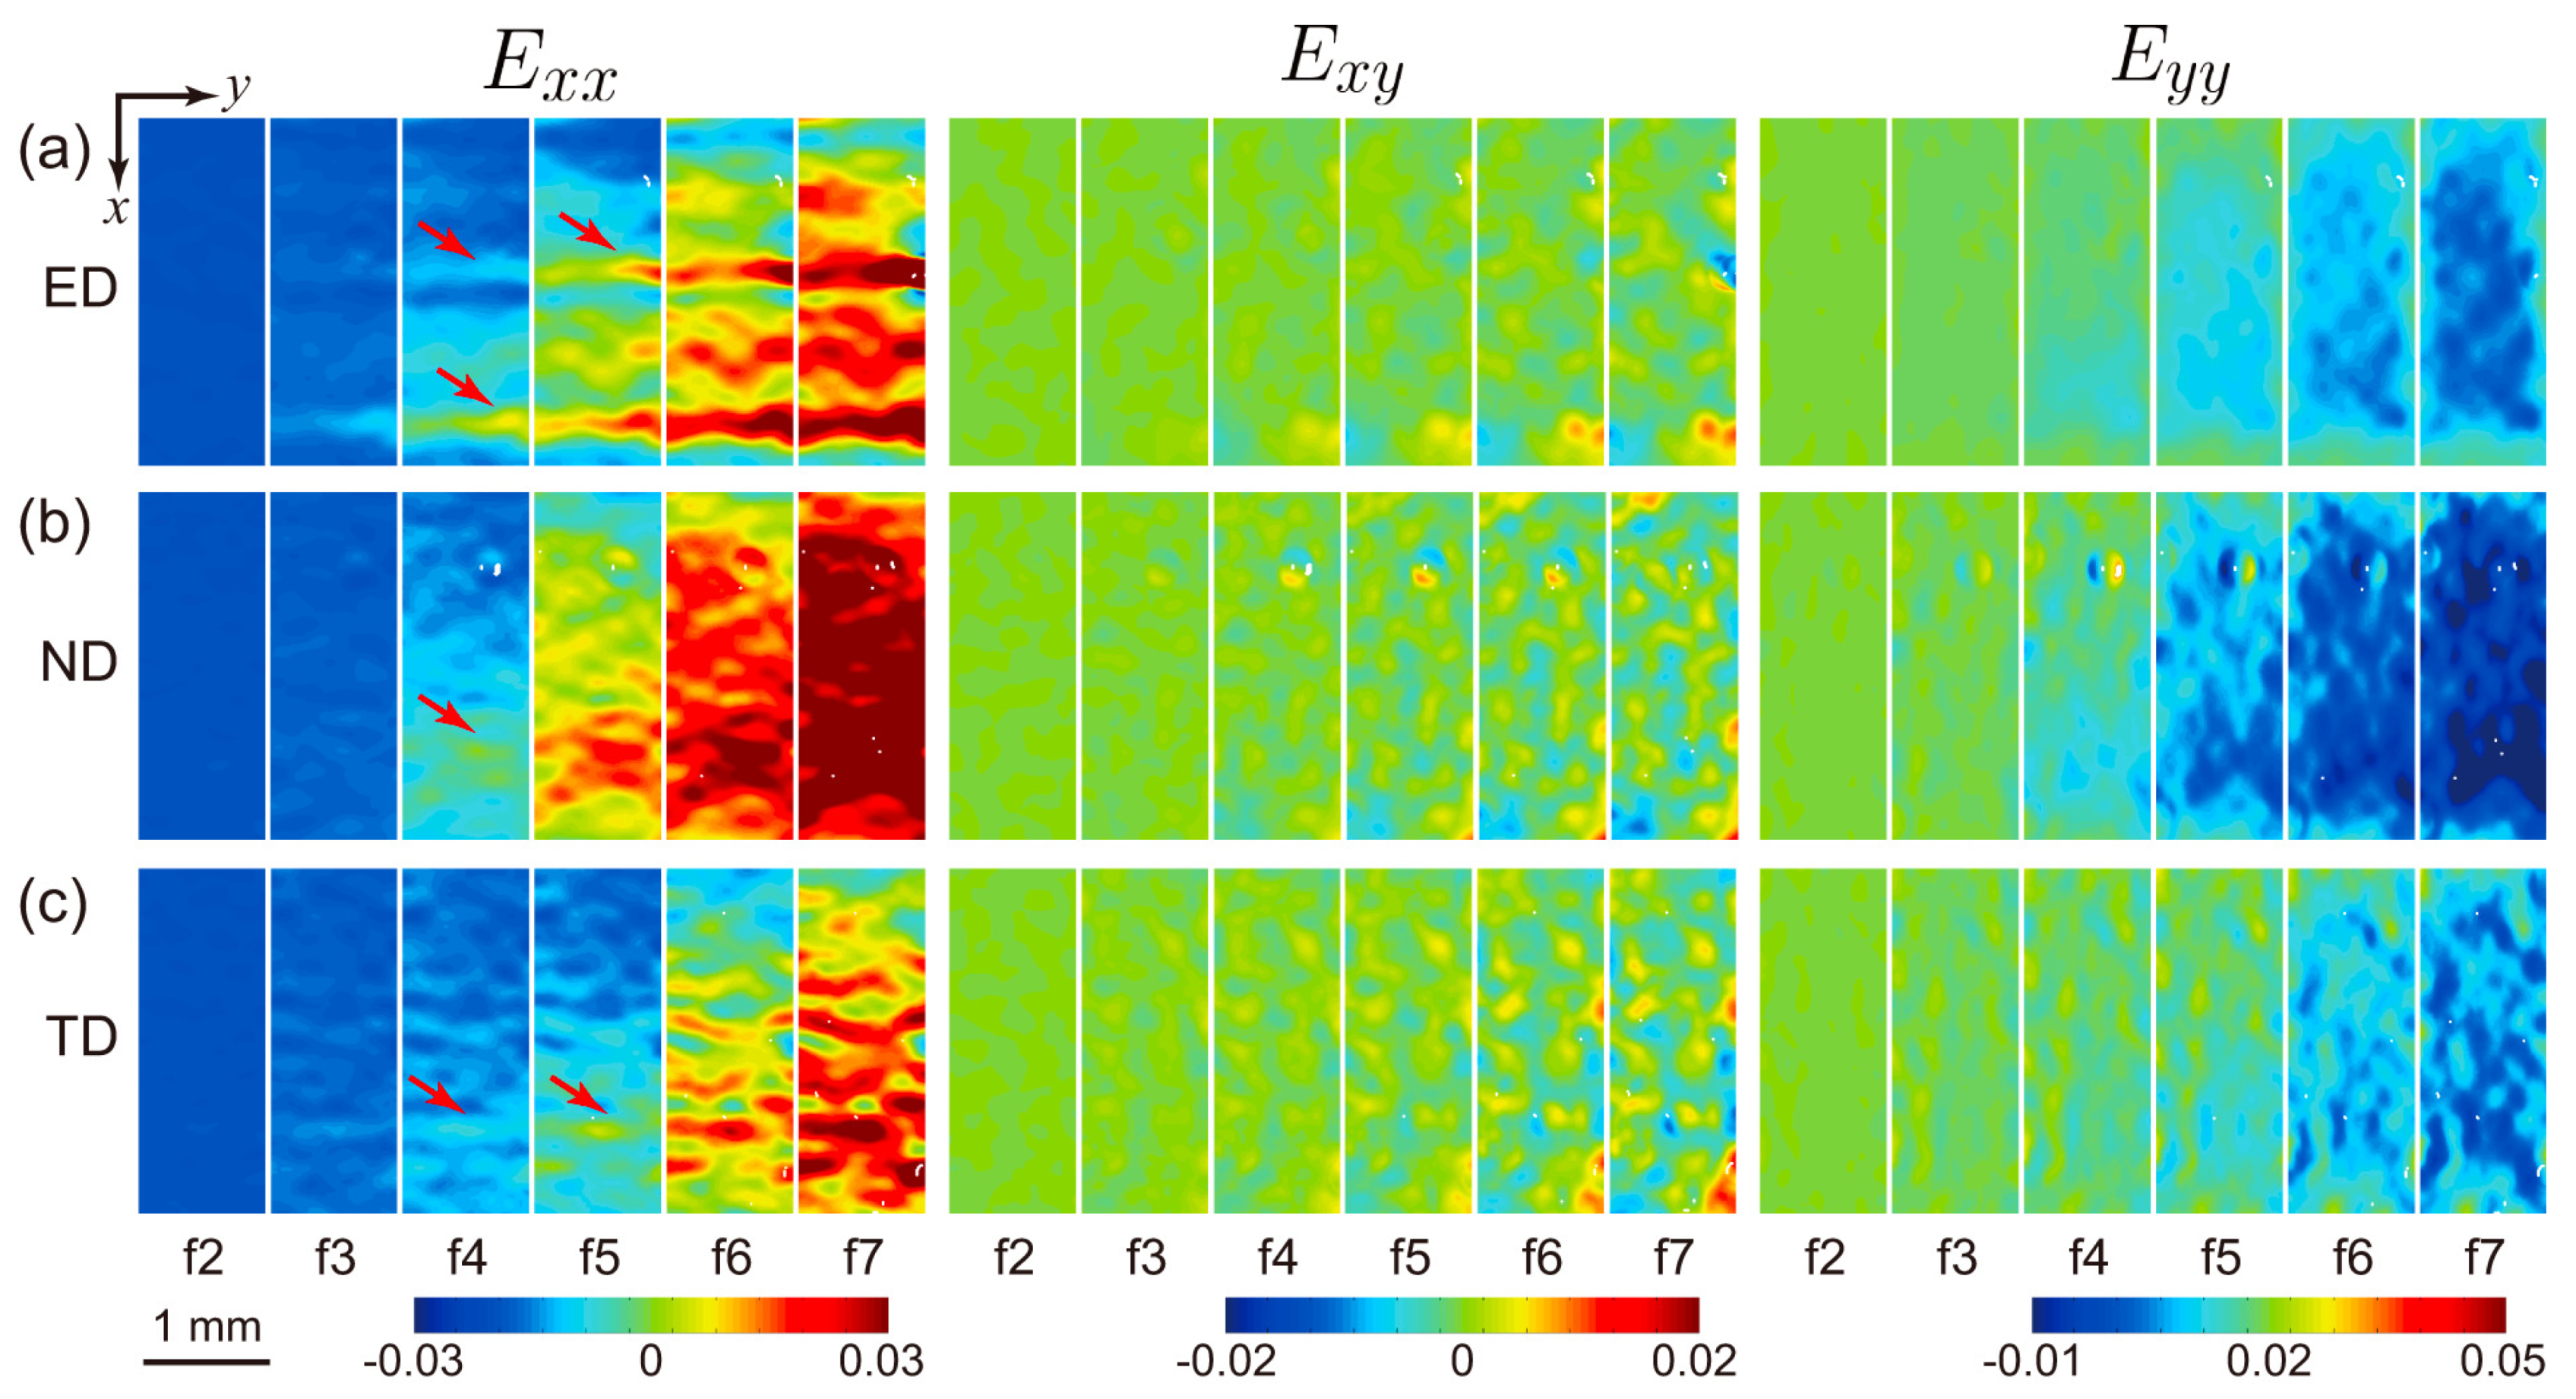
In order to understand the deformation and damage mechanisms of the CNT/2024Al composite, DIC is used to map the strain fields. Details of the DIC analysis are presented elsewhere [31,32,33]. The whole images in Figure 8b–d are chosen as the regions of interest for the DIC analysis. Image correlation is applied between the current frame and the first frame (f1 in Figure 8). According to the speckle size and quality analysis [22,34], the subset radius and subset spacing used in the DIC analysis are set as 40 pixels and 5 pixels, respectively. The Lagrangian normal strains ( E x x and E y y ) and shear strain ( E x y ) are calculated from displacement (u) gradients as
E i j = 1 2 u i , j + u j , i + u k , i u k , j ,
where i, j = x, y.
Figure 9 presents the E x x , E x y and E y y strain fields acquired at six instants (frames f2–f7) of the CNT/2024Al composite under quasi-static tension. The white patches in Figure 9 refer to the areas with poor image correlation. At the elastic deformation stage (f2 and f3), strain fields E x x ( x , y ) are small in amplitude and homogeneous across the specimens for the ED-, ND- and TD-loading. However, low-amplitude strain localizations (marked by the arrows) appear in E x x ( x , y ) at frame f4 (after yield), and as strain increases, the evolution of strain fields E x x ( x , y ) is considerably different for the three loading directions. Tensile strain stripes perpendicular to the tensile direction are both observed for the ED- and TD-loading. However, strains are more uniformly distributed for the ND-loading, indicating more nucleation sites of deformation, and consequently lead to better ductility for this direction. In addition, the strain distribution appears more homogeneous for the TD-loading than that for the ED-loading. Strain localizations also develop in the E y y and E x y strain fields. E y y is induced by E x x via the Poisson’s effect. E x y strain fields appear small for all three loading directions, indicating tension-dominated deformation and failure of the CNT/2024Al composite. Shear localizations are distributed in a relatively uniform manner for all three loading directions.
As for the CNT/2024Al composite with lamellar microstructures, plastic deformation is prone to nucleate and grow at the lamellar interfaces [5]. Due to the hot extrusion during the composite fabrication, most of the flake particle planes are parallel to the ED-TD plane, and the area of the contact interfaces between the flake particles increases in the following order: ED < TD < ND [5,9]. When the tensile direction is parallel to the ED direction, cracking or debonding is easier to occur due to the absence of “interlocking” between particles [35,36], which leads to the lowest ductility in the ED direction. In addition, crack propagation is easier along the lamellar interface and microcracks are more prone to coalesce into macrocracks (marked by arrows in Figure 8b) for the TD-loading, resulting in low ductility as well. However, compared to the ED- and TD-loading, microcracks are more difficult to coalesce (either along particle or lamellar interfaces) for the ND-loading, and more local plastic deformation zones tend to nucleate and grow before catastrophic failure, resulting in a more homogeneous strain field. Increasing homogeneous nucleation of plastic deformation will lead to higher fracture stress and fracture strain [29], and thus the fracture stress and fracture strain increase in the following order: ED < TD < ND.
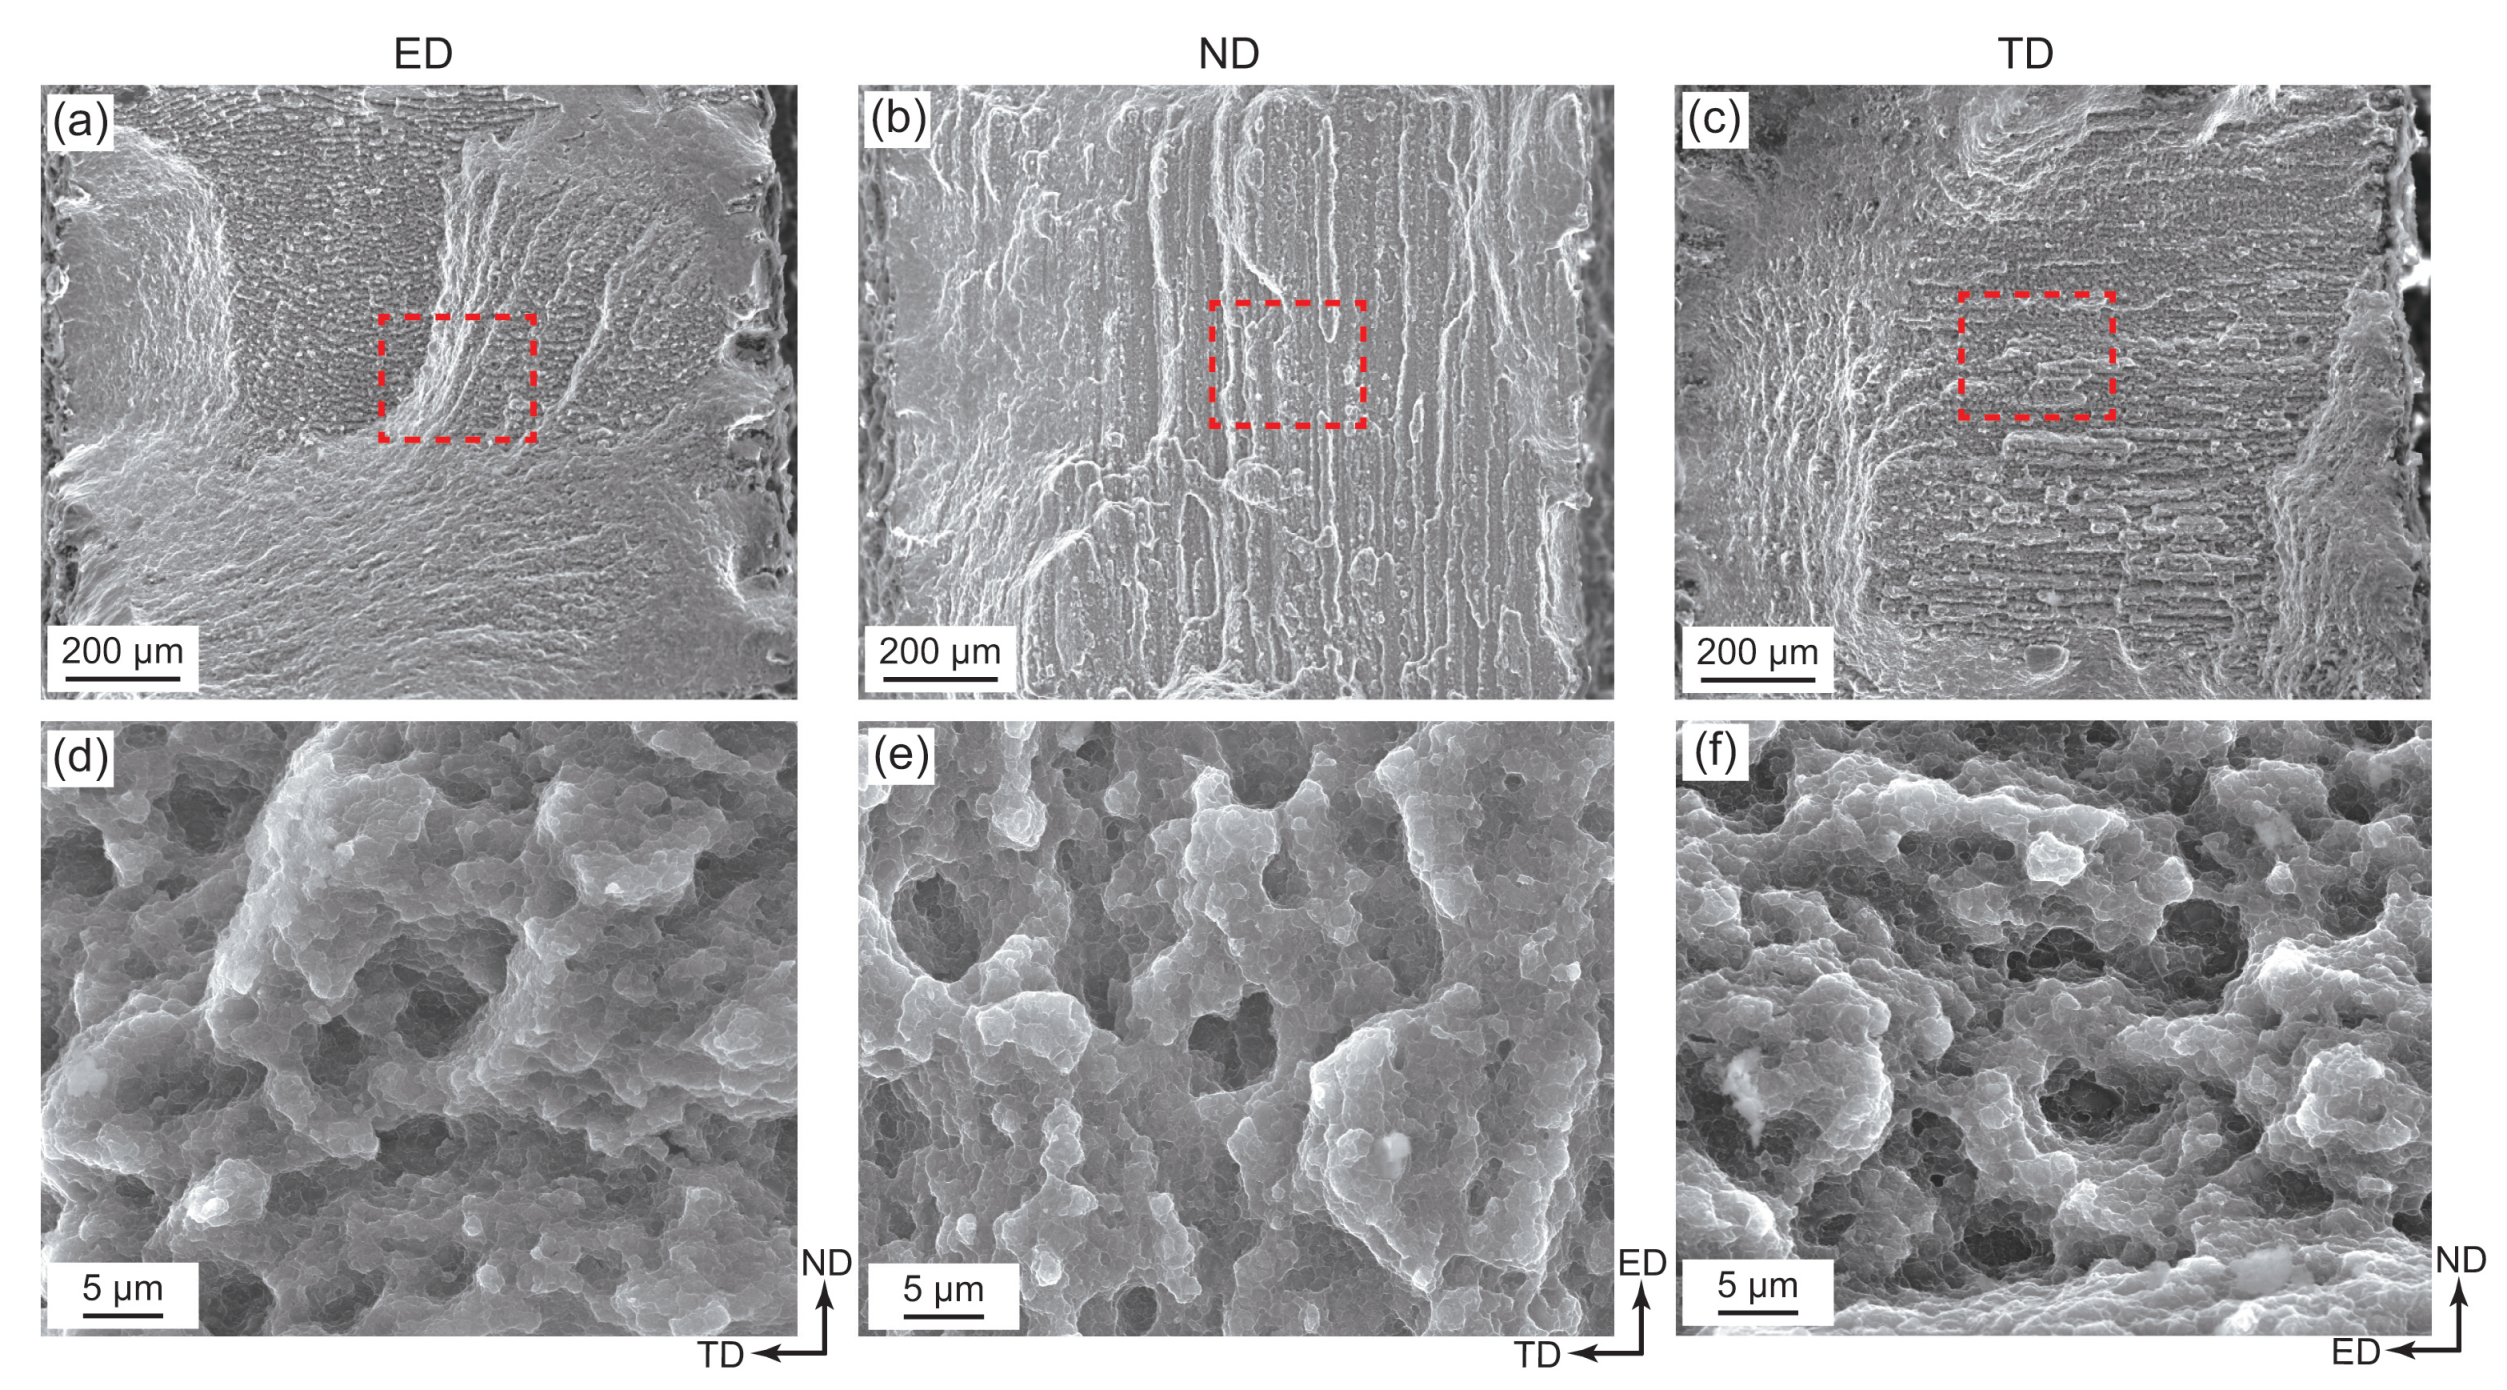
SEM fractographs of the recovered CNT/2024Al composites under quasi-static tension are presented in Figure 10. For the ED-loading (Figure 10a), a twisted stairway-shaped fracture surface is observed. The twisted fracture surface may be the result of rapid interaction of multiple macrocracks (marked by the arrows in Figure 9a). However, for the TD- and ND-loading (Figure 10b,c), the fracture surfaces show horizontal striations, as a result of interlamellar debonding. This indicates that microcracks tend to grow between the lamellar interfaces for the TD- and ND-loading, while microcracks are more prone to coalesce into macrocracks for the ED-loading, consistent with the strain mapping. High-magnification fractographs are shown in Figure 10e,f. The flake particles and microcracks formed by debonding or fracture of flake particles are observed for all three loading directions. However, no significant differences are noticed in the high-magnification fractographs for the three loading directions, indicating that the differences in fracture morphology and fracture strain for the three loading directions are related to the anisotropy of lamellar microstructures.

4. Conclusions

We have investigated the mechanical properties of the CNT/2024Al composite fabricated by flake powder metallurgy and hot extrusion. The CNT/2024Al composite is subjected to compression and tension along three different directions (ED, ND, and TD). Our main conclusions are as follows.
No obvious strain rate effect on the flow stress of the CNT/2024Al composite is observed under compressive loading. The CNT/2024Al composite exhibits strain hardening under both dynamic and quasi-static compression, while strain softening (or damage accumulation) is observed before failure under dynamic compression.
The fracture of the composite under both dynamic and quasi-static compression loading is shear-dominated. Smooth conical fracture surfaces and rough shear fracture planes oriented 45 to the loading direction are observed under dynamic and quasi-static compression, respectively. Plastic deformation is more homogeneous across the sample under dynamic compression, leading to considerably higher ductility.
Anisotropic mechanical behavior of the CNT/2024Al composites is not significant under compressive loading. However, mechanical anisotropy is observed in the fracture stress and strain under tensile loading, and is attributed to different deformation and damage mechanisms (debonding along the particle or lamellar interfaces) as manifested in the strain mapping. The deformation fields are the most uniformly distributed along the normal direction. In addition, the fracture of the composite under tensile loading is tension-dominated.

Supplementary Materials

The following supporting information can be downloaded at: https://www.mdpi.com/article/10.3390/met13020254/s1.

Author Contributions

Conceptualization, Methodology, Investigation, J.X. and J.L.; Resources, Visualization, Z.T.; Validation, Writing—original draft, Writing—review and editing, Y.Z. All authors have read and agreed to the published version of the manuscript.

Funding

This work was sponsored in part by the National Natural Science Foundation of China (grant No. 12172312), Sichuan Natural Science Foundation (grant No. 2022NSFSC1987), and the Fundamental Research Funds for the Central Universities of China (grant No. 2682021ZTPY053).

Data Availability Statement

Not applicable.

Conflicts of Interest

The authors declare no conflict of interest.

References

  1. Miracle, D. Metal matrix composites–from science to technological significance. Compos. Sci. Technol. 2005, 65, 2526–2540. [Google Scholar] [CrossRef]
  2. Geng, J.W.; Liu, G.; Wang, F.F.; Hong, T.R.; Xia, C.J.; Wang, M.L.; Chen, D.; Ma, N.H.; Wang, H.W. Microstructural and mechanical anisotropy of extruded in-situ TiB2/2024 composite plate. Mater. Sci. Eng. A 2017, 687, 131–140. [Google Scholar] [CrossRef]
  3. Chen, B.; Shen, J.; Ye, X.; Imai, H.; Umeda, J.; Takahashi, M.; Kondoh, K. Solid-state interfacial reaction and load transfer efficiency in carbon nanotubes (CNTs)-reinforced aluminum matrix composites. Carbon 2017, 114, 198–208. [Google Scholar] [CrossRef]
  4. Zhang, L.; Wang, Z.; Li, Q.G.; Wu, J.Y.; Shi, G.P.; Qi, F.F.; Zhou, X. Microtopography and mechanical properties of vacuum hot pressing Al/B4C composites. Ceram. Int. 2018, 44, 3048–3055. [Google Scholar] [CrossRef]
  5. Cheng, J.C.; Chai, H.W.; Fan, G.L.; Li, Z.Q.; Xie, H.L.; Tan, Z.Q.; Bie, B.X.; Huang, J.Y.; Luo, S.N. Anisotropic spall behavior of CNT/2024Al composites under plate impact. Carbon 2020, 170, 589–599. [Google Scholar] [CrossRef]
  6. Xie, K.; Zhang, G.P.; Huang, H.; Zhang, J.J.; Liu, Z.X.; Cai, B. Investigation of the main strengthening mechanism of carbon nanotube reinforced aluminum composites. Mater. Sci. Eng. A 2021, 804, 140780. [Google Scholar] [CrossRef]
  7. Liu, Z.; Xiao, B.; Wang, W.; Ma, Z. Singly dispersed carbon nanotube/aluminum composites fabricated by powder metallurgy combined with friction stir processing. Carbon 2012, 50, 1843–1852. [Google Scholar] [CrossRef]
  8. Choi, H.; Shin, J.; Min, B.; Park, J.; Bae, D. Reinforcing effects of carbon nanotubes in structural aluminum matrix nanocomposites. J. Mater. Res. 2009, 24, 2610–2616. [Google Scholar] [CrossRef]
  9. Fu, X.W.; Tan, Z.Q.; Ma, Z.Q.; Li, Z.; Fan, G.L.; Xiong, D.B.; Li, Z.Q. Powder assembly & alloying to CNT/Al–Cu–Mg composites with trimodal grain structure and strength-ductility synergy. Compos. Part B Eng. 2021, 225, 109271. [Google Scholar]
  10. Shin, S.E.; Bae, D.H. Strengthening behavior of chopped multi-walled carbon nanotube reinforced aluminum matrix composites. Mater. Char. 2013, 83, 170–177. [Google Scholar] [CrossRef]
  11. Mokdad, F.; Chen, D.L.; Liu, Z.Y.; Xiao, B.L.; Ni, D.R.; Ma, Z.Y. Deformation and strengthening mechanisms of a carbon nanotube reinforced aluminum composite. Carbon 2016, 104, 64–77. [Google Scholar] [CrossRef]
  12. Wang, M.J.; Shen, J.H.; Chen, B.; Wang, Y.F.; Umeda, J.; Kondoh, K.; Li, Y.L. Compressive behavior of CNT-reinforced aluminum matrix composites under various strain rates and temperatures. Ceram. Int. 2022, 48, 10299–10310. [Google Scholar] [CrossRef]
  13. Pérez-Bustamante, R.; Pérez-Bustamante, F.; Estrada-Guel, I.; Santillán-Rodríguez, C.R.; Matutes-Aquino, J.A.; Herrera-Ramírez, J.M.; Miki-Yoshida, M.; Martínez-Sánchez, R. Characterization of Al2024-CNTs composites produced by mechanical alloying. Powder Tech. 2011, 212, 390–396. [Google Scholar] [CrossRef]
  14. Ma, Y.; Zhou, X.; Thompson, G.E.; Hashimoto, T.; Thomson, P.; Fowles, M. Distribution of intermetallics in an AA 2099-T8 aluminium alloy extrusion. Mater. Chem. Phys. 2011, 126, 46–53. [Google Scholar] [CrossRef]
  15. Liu, Z.Y.; Xiao, B.L.; Wang, W.G.; Ma, Z.Y. Effect of carbon nanotube orientation on mechanical properties and thermal expansion coefficient of carbon nanotube-reinforced aluminum matrix composites. Acta Metall. Sin. 2014, 27, 901–908. [Google Scholar] [CrossRef]
  16. Engler, O.; Aegerter, J. Texture and anisotropy in the Al–Mg alloy AA 5005–Part II: Correlation of texture and anisotropic properties. Mater. Sci. Eng. A 2014, 618, 663–671. [Google Scholar] [CrossRef]
  17. Tajally, M.; Emadoddin, E. Mechanical and anisotropic behaviors of 7075 aluminum alloy sheets. Mater. Des. 2011, 32, 1594–1599. [Google Scholar] [CrossRef]
  18. Wang, M.; Li, Y.; Chen, B.; Shi, D.; Umeda, J.; Kondoh, K.; Shen, J. The rate-dependent mechanical behavior of CNT-reinforced aluminum matrix composites under tensile loading. Mater. Sci. Eng. A 2021, 808, 140893. [Google Scholar] [CrossRef]
  19. Jiang, T.Z.; Xue, P.; Butt, H.S.U. Pulse shaper design for dynamic testing of viscoelastic materials using polymeric SHPB. Int. J. Impact Eng. 2015, 79, 45–52. [Google Scholar] [CrossRef]
  20. Kolsky, H. Stress Waves in Solids; Dover Publications: Mineola, NY, USA, 1963; Volume 1098. [Google Scholar]
  21. Yang, J.; Li, S.K.; Luo, Y.M.; Yan, L.L.; Wang, F.C. Compressive properties and fracture behavior of ceramic fiber-reinforced carbon aerogel under quasi-static and dynamic loading. Carbon 2011, 49, 1542–1549. [Google Scholar] [CrossRef]
  22. Wu, S.Y.; Bie, B.X.; Fan, D.; Sun, T.; Fezzaa, K.; Feng, Z.D.; Huang, J.Y.; Luo, S.N. Dynamic shear localization of a titanium alloy under high-rate tension characterized by x-ray digital image correlation. Mater. Charact. 2018, 137, 58–66. [Google Scholar] [CrossRef]
  23. Lecompte, D.; Smits, A.; Bossuyt, S.; Sol, H.; Vantomme, J.; Hemelrijck, D.V.; Habraken, A.M. Quality assessment of speckle patterns for digital image correlation. Opt. Laser. Eng. 2006, 44, 1132–1145. [Google Scholar] [CrossRef] [Green Version]
  24. Guden, M.; Hall, I.W. Dynamic properties of metal matrix composites: A comparative study. Mater. Sci. Eng. A 1998, 242, 141–152. [Google Scholar] [CrossRef] [Green Version]
  25. Xu, R.; Tan, Z.Q.; Fan, G.L.; Ji, G.; Xiong, D.B.; Guo, Q.; Su, Y.S.; Li, Z.Q.; Zhang, D. High-strength CNT/Al-Zn-Mg-Cu composites with improved ductility achieved by flake powder metallurgy via elemental alloying. Compos. Part A Appl. 2018, 111, 1–11. [Google Scholar] [CrossRef]
  26. Gurusideswar, S.; Velmurugan, R.; Gupta, N.K. Study of rate dependent behavior of glass/epoxy composites with nanofillers using non-contact strain measurement. Int. J. Impact Eng. 2017, 110, 324–337. [Google Scholar] [CrossRef]
  27. Ling, Z.; Luo, L.; Dodd, B. Experimental study on the formation of shear bands and effect of microstructure in Al-2124/SiCp composites under dynamic compression. J. Phys. IV 1994, 4, C8-453–C8-458. [Google Scholar]
  28. Tan, Z.H.; Pang, B.J.; Qin, D.T.; Shi, J.Y.; Gai, B.Z. The compressive properties of 2024Al matrix composites reinforced with high content SiC particles at various strain rates. Mater. Sci. Eng. A 2008, 489, 302–309. [Google Scholar] [CrossRef]
  29. Ye, S.J.; Bie, B.X.; Zhang, Z.M.; Zhao, X.J.; Sun, T.; Fezzaa, K.; Huang, J.Y.; Yao, X.H.; Luo, S.N. Rate-dependent strength and deformation heterogeneity of B4C-reinforced Al composite: Time-resolved imaging with synchrotron X-rays. Ceram. Int. 2021, 47, 16141–16151. [Google Scholar] [CrossRef]
  30. Duan, B.; Zhou, Y.; Wang, D.Z.; Zhao, Y.R. Effect of CNTs content on the microstructures and properties of CNTs/Cu composite by microwave sintering. J. Alloys Compd. 2019, 771, 498–504. [Google Scholar] [CrossRef]
  31. Lu, L.; Fan, D.; Bie, B.X.; Ran, X.X.; Qi, M.L.; Parab, N.; Sun, J.Z.; Liao, H.J.; Hudspeth, M.C.; Claus, B.; et al. Note: Dynamic strain field mapping with synchrotron X-ray digital image correlation. Rev. Sci. Instrum 2014, 85, 076101. [Google Scholar] [CrossRef] [Green Version]
  32. Bie, B.X.; Huang, J.Y.; Su, B.; Lu, L.; Fan, D.; Sun, T.; Fezzaa, K.; Qi, M.L.; Luo, S.N. Dynamic tensile deformation and damage of B4C-reinforced Al composites: Time-resolved imaging with synchrotron x-rays. Mater. Sci. Eng. A 2016, 664, 86–93. [Google Scholar] [CrossRef] [Green Version]
  33. Huang, J.Y.; Lu, L.; Fan, D.; Sun, T.; Fezzaa, K.; Xu, S.L.; Zhu, M.H.; Luo, S.N. Heterogeneity in deformation of granular ceramics under dynamic loading. Scripta Mater. 2016, 111C, 114–118. [Google Scholar] [CrossRef]
  34. Prentice, H.J.; Proud, W.G.; Walley, S.M.; Field, J.E. The use of digital speckle radiography to study the ballistic deformation of a polymer bonded sugar (an explosive simulant). Int. J. Impact Eng. 2010, 37, 1113–1120. [Google Scholar] [CrossRef] [Green Version]
  35. Currey, J.D. Mechanical properties of mother of pearl in tension. Proc. R. Soc. Lond. B 1977, 196, 443–463. [Google Scholar]
  36. Sun, J.Y.; Bhushan, B. Hierarchical structure and mechanical properties of nacre: A review. RSC Adv. 2012, 2, 7617–7632. [Google Scholar] [CrossRef]
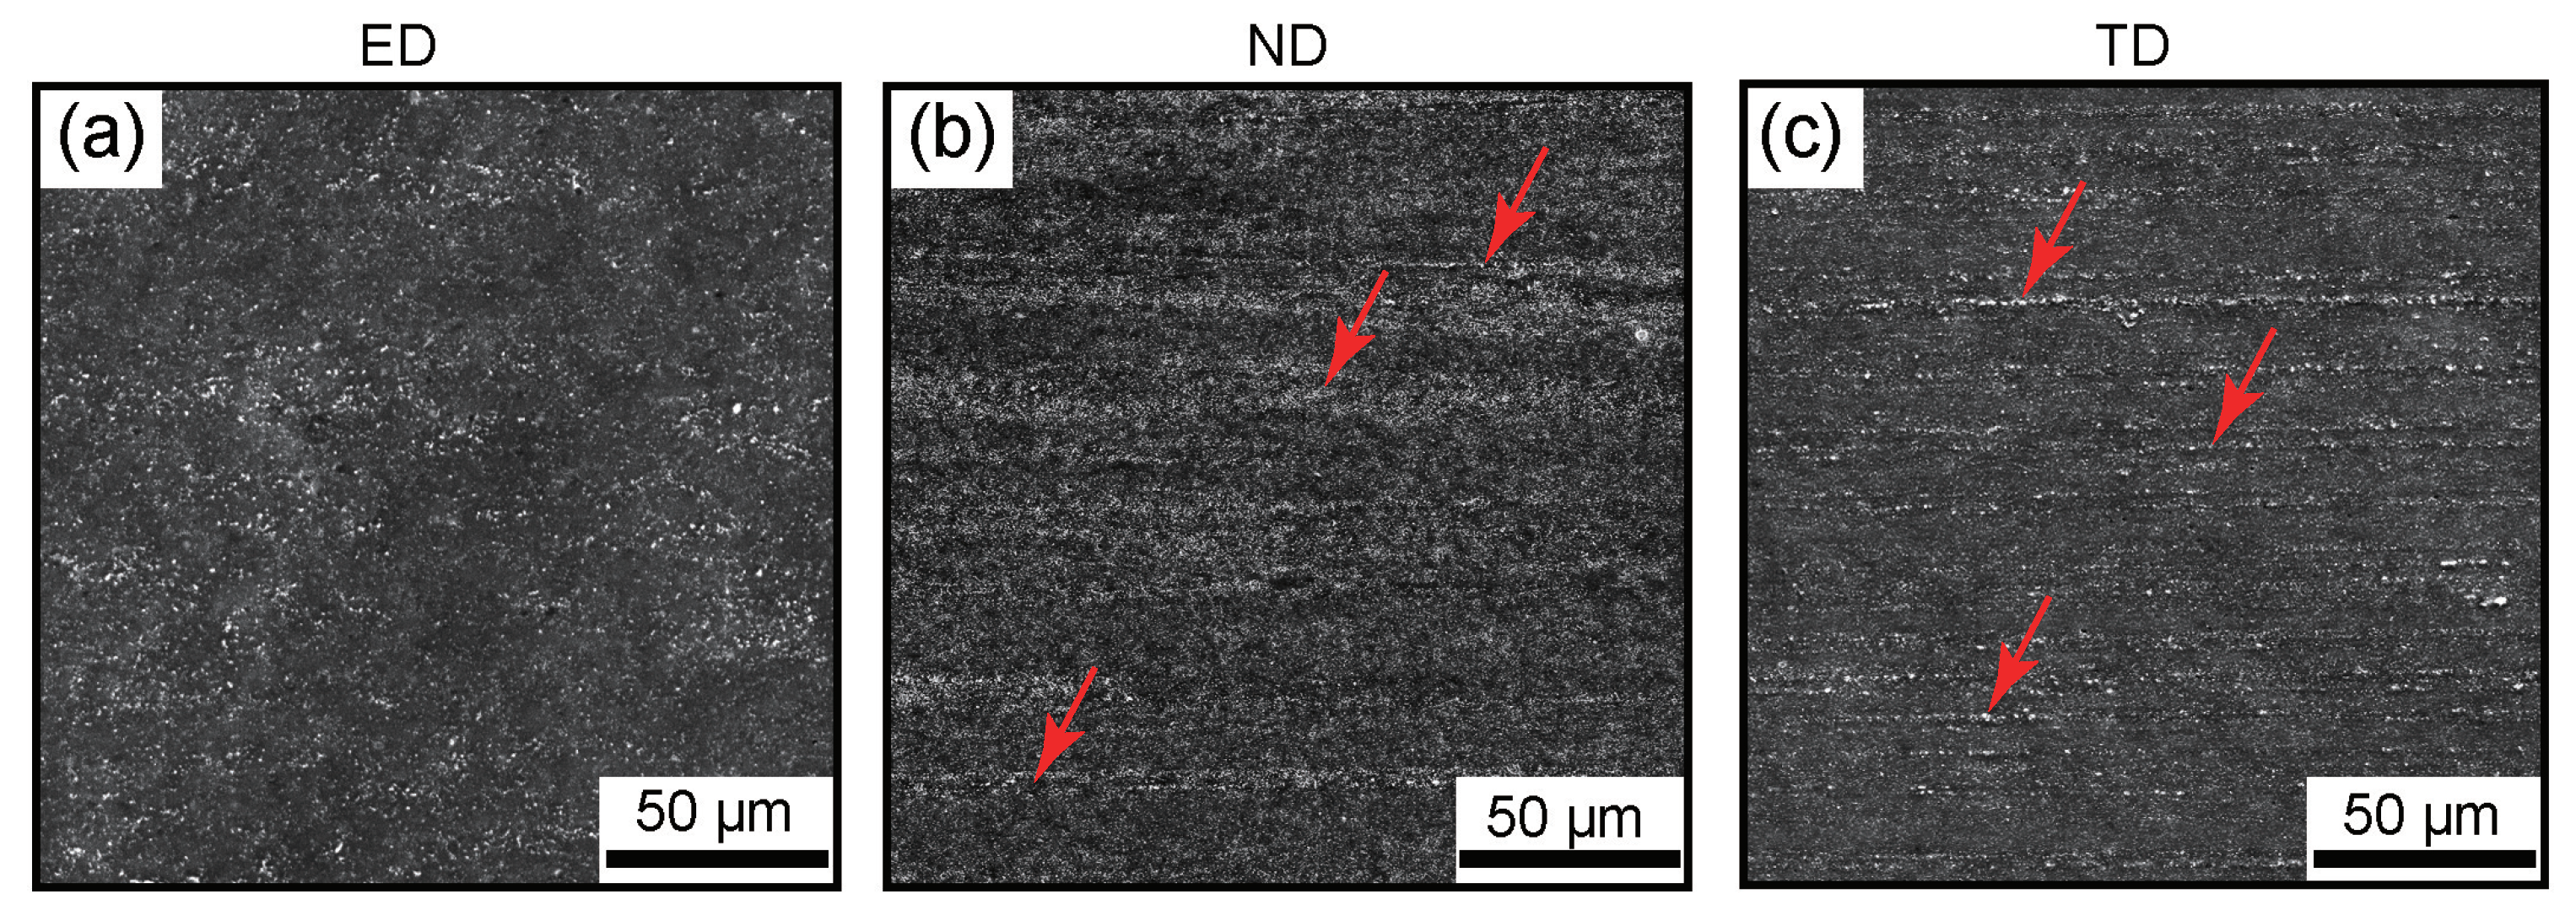
Figure 1. (ac) SEM micrographs of the CNT/2024Al composite after electrolysis along three different directions as noted. White stripes marked by red arrows are oxidate-rich areas.
Metals 13 00254 g001
Figure 2. (a) Schematic diagram of a split Hopkinson pressure bar. (b) Schematic diagram of a material test system implemented with in situ optical imaging. (c,d) Illustration of the sample harvesting scheme and the loading axis (the red arrows) in the sample coordinate system (ED-TD-ND) for compression (c) and tensile (d) tests. 1: striker bar; 2: pulse shaper; 3: incident bar; 4: compression specimen; 5: transmission bar; 6: strain gages; 7: mini-MTS; 8: tension specimen; 9: light sources; 10: camera.
Metals 13 00254 g002
Figure 3. (a) Engineering stress–strain curves and (b) true stress–strain curves under different strain rates for compression loading along the ED. (c) Engineering stress–strain curves and (d) true stress–strain curves for dynamic (strain rate 5.9 × 10 3 s 1 ) and quasi-static (10 3 s 1 ) compression loading along the ED, ND and TD. The cross symbols indicate the catastrophic failure.
Metals 13 00254 g003
Figure 4. (a) Fracture strain under dynamic (strain rate 5.9 × 10 3 s 1 ) and quasi-static compression along the ED, ND and TD. The dashed curve is guide to the eye. (b) Strain-rate dependence of yield stress and flow stress (at 5% strain) under loading along the ED.
Metals 13 00254 g004
Figure 5. SEM fractographs of the postmortem specimens for dynamic compression at 5.9 × 10 3 s 1 along (a) ED, (b) ND and (c) TD. (df) are magnified views of the regions indicated by the rectangles in (ac), respectively. The scaly features are pointed out by red arrows.
Metals 13 00254 g005
Figure 6. SEM fractographs of the postmortem specimens for quasi-static compression at 10 3 s 1 along (a) ED, (b) ND and (c) TD. (df) are magnified views of the regions indicated by the rectangles in (ac), respectively. The scaly features are pointed out by red arrows.
Metals 13 00254 g006
Figure 7. The 3D profiles of fracture surfaces for dynamic (5.9 × 10 3 s 1 ; (ac)) and quasi-static ( 10 3 s 1 ; (df)) compression along the ED (the top row), ND (the middle row) and TD (the bottom line). The color-coding indicates the height value along the z-axis.
Metals 13 00254 g007
Figure 8. (a) True stress–strain curves and (bd) snapshots of CNT/2024Al composite under quasi-static tensile loading at 10 3 s 1 along the (b) ED, (c) ND and (d) TD. The inset in (a) is The corresponding engineering stress–strain curves. Frames f1–f7 are indicated with symbols in (a). The inset in (b) is an enlarged view of a crack. The cracks are pointed out by red arrows.
Metals 13 00254 g008
Figure 9. Snapshots of 2D strain fields of E x x , E x y and E y y for quasi-static tensile loading along ED (a), ND (b) and TD (c). The low-amplitude strain localizations are marked by red arrows.
Metals 13 00254 g009
Figure 10. SEM fractographs of the postmortem specimens for quasi-static tensile loading along the (a) ED, (b) ND and (c) TD. (df) are magnified views of the regions indicated by the rectangles in (ac), respectively.
Metals 13 00254 g010
Table 1. Experimental parameters for CNT/2024Al composite under dynamic and quasi-static compressive loading.
Shot #Loading DirectionLoading MethodStrain Rate (s 1 )Yield Strength (MPa)Fracture StrainFracture Strength (MPa)
1EDMTS0.001441.7220.349716.116
2EDMTS0.01441.9170.344719.161
3EDSHPB2500453.943
4EDSHPB3500460.910
5EDSHPB4000471.581
6EDSHPB5900486.6050.614604.560
7NDMTS0.001418.8390.279707.353
8NDSHPB5900519.8860.629579.603
9TDMTS0.001405.0940.279685.200
10TDSHPB5900527.8430.594592.755
11NDMTS-stretch0.001357.7280.049602.221
12EDMTS-stretch0.001365.7120.026537.149
13TDMTS-stretch0.001362.6270.028545.542
Disclaimer/Publisher’s Note: The statements, opinions and data contained in all publications are solely those of the individual author(s) and contributor(s) and not of MDPI and/or the editor(s). MDPI and/or the editor(s) disclaim responsibility for any injury to people or property resulting from any ideas, methods, instructions or products referred to in the content.