Abstract
This study presents a comprehensive investigation of the formation, composition and behaviour of oxide layers during the high-temperature oxidation of four different steel alloys (16Mo3, 13Cr, T24 and P91) at a uniform temperature of 650 °C. The study is aimed at assessing the oxidation damage due to short-term overheating. The research combines CALPHAD (CALculation of PHAse Diagrams) calculations, thermogravimetric analysis (TGA) and advanced microscopy techniques, including scanning electron microscopy (SEM) and electron backscatter diffraction (EBSD), to elucidate the complex mechanisms controlling oxidation kinetics and oxide layer development. CALPHAD calculations were used to determine the thermodynamically stable phases for each steel type at 650 °C and different oxygen activities. The results showed different phase compositions, highlighting the importance of the chromium content in steel for the formation of oxide layers. The different oxidation kinetics and oxide layer compositions are presented and associated with the increased risk of material degradation due to overheating. These results have significant implications for industrial applications, mainly the susceptibility to oxidation of low-alloyed steels like 16Mo3 and 13 Cr and contribute to a deeper understanding of oxidation processes in steels.
Keywords:
high-temperature oxidation; thermogravimetric analysis; kinetics; CALPHAD; boiler steels; SEM; EBSD 1. Introduction
Operating temperatures of 600 °C are typical for the energy industry; they are called elevated temperatures. Steels used at elevated temperatures must retain their properties. Unlike conventional steels used at room temperature, such as spring and structural steels, boiler steels must withstand high temperatures under stress loading and oxidation. They must be resistant to hot gases and corrosion, have sufficient strength at high temperatures and creep deformation and be easily weldable [1,2,3,4].
Even unheated areas in heating and reheat tubes of utility steam generators are exposed to harsh oxidation conditions. The inner surfaces are exposed to high-temperature steam, while the outer surfaces are exposed to high-temperature air. The higher the steam temperature, the better the efficiency of the plant. The steel components are designed to operate for 100,000 h. In practice, temporary local overheating can occur, which deteriorates the material. Therefore, it is important to assess the damage of such temporary thermal loads [1,5,6]. The aim of this study is to demonstrate the oxidation resistance at 600 °C of steels commonly used for such components.
The most important alloying elements for steels used at elevated temperatures are chromium—Cr, vanadium—V, and molybdenum—Mo. Chromium is the most important element for corrosion resistance and therefore protects the component from severe oxidation at higher operating temperatures. The carbon content of the different boiler steel grades is comparable. Yield strength and tensile strength do not differ significantly, as they are most influenced by carbon. Here, the already mentioned carbide-forming elements (Cr, Mo, V) as well as tungsten—W, niobium—Nb, and titanium—Ti contribute to increasing the creep resistance [6,7,8].
16Mo3, 13CrMo4-5, T24 and P91 are steel grades commonly used in energy production. These steels are widely used in power plants and other energy-related applications due to their specific properties that make them suitable for high-temperature and high-pressure environments.
16Mo3 is a low-alloy steel used in power plant equipment such as boilers and pressure vessels. It is designed to withstand high temperatures, has good creep resistance and is easy to weld. Small amounts of molybdenum (up to 0.35 wt.%) and chromium (up to 0.3 wt.%) provide heat resistance [9].
13Cr (13CrMo4-5) is a higher-alloyed steel that contains up to 1 wt.% Cr and up to 0.6 wt.% Mo compared to 16Mo3 and has better oxidation and creep resistance [10].
T24, also known as 7CrWVMoNb9-6, is a high-temperature steel often used for the construction of superheaters and reheaters in power plants. It belongs to the group of so-called advanced ultra-supercritical (A-USC) steels, which are designed for extremely high temperatures and pressures. T24 contains chromium (up to 2.6 wt.%), molybdenum (up to 1.1 wt.%) and vanadium and niobium as important alloying elements that provide creep strength, oxidation resistance and thermal stability [11].
P91, or 9Cr-1Mo-V steel, is used extensively for the construction of boilers, steam pipes and other components in power plants. Thanks to the numerous carbide-forming elements, which include V and Nb in addition to Cr and Mo, it has a high creep resistance. In addition, P91 contains 0.03 to 0.07 wt.% N, forming MX carbon nitrides, which provide excellent creep resistance. Oxidation resistance at elevated temperatures is provided by the high Cr content (up to 9.5 wt.%), making it suitable for long-term use in demanding conditions [12,13,14].
In summary, these steels play a crucial role in energy production, each offering specific advantages for different applications.
Multiple factors can lead to the failure of boiler steels, including mechanisms like creep, thermal fatigue, corrosion and overheating.
Brief periods of overheating stand as one of the potential causes of failure in thermal power plants, by causing stress ruptures and excessive oxidation. In instances of short-term overheating, boiler tubes are subjected to temperature spikes that exceed the tubes’ intended design limits, ultimately leading to failure. Failures resulting from short-term overheating occur when the metal temperature of the tube becomes exceedingly elevated due to factors like inadequate cooling steam or water flow. These factors can be attributed to a variety of causes, including design defects, secondary combustion incidents in the boiler, changes in the combustion zone, obstructions, or restrictions to steam flow, deposits of materials and more. In addition, it is important to emphasise that short-term overheating failures occur primarily during the initial start-up phase of the boiler. Most research efforts focus on stress fractures associated with microstructural changes [15,16,17].
As a rule, the study of oxidation behaviour focuses on longer periods of time, often extending over hundreds or even thousands of hours, which simulates the typical long-term operating conditions [18]. Our study is aimed at assessing short-term overheating, which is not intended but mainly occurs accidentally, and at assessing oxidation damage.
2. Materials and Methods
The chemical compositions of the investigated steels listed in Table 1 were determined by wet chemical analysis and infrared absorption after combustion with ELTRA CS-800.

Table 1.
The chemical composition of the steels examined is given in percentages by weight.
To get a first understanding of the composition of the oxide layers, we performed CALPHAD (CALculation of PHAse Diagrams) calculations using Thermo-Calc software (Thermo-Calc 2020a, Thermo-Calc Software AB, Stockholm, Sweden) and the thermodynamic database TCOX9 [19] (Metal Oxide Solutions Database). In the diagrams, the amount of phase is shown on the Y-axis and the activity of O2 on the X-axis. The calculations aimed to determine the composition of the oxide layers that form at an oxidation temperature of 650 °C.
The samples for metallographic and thermogravimetric analysis were cylindrical with 4 mm in diameter and 3 mm in height.
The high-temperature oxidation process was studied at 650 °C in an air atmosphere for 24 h. The samples for metallographic analysis were oxidised in a Bähr DL 805A/D quench dilatometer (TA Instruments, New Castle DE, USA), which allowed rapid cooling rates. This preserved the scale structures formed at temperatures above 570 °C and prevented oxidation or decomposition of the wüstite during cooling. The samples were heated at a rate of 10 °C min−1, while the cooling rate was 30 °C s−1, to preserve the oxide layers formed. To improve the oxidation conditions, additional air (79 vol.% nitrogen, 21 vol.% oxygen, 0.9 vol.% argon and 0.1 vol.% of hydrocarbons and other inert gases) was introduced into the furnace at a flow rate of 0.3 L min−1.
For the investigation of kinetics, the samples were subjected to oxidation in the NETZSCH STA Jupiter 449C machine (NETZSCH Holding, Selb, Germany). The heating and cooling process took place at a rate of 10 °C per minute, while a continuous airflow of 30 mL per minute was fed into the furnace during both the heating/cooling phases and the isothermal section. Thermogravimetric analysis (TGA) was performed to study the kinetics by placing the samples on an alumina slip-on plate covered with a 1 mm thick platinum layer. After completion of the experiment, the TGA data were extracted, and the weight gain on the specific surface was calculated. A graph was then generated using OriginPro software (Version 2016, OriginLab Corporation, Northampton, MA, USA).
The samples were fixed in an electrically conductive epoxy resin. These fixed samples were ground and polished before being examined with a scanning electron microscope (SEM). The ZEISS CrossBeam 550 instrument (Carl Zeiss AG, Oberkochen, Germany) was used to assess the composition and thickness of the oxide layers. Energy dispersive X-ray spectroscopy (EDS) and electron backscatter diffraction (EBSD) were performed with a HikariSuper EBSD camera (EDAX, Mahwah, NJ, USA) to investigate the composition of the oxide layers formed.
3. Results and Discussion
3.1. CALPHAD Calculations
The plot of the thermodynamically stable phases in terms of oxygen activity (aO) for all investigated steel grades at 650 °C is shown in Figure 1, Figure 2, Figure 3 and Figure 4. The increase in oxygen activity is related to the penetration of oxygen into the steel matrix and the subsequent oxidation process. The highest oxygen activity corresponds to the outermost surface of the oxide scale, while the inner oxide layers are characterised by lower oxygen activities. Figure 1 illustrates the results for the steel 16Mo3 at 650 °C. Within the range of oxygen activity (aO) up to about 10−13, the stable oxide (Fe, Cr)2O3 (95.9 wt.%) predominates, followed by (Fe, Mn)2SiO4 (2.8 wt.%), and the remaining 1.3 wt.% is (Fe, Cr, Mn, Mo)3O4. In the range aO ≈ 10−13–10−23, (Fe, Cr, Mn, Mo)3O4 is stable and predominant (96.7 wt.%), followed by (Fe, Mn)2SiO4 (3.3 wt.%), and in the range aO ≈ 10−22–10−23, the (Fe, Mn, Ni)O content increases to 90.7 wt.%, with the remaining components being (Fe, Cr, Mn, Mo)3O4 and (Fe, Mn)2SiO4 (although their content varies with aO due to changes in wüstite content). Also noteworthy is the occurrence of internal oxidation at 650 °C, with (Fe, Cr, Mn, Mo)3O4 and (Fe, Mn)2SiO4 remaining stable below the steel surface. Internal oxidation is assessed by examining the content of the α-ferrite phase, which is 97.5 wt.% at equilibrium at a temperature of 650 °C. Therefore, we can determine whether internal oxidation takes place or not. If the α-ferrite content increases (black line), it should immediately increase to 97.5 wt.%; if not, internal oxidation takes place, as shown in Figure 1. Thus, we can determine the occurrence of internal oxidation. When the α-ferrite content increases (indicated by the black line), it should immediately reach 97.5 wt.%. If this threshold is not reached, it indicates that internal oxidation is taking place, as shown in Figure 1.
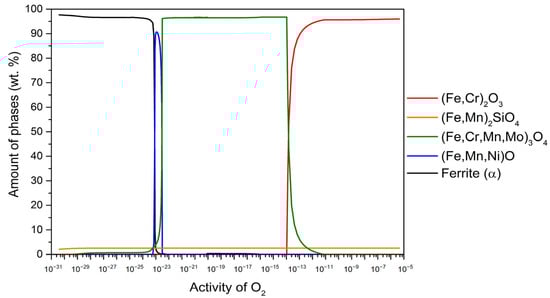
Figure 1.
The amount of thermodynamically stable phases formed during high-temperature oxidation as a function of oxygen activity for 16Mo3 steel at 650 °C.
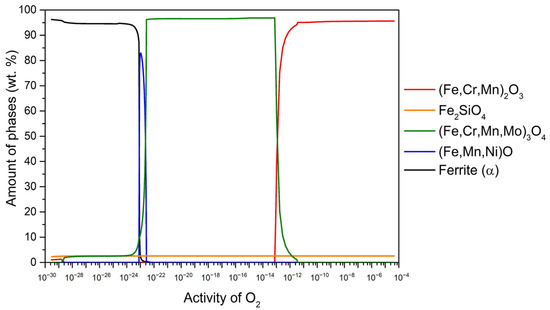
Figure 2.
The amount of thermodynamically stable phases formed during high-temperature oxidation as a function of oxygen activity for 13Cr steel at 650 °C.
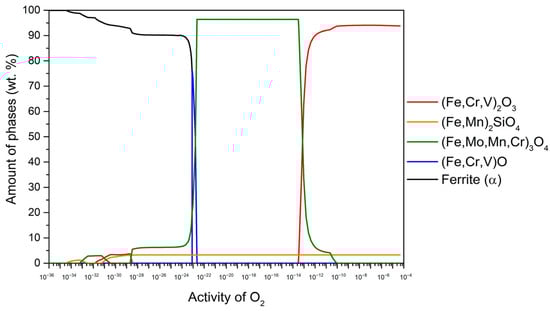
Figure 3.
The amount of thermodynamically stable phases formed during high-temperature oxidation as a function of oxygen activity for T24 steel at 650 °C.
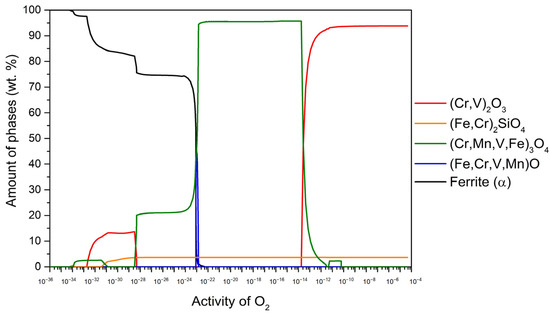
Figure 4.
The amount of thermodynamically stable phases formed during high-temperature oxidation as a function of oxygen activity for P91 steel at 650 °C.
Figure 2 shows the results for 13Cr steel at 650 °C. In the range of oxygen activity (aO) up to about 10−13, the stable oxide (Fe, Cr, Mn)2O3 (95.6 wt.%) predominates, followed by Fe2SiO4 (4.4 wt.%). In the aO range of about 10−13–10−22, (Fe, Cr, Mn, Mo)3O4 becomes stable and predominant (96.7 wt.%), followed by Fe2SiO4 (3.3 wt.%). In the aO range of about 10−22–10−23, the (Fe, Mn, Ni)O content increases up to 83 wt.% while the remainder consists of (Fe, Cr, Mn, Mo)3O4 and Fe2SiO4. It is important to note that the content of these two components changes with the aO content in line with the variations in wüstite content. Furthermore, the results indicate the presence of internal oxidation at 650 °C, where (Fe, Cr, Mn, Mo)3O4 and Fe2SiO4 remain stable under the steel surface. The determination of internal oxidation is based on the content of the α-ferrite phase, which is calculated to be 97 wt.% in equilibrium at 650 °C. Any deviation from this value indicates the occurrence of internal oxidation. If the α-ferrite content increases (black line), it should immediately increase to 97 wt.%. Thus, we can determine the occurrence of internal oxidation. When the α-ferrite content increases (indicated by the black line), it should immediately reach 97 wt.%. If this threshold is not reached, it indicates that internal oxidation is taking place, as shown in Figure 2.
Figure 3 shows the results for T24 steel at 650 °C. Within the range of oxygen activity (aO) up to approximately 10−13, the stable oxide (Fe, Cr, V)2O3 (94.3 wt.%) predominates, followed by (Fe, Mn)2SiO4 (5.7 wt.%). In the aO range of about 10−13–10−22, (Fe, Mo, Mn, Cr)3O4 becomes stable and predominant (96.7 wt.%), followed by (Fe, Mn)2SiO4 (3.3 wt.%). In the aO range of about 10−22–10−23, (Fe, Cr, V)O content increases up to 76.4 wt.% while the remainder consists of (Fe, Mo, Mn, Cr)3O4 and (Fe, Mn)2SiO4. It is important to note that the content of these two components changes with the aO content in line with the variations in wüstite content. Furthermore, the results indicate the presence of internal oxidation at 650 °C, where (Fe, Mo, Mn, Cr)3O4, (Fe, Mn)2SiO4 and (Fe, Cr, V)2O3 remain stable under the steel surface. The determination of internal oxidation is based on the content of the α-ferrite phase, which is calculated to be 98.5 wt.% in equilibrium at 650 °C. Any deviation from this value indicates the occurrence of internal oxidation. When the α-ferrite content increases (indicated by the black line), it should immediately reach 98.5 wt.%. If this threshold is not reached, it indicates that internal oxidation is taking place, as shown in Figure 3.
Figure 4 shows the results for the steel P91 at 650 °C. In the range of oxygen activity (aO) up to about 10−14, the stable oxide (Cr, V)2O3 (94.2 wt.%) predominates, followed by (Fe, Cr)2SiO4 (5.8 wt.%). In the aO range of about 10−14–10−22, (Cr, Mn, V, Fe)3O4 becomes stable and predominant (96.1 wt.%), followed by (Fe, Cr)2SiO4 (3.9 wt.%). In the aO range of about 10−23–10−24, (Fe, Cr, V, Mn)O content increases up to 45.8 wt.% while the remainder consists of (Cr, Mn, V, Fe)3O4 and (Fe, Cr)2SiO4. It is important to note that the content of these two components changes with the aO content in line with the variations in wüstite content. Furthermore, the results indicate the presence of internal oxidation at 650 °C, where (Cr, Mn, V, Fe)3O4, (Fe, Cr)2SiO4 and (Cr, V)2O3 remain stable under the steel surface. The determination of internal oxidation is based on the content of the α-ferrite phase, which is calculated to be 97.8 wt.% in equilibrium at 650 °C. Any deviation from this value indicates the occurrence of internal oxidation. When the α-ferrite content increases (indicated by the black line), it should immediately reach 97.8 wt.%. If this threshold is not reached, it indicates that internal oxidation is taking place, as shown in Figure 4.
Based on the CALPHAD results, we can gain some initial insight into the equilibrium composition of the oxide layers that would form on the steels studied at an oxidation temperature of 650 °C. Of course, these data refer to the equilibrium state, so they cannot be directly related to the composition of the oxide layer formed after 48 h, as equilibrium had not yet been reached. We also get information about the alloying elements in the individual oxide sublayers, which is useful for further metallographic analyses. Another very useful piece of information is the wüstite content in each equilibrium oxide layer formed on the steels studied. The results show that 16Mo3 steel has up to 90.7 wt.% wüstite in the equilibrium oxide layer formed, 13Cr steel has up to 83 wt.% wüstite in the oxide layer formed, followed by T24 steel, which has up to 76.4 wt.% wüstite, and P91 which has up to 76.4 wt.% wüstite in the oxide layer formed. Based on the wüstite content, we can assume that the oxidation kinetics are fastest for 16Mo3 (the steel with the highest wüstite content), followed by 13Cr, T24 and P91 (the steel with the lowest wüstite content), and that the oxidation kinetics are slowest for the P91 steel. This is due to the well-known fact that diffusion through wüstite is the fastest [20,21].
3.2. Thermogravimetric Analysis
Thermogravimetric analysis (TGA) served as the primary tool for monitoring the weight variations in steel samples during exposure to elevated temperatures. TGA is the preferred technique for evaluating oxidation rates as it allows for continuous or intermittent data collection [22]. To effectively model the TGA results, we used an iterative rectangular distance regression algorithm. Three mathematical functions were used to explain the TGA curves: a two-phase exponential growth function (Equation (1)), a second-degree polynomial (Equation (2)—the so-called parabolic law) and a third-degree polynomial (Equation (3)—the so-called cubic law). These functions were used to accurately describe the observed TGA results.
In all cases, t is the time in s, Δm is the change in weight in mg, A is the specific surface area of the sample in cm2, while the other coefficients depend on the temperature and the chemical composition of the steel.
In each case, t stands for the time in s, Δm for the change in weight mg and A for the specific surface area of the sample in cm2, while the other coefficients depend on both the temperature and the chemical composition of the steel.
However, since the analysis of oxidation kinetics typically revolves around the change in weight over time, a parabolic law can be succinctly formulated by using the Pilling–Bedworth equation [20,23]:
Here, W stands for the change in weight per unit area due to the oxidation of iron. kp (=) stands for the parabolic constant in g2 cm−4 s−1, while W0 corresponds to the initial weight at the beginning of the parabolic oxidation of parabolic oxidation (t = 0). It is noteworthy that in the original Pilling–Bedworth equation [20,23], W0 is set to zero. The most appropriate approach for deriving the equation to calculate the rate constant for steel oxidation under continuous heating or cooling was presented by Kofstad [24]. According to Kofstad’s interpretation, the oxidation behaviour, regardless of whether it follows a linear, parabolic or cubic law, can be expressed as follows:
In this context, W is defined as the change in weight per unit area with respect to time t. The variable n takes on constant values of 1, 2 or 3, corresponding to the linear, parabolic and cubic laws, respectively. In addition, kn represents a time-independent rate constant and is expressed as follows:
Here, B stands for the constant, T means the absolute temperature, R stands for the gas constant and Q denotes the activation energy.
The rate constants for all the samples studied were calculated after deriving Equation (5) by a simple linear regression approach. The basic equation for calculating the rate constant (kn) is expressed as follows:
In this context, Δm stands for the weight change in mg, A for the specific surface area in cm2, t for the oxidation time in s and kn for rate constant. The value n can be 1, 2 or 3, which corresponds to a linear, parabolic or cubic law. For the exponential law, the value of n is in the range 1 < n < 3. The designation of the index n is based on the type of the equation, which leads to the exponential law being associated with the index e and the cubic law with the index c.
The following graph (Figure 5) shows the TGA results of the steels examined. The results show an increase in mass over time. Since a constant airflow was introduced, the increase in mass is due to the chemical bonding of oxygen, i.e., the formation of an oxide layer/oxidation of the samples. After 4 h, the oxidation kinetics of steel 16Mo3 starts to follow a parabolic law and the TGA results can be expressed with a parabolic equation, but overall, the best fit is still the exponential equation. For steel 13Cr, the same trend is observed, but it seems to be faster as the oxidation kinetics starts to follow a parabolic law after 2 h. On the other hand, the oxidation kinetics of steel T24 follows the cubic law. The oxidation kinetics of steel P91 can be described by the cubic law, as the TGA results agree best with the cubic equation. In a study on the high-temperature oxidation behaviour of P91 steel [18], it was suggested that it follows a parabolic law (at 600 °C and 700 °C). We cannot confirm this, but on the other hand, its oxidation time was 1000 h. Furthermore, the authors suggest a more severe oxidation, with a high increase in the oxide layer. Our experimental data suggest otherwise, as we did not find any evidence of substantial P91 oxidation at 650 °C. We assume that this is the same trend as for the 16Mo3 and 13Cr steels in this study.
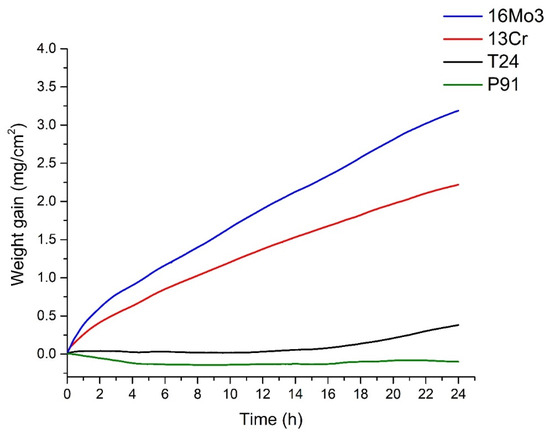
Figure 5.
TGA results of the investigated steels.
The equation types with the corresponding coefficients that best fit the TGA results are listed in Table 2.
Table 2.
Equation types with corresponding coefficients are given for the TGA results of the steels investigated.
The calculated results of the rate constants are shown in Table 3. The results of the rate constants are a clear indication that the oxidation kinetics is fastest for 13Cr steel, followed by 16Mo3, T24 and P91. This means that 13Cr steel oxidises the most and P91 the least.
Table 3.
The rate constants of the steels examined with the corresponding equation types.
Based on the TGA results, we can confirm that the CALPHAD assumption about the correlation between the amount of wüstite in the oxide layer formed and the oxidation kinetics is true. This is because 16Mo3 has the fastest oxidation kinetics, followed by 13Cr, T24 and P91. The same trend was observed in the CALPHAD results with respect to the wüstite content, with 13Cr having the highest amount of wüstite in the oxide layer, followed by 13Cr, T24 and P91.
3.3. Microscopy
The oxide layers formed were further analysed using SEM (Figure 6). It can be seen that the thickest oxide layer was formed on steel 16Mo3, followed by 13 Cr, T24 and P91. The results are in agreement with the analysis of TG (Figure 5) and consequently with the calculated rate constants (Table 3).
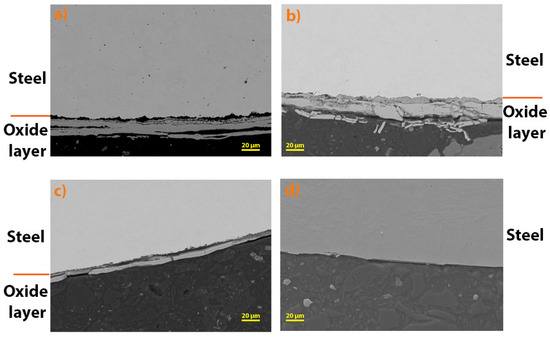
Figure 6.
Oxide layers formed after high-temperature oxidation at 650 °C for (a) 16Mo3, (b) 13Cr, (c) T24 and (d) P91 steel.
In addition, the thickness of the oxide layers formed on the steels examined was measured. The following table (Table 4) shows the average of the measured thickness. The results show that the thickest oxide layer was formed on 13Cr steel, followed by 16Mo3, T24 and P91 (with no oxide layer observed on SEM). For 13Cr steel, there are deviations from the TG analysis results, but if you look at Figure 6, it is obvious that the oxide layer on 13Cr steel is cracked and chipped, which is why these results differ. In addition, as already mentioned, no oxide layer was found on the surface of P91 steel after high-temperature oxidation, which is also in agreement with the results of the TG analysis (Figure 5).
Table 4.
Thickness of the oxide layers formed on the steels examined.
The oxide layers formed were also examined using EBSD analysis. The EBSD analysis also gives an insight into the crystal grain size, and the samples with a more substantial oxide layer (16Mo3, 13Cr and T24) show that the inner layer is usually composed of very small grains, while the outer layers are composed of larger crystal grains. The outer layer has grown for a longer time and the grains have undergone coalescence. The smaller grains in the inner layer present a difficulty for proper EBSD indexation. Figure 7 shows the oxide layer formed after high-temperature oxidation of 16Mo3 steel. It is obvious that the outer and middle oxide layers consist mainly of hematite. On the other hand, the inner oxide sublayer is mainly magnetite. IPF-Z mapping also showed that the grain size in the outer and inner oxide layers is smaller than in the middle oxide sublayer. However, EDS analysis showed no differences within the oxide layer. Fe, O and Cr are essentially homogeneously distributed throughout the oxide layer formed. In the oxide layer (mainly in the middle and inner oxide sublayers) there are some yellow-coloured grains, which are wüstite. Since the wüstite crystal grains are barely visible, we have enlarged the image of the EBSD phase analysis (Figure 8), on which the wüstite crystal grains are clearly visible. In the meantime, the matrix/steel has a ferritic (bcc—body-centred cubic) crystal structure, which is true for all samples examined (Figure 7, Figure 8, Figure 9, Figure 10, Figure 11, Figure 12 and Figure 13).
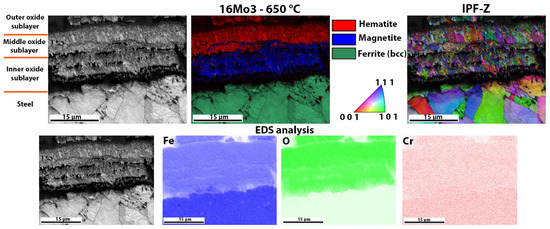
Figure 7.
Detailed analysis of the oxide layer of 16Mo3 steel after high-temperature oxidation, EBSD phase analysis, the crystal orientations and EDS analysis of the surface distribution of the elements in the oxide layer formed.
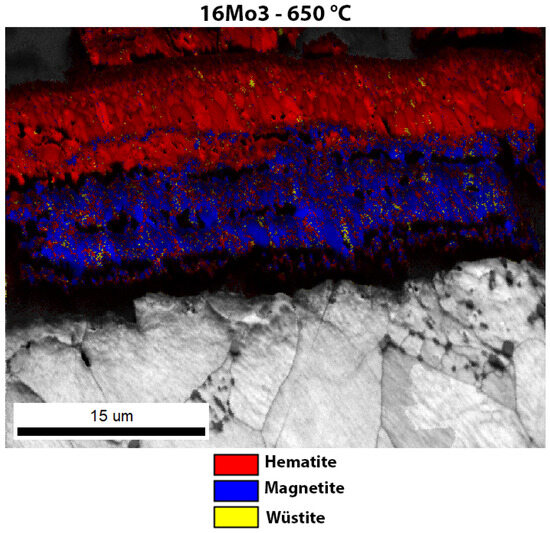
Figure 8.
Enlarged image of the EBSD phase analysis of the oxide layer of 16Mo3 steel after high-temperature oxidation.
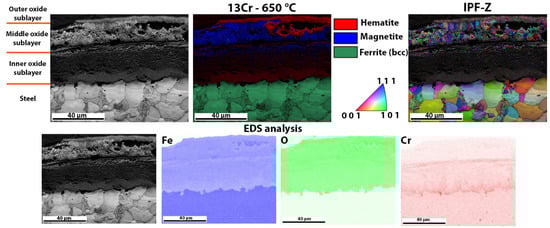
Figure 9.
Detailed analysis of the oxide layer of 13Cr steel after high-temperature oxidation, EBSD phase analysis, the crystal orientations and EDS analysis of the surface distribution of the elements in the oxide layer formed.
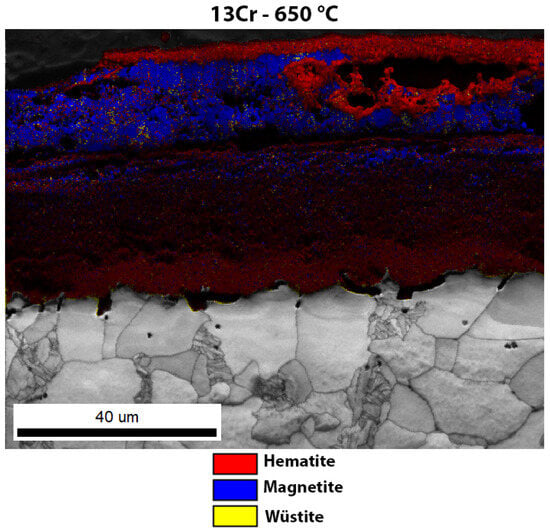
Figure 10.
Enlarged image of the EBSD phase analysis of the oxide layer of 13Cr steel after high-temperature oxidation.
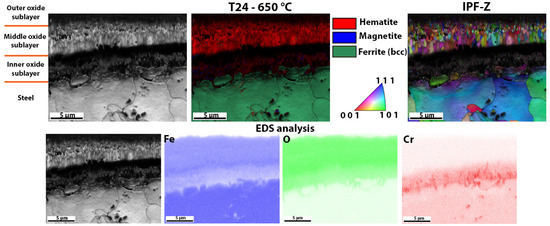
Figure 11.
Detailed analysis of the oxide layer of T24 steel after high-temperature oxidation, EBSD phase analysis, the crystal orientations and EDS analysis of the surface distribution of the elements in the oxide layer formed.
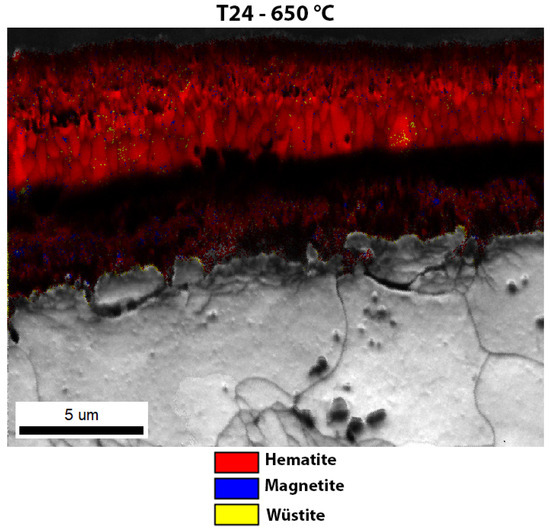
Figure 12.
Enlarged image of the EBSD phase analysis of the oxide layer of T24 steel after high-temperature oxidation.
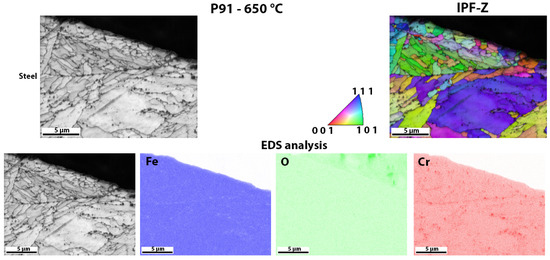
Figure 13.
Detailed analysis of the surface of P91 steel after high-temperature oxidation, the crystal orientations and EDS analysis of the surface distribution of the elements.
Figure 9 shows the oxide layer formed after high-temperature oxidation of 13Cr steel. It is obvious that the outer and inner oxide sublayer consists mainly of hematite. On the other hand, the inner oxide sublayer is mainly magnetite. IPF-Z mapping also shows that the grain size in the outer and inner oxide sublayer is smaller than in the middle oxide sublayer. The EDS analysis of the surface distribution of the elements shows that there is an increased Cr content in the inner oxide sublayer. However, as far as O and Fe are concerned, they are essentially homogeneously distributed throughout the oxide layer formed. In the oxide layer (mainly in the middle and inner oxide sublayers), there are some yellow-coloured grains which are not ferrite but wüstite, as both have the same body-centred cubic crystal structure (bcc). In this case, there are fewer wüstite crystal grains in the oxide layer than in the 16Mo3 steel. Since the wüstite crystal grains are hardly visible, we have enlarged the image of the EBSD phase analysis (Figure 10), on which the wüstite crystal grains are clearly visible. This is also consistent with the results of the TG analysis (Figure 5), as diffusion is fastest in the wüstite, which means that the oxidation rate should be higher for 16Mo3 steel than for 13Cr and the calculated rate constant (Table 3) should also be lower than that calculated for 16Mo3 steel.
The last oxide layer analysed was one that had formed on T24 steel after high-temperature oxidation (Figure 11). In this case, although an oxidation layer was found, the entire sublayer consisted mainly of hematite. Some magnetite crystal grains were found in the inner oxide sublayer and some wüstite grains were also found in the middle oxide sublayer. There are only a few wüstite grains in the oxide layer, which are hardly visible, compared to the steels 16Mo3 and 13Cr, where the amount of wüstite crystal grains was higher. Since the wüstite crystal grains are hardly visible, we have enlarged the image of the EBSD phase analysis (Figure 12), on which the few wüstite crystal grains are clearly visible. As far as the size of the grains is concerned, the same trend as in the other analysed oxide layers is shown, i.e., the outer and inner oxide sublayers consist of smaller crystal grains than the inner oxide sublayer. EDS analysis of the surface distribution of the elements shows that the Cr content is increased in the inner oxide sublayer, while the Fe content decreases in the inner oxide sublayer. O, on the other hand, is essentially homogeneously distributed over the entire oxide layer formed. The results again agree well with the analytical results from TG (Figure 5), where T24 steel shows the second lowest weight increase during high-temperature oxidation and the second lowest calculated rate constant (Table 3).
Figure 13 shows the surface of P91 steel after high-temperature oxidation. In this case, there was no oxide layer that could be analysed with EBSD. The result was to be expected as the TG analysis also showed that there was only a minimal increase in weight during oxidation. EDS analysis was also only carried out to show that there is no oxide layer that can be analysed (there is no increased amount of oxygen on the steel surface); it only shows that there are some Cr-based carbides in the matrix (areas with increased Cr). This is also consistent with the results of the TG analysis (Figure 5), as P91 steel has the lowest weight increase during high-temperature oxidation and the lowest calculated rate constant (Table 3).
The Cr content is the decisive factor in high-temperature oxidation. Even an average content of 2.6 wt.% lowers the oxidation rate considerably (as can be seen in Table 3); the Cr content also changes the oxidation curve from exponential to cubic. This means that steels with low Cr content such as 16Mo3 and 13Cr are susceptible to severe oxidation, even in the presence of short-term, transient overheating. The strong weight gain due to oxidation is already visible after one hour (see Figure 5). The thicker oxide layers in the 16Mo3 and 13Cr steels show a clear distinction between hematite and magnetite, as shown by the EBSD analysis in Figure 7, Figure 8, Figure 9 and Figure 10. The formation of FeO increases the oxidation kinetics. Therefore, the less stable samples such as 16Mo3 should have the highest amount of FeO, followed by 13 Cr and T24. This is consistent with CALPHAD calculations and EBSD analysis, as well as TGA results. Furthermore, such oxidation changes the surface of the steel and can affect structural integrity. At higher Cr contents, such as in steel T24, magnetite should form, but the crystal structure is difficult to assess with EBSD due to the smaller grain size, so only the Fe-rich hematite can be clearly distinguished. The surface is certainly affected by the short-term overheating, but it is not as severe and would not compromise the integrity of the components as severely as in the case of 16Mo3 and 13Cr. The high Cr contents in P91 prevent a much thicker oxide layer formation so that the oxide layer cannot be observed (Figure 13). This is also consistent with the TG curves (Figure 5) and the calculated constant rates (Table 3). The oxide layers of 16Mo3 and 13Cr are brittle and crumble during sample preparation, which leads to unreliable measurements of the oxide layer thickness, so we focused on the thermogravimetric measurements.
4. Conclusions
This comprehensive study shows the complex phenomena associated with the formation of oxide layers during the high-temperature oxidation of various boiler steels at a uniform temperature of 650 °C. The study is limited to oxidation behaviour, as the microstructural changes are usually considered in such studies. The results and conclusions from this investigation can be summarised as follows:
- The investigation revealed different oxidation behaviour of the steels examined, which underlines the role of the alloy composition. In particular, the steel 16Mo3 showed the highest oxidation rate, followed by 13Cr, T24 and P91. This variation underlines the importance of the alloy composition, especially the presence of chromium, for the oxidation kinetics.
- High chromium steels like P91 are highly resistant to oxidation at short-term overheating at 650 °C.
- CALPHAD calculations under different conditions of oxygen activity revealed the complexity of the development of the oxide layers.
- Thermogravimetric analysis (TGA) shows the kinetics of oxidation for each steel. The different kinetics observed for each steel confirms the influence of composition on the oxidation process. These results are particularly important for understanding high-temperature corrosion in practical applications.
- Microscopic examination using SEM and EBSD techniques provided detailed insights into the morphology and composition of the oxide layers. These analyses showed a direct correlation between oxide layer thickness and oxidation kinetics, with 16Mo3 and 13Cr forming the thickest oxide layers. In addition, the EBSD analysis identified the presence of different phases within the oxide layers (hematite and magnetite).
- From TGA results, 16Mo3 exhibited the fastest oxidation kinetics, followed by 13Cr, T24 and P91. The same trend was observed in the CALPHAD results in terms of wüstite content, with 13Cr having the highest wüstite content in the oxide layer, followed by 13Cr, T24 and P91. This means that the results regarding the wüstite content can be used as a first insight into the oxidation kinetics. Overall, this was also confirmed by microscopy, i.e., by measuring the oxide layers formed.
- The results of this study have profound implications for the industry that relies on boiler steels. Understanding the different oxidation behaviour and mechanisms of different steels can help with material selection and corrosion mitigation strategies in high-temperature environments.
Author Contributions
Conceptualization, T.B., J.B. and B.Ž.; methodology, T.B. and J.B.; validation, T.B., J.B., B.Š.B. and B.Ž.; investigation, T.B. and B.Š.B.; resources, B.Ž.; writing—original draft preparation, T.B., J.B., B.Š.B. and B.Ž.; writing—review and editing, T.B., J.B. and B.Ž.; visualization, T.B., J.B. and B.Ž. All authors have read and agreed to the published version of the manuscript.
Funding
Funding was provided by the Slovenian Research Agency ARRS program P2-0050 (C).
Data Availability Statement
Data are contained within the article.
Conflicts of Interest
The authors declare no conflict of interest.
References
- Hagarová, M.; Baranová, G.; Fujda, M.; Matvija, M.; Horňak, P.; Bednarčík, J.; Yudina, D. High Temperature Oxidation Behavior of Creep Resistant Steels in Water Vapour Containing Environments. Materials 2022, 15, 616. [Google Scholar] [CrossRef] [PubMed]
- Sturm, R.; Jenko, M.; Ule, B. A Creep-Properties Evaluation of P91 Steel Weldments Using Short-Term Testing. Mater. Tehnol. 2002, 36, 319–324. [Google Scholar]
- Bhadeshia, H.K.D.H. Design of ferritic creep-resistant steels. ISIJ Int. 2001, 41, 626–640. [Google Scholar] [CrossRef]
- Toghraee, A.; Zaeem, M.A. Oxidation induced stresses in high-temperature oxidation of steel: A multiphase field study. Metals 2020, 10, 801. [Google Scholar] [CrossRef]
- Nguyen, V.P.; Ibupoto, F.A.; Pham, L.Q.; Choi, W.; Shin, K.; Kim, B.J.; Kim, M.K.; Choi, S.T. Creep lifetime prediction of 9Cr-1Mo (grade T91) steel via small punch creep tests and hierarchical multiscale analysis. Mater. High Temp. 2020, 37, 462–477. [Google Scholar] [CrossRef]
- Dudziak, T.; Łukaszewicz, M.; Simms, N.; Nicholls, J. Analysis of High Temperature Steam Oxidation of Superheater Steels Used in Coal Fired Boilers. Oxid. Met. 2016, 85, 171–187. [Google Scholar] [CrossRef]
- Abe, F. Bainitic and martensitic creep-resistant steels. Curr. Opin. Solid State Mater. Sci. 2004, 8, 305–311. [Google Scholar] [CrossRef]
- Abe, F.; Kern, T.-U.; Visawanathan, R. Creep-Resistant Steels; Abe, F., Kern, T.-U., Visawanathan, R., Eds.; Woodhead Publishing: Sawston, UK; Maney Publishing: Leeds, UK, 2008. [Google Scholar]
- Klučiar, P.; Barenyi, I.; Majerík, J. Nanoindentation Analysis of Inconel 625 Alloy Weld Overlay on 16Mo3 Steel. Manuf. Technol. 2022, 22, 26–33. [Google Scholar] [CrossRef]
- Gwoździk, M.; Motylenko, M.; Rafaja, D. Microstructure changes responsible for the degradation of the 10CrMo9-10 and 13CrMo4-5 steels during long-term operation. Mater. Res. Express 2019, 7, 016515. [Google Scholar] [CrossRef]
- Zieliński, A.; Golański, G.; Sroka, M. Influence of long-term ageing on the microstructure and mechanical properties of T24 steel. Mater. Sci. Eng. A. 2017, 682, 664–672. [Google Scholar] [CrossRef]
- Žužek, B.; Vodopivec, F.; Podgornik, B.; Jenko, M.; Godec, M. Calculation of accelerated stationary creep rate activation energy for a steel microstructure with a uniform distribution of carbide particles. Mater. Tehnol. 2012, 46, 661–664. [Google Scholar]
- Nagode, A.; Kosec, L.; Ule, B. Uni-axial and multi-axial creep behaviour of P91-type steel under constant load. Eng. Fail. Anal. 2011, 18, 61–67. [Google Scholar] [CrossRef]
- Nagode, A.; Ule, B.; Jenko, M.; Kosec, L. A constitutive creep equation for 9Cr Mo-0.2V (P91-type) steel under constant load and constant stress. Steel Res. Int. 2007, 78, 638–642. [Google Scholar] [CrossRef]
- Lian, W.; Sun, Z.; Lyu, Y.; Duan, Z. Cause Analysis of Condensed Water Induced Bulging in High-Pressure Steam Tee Joints of a Pyrolyzer. Processes 2023, 11, 2288. [Google Scholar] [CrossRef]
- Munda, P.; Kumar, S.; Prakash, A.; Husain, M.M.; Rajnikanth, V.; Ghosh Chowdhury, S. Failure Investigation of Boiler Water Wall Tubes of a Thermal Power Station. J. Fail. Anal. Prev. 2016, 16, 9–18. [Google Scholar] [CrossRef]
- Munda, P.; Husain, M.M.; Rajinikanth, V.; Metya, A.K. Evolution of Microstructure During Short-term Overheating Failure of a Boiler Water Wall Tube Made of Carbon Steel. J. Fail. Anal. Prev. 2018, 18, 199–211. [Google Scholar] [CrossRef]
- Mathiazhagan, P.; Khanna, A.S. High temperature oxidation behavior of P91, P92 and E911 alloy steels in dry and wet atmospheres. High Temp. Mater. Processes 2011, 30, 43–50. [Google Scholar] [CrossRef]
- Thermo-Calc Software. TCOX9—TCS Metal Oxide Solutions Database; Thermo-Calc Software: Solna, Sweden, 1992; p. 7. [Google Scholar]
- Jurcic, C. On the Mechanisms of Internal Stress Formation in Multi-Phased Iron Oxide Scales. Ph.D. Thesis, Ruhr-Universität Bochum, Bochum, Germany, 2009. [Google Scholar]
- Chen, R.Y.; Yeun, W.Y.D. Review of the High-Temperature Oxidation of Iron and Carbon Steels in Air or Oxygen. Oxid. Met. 2003, 59, 433–468. [Google Scholar] [CrossRef]
- Young, D.J. High Temperature Oxidation and Corrosion of Metals; Elsevier: Amsterdam, The Netherlands; Boston, UK; London, UK, 2008; ISBN 9780080445878. [Google Scholar]
- Pilling, N.B.; Bedworth, R.E. Oxidation of metals at high temperatures. J. Inst. Met. 1923, 29, 529–539. [Google Scholar]
- Kofstad, P. Oxidation of Metals: Determination of Activation Energies. Nature 1957, 179, 1362–1363. [Google Scholar] [CrossRef]
Disclaimer/Publisher’s Note: The statements, opinions and data contained in all publications are solely those of the individual author(s) and contributor(s) and not of MDPI and/or the editor(s). MDPI and/or the editor(s) disclaim responsibility for any injury to people or property resulting from any ideas, methods, instructions or products referred to in the content. |
© 2023 by the authors. Licensee MDPI, Basel, Switzerland. This article is an open access article distributed under the terms and conditions of the Creative Commons Attribution (CC BY) license (https://creativecommons.org/licenses/by/4.0/).