Abstract
The influence of the heat treatment regime and the initial temperature on the strength characteristics of the cast heat-resistant superalloy Inconel 718 under shock loading has been studied. For samples of four types: in the as-received state, in the as-received state with subsequent heat treatment, in the as-received state after annealing and in the as-received state after annealing and subsequent heat treatment, measurements of the Hugoniot elastic limit and spall strength were carried out, based on the registration and subsequent analysis of the wave profiles in the samples under study. Shock-wave load pulses with an amplitude of ~6.5 GPa were generated using a light-gas gun. Measurement of the evolution of the shock-wave during loading—registration of the velocity profiles of the free surface of all types of samples of different thicknesses was carried out using a laser Doppler velocimeter VISAR. The measurements were carried out at a temperature of 20 °C and 650 °C. The analysis of the results revealed a noticeable effect of heat treatment and temperature on the characteristics of the elastic-plastic transition and the resistance to spalling of the Inconel 718 superalloy.
1. Introduction
As is known, [1,2,3,4,5] during the heat treatment of structural metals and alloys, which is a technological process of their heat treatment according to various modes, the microstructure of the material changes, and along with it the mechanical, physical-chemical and operational properties. In addition, the processes of heat treatment of steels and other structural materials are associated with allotropic transformations (polymorphism), as well as with changes in the chemical composition of the product material. By alternating heating and cooling cycles, it is possible to significantly increase the hardness, strength, elastic limit, wear resistance, and plasticity, and improve the machinability and other operational properties of products. The essence of heat treatment consists in heating the metal to a temperature that is slightly higher or lower than critical temperatures, holding at these temperatures and fast or slow cooling. During the cooling process, allotropic changes occur in the metal structure, as a result of which, the mechanical properties change dramatically. With rapid cooling, hardness, wear resistance, elasticity, etc., increase, with slow cooling—plasticity, toughness, and machinability increase.
In this paper, the studies of the effect of heat treatment under different modes and initial sample temperatures on the resistance to deformation and fracture of the Inconel 718 structural superalloy under shock-wave loading are carried out. Dispersion-hardening nickel–chromium heat-resistant alloy Inconel 718, is designed specifically for operation at high temperatures [6,7,8]; it is a nickel–chromium alloy, which also includes iron, niobium, molybdenum, aluminum and titanium, one of the most common alloys from the INCONEL family. It has a high tensile strength at temperatures from −250 °C to 1000 °C and was created in the middle of the last century as a sheet covering material for supersonic aircraft. Its uniqueness lies in the combination of lightness, plasticity and high strength with very good weldability and the absence of a tendency of corrosion cracking of the near-weld welded zones. Currently, this alloy is widely used in the manufacturing of parts in gas turbines, rocket engines, spacecraft, nuclear reactors, the petrochemical industry, etc.
The effect of heat treatment on the mechanical characteristics of Inconel 718 alloy under static loads has been studied in many works [9,10,11,12,13]. In [10], an analysis of the aging process in Inconel 718 and its effect on mechanical properties was made, the tensile and hardness tests were used to evaluate mechanical properties during aging and after reheating, depending on temperature and time, respectively, in the range of 650 °C–900 °C. In addition, in order to link the mechanical properties with the microstructure, the transmission microscopy observations were carried out in the selected samples. As a result, the factors affecting changes in the microstructure at various stages of hardening were found. The authors of [11] conducted a comparative study of the microstructure and mechanical properties of Inconel 718 superalloy made by selective laser melting (SLM) and casting. They showed that heat treatment significantly improves the mechanical properties of the alloy obtained by the SLM method, which far exceeds the properties of the cast samples with an average grain size of 1300 microns and is comparable to the characteristics of the cast alloy after forging.
In [12] Inconel 718 was subjected to various thermal treatments—thermal treatment with solution, standard aging treatment and standard aging plus a thermal exposure of 700 °C. The mechanical properties of the alloys were determined by the authors using tensile tests and impact with a Sharpie pendulum at 650 °C and room temperature, respectively. The highest yield strength of 988 MPa was achieved in a standard aged sample, while the maximum impact strength of 217 J/cm2 was achieved in a sample treated with a solution. The authors showed that both the yield strength and the impact strength monotonically decreased with the increasing time of thermal exposure. In addition to the measurements using electron microscopy, the microstructures of the samples were characterized, which allowed the authors to analyze the influence of the evolution of the microstructure on mechanical properties. The aim of the work [13] was to evaluate the combined effect of the strain rate and temperature on the mechanical properties of Inconel 718 samples obtained by direct energy deposition and their comparison with the original cast Inconel 718 samples. The mechanical characteristics at high strain rates up to 103 c−1 were obtained using the Split Hopkinson Tension Bar method. It was shown that with an increase in the temperature of the samples in the range up to 550 °C, there was a gradual decrease in the mechanical strength of all types of samples. Thus, the studies of the strength characteristics of Inconel 718 superalloy under static loads have unambiguously revealed their strong dependence on both the pre-heat treatments of samples and temperature. Measurements of the strength characteristics of the Inconel 718 cast superalloy under dynamic loads, when the strain rate of the material exceeded 104 s−1, were practically not carried out.
2. Materials and Methods
2.1. Material Tested
Shock-wave experiments were carried out with a high-quality heat-resistant alloy of the Inconel 718 brand, made by the traditional method of vacuum induction melting and subsequent vacuum-arc remelting with further rolling of the rod up to a diameter of 30 mm, which corresponds to the standard international specification for the manufacturing of rods ASTM B637-12. The rod was delivered in a state after heat treatment to a solid solution, which included heating and holding in a furnace at 980 °C for one hour, followed by quenching in water. The chemical composition of the superalloy corresponding to the UNS N07718 specification is given in Table 1.

Table 1.
Chemical composition of Inconel 718 alloy.
Inconel 718 alloy products must undergo a dispersion hardening procedure before using them, depending on the operating conditions. The standard procedure for the certification of mechanical properties is carried out only on alloys that have undergone mandatory heat treatment. In this work, comparative tests of workpieces in the initial state were carried out, as well as after the standard procedure of their dispersed hardening by heat treatment for the Inconel 718 alloy. The following heat treatment modes were used in preparing samples for testing under shock compression:
- -
- the alloy in the as-received state was subjected to aging at 718 °C for 8 h, followed by cooling at a rate of 50°/h to a temperature of 621 °C with further exposure for 8 h and subsequent cooling in an argon medium with a purity of at least 99.999%;
- -
- the alloy in the as-received state was preheated in a muffle furnace in air up to 1050 °C, the holding time was 1 h with air cooling to room temperature. Then it was subjected to aging at 720 °C for 8 h, followed by cooling for 2 h at a speed of 50°/h to a temperature of 620 °C with further exposure for 8 h and subsequent cooling in an oven at a speed of 50°/h to room temperature.
Dispersed hardening of the cast workpieces of Inconel 718 alloy was carried out in a high-temperature vacuum furnace “Terminionik T1-1300-250”(Podolsk, Moscow reg., Russia) of mine type in a fully automatic mode. The maximum residual pressure in the chamber was 5 × 10⁻⁵ mmHg.
The Rockwell hardness (HRD scale) of all types of samples was measured on the TN 300 installation at a load of 100 kgf, the exposure time was 3 s, the indenter used was a diamond pyramid. The density of samples of all types was determined using analytical scales ME204T (“Mettler Toledo”, Shanghai, China) by hydrostatic weighing in automatic mode. The values of the longitudinal sound speed at room temperature were measured using a device for measuring the propagation speed of the acoustic waves (MGNIVP “Acoustics”, Saint-Peterburg, Russia).
High-temperature shock-wave experiments were carried out at the sample temperature T0 = 650 °C. This temperature was chosen to be able to compare the results of these experiments with the test data of this alloy under static and quasi-static conditions, for which, according to the international standard SAE AMS 5662 and 5663, the Inconel 718 alloy is tested to determine its mechanical properties (Tensile Strength, Yield Strength, Elongation, etc.) at temperatures of 20 °C and 649 °C.
2.2. Internal Structure of the Studied Samples
Figure 1 presents micrographs of the internal structure of the four types of samples studied, the heat treatment modes of which (1, 3, 5, 7) are indicated in Table 2. Metallographic studies of the surface structure were carried out on transverse sections using an AxioObserverZ1M optical microscope in a light field and in C-DIC contrast (Circularpolarizedlight—differential interference contrast) after etching in aqua regia (HNO3 mixture and HCl in a ratio of 1:3).
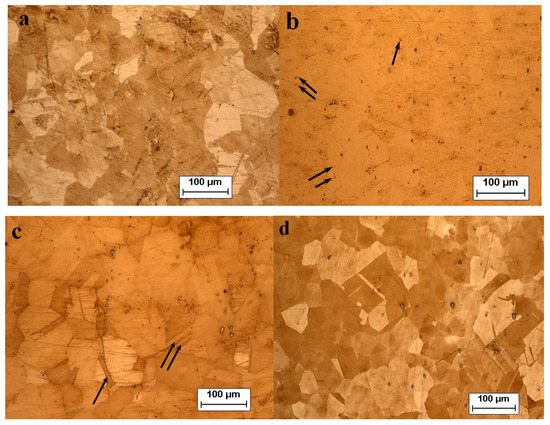
Figure 1.
Microstructure of the surface of Inconel 718 superalloy samples after heat treatment according to various modes.(a)—as-received state, (b)—mode 3 (Table 2), (c)—mode 5 (Table 2), (d)—mode 7 (Table 2). The arrows in the photos indicate the reinforcing intermetallic—γ’-phases (b) and twins (c).
Table 2.
Regimes of heat treatment, measured values of density, longitudinal sound velocity and hardness of Inconel 718 alloy, calculated values of bulk sound speed at room and 650 °C temperatures and calculated values of density and longitudinal sound speed at 650 °C.
In the as-received state (Figure 1a), grains with an average size of 60 µm are observed in the alloy structure with a sufficiently large spread—from 15 to 130 µm. In addition, reinforcing intermetallic—γ’-phases (Ni3Ti, Ni3Al, Ni3Nb) with an average size of about 2.5 µm are distributed over the sample area with a density of ~30 mm−2, and there are twins of different directions and sizes, on average (2 ÷ 8) µm × (7 ÷ 94) µm, with a density per unit area of ~25 mm−2. Here, (2 ÷ 8) µm and (7 ÷ 94) µm is the spread of measurements of the width and length of the twins over the entire measured area. After annealing and cooling in air (Mode 3, Table 2, Figure 1b), the sample has an average grain size of 70 µm with a spread from 35 to 90 µm, the size of the intermetallic γ’ phases decreased to ~0.4 µm on average, and their density increased to ~90 mm−2. In some places, regions of martensite-like needle-like structures inside the grains are observed, as well as a large number of carbide secretions along the grain boundaries and reinforcing intermetallic γ’ phases of different dispersion, mainly inside the grains. The twins present in the structure indifferent directions and with average sizes of (1 ÷ 9) µm × (40 ÷ 90) µm became longer, and their density increased to ~45 mm−2. After the heat treatment of the alloy according to mode 5 (Table 2, Figure 1c), there was a significant increase in the grain size to an average of 125 µm with a spread from 90 to 185 µm and the size of inclusions to an average of ~3.4 µm; however, the density of their distribution over the area decreased almost to a value close to their density in the original sample ~35 mm−2. Such heat treatment led to the release of martensite, and there are no martensite-like phases in these samples. The sizes of the twins in these samples are about the same as in the original ones, but their density increased to ~55 mm−2. Heat treatment of samples according to mode 7 (Table 2, Figure 1d) led to a decrease in the average grain size to ~65 µm with a spread of 35–120 µm. At the same time, the size of the intermetallic γ’ phases decreased to ~0.5 µm with an increase in their density to ~95 mm−2. After stepwise aging, a more complete separation of the particles of the γ’ phase (Ni3Ti, Ni3Al, Ni3Nb) occurs. As a result of a more complete separation of the γ’ phase, the stepwise aging provides the higher strength and heat-resistant characteristics of this alloy. The twins of different directions and sizes present in the structure of the samples after this heat treatment turned out to be the thinnest and shortest with an average size of (1 ÷ 10) µm × (15 ÷ 69) µm and with a minimum area density of ~30 mm−2.
2.3. Methods for Calculating the Characteristics of Inconel 718 Alloy at 650 °C
The bulk sound speed is related to the longitudinal sound speed through the Poisson ratio by relation . In [14], the data of the Poisson’s ratio are presented at room ν = 0.305 and 650 °C temperatures ν = 0.332. Calculations of the bulk speed of sound were performed under the assumption that the values of the Poisson’s ratio do not depend on the initial state of the material under study. The calculated value of the bulk sound speed cb according to the formula indicated above gives a value close to the value at room temperature, which is consistent with the data of [15], where it is shown that the value of the bulk module practically does not change with temperature changes for the Inconel 718 alloy. The bulk modulus B is related to the bulk sound speed by the ratio [16].
To calculate the temperature correction using the value of the longitudinal speed of sound cl, the ratio [15] was used, where T is the temperature, and G is the shear modulus. According to [15], the decrease in the shear modulus G with increasing temperature for the Inconel 718 alloy is equal to dG/dT ≈ −0.025 GPa/K, which corresponds to dcl/dT ≈ −0.33 m/s/K.
The change in density with increasing temperature was calculated by the formula , where β is the temperature coefficient of the bulk expansion. The temperature coefficient of the bulk expansion β is related to the temperature coefficient of linear expansion α by the ratio β = 3α. The value of the coefficient α at a temperature of 650 °C according to the manufacturer of the Inconel 718 alloy is 15.8 × 10⁻⁶ K−1.
Table 2 summarizes the data on heat treatment for all four types of states of samples with which the comparative shock-wave experiments were conducted, in addition to the measurements of density (ρ0), the longitudinal sound speed (cl) and the hardness (HRD) at room temperature, as well as the calculated values of bulk speed of sound (cb) and the calculated values of density and longitudinal sound speed for all types of samples at 650 °C. The procedure for calculating these characteristics is described in detail below.
2.4. Shock-Wave Experiments
In all experiments, shock load pulses were generated when Inconel 718 samples with a thickness of 4 to 0.2 mm collided with a copper impactor of various thicknesses accelerated to the velocity of 372 ± 10 m/s, which corresponds to the maximum compression stress behind the shock-wave front of ~6.5 GPa. The linear dimensions of the samples depended on their thickness and ranged from 10 × 10 mm for the thinnest (~0.2 mm) to 25 × 25 mm for the thick samples. In all cases, the geometry of the samples and impactors allowed to maintain the one-dimensionality of the flow during the entire time of registration The impactors were accelerated using a 50 mm light-gas gun (Chernogolovka, Moscow reg., Russia), the working gas was air compressed to a pressure of 100 atm. Flat impactors made of copper with a thickness of 0.095 mm to 0.96 mm and a diameter of 48 mm were mounted on a 5 mm thick polymethylmethacrylate (PMMA) substrate located at the end of a hollow aluminum projectile to exclude the deflection of the impactor during acceleration in the gun barrel. The exact dimensions are shown in Table 3 and on the wave profiles. The measurements of the impact velocity and the impactor’s tilt were carried out using two pairs of electrical contact sensors (“pins”) only in the experiments without heating the samples. The gun barrel and the space around the sample in the receiving chamber were evacuated. The experimental scheme and the photo of the experimental setup are shown in the recently published work [17], which presents the results of similar experiments with the additively manufactured Inconel 718 superalloy. In high-temperature experiments, preheating of the sample in a vacuum chamber before shock compression was carried out using a resistive heater made of fechral wire located at a distance of 2–2.5 mm from the back surface of the sample. The temperature was controlled by two chromel–alumel thermocouples with an accuracy of ±3°. The design of the receiving chamber made it possible to recover the studied samples after impact for their subsequent metallographic analysis. During loading, in all experiments, the evolution of the compression wave (velocity profile of the free surface of the samples ufs(t) was recorded using a laser Doppler interferometric velocimeter VISAR [18] (Chernogolovka, Moscow reg., Russia) with high spatial (~0.1 mm2) and temporal resolution (~1 ns).
Table 3.
The conditions of experiments with Inconel 718 superalloy samples after various heat treatments at 20 °C and 650 °C and the results of their processing.
3. Measurement Results of Wave Profiles
3.1. The Method of Processing Wave Profiles
The method used in this work to study the resistance to high-rate strain and fracture of Inconel 718 alloy samples—the analysis of complete wave profiles—is based on the fact that during the propagation of a shock-wave through the sample, its evolution (shape change) occurs, and when it reaches a free surface, it is determined also by the processes of elastic–plastic deformation and fracture in the material [19,20]. The analysis of the wave profiles obtained in the process of shock-wave loading of samples makes it possible to obtain not only a qualitative picture of the response of the material to shock compression but also to determine its strength characteristics. All the free surface velocity profiles registered during the loading of Inconel 718 samples of different types are typical for shock-wave experiments under conditions of spall fracture. Figure 2 shows the free surface velocity profiles obtained in the experiments with samples of various thicknesses after their heat treatment according to mode 3 (Table 2).
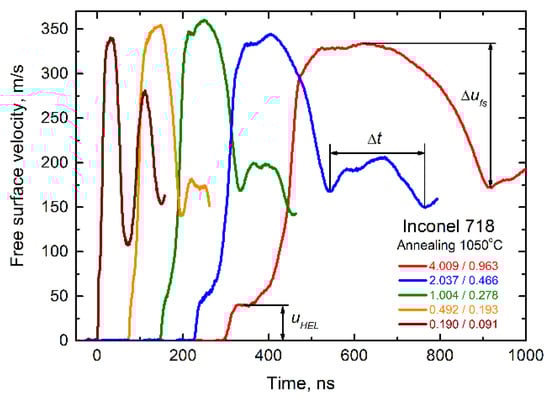
The shock front consists of an elastic precursor and a plastic compression wave, followed by an unloading wave. The maximum stress in the elastic wave front is the Hugoniot elastic limit of the material σHEL and is proportional to the amplitude of the elastic wave (elastic precursor) and is defined as σHEL = ρ0cluHEL/2 [20], where cl is the longitudinal sound speed, and uHEL is the amplitude of the elastic compression wave measured from the wave profile. The yield strength under one-dimensional deformation conditions is related to the Hugoniot elastic limit by a simple relation: , where cb is the bulk sound speed.
The amplitude of the plastic compression wave is defined as Pmax = ρ0Usufs/2, where ρ0is the sample density, Us is the shock-wave velocity, and ufs is the maximum surface velocity determined from velocity profiles. When processing experimental data, a shock adiabate was used in the form: Us = c0 + sup (km/s), where c0 takes the value of the bulk of sound speed cb, s is the slope of the shock adiabate, and up is the particle velocity equal to up = ufs/2. The coefficient s = 1.4 [15,21] and does not change in the studied temperature range.
Immediately after the plastic compression wave, a decrease in the surface velocity associated with the release of a rarefaction wave onto it is recorded. During the interaction of the incident and reflected rarefaction waves following the compression wave from the free surface, tensile stresses are generated inside the sample. When, in some areas of the sample, they exceed the fracture stresses critical for this material, numerous pores or microcracks are formed, which in the process of stretching form one large crack, leading to the internal stratification of the sample—the so-called spall fracture. The first minimum velocity on the wave profile corresponds in time to the formation of a spall crack inside the sample. Due to the relaxation of tensile stresses from a critical value to zero at the moment of the formation of a spall crack, a second compression wave is formed—a spall pulse. The critical fracture stresses (the spall strength of the material σsp) are proportional to the decrease in surface velocity Δufs (Figure 2) from its maximum to the first minimum before the front of the spall pulse (velocity “pullback”). The value of the spall strength is defined as σsp = 1/2ρ0cb(Δufs + δ), where δ is the correction for the distortion of the velocity profile due to the elastic–plastic behavior of the material [22].
Numerous measurements of the spall strength have shown that this correction is minimal when the shape of the compression pulse is close to triangular, and its value is several percent. This circumstance determines the ratio of the thickness of the sample and the impactor, close to 1/4 in all the experiments conducted. With this ratio, as a rule, the unloading wave catches up with the compression shock-wave near the free surface, and the shape of the compression pulse becomes close to triangular. In all cases, a spall pulse of various amplitudes and its reverberation in the spall plate are recorded as damped velocity oscillations. According to the time of one oscillation of the spall pulse Δt (Figure 2) in a folding plate, its thickness can be determined as hsp = clΔt/2.
3.2. Velocity Profiles of the Free Surface of Inconel 718 Alloy Samples
Figure 3 and Figure 4 show the free surface velocity profiles of the of Inconel 718 alloy samples in various states after heat treatment according to Table 2 at room temperature and a temperature of 650 °C. On all wave profiles, the output of an elastic wave to the surface of the sample in the form of an elastic precursor with an amplitude of uHEL is recorded (see Figure 2), followed by the plastic wave and the rarefaction wave, coming from the back of the impactor. During the interaction of the rarefaction waves, coming from the rear side of the impactor and reflected from the free surface, a spall fracture occurs, which is recorded on all velocity profiles of the free surface. On some free surface velocity profiles, the so-called “yield tooth” was recorded on the elastic precursor. Any connection between its appearance and the state of the material or the initial temperature was not identified. When calculating the Hugoniot elastic limit in experiments with the “yield tooth”, the minimum value of the velocity after stress relaxation was used, and not its value on the “yield tooth”.
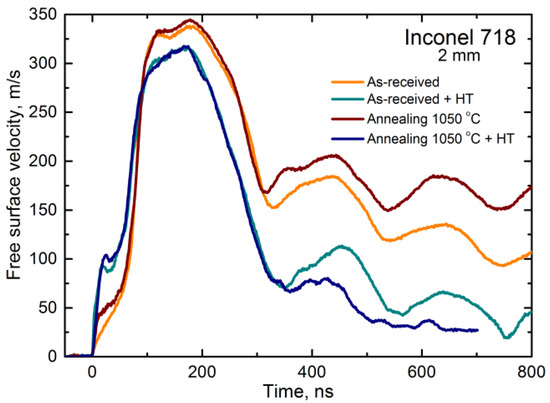
Figure 3.
Velocity histories of the superalloy Inconel 718 samples of 2 mm in thickness after different heat treatment (according to regimes 1, 3, 5, 7 of Table 2).
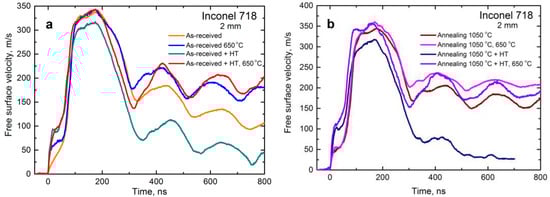
Figure 4.
The velocity histories for the samples of superalloy Inconel 718 of 2 mm in thickness after different heat treatment at 20 °C and 650 °C in as-received state (a) and after annealing (b).
Figure 3 shows the free surface velocity profiles obtained from samples with a thickness of 2 mm subjected to heat treatment according to modes 1, 3, 5, and 7 (Table 2). A direct comparison of these wave profiles shows a noticeable effect of heat treatment according to modes 5 and 7 on the strength characteristics of the samples, which is expressed in an increase in the amplitude of the elastic precursor proportional to the Hugoniot elastic limit and an increase in Δufs (velocity “pullback”) proportional to the spall strength.
Figure 4 shows the wave profiles for all four types of samples studied with a thickness of 2 mm at room temperature and elevated to 650 °C. It can be seen from the figure that an increase in the temperature of the samples in all cases significantly reduces the spall strength of the samples, while the Hugoniot elastic limit remains virtually unchanged at room and elevated temperatures for one type of sample.
Table 3 presents the experimental conditions: T is the initial temperature of the sample before impact, himp—the thickness of the impactor, hs—the thickness of the sample, and the results of processing all wave profiles, where uHEL is the amplitude of the elastic precursor, σHEL is the Hugoniot elastic limit, Δufs is “pullback” (the velocity drop from the maximum to the first minimum before the spalling), σsp—spall strength, —the strain rate in the rarefaction wave, hsp—the thickness of the spall plate.
4. Hugoniot Elastic Limit of Inconel 718 Samples at Normal and Elevated Temperatures
4.1. The Decay of Elastic Precursor
Figure 5 and Figure 6 and Table 3 show the data on the measured values of the Hugoniot elastic limit of all the studied states of the Inconel 718 alloy. It can be seen that the minimum values of σHEL at sample thicknesses of 2 and 4 mm are recorded for the material in the as-received state at room temperature. An increase in temperature to 650 °C leads to a 2.5-fold increase in the Hugoniot elastic limit. Annealing at 1050 °C for 1 h also leads to a 2.5-fold increase in the Hugoniot elastic limit in comparison to the material in the as-received state. Experiments at an initial temperature of 650 °C with annealed material did not show a change in the value of the Hugoniot elastic limit in comparison with experiments at room temperature for samples with a thickness of 2 and 4 mm. There was also no change in the Hugoniot elastic limit of the material in the as-received state and annealed at a test temperature of 650 °C.
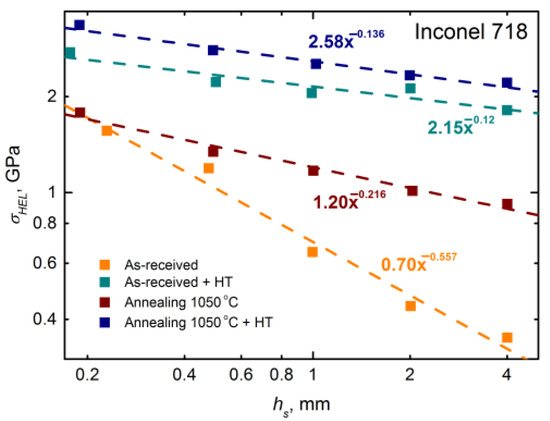
Figure 5.
The effect of heat treatment on the Hugoniot elastic limit and the decay process of the elastic precursor in Inconel 718 superalloy samples.
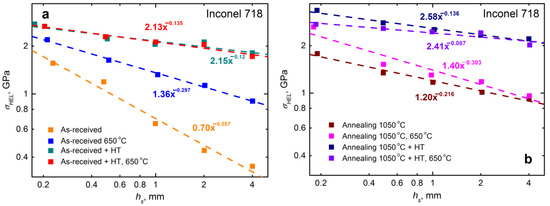
Figure 6.
The effect of temperature on the Hugoniot elastic limit and the process of decay of the elastic precursor in Inconel 718 superalloy samples ((a)—as-received state, (b)—annealing state) obtained with various heat treatment.
The heat treatment of the samples in the as-received state led to an almost five-fold increase in the Hugoniot elastic limit of samples with a thickness of 2 and 4 mm at room temperature. The experiments at an initial temperature of 650 °C with heat-treated material in the as-received state did not reveal a change in the Hugoniot elastic limit in comparison with the results of the experiments at room temperature. At an initial temperature of 650 °C, an almost two-fold increase in the value of the Hugoniot elastic limit of the heat-treated material in the as-received state was revealed when compared with the samples in the as-received state at 20 °C.
The heat treatment of the annealed material allowed to increase the Hugoniot elastic limit of the annealed material by 2.3 times for samples with a thickness of 2 and 4 mm at room temperature and by five–six times for samples in the as-received state. At an initial temperature of 650 °C, a 2x increase in the Hugoniot elastic limit is measured in the heat-treated annealed material in comparison tothe annealed one. The influence of temperature on the Hugoniot elastic limit of the thermally treated annealed material has not been revealed. The maximum values of the Hugoniot elastic limit are 2–2.4 GPa, both at room and at a temperature of 650 °C for the samples with a thickness of 2 and 4 mm among the studied types of available states of the Inconel 718 superalloy.
An abnormal increase in the Hugoniot elastic limit with an increase in temperature was previously observed in many pure metals and alloys with an initially low elastic limit [23,24,25,26], and it is explained at high strain rates by the change in the thermal activation mechanism of deformation in the phonon drug mechanism [27].
4.2. The Dependences of the Hugoniot Elastic Limit of Inconel 718 Superalloy on the Heat Treatment and on the Thickness of the Sample
The dependences of the obtained values of the Hugoniot elastic limit on the thickness of the sample at normal and elevated temperatures, shown in Figure 5 and Figure 6, are approximated by a power function for all types of samples studied:
where h0 = 1 mm, S is a coefficient taking the value σHEL at h0 = 1 mm on the obtained dependence, and α is the exponent of the power dependence. Table 4 shows the coefficients S and the exponent of the power dependence α for all the studied types of Inconel 718 alloy samples.
Table 4.
Coefficient S and power exponent α of the approximating function (1).
The samples in the as-received state at room temperature have the maximum power exponent α = 0.557 among all the studied states of the Inconel 718 alloy. In this case, a 4.5-fold increase in the Hugoniot elastic limit is recorded in the thickness range from 4 to 0.2 mm. At a temperature of 650 °C, the power indicator drops to 0.297 and an increase in the Hugoniot elastic limit by 2.4 times is recorded in a similar thickness range. A decrease in the power exponent of dependence (1) with an increase in temperature is recorded for the material in the state after annealing with subsequent heat treatment. For the material after annealing and in the as-received state with subsequent heat treatment, a slight increase in the power exponent α is recorded.
The heat treatment of samples both after annealing and in the as-received state leads to a strong weakening of the dependence of the Hugoniot elastic limit on the thickness, both at room temperature and at 650 °C. However, in these two cases, the stress on the elastic precursor remains sufficiently large throughout the studied thickness range.
5. Spall Strength of Inconel 718 Superalloy at Normal and Elevated Temperatures
5.1. Influence of the Heat Treatment, Strain Rate and Temperature
Figure 7 and Figure 8 and Table 3 show the results of calculating the spall strength of all the studied states of the Inconel 718 alloy. As can be seen from the figures, the spall strength increases with an increase in the strain rate for all the studied states, which is typical for most metals and alloys [20,28,29,30,31]. The strain rates in the rarefaction wave were calculated using the ratio , where V is the current specific volume of the substance, V0 is the specific volume of the substance at zero pressure, —the measured rate of decay of the velocity of the free surface of the test sample in the rarefaction part of the shock compression pulse. In fact, the strain rate in our case is the rate of expansion of matter. The spall strength of the alloy samples with a thickness of 2 and 4 mm in the as-received state at room temperature is 3.8–4 GPa. At the temperature of 650 °C for the same sample thicknesses, the spall strength decreases by about 20%. Annealing of samples in the as-received state at strain rates of ~105 c−1 leads to a decrease in the recorded spall strength by 10% both at room temperature and at a temperature of 650 °C. Subsequent heat treatment of the annealed samples increases the spall strength to 5 GPa at room temperature. At a temperature of 650 °C, annealed and heat-treated samples show a decrease in the spall strength at ~105 c−1 by ~25%.
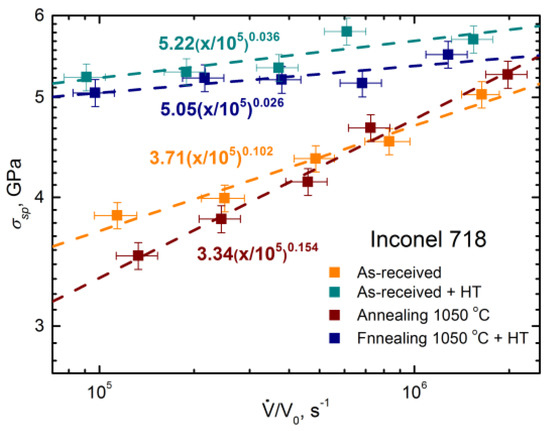
Figure 7.
The dependences of the spall strength on the strain rate for Inconel 718 superalloy samples subjected to various heat treatment.
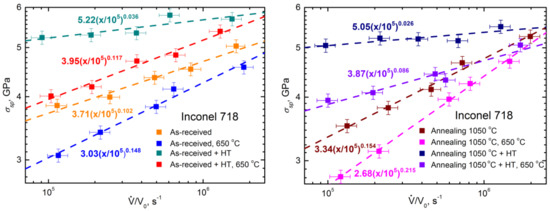
Figure 8.
The effect of temperature on the spall strength of Inconel 718 superalloy samples subjected to various heat treatments.
The maximum values of the critical fracture stresses in the entire range of strain rates, both at room and at elevated temperatures, were measured on samples in the as-received state with subsequent heat treatment. Annealing followed by heat treatment increases the value of the spall strength of the samples by ~30% at a strain rate of ~105 c−1.
5.2. Dependences of the Spall Strength on the Strain Rate in the Rarefaction Wave
The dependence of the spall strength on the strain rate in the unloading wave presented in Figure 7 and Figure 8 can be approximated by a power dependence in the form:
where = 105 s−1, is a coefficient taking the value σsp at = 105 s−1 for the obtained dependence, and β is the exponent of the power dependence. Table 5 shows the coefficients A and the exponent of the power dependence β for all the studied initial states of the Inconel 718 alloy. From Table 5 it is seen that at an initial temperature of 650 °C, the slope of the dependence of the spall strength on the strain rate increases when compared with room temperature. The maximum values of the spall strength in the studied range of strain rates are recorded for samples in the as-received state and annealed and heat-treated. The measured spall strength of these samples is about 5 GPa, and with an increase in the strain rate from 105 to 106 s−1, its growth is recorded by about ~10%.
Table 5.
Coefficient A and power exponent β of the approximating function (2).
6. Metallographic Studies of the Zone of Spall Fracture of Inconel 718 Superalloy
The measurements of wave profiles and their analysis in order to calculate the strength characteristics of the Inconel 718 superalloy under study were supplemented by metallographic analysis of the zone of the spall fracture in samples recovered after shock compression and subjected to various heat treatment modes. Experiments carried out on a light-gas gun make it possible to recover the studied samples with minimal post-wave deformation, which in turn makes it possible to study the morphology of the spall zone. Such studies can provide additional information about the development and mechanisms of spall fracture, and obtain information about the possible foci of the fracture and their subsequent transformation. Such a method for studying spall fractures has been widely used for many decades, successfully complementing instrumental measurements, and allowing us to build possible correlations between the state of the internal structure of the material and its response to shock loading [31,32].
Figure 9 shows, for example, photographs of the zone of the spall fracture of the as-received samples with a thickness of 4 mm at room temperature and elevated to 650 °C. At room temperature, the regions with grains with a martensite-like needle phase are observed in the zone of formation of a spall fracture. Inclusions of the hardening phases of carbides are larger and are located along the grain boundaries, and the intermetallic γ’ phase is smaller and is usually located inside the grain. Fracture mainly nucleates on inclusions of strengthening phases. As can be seen in the photo, there are stepped microcracks in the spall area, combining the areas of longitudinal shifts and transverse ruptures. An increase in the temperature of the samples before shock loading to 650 °C leads to the release of martensite-like phases. The spall fracture, in this case, is “loosier”—there are many pores and significantly fewer large cracks in the spall zone. The fracture nucleates mainly on the inclusions of the hardening phases; its individual foci are connected into larger spall cracks. As the measurements for this type of sample have shown, heating to 650 °C leads to the hardening of the material—a strong increase in the Hugoniot elastic limit. This effect can manifest itself in the formation of a fracture zone—under the same loading conditions for heated samples, the spall zone consists of separate unconnected fragments due to the greater resistance of the material to the deformation process.
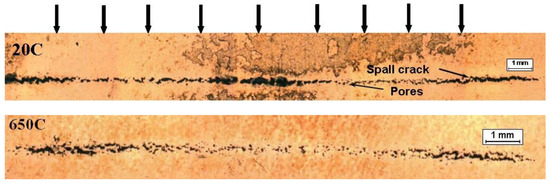
Figure 9.
Micrographs of the spall zone of Inconel 718 alloy samples in the as-received state at room and elevated temperatures up to 650 °C. Thick black arrows indicate the direction of impact.
A similar morphology of the spall fracture zone is observed in all the types of samples studied, an increase in temperature leads to the formation of a “loosier” spall zone, consisting mainly of small pore-like foci and areas consisting of unconnected spall cracks.
7. Conclusions
The experiments were carried out to study the effect of heat treatment and the initial temperature of samples of cast heat-resistant Inconel 718 superalloy in the as-received state, after annealing and heat treatment under a shock compression of ~6.5 GPa. During loading, the free surface velocity profiles of the samples were recorded from the analysis of which the Hugoniot elastic limit and critical fracture stresses during spallation were determined. The measurements were carried out at strain rates in the range of 105 c−1–106 c−1 and at sample temperatures of 20 °C and 650 °C. The analysis of the obtained results allows us to draw the following conclusions. The measurements performed have shown the significant influence of the state of the samples due to heat treatment, on their resistance to high-rate strain and spall fracture under shock loading. The spall strength of samples of all types, as expected, increases with an increase in the strain rate of the material, and a faster increase in strength is observed for the as-received and annealed samples that are not subjected to heat treatment.
The heat treatment of samples leads to an increase in the spall strength—at a strain rate of ~105 c−1, the spall strength of the heat-treated samples is higher by 30–40%, whereas at a strain rate above 106 s−1, this difference becomes not so significant. The increase in the initial temperature of the samples in all cases leads to a noticeable decrease in their spall strength. For all types of samples, the decay of the elastic precursor during its propagation deep into the samples and the strong influence of their heat treatment on the value of the Hugoniot elastic limit was revealed. The maximum decay rate and the minimum values of the Hugoniot elastic limit ~0.35 GPa are demonstrated by the as-received samples of Inconel 718 superalloy with a thickness of 4 mm. The decay character of the other three types of samples is similar. Heat treatment significantly increases the elastic limit of the alloy, and the maximum values of the Hugoniot elastic limit, equal to ~3.35 GPa, were measured on the thin samples of the annealed alloy after heat treatment. The effect of temperature on the value of the Hugoniot elastic limit is ambiguous. In the case of the as-received samples with a maximum thickness of 4 mm, there is a strong increase in the Hugoniot elastic limit by about five times, whereas, for the heat-treated initial samples, there is practically no effect of preheating the samples to 650 °C. For annealed samples, this effect is noticeably weaker and is observed only in thin samples. Metallographic studies of the spall fracture zone have not revealed a noticeable difference in its morphology for all types of samples; however, the preheating of samples leads to their “loosening”—the appearance of numerous pores and microcracks unconnected with each other.
Thus, the measurements clearly showed that preliminary heat treatment significantly increases the dynamic strength characteristics of the Inconel 718 cast alloy, the Hugoniot elastic limit and critical fracture stresses under shock loading. In turn, these results allow us to talk about the expansion of the field of use in the extreme operating conditions of the products and structures made of this alloy, for example, in the aerospace industry, when the strain rates exceed 105 s−1. The obtained data on the resistance to high-rate deformation and spall fracture of the investigated Inconel 718 alloy in a wide range of load durations and elevated temperatures, can be used in constructing the governing ratios and numerical modeling of the behavior of this material, or specific products made of it, under strong dynamic stresses.
Author Contributions
Conceptualisation, S.V.R., A.S.S. and G.V.G.; methodology, G.V.G., S.A.A. and S.V.R.; investigation, S.A.A., G.V.G., S.V.R. and S.A.A.; writing—original draft preparation, S.V.R., S.A.A., G.V.G. and S.A.A.; writing—review and editing, S.V.R., A.S.S. and G.V.G. All authors have read and agreed to the published version of the manuscript.
Funding
The work was carried out within the framework of the research and development project “The obtaining of the experimental data on the thermal conductivity and melting temperatures of high-temperature nuclear power materials and the studying the rate dependences of the stress of the plastic flow of reactor materials” under No. 17706413348200001380/226/3464-D dated 22 June 2021, and within the State Assignment No. AAAA-A19-119071190040-5 using the equipment of the Moscow Regional Explosive Center for Collective Use of the Russian Academy of Sciences. The sample preparation was carried out as part of the fulfillment of the State Assignment No. 075-00460-21-00 for conducting fundamental scientific research at JIHT RAS.
Institutional Review Board Statement
Not applicable.
Informed Consent Statement
Not applicable.
Data Availability Statement
Not applicable.
Conflicts of Interest
The authors declare no conflict of interest. The funders had no role in the design of the study; in the collection, analyses, or interpretation of data; in the writing of the manuscript; or in the decision to publish the results.
References
- Dossett, J.L.; Boyer, H.E. Practical Heat Treating, 2nd ed.; ASM International: Russell Township, OH, USA, 2006; p. 302. [Google Scholar]
- Stoicanescu, M. Heat Treatments Applied to Metallic Materials; Lap Lambert Academic Publishing GmbH KG: Saarbrücken, Germany, 2015; p. 276. ISBN 9783659799273. [Google Scholar]
- Jiang, K. Effects of Heat Treatment on Microstructure and Wear Resistance of Stainless Steels and Superalloys. Ph.D. Thesis, University of Ottawa, Ottawa, ON, Canada, 2013; p. 216. [Google Scholar]
- Hazotte, A. (Ed.) Solid State Transformation and Heat Treatment; Wiley: Weinheim, Germany, 2005; p. 192. ISBN 9783527310074. [Google Scholar]
- Singh, V. Heat Treatment of Metals; Standard Publishers Distributors: Delhi, India, 2006; p. 692. ISBN 9788180140389. [Google Scholar]
- ASM International. ASM Metals Handbook. Properties and Selection: Nonferrous Alloys and Special-Purpose Materials; ASM International: Russell Township, OH, USA, 2002; p. 2. [Google Scholar]
- Reed, R.C. The Superalloys: Fundamentals and Applications; Cambridge University Press: Cambridge, UK, 2008; ISBN 9780521070119. [Google Scholar]
- Enes, A.; Ali, G. A Review on Superalloys and IN718 Nickel-Based INCONEL Superalloy. Period. Eng. Nat. Sci. 2015, 3, 15–27. [Google Scholar] [CrossRef]
- Anbarasan, N.; Bikash, K.G.; Prakash, S.; Muthukumar, P.; Oyyaravelu, R.; Kumar, R.J.F.; Jerome, S. Effect of Heat Treatment on the Microstructure and Mechanical Properties of Inconel 718. Mater. Today Proc. 2018, 5, 7716–7724. [Google Scholar] [CrossRef]
- Maj, P.; Adamczyk, B.; Slesik, M.; Mizera, J.; Pieja, T.; Sieniawski, J.; Gancarczyk, T.; Dudek, S. The precipitation process and mechanical properties of aged Inconel 718 alloy after annealing. Arch. Metall. Mater. 2017, 62, 1695–1702. [Google Scholar] [CrossRef] [Green Version]
- Zhang, D.; Feng, Z.; Wang, C.; Wang, W.; Liu, Z.; Niu, W. Comparison of microstructures and mechanical properties of Inconel 718 alloy processed by selective laser melting and casting. Mater. Sci. Eng. A 2018, 724, 357–367. [Google Scholar] [CrossRef]
- Yu, Z.S.; Zhang, J.X.; Yuan, Y.; Zhou, R.C.; Zhang, H.J.; Wang, H.Z. Microstructural evolution and mechanical properties of Inconel 718 after thermal exposure. Mater. Sci. Eng. A 2015, 634, 55–63. [Google Scholar] [CrossRef]
- Forni, D.; Mazzucato, F.; Valente, A.; Cadoni, E. High strain-rate behaviour of as-cast and as-build Inconel 718 alloys at elevated temperatures. Mech. Mater. 2021, 159, 103859. [Google Scholar] [CrossRef]
- Fukuhara, M.; Sanpei, A. Elastic moduli and internal frictions of Inconel 718 and Ti-6Al-4V as a function of temperature. J. Mater. Sci. Lett. 1993, 12, 1122–1124. [Google Scholar] [CrossRef]
- Zaretsky, E.B.; Kanel, G.I.; Razorenov, S.V.; Baumung, K. Impact strength properties of nickel-based refractory superalloys at normal and elevated temperatures. Int. J. Impact Eng. 2005, 31, 41–54. [Google Scholar] [CrossRef]
- Hayun, S.; Ionash, E.; Kalabukhov, S.; Frage, N.; Zaretsky, E. Strength of ceramic–metal joints measured in planar impact experiments. J. Mater. Sci. 2018, 53, 8211–8220. [Google Scholar] [CrossRef]
- Savinykh, A.S.; Garkushin, G.V.; Razorenov, S.V.; Atroshenko, S.A.; Klimova-Korsmik, O.G.; Kislov, N.G. Strength Properties of the Heat-Resistant Inconel 718 Superalloy Additively Manufactured by Direct Laser Deposition Method under Shock Compression. Metals 2022, 12, 967. [Google Scholar] [CrossRef]
- Barker, L.M.; Hollenbach, R.E. Laser interferometer for measuring high velocities of any reflecting surface. J. Appl. Phys. 1972, 43, 4669–4675. [Google Scholar] [CrossRef]
- Kanel, G.I.; Zaretsky, E.B.; Razorenov, S.V.; Ashitkov, S.I.; Fortov, V.E. Unusual plasticity and strength of metals at ultra-short load durations. Physics Uspekhi 2017, 60, 490–508. [Google Scholar] [CrossRef] [Green Version]
- Kanel, G.I. Shock Waves in Solid State Physics; CRC Press (Taylor and Francis Group): Boca Raton, FL, USA, 2019; p. 214. ISBN -13: 978-0-367-22589-6. [Google Scholar]
- Zaretsky, E.B.; Kanel, G.I.; Razorenov, S.V.; Baumung, K. Anomalous high-temperature shock-induced strengthening of two superalloys. In Shock Compression of Condensed Matter—2003: Proceedings of the Conference of the American Physical Society, Topical Group on Shock compression of Condensed Matter (AIP Conference Proceedings), 1st ed.; Furnish, M.D., Gupta, Y.M., Forbers, J.M., Eds.; American Institute of Physics: College Park, MD, USA, 2004; pp. 645–648. [Google Scholar]
- Kanel, G.I. Spall fracture: Methodological aspects, mechanisms and governing factors. Int. J. Fract. 2010, 163, 173–191. [Google Scholar] [CrossRef]
- Kanel, G.I.; Razorenov, S.V.; Bogath, A.A.; Utkin, A.V.; Fortov, V.E.; Grady, D.E. Spall fracture properties of aluminum and magnesium at high temperatures. J. Appl. Phys. 1996, 79, 8310–8317. [Google Scholar] [CrossRef]
- Kanel, G.I.; Razorenov, S.V.; Baumung, K.; Singer, J. Dynamic yield and tensile strength of aluminum single crystals at temperatures up to the melting point. J. Appl. Phys. 2001, 90, 136–143. [Google Scholar] [CrossRef]
- Garkushin, G.V.; Kanel’, G.I.; Razorenov, S.V. Deformation and Breaking Strength of Aluminum AD1 for a Shock Wave Stress at Temperatures of 20 and 600 °C. Phys. Solid State 2010, 52, 2369–2375. [Google Scholar] [CrossRef]
- Kanel, G.I.; Garkushin, G.V.; Savinykh, A.S.; Razorenov, S.V.; de Resseguier, T.; Proud, W.G.; Tyutin, M.R. Shock response of magnesium single crystals at normal and elevated temperatures. J. Appl. Phys. 2014, 116, 143504. [Google Scholar] [CrossRef]
- Al’shits, V.I.; Indenbom, V.L. Dynamic dragging of dislocations. Physics-Uspekhi 1975, 18, 1–20. [Google Scholar]
- Kanel, G.I.; Rasorenov, S.V.; Garkushin, G.V.; Ashitkov, S.I.; Komarov, P.S.; Agranat, M.B. Resistance to Strain and Fracture Strength of Iron over a Wide Strain Rate Range. Phys. Solid State 2014, 56, 1569–1573. [Google Scholar] [CrossRef]
- Kanel, G.I.; Garkushin, G.V.; Savinykh, A.S.; Razorenov, S.V.; Atroshenko, S.A. High-Rate Deformation and Fracture of 15Kh2NMFA Steel under Impact Loading at Normal and Elevated Temperatures. Tech. Phys. 2020, 65, 420–427. [Google Scholar] [CrossRef]
- Garkushin, G.V.; Kanel, G.I.; Razorenov, S.V.; Savinykh, A.S. Anomaly in the Dynamic Strength of Austenitic Stainless Steel 12Cr19Ni10Ti under Shock Wave Loading. Mech. Solids 2017, 52, 407–416. [Google Scholar] [CrossRef]
- Antoun, T.; Seaman, L.; Curran, D.R.; Kanel, G.I.; Razorenov, S.V.; Utkin, A.V. Spall Fracture; Springer: Berlin/Heidelberg, Germany, 2003; p. 404. [Google Scholar]
- Meyers, M.A.; Aimone, C.T. Dynamic fracture (spalling) of metals. Prog. Mater. Sci. 1983, 28, 1–96. [Google Scholar] [CrossRef]
Publisher’s Note: MDPI stays neutral with regard to jurisdictional claims in published maps and institutional affiliations. |
© 2022 by the authors. Licensee MDPI, Basel, Switzerland. This article is an open access article distributed under the terms and conditions of the Creative Commons Attribution (CC BY) license (https://creativecommons.org/licenses/by/4.0/).