
Microstructure and Mechanical Properties of AZ31B/LY12 Joints Using Zn/Ag–Cu–Zn/Zn Multi-Interlayers via Ultrasound-Assisted Transient Liquid Phase Bonding


Abstract
:1. Introduction
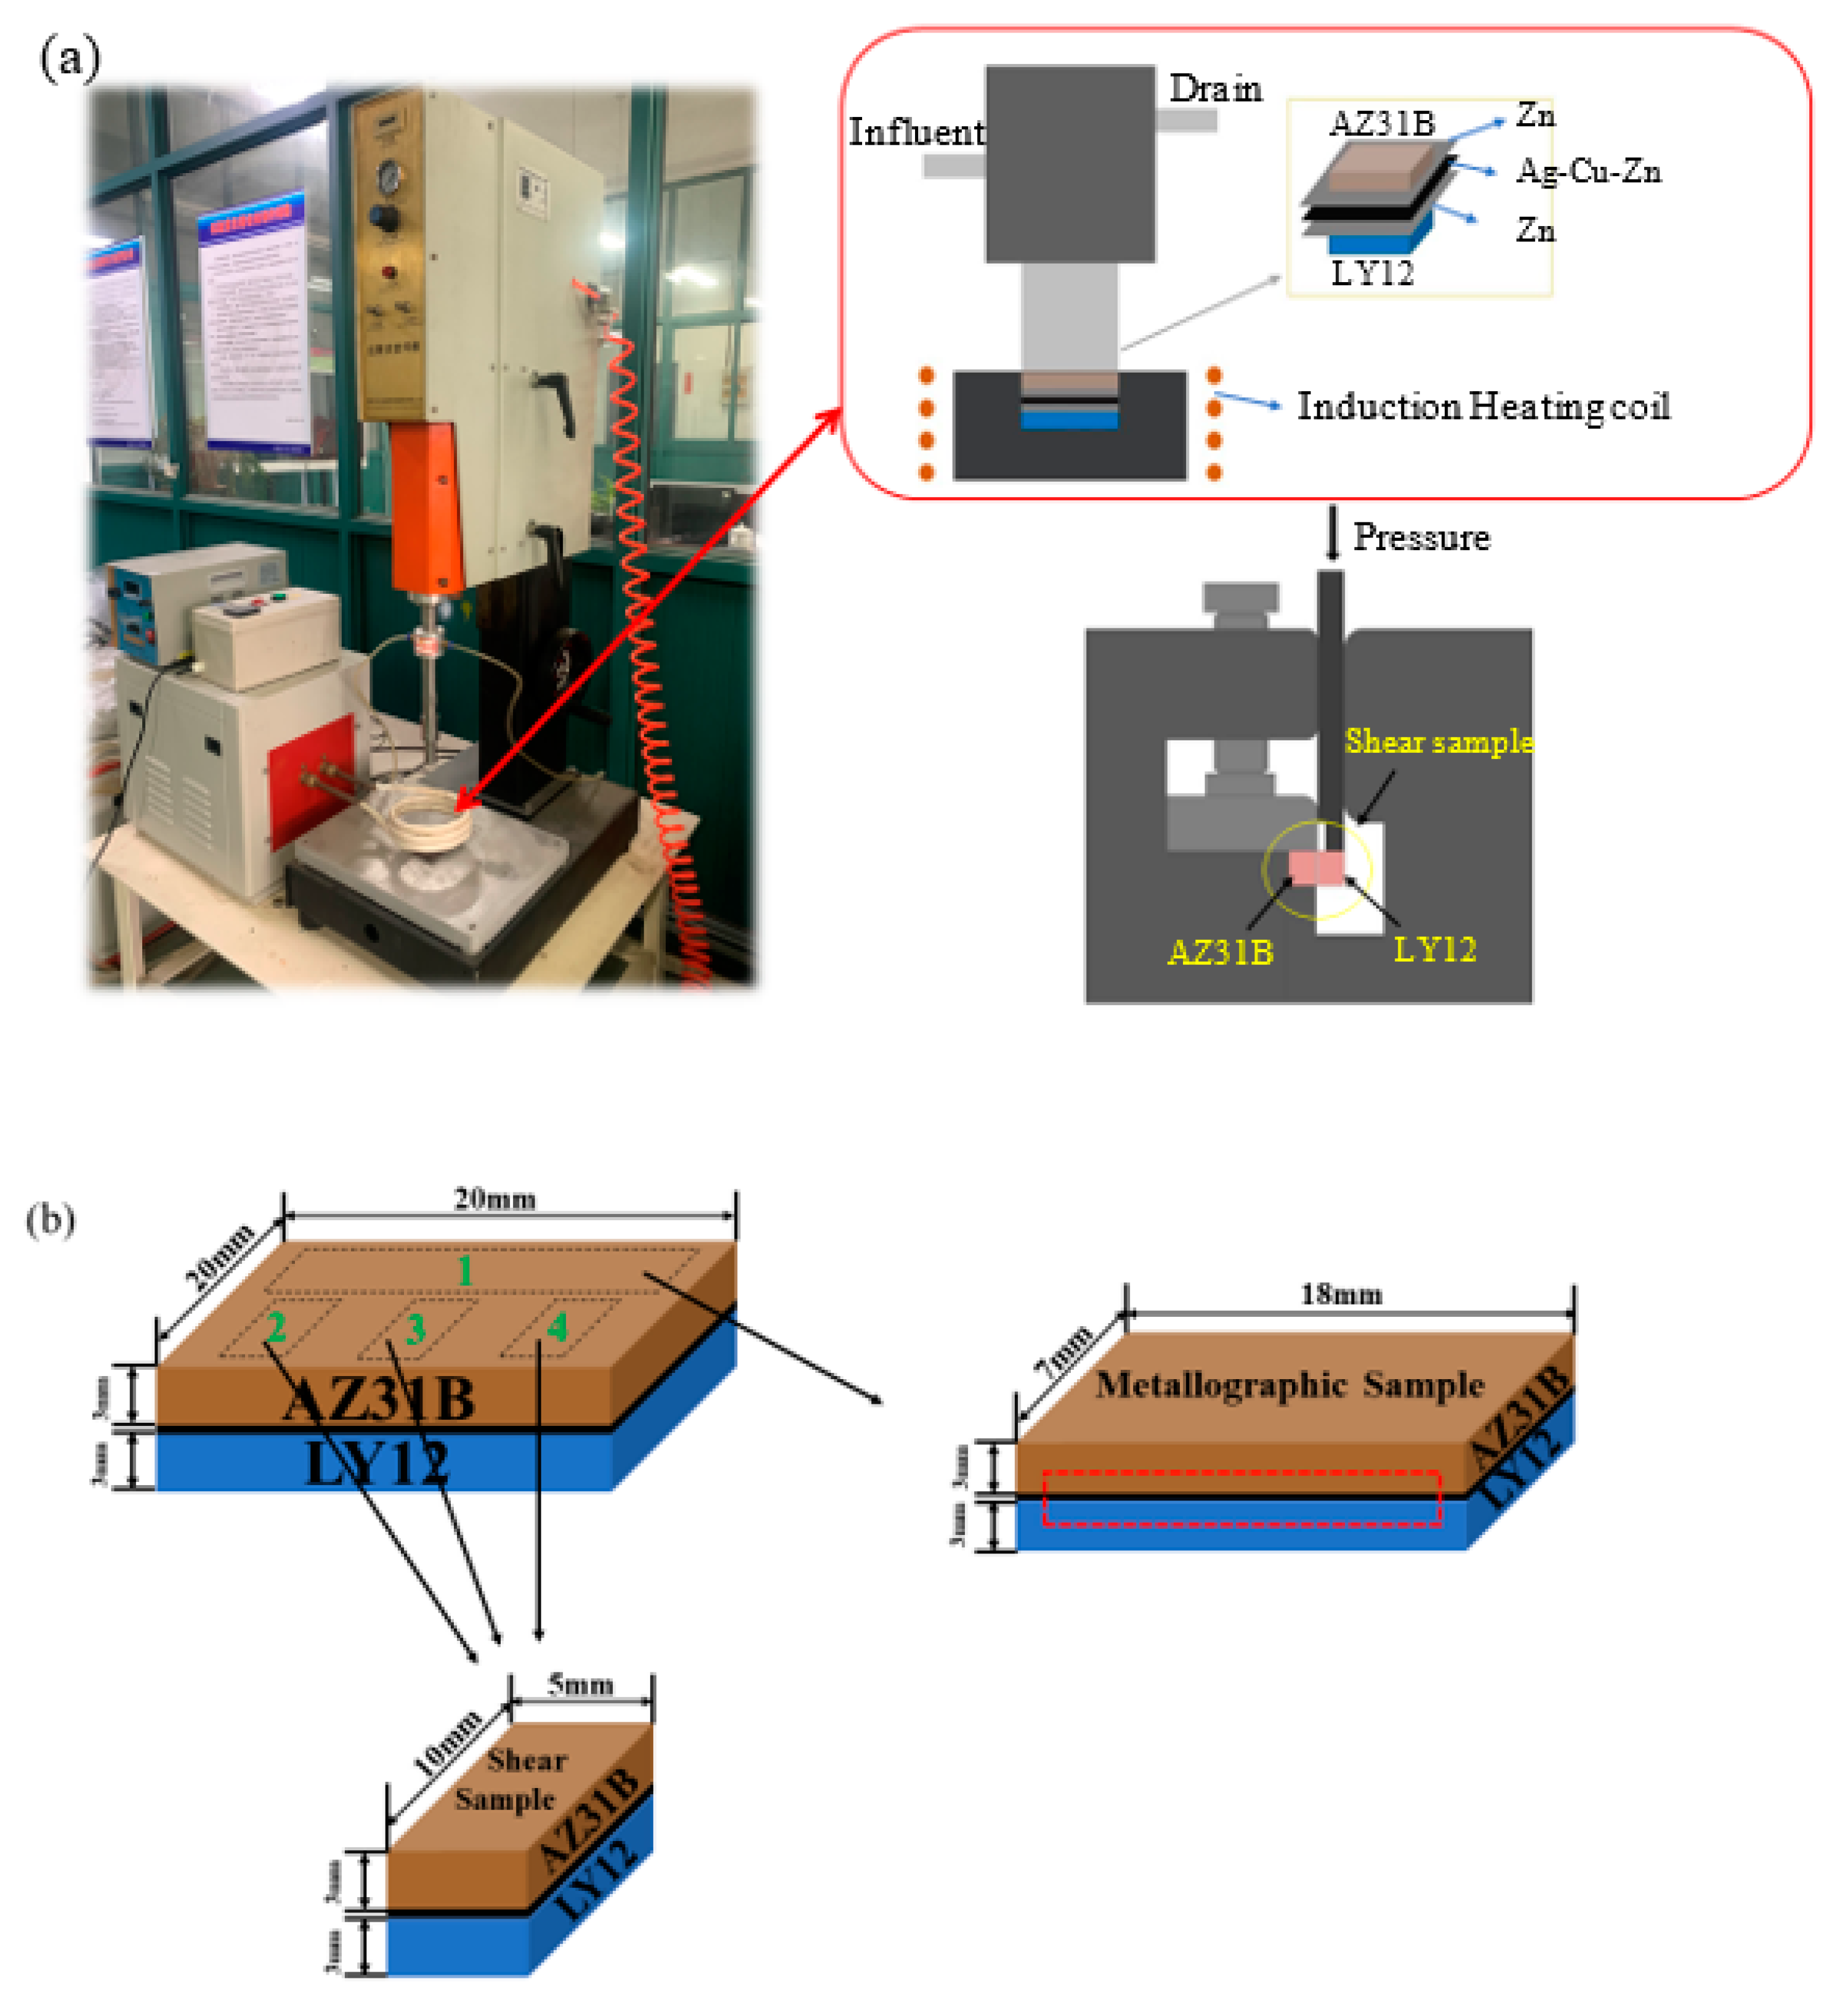
2. Experimental
3. Results and Discussion
3.1. Microstructure Evolution of the Joints at 410 °C
3.2. Microstructure Evolution of the Joints at 440 °C
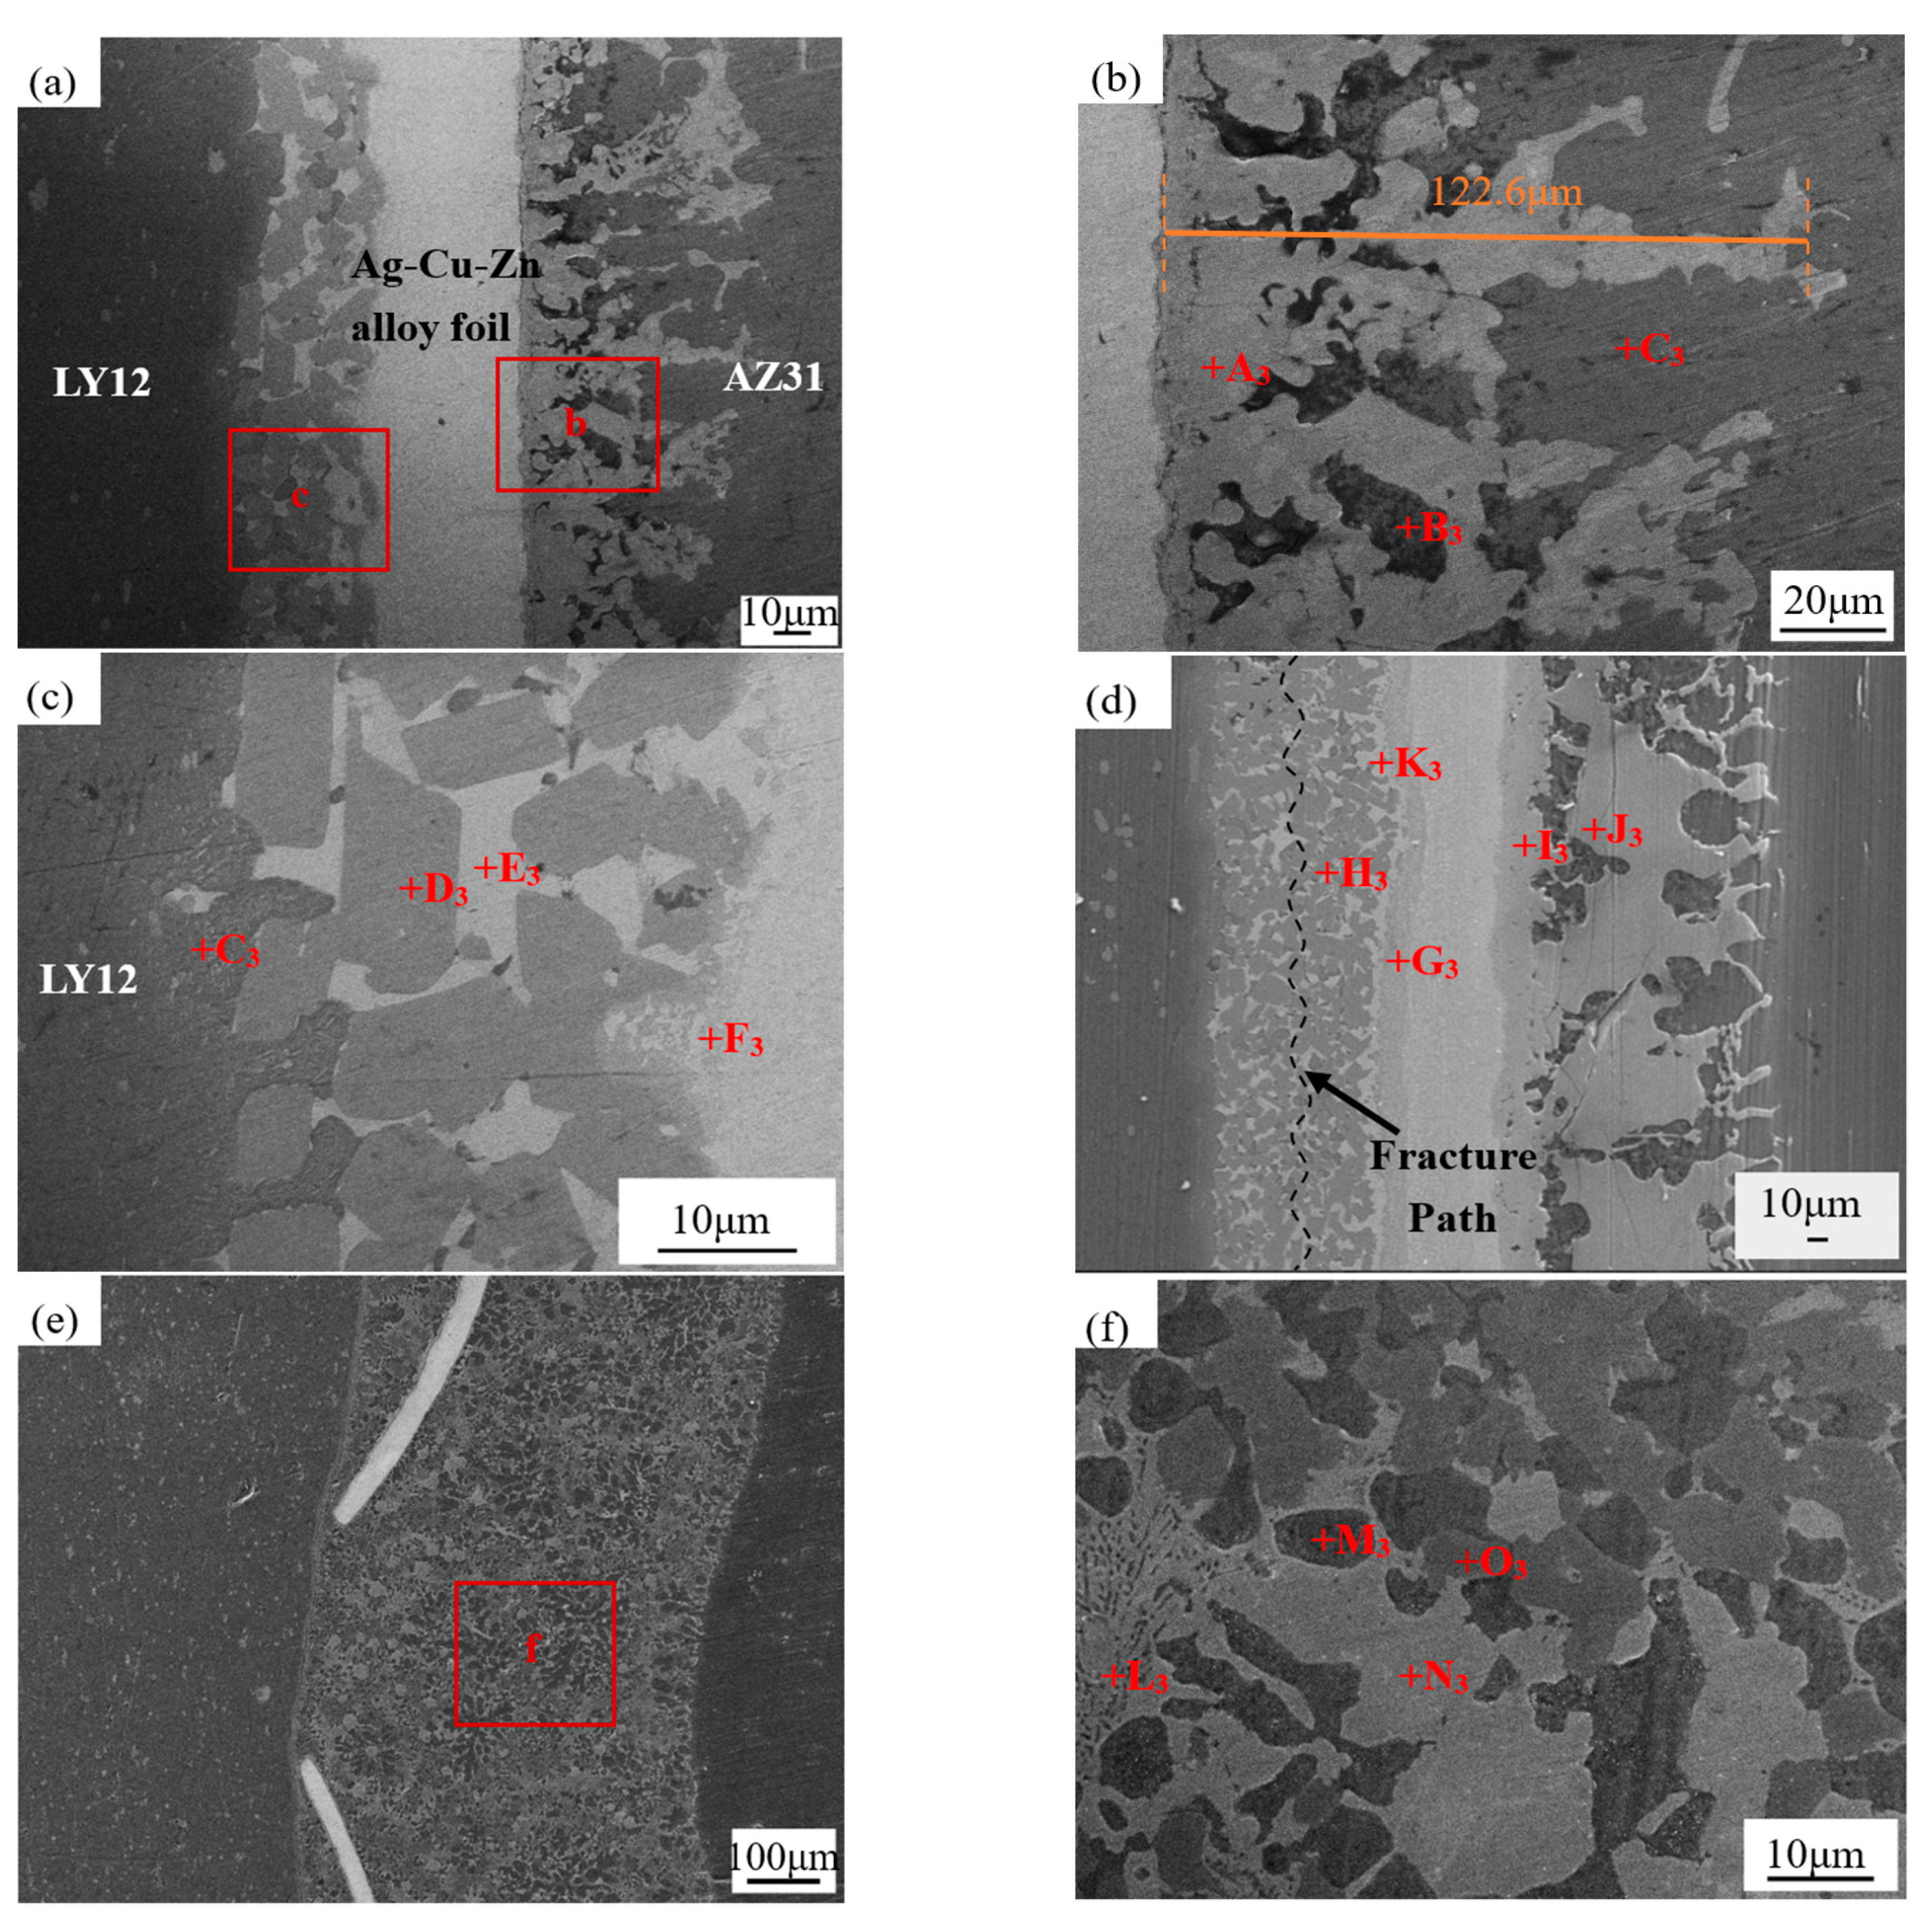
3.3. Microstructure Evolution of the Joints at 460 °C
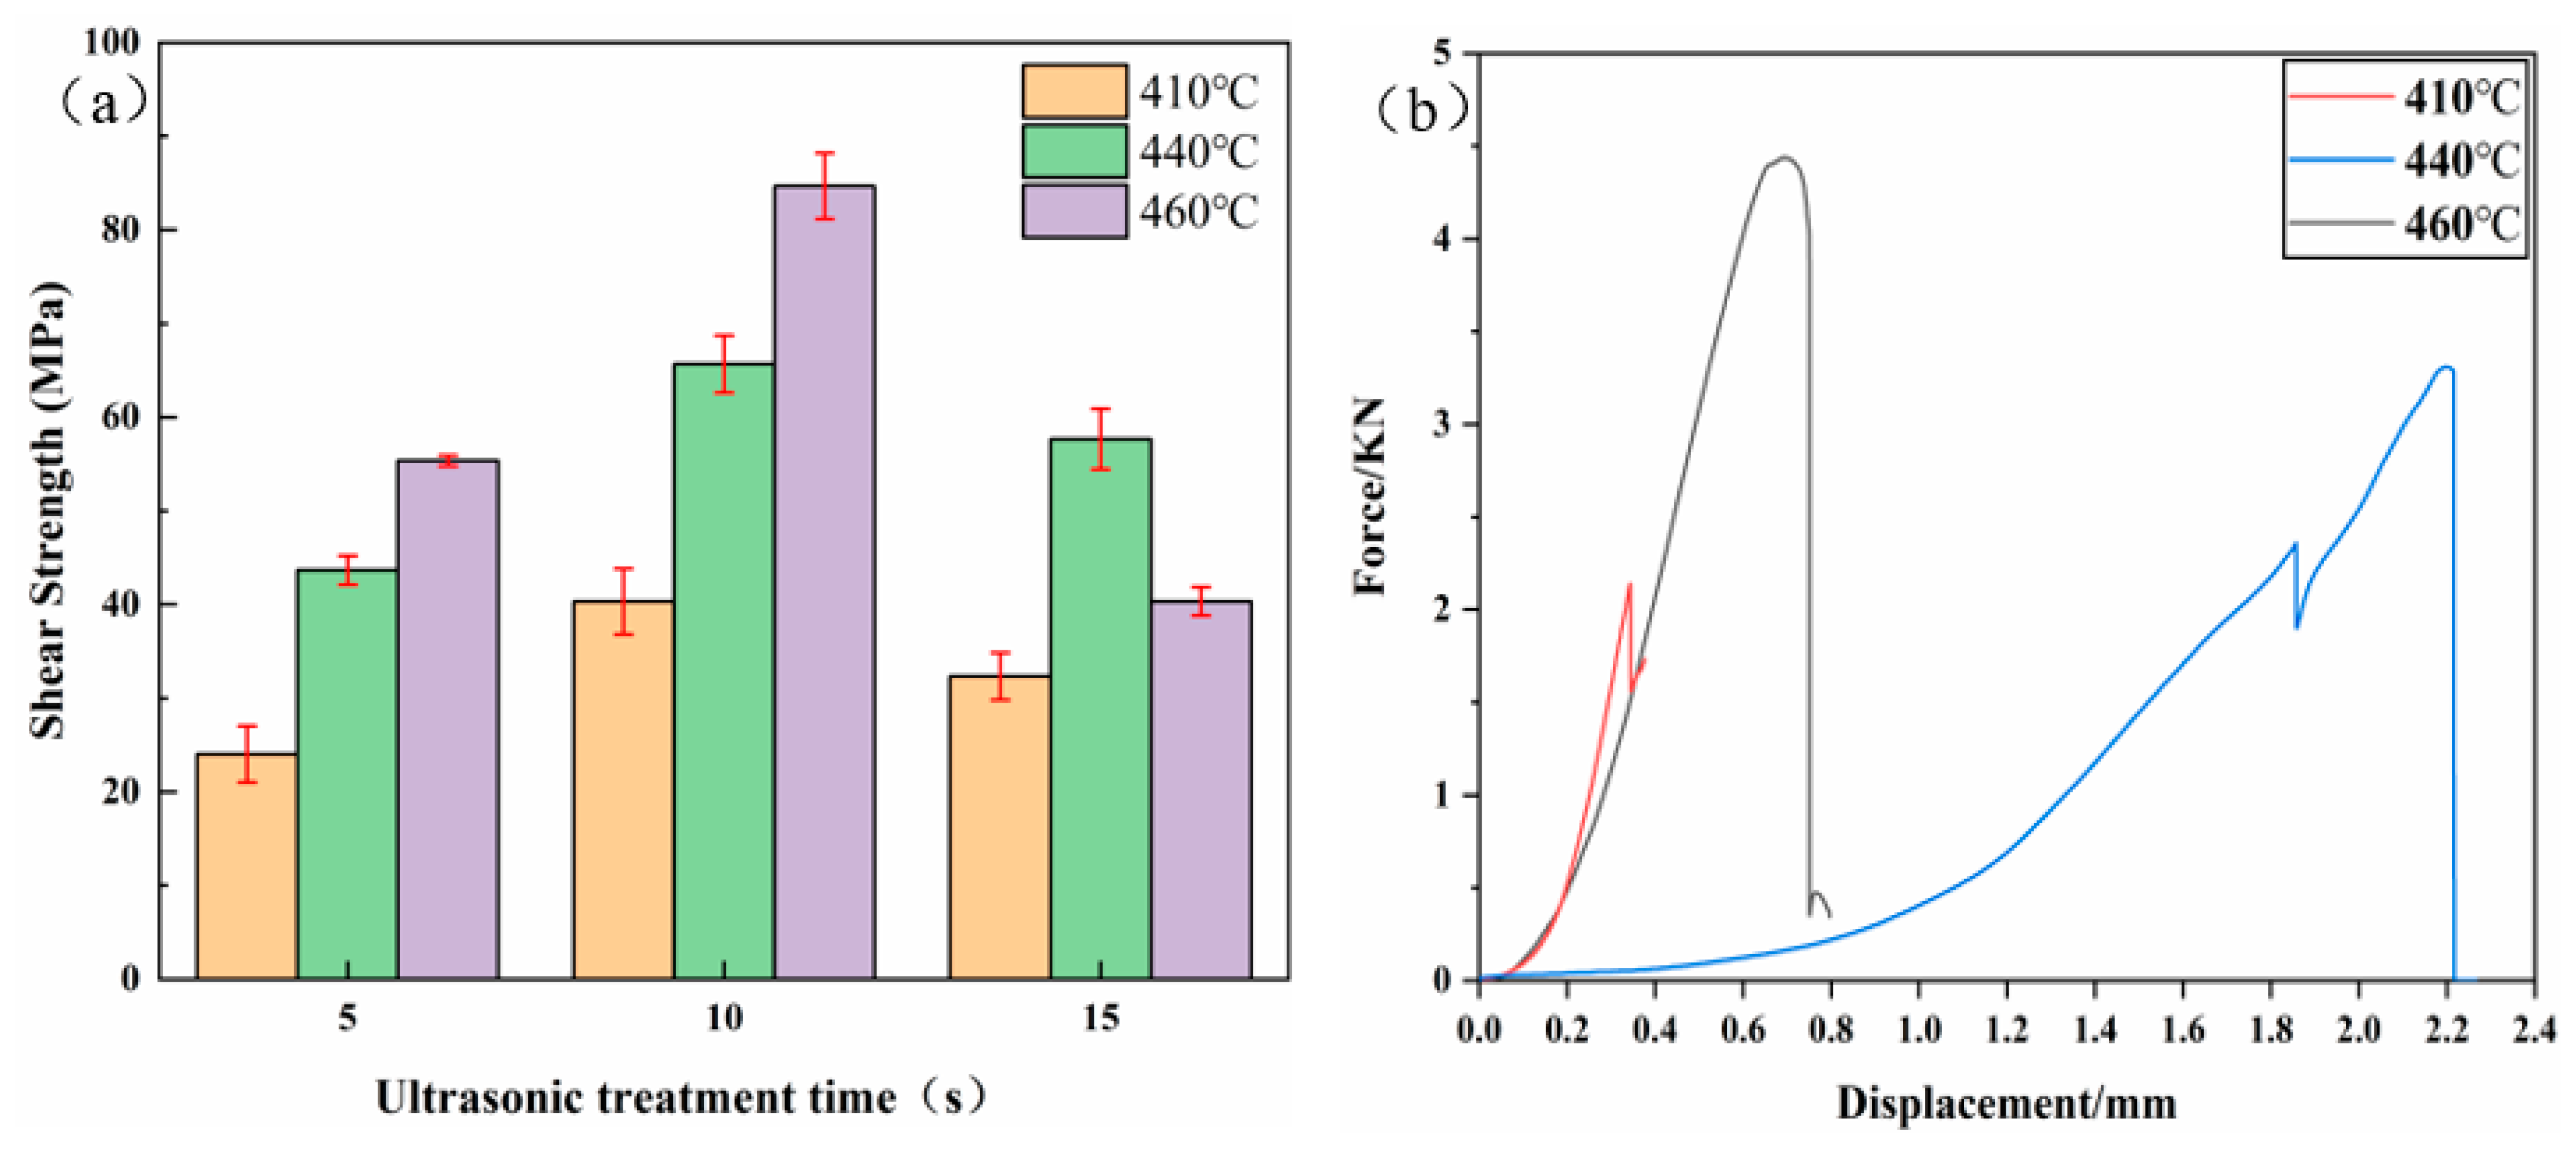
3.4. Mechanical Performance of the Joints at 410 °C, 440 °C, and 460 °C
4. Conclusions
Author Contributions
Funding
Acknowledgments
Conflicts of Interest
References
- Mouritz, A.P. Magnesium alloys for aerospace structures. In Introduction to Aerospace Materials; Woodhead Publishing Limited: Cambridge, UK, 2012; pp. 224–231. [Google Scholar]
- Kubásek, J.; Minárik, P.; Hosová, K.; Šašek, S.; Knapek, M.; Veselý, J.; Stráská, J.; Dvorský, D.; Čavojský, M.; Vojtěch, D. Novel magnesium alloy containing Y, Gd and Ca with enhanced ignition temperature and mechanical properties for aviation applications. J. Alloys Compd. 2021, 877, 160089. [Google Scholar] [CrossRef]
- Zeng, X.-Y.; Wang, Y.-X.; Li, X.-Q.; Zhao, T.-J. Effect of inert gas-shielding on the interface and mechanical properties of Mg/Al explosive welding composite plate. J. Manuf. Processes 2019, 45, 166–175. [Google Scholar] [CrossRef]
- Liu, F.; Zhang, Z.; Liu, L. Microstructure evolution of Al/Mg butt joints welded by gas tungsten arc with Zn filler metal. Mater. Charact. 2012, 69, 84–89. [Google Scholar] [CrossRef]
- Xu, Y.; Ke, L.; Ouyang, S.; Mao, Y.; Niu, P. Precipitation behavior of intermetallic compounds and their effect on mechanical properties of thick plate friction stir welded Al/Mg joint. J. Manuf. Processes 2021, 64, 1059–1069. [Google Scholar] [CrossRef]
- Kwon, Y.J.; Shigematsu, I.; Saito, N. Dissimilar friction stir welding between magnesium and aluminum alloys. Mater. Lett. 2008, 62, 3827–3829. [Google Scholar] [CrossRef]
- McLean, A.A.; Powell, G.L.F.; Brown, I.H.; Linton, V.M. Friction stir welding of magnesium alloy AZ31B to aluminium alloy 5083. Sci. Technol. Weld. Join. 2013, 8, 462–464. [Google Scholar] [CrossRef]
- Leo, P.; Renna, G.; Casalino, G.; Olabi, A.G. Effect of power distribution on the weld quality during hybrid laser welding of an Al–Mg alloy. Opt. Laser Technol. 2015, 73, 118–126. [Google Scholar] [CrossRef]
- Huang, Y.; Shen, C.; Ji, X.; Li, F.; Zhang, Y.; Hua, X. Effects of Mg content on keyhole behaviour during deep penetration laser welding of Al-Mg alloys. Opt. Laser Technol. 2020, 125, 106056. [Google Scholar] [CrossRef]
- Beiranvand, Z.M.; Ghaini, F.M.; Moosavy, H.N.; Sheikhi, M.; Torkamany, M.J. Solidification cracking susceptibility in pulsed laser welding of Al–Mg alloys. Materialia 2019, 7, 100417. [Google Scholar] [CrossRef]
- Gu, X.; Sui, C.; Liu, J.; Li, D.; Meng, Z.; Zhu, K. Microstructure and mechanical properties of Mg/Al joints welded by ultrasonic spot welding with Zn interlayer. Mater. Des. 2019, 181, 108103. [Google Scholar] [CrossRef]
- Patel, V.K.; Chen, D.L.; Bhole, S.D. Dissimilar ultrasonic spot welding of Mg-Al and Mg-high strength low alloy steel. Theor. Appl. Mech. Lett. 2014, 4, 041005. [Google Scholar] [CrossRef] [Green Version]
- Patel, V.K.; Bhole, S.D.; Chen, D.L. Microstructure and mechanical properties of dissimilar welded Mg–Al joints by ultrasonic spot welding technique. Sci. Technol. Weld. Join. 2013, 17, 202–206. [Google Scholar] [CrossRef]
- Macwan, A.; Chen, D.L. Ultrasonic spot welding of rare-earth containing ZEK100 magnesium alloy to 5754 aluminum alloy. Mater. Sci. Eng. A 2016, 666, 139–148. [Google Scholar] [CrossRef]
- Cheng, K.; Xu, H.; Ma, B.; Zhou, J.; Tang, S.; Liu, Y.; Sun, C.; Wang, N.; Wang, M.; Zhang, L.; et al. An in-situ study on the diffusion growth of intermetallic compounds in the Al–Mg diffusion couple. J. Alloys Compd. 2019, 810, 151878. [Google Scholar] [CrossRef]
- Chen, W.; Wang, W.; Liu, Z.; Zhai, X.; Bian, G.; Zhang, T.; Dong, P. Improvement in tensile strength of Mg/Al alloy dissimilar friction stir welding joints by reducing intermetallic compounds. J. Alloys Compd. 2021, 861, 157942. [Google Scholar] [CrossRef]
- Yamamoto, N.; Liao, J.; Watanabe, S.; Nakata, K. Effect of Intermetallic Compound Layer on Tensile Strength of Dissimilar Friction-Stir Weld of a High Strength Mg Alloy and Al Alloy. Mater. Trans. 2009, 50, 2833–2838. [Google Scholar] [CrossRef] [Green Version]
- Zhao, Y.; Ding, Z.; Shen, C.; Chen, Y. Interfacial microstructure and properties of aluminum–magnesium AZ31B multi-pass friction stir processed composite plate. Mater. Des. 2016, 94, 240–252. [Google Scholar] [CrossRef]
- Bae, J.H.; Rao, A.P.; Kim, K.H.; Kim, N.J. Cladding of Mg alloy with Al by twin-roll casting. Scr. Mater. 2011, 64, 836–839. [Google Scholar] [CrossRef]
- Qiao, X.; Li, X.; Zhang, X.; Chen, Y.; Zheng, M.; Golovin, I.S.; Gao, N.; Starink, M.J. Intermetallics formed at interface of ultrafine grained Al/Mg bi-layered disks processed by high pressure torsion at room temperature. Mater. Lett. 2016, 181, 187–190. [Google Scholar] [CrossRef] [Green Version]
- Liu, L.; Zhang, Z.; Liu, F.; Wang, Z.; Wang, H. Effect of addition of Ce in Sn–30Zn solder on the structure and properties of the Mg/Al-brazed joint. J. Mater. Sci. 2012, 48, 2030–2037. [Google Scholar] [CrossRef]
- Liu, L.M.; Zhao, L.M.; Wu, Z.H. Influence of holding time on microstructure and shear strength of Mg–Al alloys joint diffusion bonded with Zn–5Al interlayer. Mater. Sci. Technol. 2013, 27, 1372–1376. [Google Scholar] [CrossRef]
- Zhao, L.M.; Zhang, Z.D. Effect of Zn alloy interlayer on interface microstructure and strength of diffusion-bonded Mg–Al joints. Scr. Mater. 2008, 58, 283–286. [Google Scholar] [CrossRef]
- Liu, L.; Tan, J.; Liu, X. Reactive brazing of Al alloy to Mg alloy using zinc-based brazing alloy. Mater. Lett. 2007, 61, 2373–2377. [Google Scholar] [CrossRef]
- Lai, Z.; Xie, R.; Pan, C.; Chen, X.; Liu, L.; Wang, W.; Zou, G. Ultrasound-Assisted Transient Liquid Phase Bonding of Magnesium Alloy Using Brass Interlayer in Air. J. Mater. Sci. Technol. 2017, 33, 567–572. [Google Scholar] [CrossRef]
- Li, Y.; Li, J.; Peng, Z.; Lv, B.; Cui, N.; Yan, J.; Zhang, H.; Zhou, T.; Yu, Z. Evolution of IMC layer and its reinforcing effect in 2024/MB8 dissimilar joints using a multi-interlayer of Cu/Zn via U-TLP bonding. Mater. Sci. Eng. A 2022, 835, 142627. [Google Scholar] [CrossRef]
- Peng, Z.; Zhou, T.; Li, Y.; Cui, Z.; Wu, Z.; Yan, J. Microstructure and mechanical performance of AZ31/2024 dissimilar alloy joints using a multi-interlayer of Ni/Al/Zn via ultrasonic-assisted transient liquid phase bonding. Mater. Des. 2021, 197, 109218. [Google Scholar] [CrossRef]
- Xu, G.; Leng, X.; Jiang, H.; Xiu, Z.; Yan, J. Microstructure and strength of ultrasonic-assisted brazed joints of Si3N4/6061Al composites. J. Manuf. Processes 2020, 54, 89–98. [Google Scholar] [CrossRef]
- Xu, Z.; Li, Z.; Chai, B.; Yan, J. Formation of TiAl3 and its reinforcing effect in TA15 alloy joint ultrasonically brazed with pure Al. J. Alloy. Compd. 2020, 815, 152493. [Google Scholar] [CrossRef]
- Wu, K.; Yuan, X.; Li, T.; Wang, H.; Xu, C.; Luo, J. Effect of ultrasonic vibration on TIG welding–brazing joining of aluminum alloy to steel. J. Mater. Process. Technol. 2019, 266, 230–238. [Google Scholar] [CrossRef]
- Xu, Z.; Li, Z.; Li, J.; Ma, J.; Yan, J. Control Al/Mg intermetallic compound formation during ultrasonic-assisted soldering Mg to Al. Ultrason. Sonochem. 2018, 46, 79–88. [Google Scholar] [CrossRef] [Green Version]
- Shakeri, H.; Mofid, M.A. Physical Vapor Deposition Assisted Diffusion Bonding of Al Alloy to Mg Alloy Using Silver Interlayer. Met. Mater. Int. 2020, 27, 4132–4141. [Google Scholar] [CrossRef]
- Peng, H.; Chen, D.L.; Bai, X.F.; Wang, P.Q.; Li, D.Y.; Jiang, X.Q. Microstructure and mechanical properties of Mg-to-Al dissimilar welded joints with an Ag interlayer using ultrasonic spot welding. J. Magnes. Alloys 2020, 8, 552–563. [Google Scholar] [CrossRef]
- Varmazyar, J.; Khodaei, M. Diffusion bonding of aluminum-magnesium using cold rolled copper interlayer. J. Alloys Compd. 2019, 773, 838–843. [Google Scholar] [CrossRef]
- Yang, T.; Wang, K.; Zhang, D.; Huang, J. Contact-reaction brazing of an AZ31 magnesium/3003 aluminum alloy using a silver-copper-zinc interlayer. J. Mater. Process. Technol. 2017, 249, 531–537. [Google Scholar] [CrossRef]
- Yao, Z.; Kim, G.-Y.; Wang, Z.; Faidley, L.; Zou, Q.; Mei, D.; Chen, Z. Acoustic softening and residual hardening in aluminum: Modeling and experiments. Int. J. Plast. 2012, 39, 75–87. [Google Scholar] [CrossRef]
- Lai, Z.; Chen, X.; Pan, C.; Xie, R.; Liu, L.; Zou, G. Joining Mg alloys with Zn interlayer by novel ultrasonic-assisted transient liquid phase bonding method in air. Mater. Lett. 2016, 166, 219–222. [Google Scholar] [CrossRef]
- Siddiq, A.; Ghassemieh, E. Thermomechanical analyses of ultrasonic welding process using thermal and acoustic softening effects. Mech. Mater. 2008, 40, 982–1000. [Google Scholar] [CrossRef]
- Zhang, Y.; Wang, X.; Kuang, Y.; Liu, B.; Zhang, K.; Fang, D. Enhanced mechanical properties and degradation rate of Mg-3Zn-1Y based alloy by Cu addition for degradable fracturing ball applications. Mater. Lett. 2017, 195, 194–197. [Google Scholar] [CrossRef]
- He, M.L.; Luo, T.J.; Liu, Y.T.; Lin, T.; Zhou, J.X.; Yang, Y.S. Effects of Cu and Ce co-addition on the microstructure and mechanical properties of Mg-6Zn-0.5Zr alloy. J. Alloys Compd. 2018, 767, 1216–1224. [Google Scholar] [CrossRef]
- Lang, Q.; Wang, Q.; Han, J.; Zhang, W.; Zhang, Y.; Yan, J. Microstructure evolution of Mg/Cu dissimilar metal jointed by ultrasonicinduced transient liquid phase bonding with Zn interlayer. Mater. Charact. 2019, 157, 109897. [Google Scholar] [CrossRef]
- Mao, Z.; Niu, T.; Wang, Q.; Nie, Y.; Yan, J.; Deng, J.; Li, Y. Ultrasound-induced transient liquid-phase bonding of Mg/Cu dissimilar metals with Zn interlayer in air. Mater. Lett. 2020, 268, 127483. [Google Scholar] [CrossRef]
- Xu, Z.; Li, Z.; Peng, L.; Yan, J. Ultrarapid transient liquid phase bonding of Mg alloys within 1 s in air by ultrasonic assistance. Mater. Des. 2019, 161, 72–79. [Google Scholar] [CrossRef]
- Li, Z.; Xu, Z.; Zhu, D.; Ma, Z.; Yan, J. Control of Mg2Sn formation through ultrasonic-assisted transient liquid phase bonding of Mg to Al. J. Mater. Process. Technol. 2018, 255, 524–529. [Google Scholar] [CrossRef]


| Point | Mg | Zn | Al | Ag | Cu | Possible Phase | UST (s) |
|---|---|---|---|---|---|---|---|
| A1 | 73.26 | 24.13 | 1.99 | 0.62 | 0 | Mg7Zn3 | 5 |
| B1 | 94.52 | 3.67 | 1.50 | 0.32 | 0 | α-Mg | 5 |
| C1 | 97.35 | 0.98 | 1.67 | 0 | 0 | α-Mg | 5 |
| D1 | 0 | 40.57 | 0 | 8.94 | 50.49 | CuZnAg | 5 |
| E1 | 0 | 79.25 | 1.28 | 7.15 | 12.32 | Zn–Ag–Cu mixture | 5 |
| F1 | 0.79 | 95.49 | 0.61 | 1.23 | 1.64 | η-Zn | 5 |
| G1 | 0.87 | 47.65 | 50.95 | 0.53 | 0 | Zn–Al eutectic | 5 |
| H1 | 2.83 | 50.74 | 46.43 | 0 | 0 | Zn–Al eutectic | 5 |
| I1 | 0.34 | 1.98 | 97.69 | 0 | 0 | α-Al | 5 |
| J1 | 36.10 | 49.40 | 4.87 | 0.06 | 9.57 | Mg–Zn–Cu mixture | 10 |
| K1 | 35.45 | 41.18 | 6.74 | 0.21 | 16.41 | Mg–Zn–Cu mixture | 10 |
| L1 | 0.08 | 49.47 | 47.99 | 0.82 | 1.63 | Zn–Al eutectic | 10 |
| M1 | 70.56 | 27.83 | 0.68 | 0.20 | 0.73 | Mg7Zn3 | 10 |
| N1 | 94.52 | 3.67 | 1.50 | 0.32 | 0.00 | α-Mg | 10 |
| O1 | 0.12 | 73.42 | 4.53 | 7.85 | 14.07 | Zn–Ag–Cu–Al mixture | 10 |
| P1 | 0.88 | 56.79 | 40.74 | 0.73 | 1.36 | Zn–Al eutectic | 15 |
| Q1 | 0.61 | 58.25 | 3.45 | 12.10 | 25.60 | Zn–Ag–Cu mixture | 15 |
| R1 | 34.22 | 40.98 | 6.45 | 0.32 | 18.03 | Mg–Zn–Cu mixture | 15 |
| Point | Mg | Zn | Al | Ag | Cu | Possible Phase | UST (s) |
|---|---|---|---|---|---|---|---|
| A2 | 97.44 | 1.52 | 0.73 | 0.31 | 0 | α-Mg | 5 |
| B2 | 72.54 | 25.62 | 1.01 | 0.84 | 0 | Mg7Zn3 | 5 |
| C2 | 65.25 | 28.57 | 5.48 | 0.65 | 0.41 | Mg7Zn3 | 5 |
| D2 | 35.19 | 39.53 | 1.21 | 0.35 | 23.73 | MgZnCu | 5 |
| E2 | 0.33 | 29.85 | 15.73 | 0.58 | 53.23 | Al–Zn–Cu mixture | 5 |
| F2 | 2.11 | 67.83 | 5.66 | 13.69 | 10.70 | Zn–Ag–Al–Cu mixture | 5 |
| G2 | 0.76 | 6.03 | 62.09 | 0.12 | 31.01 | Al2Cu | 5 |
| H2 | 0.55 | 39.85 | 58.81 | 0.63 | 0.16 | Zn–Al eutectic | 5 |
| I2 | 0.32 | 1.85 | 97.37 | 0.33 | 0.13 | α-Al | 5 |
| J2 | 0.76 | 2.67 | 65.41 | 0.14 | 31.02 | Al2Cu | 10 |
| K2 | 0.76 | 64.78 | 6.71 | 22.96 | 4.79 | AgZn3 | 10 |
| L2 | 0.49 | 30.70 | 64.03 | 2.17 | 2.60 | Zn–Al eutectic | 10 |
| M2 | 34.36 | 32.22 | 8.68 | 0.46 | 24.29 | MgZnCu | 10 |
| N2 | 71.12 | 26.47 | 1.45 | 0.96 | 0 | Mg7Zn3 | 10 |
| O2 | 1.77 | 1.99 | 66.63 | 0.24 | 29.37 | Al2Cu | 15 |
| P2 | 5.06 | 63.74 | 5.37 | 23.47 | 2.35 | AgZn3 | 15 |
| Q2 | 0.77 | 12.36 | 83.49 | 1.43 | 1.96 | α-Al | 15 |
| R2 | 36.27 | 30.41 | 12.45 | 0.35 | 20.53 | Mg–Zn–Cu–Al mixture | 15 |
| S2 | 5.06 | 57.92 | 8.75 | 27.41 | 0.87 | AgZn3 | 15 |
| Point | Mg | Zn | Al | Ag | Cu | Possible Phase | UST (s) |
|---|---|---|---|---|---|---|---|
| A3 | 58.70 | 27.52 | 0 | 2.76 | 11.01 | MgZnCu | 5 |
| B3 | 90.36 | 2.39 | 6.48 | 0.60 | 0.17 | α-Mg | 5 |
| C3 | 1.54 | 0.72 | 94.90 | 0.97 | 1.87 | α-Al | 5 |
| D3 | 0 | 2.84 | 65.76 | 0.10 | 31.30 | Al2Cu | 5 |
| E3 | 0 | 64.1 | 7.84 | 23.28 | 4.37 | η-Zn+AgZn | 5 |
| F3 | 3.61 | 35.59 | 22.25 | 23.04 | 15.51 | Ag–Cu–Zn–Al mixture | 5 |
| G3 | 0.99 | 38.76 | 13.62 | 22.14 | 24.50 | Zn–Cu–Ag–Al mixture | 10 |
| H3 | 0.20 | 3.16 | 65.60 | 1.40 | 29.65 | Al2Cu | 10 |
| I3 | 47.20 | 20.28 | 1.49 | 12.82 | 18.21 | Mg–Zn–Cu–Ag mixture | 10 |
| J3 | 34.81 | 23.66 | 11.21 | 0.52 | 29.79 | Mg–Zn–Cu–Al mixture | 10 |
| K3 | 1.98 | 59.12 | 10.54 | 25.24 | 3.11 | η-Zn+AgZn | 10 |
| L3 | 60.21 | 10.18 | 26.44 | 2.67 | 0.50 | Al3Mg2+α-Mg+η-Zn | 15 |
| M3 | 91.30 | 1.08 | 7.25 | 0.37 | 0 | α-Mg | 15 |
| N3 | 0.36 | 67.22 | 8.56 | 22.38 | 1.48 | AgZn3 | 15 |
| O3 | 0 | 2.65 | 64.28 | 1.87 | 31.20 | Al2Cu | 15 |
Publisher’s Note: MDPI stays neutral with regard to jurisdictional claims in published maps and institutional affiliations. |
© 2022 by the authors. Licensee MDPI, Basel, Switzerland. This article is an open access article distributed under the terms and conditions of the Creative Commons Attribution (CC BY) license (https://creativecommons.org/licenses/by/4.0/).
Share and Cite
Yu, Z.; Gao, J.; Su, Z.; Zhang, H.; Li, Y.; Peng, Z. Microstructure and Mechanical Properties of AZ31B/LY12 Joints Using Zn/Ag–Cu–Zn/Zn Multi-Interlayers via Ultrasound-Assisted Transient Liquid Phase Bonding. Metals 2022, 12, 909. https://doi.org/10.3390/met12060909
Yu Z, Gao J, Su Z, Zhang H, Li Y, Peng Z. Microstructure and Mechanical Properties of AZ31B/LY12 Joints Using Zn/Ag–Cu–Zn/Zn Multi-Interlayers via Ultrasound-Assisted Transient Liquid Phase Bonding. Metals. 2022; 12(6):909. https://doi.org/10.3390/met12060909
Chicago/Turabian StyleYu, Zijing, Jianguo Gao, Zhaofang Su, Hongchang Zhang, Yinan Li, and Zilong Peng. 2022. "Microstructure and Mechanical Properties of AZ31B/LY12 Joints Using Zn/Ag–Cu–Zn/Zn Multi-Interlayers via Ultrasound-Assisted Transient Liquid Phase Bonding" Metals 12, no. 6: 909. https://doi.org/10.3390/met12060909
APA StyleYu, Z., Gao, J., Su, Z., Zhang, H., Li, Y., & Peng, Z. (2022). Microstructure and Mechanical Properties of AZ31B/LY12 Joints Using Zn/Ag–Cu–Zn/Zn Multi-Interlayers via Ultrasound-Assisted Transient Liquid Phase Bonding. Metals, 12(6), 909. https://doi.org/10.3390/met12060909