Abstract
Fifty kilogram-scale electroslag remelting (ESR) experiments using slag with different TiO2 contents in an electroslag furnace were performed to investigate the size, amount and types of inclusions in an electrode and remelted ingots. The results show that the contents of aluminum and titanium increased and decreased, respectively, compared to those in a consumable electrode. The inclusions in the consumable electrode were TiS, TiN and Al2O3 surrounded by a TiN layer, and the inclusions in the remelted ingots were TiN, MgO-Al2O3 and MgO-Al2O3 surrounded by a TiN layer. With the increase in the height of the ingots, the average size of inclusions increased from 2.5 to 4.4 μm. Increasing the TiO2 content in the slag promoted the formation of MgO-Al2O3 and made the inclusions larger in the remelted ingots. To make the size of inclusions in remelted ingots of Incoloy825 smaller, the TiO2 in the slag should be decreased. The TiS in the electrode was removed during ESR. Part of the TiN dissociated during the reaction between the liquid metal and slag by molten slag, and most of the TiN inclusions originated from the consumable electrode. The Al2O3 inclusions surrounded by a TiN layer in the consumable electrode were finally transformed to MgO-Al2O3 and MgO-Al2O3 surrounded by a TiN layer in the remelted ingots.
1. Introduction
Electroslag remelting (ESR) has been increasingly applied to produce special steels and super alloys because of its great advantage in removing non-metallic inclusions, which are gravely harmful to the quality of the product [1,2,3]. Incoloy825 is one of the typical high-temperature Ni-based alloys and, due to its exclusive, unique advantages, is widely used for chemical processing, pollution control and oil and gas recovery [4,5]. Regarding the existence of Ti and Al in this alloy, there are Ti-containing and Al-containing inclusions. To maximize the quality of Incoloy825, it is vital to investigate the evolution mechanism of inclusions in this alloy during the production process.
In order to understand the removal mechanism of inclusions, different inclusions have been investigated under specific production conditions. Shi et al. [6] studied the evolution of MnO-SiO2-Al2O3 inclusions in Si-Mn-killed steel during protective atmosphere ESR and found they were removed by two methods and formed MgAl2O4 as a poor metal. Wang et al. [7] researched the formation and evolution of non-metallic inclusions in calcium-treated H13 steel. Li et al. [8] studied heating austenitic alloy at 1273 K and investigated the evolution of TiS and TiN inclusions. Several researchers [9,10,11] investigated the inclusions through simulation. Many researchers [12,13,14] reported that the inclusions in Ti-containing alloy and steel are related to the chemical composition and deoxidation. However, the evolution mechanism of inclusions in Incoloy825 alloy by ESR has not yet been reported.
To the authors’ best knowledge, the slag used in the ESR process contains high amounts of fluoride. The evaporation of fluoride not only pollutes the environment but also changes the composition of the slag. The exploitation of low fluoride-containing slag for ESR has been studied in previous research. Shi et al. [15] indicated that the TiO2 in slag can reduce viscosity in place of CaF2. Ju et al. [16] proposed that increasing CaO/Al2O3 in low-fluoride slag can reduce viscosity. Moreover, the TiO2 in slag can also decrease the loss of Ti in an alloy [17,18]. However, less research of the effect of TiO2 in low fluoride-containing slag on Ti-containing inclusions has been conducted.
The present study was undertaken to investigate the evolution of inclusions in Incoloy825 during the ESR process. The effect of TiO2 in slag on inclusions was also revealed. The evolution of the mechanism of inclusions in Incoloy825 was clarified through the transition of inclusions during ESR in combination with thermodynamic calculation.
2. Experimental
2.1. Raw Material for ESR Procedure
The consumable electrode (85 mm in diameter and 850 mm in length) was produced by a 150 kg-capacity vacuum induction melting (VIM) furnace. The chemical composition of the consumable electroslag is shown in Table 1. The premelted slag was prepared by an electric arc furnace, whose composition is listed in Table 2. Before the ESR process, the oxide layer on the consumable electrode’s surface was polished and the dummy bars were welded together. The slags used for ESR were heated at 673 K for at least 6 h to remove the moisture.

Table 1.
Chemical composition of the consumable electrode (mass%).
Table 2.
Chemical composition of the slag used in ESR (mass%).
2.2. ESR Procedure
Three experiments were carried out using a furnace with the capacity to refine a 50 kg ingot. Before arcing, 5 kg of premelted slag was added into the mold, and high-purity argon with a flow of 200 L·min−1 was introduced into the mold to isolate it from the outside air. The alternate current and secondary voltage applied during the normal refining process were 1800 A and 32 V, respectively. No deoxidizer was added into the slag pool during the refining process. The average melting rate was about 1.2 kg/min, and the total refining process lasted about 900 s. The ingots were 160 mm in diameter and 205 mm in length.
2.3. Chemical Analysis and Inclusion Characterization
In order to observe the inclusion characteristics of ingots of different heights, four samples were taken from each ingot, numbered P1-1 to P1-4, P2-1 to P2-4 and P3-1 to P3-4, from top to bottom, with heights of 25 mm, 75 mm, 125 mm and 175 mm, respectively, as shown in Figure 1. Every sample was 15 × 15 × 15 mm3, spaced 50 mm apart. The contents of Al, Si, Ti, Cr, Ni, C, Mn, Mo, Cu and Fe in the electrode were measured by a spark direct reading spectrometer (METAL-LAB75/80J, GNR, Novara, Italia). The contents of total Ca, MgO, TiO2, SiO2 and Al2O3 in the slag were measured by wavelength dispersive X-ray fluorescence spectrometry (GoldXpert, Olympus, Tokyo, Japan), while the FeO in the slag was determined by a potassium dichromate volumetric method. The total oxygen and nitrogen contents in the samples were determined by an ONH analyzer (G8GALILEO, Bruker, Bremen, Germany). The preparation of samples for the size and morphology of the inclusions was conducted by grinding and polishing. Then, the inclusions were observed by an energy-dispersive X-ray spectrometer (EDS, Gemini 300, Bruker, Bremen, Germany).
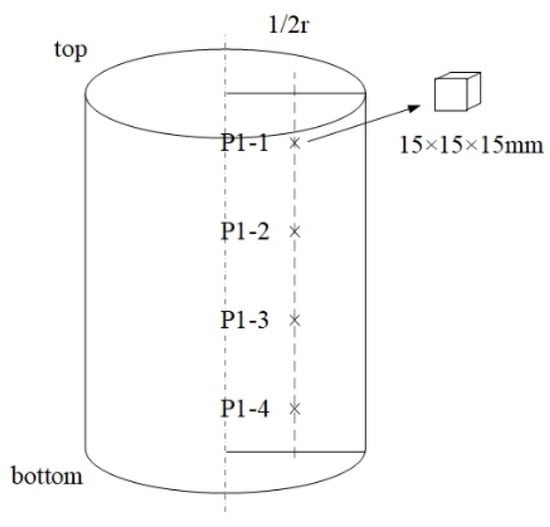
Figure 1.
Schematic view of the sampling position in P1 (the same as P2 and P3).
3. Results and Discussion
3.1. Compositional Change of the Ingot
The contents of the elements in the inclusions that changed significantly in the remelted ingots are listed in Table 3. With the increase in the height of the ingots, the aluminum contents in ingots first increased and then decreased slightly. The titanium contents increased along with the height of the ingots, and the contents of Mg and Si changed slightly. The contents of aluminum and titanium increased and decreased in the inclusions, respectively, comparable to those in the consumable electrode. With the increase in the TiO2 contents in the slag, the increase and decrease in inclusions were reduced. This is mainly due to the exchange reaction of Equation (1). The ΔG calculated in the three experiments was 924.2 J, −2098.9 J and −8608.4 J, indicating that the reaction happened in P2 and P3. The silicon contents increased compared to those in the consumable electrode, mainly due to the reduction of SiO2 in the slag. The oxygen contents exhibited a different increase in the three ingots compared to the electrode, mainly because no deoxidant was added during the ESR processes.
where and are the activity coefficients of Ti and Al, respectively. and are the activity of TiO2 and Al2O3, respectively. and are the first-order and second-order interaction parameters. The first-order interaction parameters are listed in Table 4. The available second-order interaction parameters are summarized as follows: , , , , , [19,20].
Table 3.
Chemical composition of the samples from ingots (mass%).
Table 4.
First-order interaction parameters used in the present study data from [21,22,23,24,25,26,27,28].
3.2. Characteristics of Inclusions
3.2.1. Number and Size Distribution of Inclusions in Electrode and Ingots
To investigate the evolution mechanism of the inclusions, the number, size and distribution of inclusions in each sample were analyzed by randomly observing 30 fields of P1-3, P2-1, P2-2, P2-3, P2-4, P3-3 and the consumable electrode by SEM. The size range of inclusions in the consumable electrode was mainly 0–3 μm, though some of the inclusions exceeded 3 μm, and almost all TiN inclusions were less than 2 μm. Most of the TiN inclusions in the remelted ingots were also less than 2 μm, while the other inclusions grew larger. The size distribution of inclusions detected in P2-1 to P2-4 is shown in Figure 2. The statistical results show that the average sizes of inclusions in P2-1 to P2-4 were 4.4 μm, 3.8 μm, 3.6 μm and 2.5 μm. The size of the inclusions tended to become larger as the height of the ingots increased from bottom to top, because the increase in the temperature of the slag as the process progressed caused a longer cooling time. The longer cooling time further increased the size. The size distribution of the inclusions detected in P1-3 to P3-3 is shown in Figure 3. The TiO2 contents after ESR are listed in Table 5. It can be seen that the sizes of inclusions increased with the TiO2 contents.
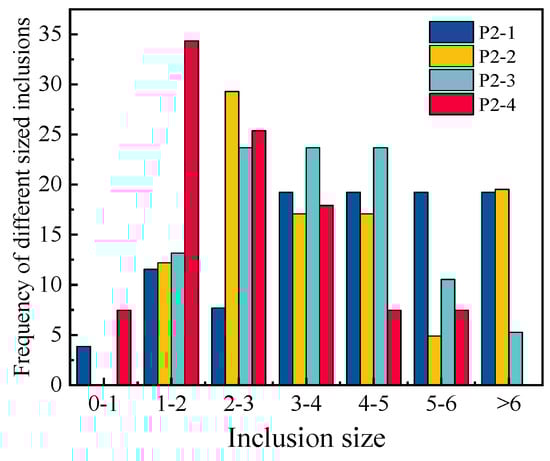
Figure 2.
The size distribution of the inclusions detected in P2–1 to P2–4.
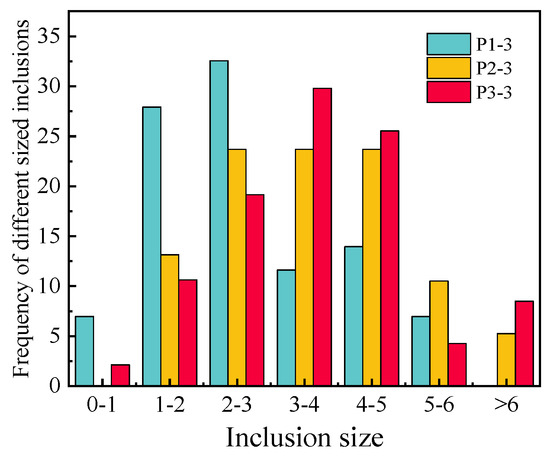
Figure 3.
The size distribution of the inclusions detected in P1–3, P2–3 and P3–3.
Table 5.
The TiO2 contents after the ESR process (mass%).
3.2.2. Characteristics of Inclusions in Consumable Electrode
Figure 4 and Figure 5 show the SEM images and EDS spectra of typical inclusions in the consumable electrode. Three types of inclusions were observed: TiS, TiN and Al2O3 surrounded by a TiN layer. Figure 4a–c show the SEM images of typical inclusions of TiS, TiN and Al2O3 surrounded by a TiN layer in the consumable electrode, respectively. The TiS inclusions were irregular strips, and the TiN inclusions were the shape of a rectangle or parallelogram, whereas the Al2O3 inclusions surrounded by TiN were circular.
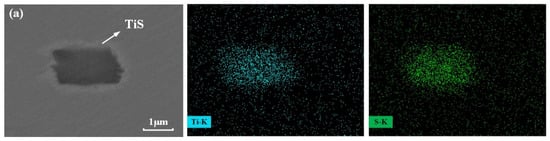
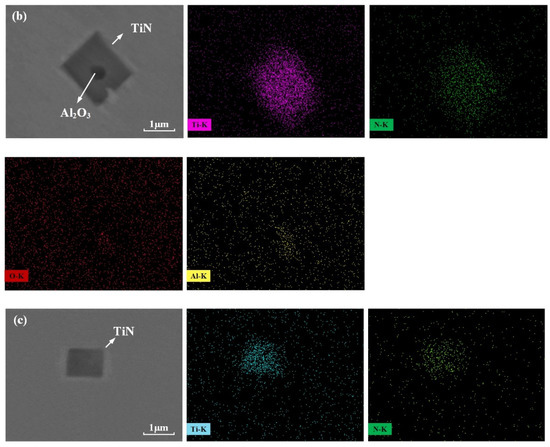
Figure 4.
Typical inclusions observed in the consumable electroslag: (a) TiS; (b) Al2O3 surrounded by TiN; (c) TiN.
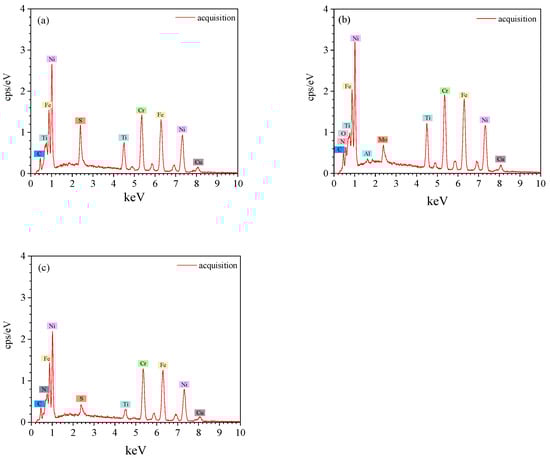
Figure 5.
EDS spectra of inclusions: (a) TiS; (b) Al2O3 surrounded by TiN; (c) TiN ((a–c) correspond to Figure 4a–c).
3.2.3. Characteristics of Inclusions in Remelted Ingots
There were four types of inclusions found in the samples from ingots, namely, TiN, MgO-Al2O3 and MgO-Al2O3 surrounded by a TiN layer. Figure 6 and Figure 7 show the SEM images of typical inclusions of TiN, MgO-Al2O3 and MgO-Al2O3 surrounded by a TiN layer. The MgO-Al2O3 inclusions were circular.
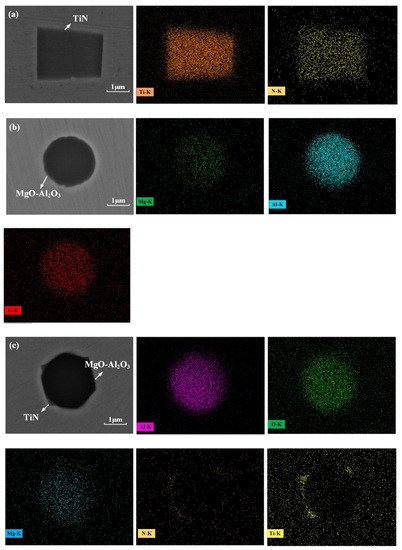
Figure 6.
Typical inclusions observed in the remelted ingots: (a) TiN; (b) Al2O3-MgO; (c) Al2O3-MgO surrounded by TiN.
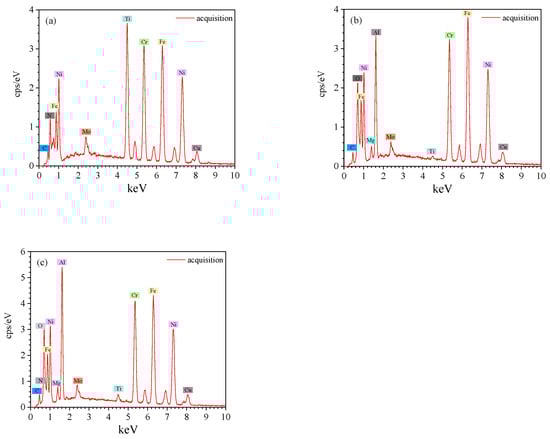
Figure 7.
EDS spectra of inclusions: (a) TiN; (b) Al2O3-MgO; (c) Al2O3-MgO surrounded by TiN ((a–c) correspond to Figure 6a–c).
3.3. Evolution Mechanism of TiS Inclusions during the ESR Process
It was found that few TiS inclusions existed in the consumable electrode, and they were removed in the remelted ingots. The standard Gibbs free energy can be calculated by Equation (4) [29].
where and are the activity coefficients of Ti and S, respectively. and are the activity of Ti and S, respectively. is the equilibrium constant.
There was only one type of sulfide inclusion in the electrode, and the size of the TiS inclusions was mainly 2~3 μm. Through Equations (3)–(5), the Gibbs free energy could be calculated as −170,150 J. The < 0 indicated the feasibility of TiS dissolution from thermodynamics. Jin et al. [29] calculated the actual concentration of TiS and MnS ( and ) through Equations (6) and (7), and they proposed that the precipitation of TiS in the experimental steel was higher than that of MnS at the same S content. The present study confirms their finding.
where and are the concentrations of i at the solidification front and in the liquid steel at the beginning of solidification, respectively; is the equilibrium partition coefficient of i in the solid steel or liquid steel; is the solid fraction.
3.4. Evolution Mechanism of TiN Inclusions during the ESR Process
TiN inclusions were obtained both in the consumable electrode and the remelted ingots. The equilibrium phase precipitation in the consumable electrode was calculated by Jmat pro7.0 (functional material performance simulation software, which can be used to calculate a variety of metal material properties), as shown in Figure 8. It can be seen that the precipitation temperature was about 1790 K, and the liquidus temperature was calculated to be about 1668 K. Thus, the TiN inclusions could not be dissociated during liquid metal film formation at the electrode tip, which corresponds to Zheng’s [30] result. During the ESR process, the temperature of slag can reach 1972 K and even higher. The TiN inclusions could be dissociated in this period of the process. Yang et al. [31] indicated that TiN inclusions were all removed in the solid–liquid two-phase region at the electrode, and the TiN in the remelted ingots was secondary TiN generated during the solidification of steel.
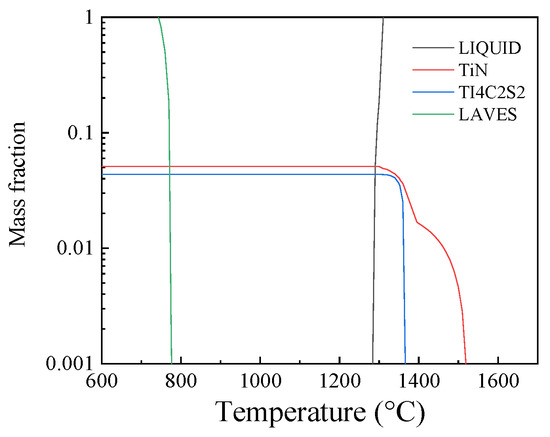
Figure 8.
Equilibrium phase precipitation in the consumable electrode.
The amounts of inclusions in the electrode, P1-3, P2-3 and P3-3 are shown in Figure 9. There were about 79.4%, 34.9%, 29.3% and 31.9% TiN inclusions in the consumable electrode, P1-3, P2-3 and P3-3, respectively. This indicates that part of the TiN inclusions was dissociated during liquid metal–slag reaction processing.
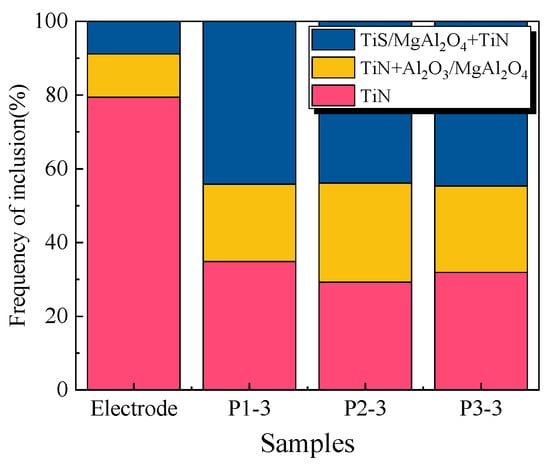
Figure 9.
Relative proportion (number) of the inclusions in the electrode and ingots (the yellow in the electrode bar represents the inclusions of TiN+Al2O3, and MgO-Al2O3 in the ingots; the blue in the electrode bar represents the inclusions of TiS, and MgO-Al2O3 + TiN in the ingots).
During the ESR process, the Gibbs free energy of the dissolution of TiN inclusions could be calculated as −127,202 J through Equation (8) [32]. The < 0 indicated the feasibility of TiN dissolution from thermodynamics. The precipitation of TiN mainly depends on the content of Ti and N. The variation in the N content before and after the ESR process changed little in this study, as shown in Table 3. Therefore, the Ti content has a greater influence in the formation of TiN. In Incoloy825, a typical high-Ti and low-Al alloy, the loss of Ti is profound. This can be seen in Table 3: the loss of Ti was 50% on average, mainly because of the exchange reaction [33,34]. The Ti is more likely to react with oxide in the slag, and the formation of TiN is more difficult. Therefore, most of the TiN inclusions originated from the consumable electrode.
3.5. Evolution Mechanism of Oxide Inclusions during the ESR Process
The obtained oxide inclusion in the electrode was Al2O3 surrounded by a TiN layer, and the oxide inclusions after the ESR process were MgO-Al2O3 and MgO-Al2O3 surrounded by a TiN layer. The formation of MgO-Al2O3 in the inclusions (both MgO-Al2O3 and MgO-Al2O3 surrounded by a TiN layer) is due to the reaction of the solution of Al in the alloy, MgO in the slag and Al2O3 in the inclusions. The (MgO) in the slag was first transformed into [Mg] in the steel, as shown in Equation (9), then [Mg] reacted with the (Al2O3) in the inclusions, as shown in Equation (10), and the (MgO) in the inclusions appeared. Combining Equations (9) and (10), we can find that the (MgO) in the slag transformed into (MgO) in the inclusions through (Al2O3), as shown in Equation (11), and the Gibbs energy was 0 [35]. Therefore, the inclusions of Al2O3 transformed to a spinel solid solution. Many researchers [36,37] have found that MgO-Al2O3 has a high potential for acting as a TiN nucleation site because of the low disregistry. The existing form of Al2O3 inclusions was Al2O3 with a TiN layer in this study, which means that the formation of an inclusion of MgO-Al2O3 surrounded by a TiN layer was from an inclusion of the Al2O3 surrounded by a TiN layer, as shown in Equations (9)–(11). With regard to the MgO-Al2O3 inclusion, it originated from MgO-Al2O3 surrounded by a TiN layer. When the TiN was removed, the MgO-Al2O3 inclusion surrounded by a TiN layer changed to MgO-Al2O3.
From Figure 5, it can be seen that there is little difference in the proportion of different inclusions from the remelted ingots. This means that the concentration of TiO2 in slag has little effect on the relative proportion of inclusions in remelted ingots. However, the sizes of inclusions increased with an increase in TiO2 in the slag, as shown in Figure 3. The size of TiN inclusions in the consumable electrode and remelted ingots was 0 to 2 μm, indicating that the larger inclusions were MgO-Al2O3 and MgO-Al2O3 + TiN, caused by TiO2. This might be because the Al2O3 increases with an increase in TiO2 in the slag due to the reaction (1), and Al2O3 causes the transformation of Mg to MgO, as shown in Equation (9) [30]. The increase in Al2O3 and MgO causes the formation and growth of MgO-Al2O3. To make the size of inclusions in remelted ingots of Incoloy825 smaller, the TiO2 and MgO contents in the slag should be controlled.
4. Conclusions
Three 50 kg-scale electroslag remelting experiments were performed with different TiO2 contents in the slag. The evolution of inclusions in Incoloy825 alloy was investigated, and the conclusions are summarized as follows:
- (1).
- The inclusions in the consumable electrode were TiN, TiS and Al2O3 with a surrounding TiN layer, and the sizes were mainly 1 to 3 μm. After the electroslag remelting process, the inclusions were TiN, MgO-Al2O3 and MgO–Al2O3 surrounded by TiN, and the sizes were mainly 1 to 4 μm.
- (2).
- The sizes of the inclusions increased with the TiO2 contents in the slag, but the types of inclusions did not vary with them. When the TiO2 contents were constant, the average size of inclusions increased from 2.5 to 4.4 μm with the increase in the height of the ingots.
- (3).
- The inclusions of MgO-Al2O3 surrounded by a TiN layer and MgO-Al2O3 formed as a result of the inclusions of Al2O3 surrounded by a TiN layer. The MgO and Al2O3 in the slag played an important role in generating spinel.
- (4).
- TiS inclusions in the consumable electrode dissolved during the ESR process. The TiN inclusions could not be removed from the tip of the electrode, but part of the TiN dissociated during the reaction between the liquid metal and slag. Most of the TiN inclusions originated from the consumable electrode.
- (5).
- The electroslag remelting process using a high-temperature Ni-based alloy and low-fluoride slag CaF2-CaO-Al2O3-TiO2-MgO-SiO2-(FeO) was investigated. The results show that controlling the MgO and TiO2 contents could decrease the generation of inclusions to meet the industry’s needs.
Author Contributions
Conceptualization, J.J. and Z.Z.; methodology, J.J.; software, Z.Z. and K.Y.; validation, J.J., K.Y. and Y.G.; formal analysis, J.J.; investigation, Z.Z. and Q.Z.; data curation, J.J.; writing—original draft preparation, Z.Z.; writing—review and editing, Q.Z., J.J. and K.Y.; visualization, Z.Z.; supervision, J.J. All authors have read and agreed to the published version of the manuscript.
Funding
This research was funded by the National Natural Science Foundation of China, grant number 51774225.
Institutional Review Board Statement
Not applicable.
Informed Consent Statement
Not applicable.
Data Availability Statement
Not applicable.
Conflicts of Interest
The authors declare no conflict of interest.
References
- Zhu, Q.T.; Li, J.; Zhang, J.; Shi, C.B.; Li, J.H.; Huang, J. Precipitation Mechanism and Reduction of Amount of Primary Carbides During Electroslag Remelting of 8Cr13MoV Stainless Steel. Metall. Mater. Trans. B 2019, 50, 1365–1377. [Google Scholar] [CrossRef]
- Hou, D.; Wang, D.Y.; Jiang, Z.H.; Qu, T.P.; Wang, H.H.; Dong, J.W. Investigation on Slag-Metal-Inclusion Multiphase Reactions During Electroslag Remelting of Die Steel. Metall. Mater. Trans. B 2021, 52, 478–493. [Google Scholar] [CrossRef]
- Schneider, R.S.E.; Molnar, M.; Kloesch, G.; Schueller, C. Effect of the Al2O3 Content in the Slag on the Chemical Reactions and Nonmetallic Inclusions during Electroslag Remelting. Metall. Mater. Trans. B 2020, 51, 1904–1911. [Google Scholar] [CrossRef]
- Aytekin, H.; Akçin, Y. Characterization of borided Incoloy 825 alloy. Mater. Des. 2013, 50, 515–521. [Google Scholar] [CrossRef]
- Sun, N.; Wen, C.; Liu, Z.L.; Liu, X.Q. Effect of Al, Ti contents on the microstructure and corrosion resistance of as-forged Incoloy 825 alloy. Rare Metal Mater. Eng. 2018, 47, 860–866. [Google Scholar]
- Shi, C.B.; Park, J.H. Evolution of oxide inclusions in Si-Mn-killed steel during protective atmosphere electroslag remelting. Metall. Mater. Trans. B 2019, 50, 1139–1147. [Google Scholar] [CrossRef]
- Wang, H.; Li, J.; Shi, C.B.; Qi, Y.F.; Dai, Y.X. Formation and Evolution of Non-Metallic Inclusions in Calcium Treatment H13 Steel during Electroslag Remelting Process. ISIJ Int. 2019, 59, 828–838. [Google Scholar] [CrossRef]
- Li, M.G.; Matsuura, H.; Tsukihashi, F. Evolution of TiS and TiN in Fe-40 MassPctNi Austenitic Alloy During Heating at 1273 K (1000 C). Metall. Mater. Trans. B 2019, 50B, 2993–3001. [Google Scholar] [CrossRef]
- Siddiqui, M.I.H.S.; Alshehri, H.; Jamel, O.; Masood, A.A.; Dan, D. Computational Fluid Dynamics (CFD) Simulation of Inclusion Motion under Interfacial Tension in a Flash Welding Process. Metals 2021, 11, 1073. [Google Scholar] [CrossRef]
- Sheng, D.Y. Mathematical Modelling of Multiphase Flow and Inclusion Behavior in a Single-Strand Tundish. Metals 2020, 10, 1213. [Google Scholar] [CrossRef]
- Kroll-Rabotin, J.S.; Gisselbrecht, M.; Ott, B.; May, R.; Fröhlich, J.; Bellot, J.P. Multiscale Simulation of Non-Metallic Inclusion Aggregation in a Fully Resolved Bubble Swarm in Liquid Steel. Metals 2020, 10, 517. [Google Scholar] [CrossRef]
- Kikuchi, N.; Nabeshima, S.; Kishimoto, Y.; Matsushita, T.; Sridhar, S. Effect of Ti De-oxidation on Solidification and Post-solidification Microstructure in Low Carbon High Manganese Steel. ISIJ Int. 2007, 47, 1255–1264. [Google Scholar] [CrossRef]
- Yin, X.; Sun, Y.H.; Yang, Y.D.; Bai, X.F.; Barati, M.; Mclean, A. Formation of Inclusions in Ti-Stabilized 17Cr Austenitic Stainless Steel. Metall. Mater. Trans. B 2016, 47, 3274–3284. [Google Scholar] [CrossRef]
- Li, J.Y.; Cheng, G.G.; Ruan, Q.; Pan, J.X.; Chen, X.G. Evolution Mechanism of Oxide Inclusions in Titanium-Stabilized AISI 443 Stainless Steel. Metall. Mater. Trans. B. 2018, 49, 2357–2369. [Google Scholar] [CrossRef]
- Shi, C.B.; Zheng, D.L.; Shin, S.H.; Li, J.; Cho, J.W. Effect of TiO2 on the viscosity and structure of low-fluoride slag used for electroslag remelting of Ti-containing steels. Int. J. Miner. Metall. Mater. 2017, 24, 18–24. [Google Scholar] [CrossRef]
- Ju, J.T.; Yang, K.S.; Zhu, Z.H.; Chang, L.Z. Effect of CaF2 and CaO/Al2O3 on viscosity and structure of TiO2-bearing slag for electroslag remelting. J. Iron Steel Res. Int. 2021. [Google Scholar] [CrossRef]
- Ju, J.T.; Zhu, Z.H.; Yang, K.S.; Ji, G.H.; An, J.L.; Shi, C.B. Control of Al and Ti Contents During Electroslag Remelting of High-Temperature Ni-based Alloys. Rare Metal Mater. Eng. 2021, 50, 3550–3561. [Google Scholar]
- Hou, D.; Liu, F.B.; Qu, T.P.; Jiang, Z.H.; Wang, D.Y.; Dong, Y.W. Behavior of Alloying Elements during Drawing-Ingot-Type Electroslag Remelting of Stainless Steel Containing Titanium. ISIJ Int. 2018, 58, 876–885. [Google Scholar] [CrossRef]
- Sebastian, F.M.; Francisco, R.V.; Modesto, C.; Alberto, Q. Thermodynamic study of exchange reactions in the manufacturing of microalloyed steels by the ESR process. Steel Res. Int. 1998, 69, 312–317. [Google Scholar]
- Karasev, A.; Suito, H. Quantitative evaluation of inclusion in deoxidation of Fe-10 mass pct Ni alloy with Si, Ti, Al, Zr, and Ce. Metall. Mater. Trans. B 1999, 30, 249–257. [Google Scholar] [CrossRef]
- The Japan Society for the Promotion of Science. The 19th Committee on Steelmaking: Steelmaking Data Sourcebook; Gordon and Breach Science Publishers: New York, NY, USA, 1988; p. 68. [Google Scholar]
- Park, J.H.; Lee, S.B.; Kim, D.S.; Pak, J.J. Thermodynamics of Titanium Oxide in CaO–SiO2–Al2O3–MgOsatd–CaF2 Slag Equilibrated with Fe–11mass%Cr Melt. ISIJ Int. 2009, 49, 337–342. [Google Scholar] [CrossRef]
- Cho, S.W.; Sutio, H. Magnesium Deoxidation and Nitrogen Distribution in Liquid Nickel Equilibrated with CaO-Al2O3-MgO Slags. ISIJ Int. 1994, 34, 746–754. [Google Scholar] [CrossRef][Green Version]
- Huang, X. Iron and Steel Metallurgy Principle, 4th ed.; Metallurgical Industry Press Publishers: Beijing, China, 2014. [Google Scholar]
- Pak, J.J.; Kim, D.S. Thermodynamics of titanium, nitrogen and oxygen in Ti added liquid steels. In Proceedings of the Asia Steel International Conference, 9–11 May 2006; The Iron and steel Institute of Japan: Fukuoka, Japan, 2006; pp. 540–545. [Google Scholar]
- Yoshikawa, T.; Morita, K. Influence of alloying elements on the thermodynamic properties of titanium in molten steel. Metall. Mater. Trans. B 2007, 38, 671–680. [Google Scholar] [CrossRef]
- Kim, W.Y.; Jo, J.O.; Chung, T.I.; Kim, D.S.; Pak, J.J. Thermodynamics of Titanium, Nitrogen and TiN Formation in Liquid Iron. ISIJ Inter. 2007, 47, 1082–1089. [Google Scholar] [CrossRef]
- Jin, P.L.; Shang, D.L.; Wang, G.C.; Xiao, Y.Y.; Cao, L. Precipitation of TiS in Al–Ti Simultaneously Deoxidized Steel. Steel Res. Int. 2021, 92, 200614. [Google Scholar] [CrossRef]
- Kim, W.Y.; Lee, C.O.; Yun, C.W.; Pak, J.J. Effect of Chromium on Nitrogen Solubility in Liquid Fe–Cr Alloys Containing 30 mass% Cr. ISIJ Int. 2009, 49, 1668–1672. [Google Scholar] [CrossRef]
- Zheng, D.L.; Li, J.; Shi, C.B.; Zhang, J.; Geng, L.M. Evolution of TiN and Oxide Inclusions in Ti-containing Fe-25Ni-15Cr Alloy during Electroslag Remelting. ISIJ Int. 2020, 60, 1577–1585. [Google Scholar] [CrossRef]
- Yang, L.; Cheng, G.G.; Li, S.J.; Zhao, M.; Feng, G.P. Generation Mechanism of TiN Inclusion for GCr15SiMn during Electroslag Remelting Process. ISIJ Int. 2015, 55, 1901–1905. [Google Scholar] [CrossRef]
- Turkdogan, E.T. Physical Chemistry of High Temperature Technology; Academic Press: New York, NY, USA, 1980; p. 81. [Google Scholar]
- Hou, D.; Jiang, Z.H.; Dong, Y.W.; Gong, W.; Cao, Y.L.; Cao, H.B. Effect of Slag Composition on the Oxidation Kinetics of Alloying Elements during Electroslag Remelting of Stainless Steel: Part-1 Mass-transfer Model. ISIJ Int. 2017, 57, 1400–1409. [Google Scholar] [CrossRef]
- Hou, D.; Jiang, Z.H.; Dong, Y.W.; Gong, W.; Cao, Y.L.; Cao, H.B. Effect of Slag Composition on the Oxidation Kinetics of Alloying Elements during Electroslag Remelting of Stainless Steel: Part-2 Control of Titanium and Aluminum Content. ISIJ Int. 2017, 57, 1410–1419. [Google Scholar] [CrossRef]
- Webler, B.A.; Pistorius, P.C. A review of steel processing considerations for oxide cleanliness. Metall. Mater. Trans. B 2020, 51B, 2437–2452. [Google Scholar] [CrossRef]
- Pervushin, G.V.; Suito, H. Precipitation Behavior of TiN in Fe–10mass%Ni Alloy during Solidification and Isothermal Holding at 1400 °C. ISIJ Int. 2001, 41, 728–737. [Google Scholar] [CrossRef]
- Park, J.S.; Park, J.H. Effect of Mg–Ti Deoxidation on the Formation Behavior of Equiaxed Crystals During Rapid Solidification of Iron Alloys. Steel Res. Int. 2014, 85, 1303–1309. [Google Scholar] [CrossRef]
Publisher’s Note: MDPI stays neutral with regard to jurisdictional claims in published maps and institutional affiliations. |
© 2022 by the authors. Licensee MDPI, Basel, Switzerland. This article is an open access article distributed under the terms and conditions of the Creative Commons Attribution (CC BY) license (https://creativecommons.org/licenses/by/4.0/).