Abstract
This article is dedicated to quantitatively and systematically revealing the changes of mechanical properties and bake hardening properties of AA6014 alloy during six-month natural aging in detail. Three directions (0, 45, and 90° relative to the rolling direction) of the aluminum alloy sheets and 16 time points within six months were selected to conduct experiments. The change trend of six mechanical properties (0.2% offset yield strength, ultimate tensile strength, plastic extension at maximum force, elongation after fracture, and strain hardening exponent) were obtained by a large number of micro-hardness measurements and tensile tests. The results show that elongations along the three directions are basically the same and do not drop significantly with the progress of natural aging but fluctuate within a certain range. The trends of the n value during natural aging before and after bake hardening are opposite and bake hardening leads to ~0.07 decrease of the n value. The PLC phenomenon disappears after 90 days of natural aging, and the yield strengths along the three directions also stabilize; thus, it can be inferred that the cluster changes tend to stabilize after 90 days natural aging. The large and systematic dataset are clearly and intuitively presented, which can not only be used to provide data reference for industrial production of automobile manufacturers but also be used to reveal the microscopic mechanism of the natural aging process.
1. Introduction
With the current increasingly severe global environmental problems and increasingly stringent automotive exhaust emission standards, reducing vehicle weight has become one of the urgent tasks for all automobile manufacturers [1]. Increasing the use of lightweight alloys materials in automotive parts and replacing steel with lightweight alloys are the effective and immediate methods to reduce the vehicle weight [2,3,4]. AA6014 alloy is currently the mainstream aluminum alloy material used in the exterior panels of middle and high-end passenger cars due to its excellent hemming property and good corrosion resistance, so it is necessary to conduct in-depth research on it.
When the Al-Mg-Si alloys are placed at room temperature, as time goes by, mechanical properties will change significantly and always results in a delayed and compromised artificial aging (AA) hardening behavior [5,6,7]. This phenomenon is often referred to as the “negative effect” of the natural aging (NA) characteristic of Al-Mg-Si alloy. Banhart et al. pointed out that the natural aging process was of unexpected complexity in Al-Mg-Si alloys [8]. The nano-precipitates of the Al-Mg-Si alloys have an important influence on the mechanical properties. The widely accepted precipitation sequence of Al-Mg-Si alloys is described as: super-saturated solid solution (SSSS)→clusters/GP zones→β″→β′→β [9,10,11]. Recently, the details of the precipitation sequence have been continuously studied and explained clearly. Fallah et al. [12] investigated the early-stage precipitation phenomenon by atom probe tomography (APT) and phase field crystal (PFC) modeling and concluded that the earliest precipitates appear as finely-dispersed Si-rich clusters which gradually undergo a simultaneous coarsening and Mg-enrichment regardless of alloy composition and aging history. Liu et al. [13] revealed that applying natural aging prior to artificial aging can gradually modify and eventually reverse the precipitation pathways, such that the β′-precipitates become dominating in the alloy upon aging at 180 °C, whereas the β″-precipitates are prevailing upon aging at 250 °C. Yasuhiro et al. [14] studied the effects of NA after PA on clustering and bake hardening behavior in an Al-Mg-Si alloy by APT analysis and revealed that larger Si-rich clusters increase in number after prolonged NA. The long-term NA after PA is believed to promote the preferential aggregation of solute Si toward clusters formed during PA rather than the independent formation of Si-based clusters. The deterioration of the bake hardening (BH) response appears to be due to the increase of the Si-rich clusters.
The microstructure determines the mechanical properties. Banhart et al. [15,16] thoroughly investigated the hardness change during NA under different pre-aging (PA) conditions and achieved the purpose of tailoring PA conditions to minimize hardness after a given NA time while maximizing paint baking response. Yasuo et al. [17] researched the effects of NA on bake hardening behavior of Al-Mg-Si alloys with multi-step aging process and concluded that the decrease of the bake hardening response with increasing NA time was markedly higher in the later stage of bake hardening than in the early stage, which was proved by three NA time points (one day, one month, and four months) in his experiments. However, research that quantitatively describes the changes of mechanical properties and bake hardening properties of Al-Mg-Si alloys in detail during a long period of time is scarce.
Most automobile manufacturers set six months as the validity period of aluminum alloy sheets. Therefore, micro-hardness measurement and tensile test are utilized as the main methods in the research. Three directions (0, 45, and 90° relative to the rolling direction) of the aluminum alloy sheets and 16 time points (the 3rd, 5th, 7th, 14th, 21st, 30th, 45th, 60th, 75th, 90th, 105th, 120th, 135th, 150th, 165th, and 180th day during NA process) were selected to conduct experiments in order to quantitatively and systematically reveal the changes of mechanical properties and bake hardening properties of AA6014 alloy during the six-month validity period. The data can provide a reference on formulating an appropriate storage time for AA6014 aluminum alloy sheets to automobile manufacturers and can also be used to further research the cluster change mechanism during the natural aging process.
2. Materials and Methods
2.1. Heat Treatment Process
The commercial cold-rolled AA6014 sheets produced by Novelis were used as raw material. Table 1 shows the chemical composition of this alloy.

Table 1.
The chemical composition of AA6014 alloy.
Figure 1a is the schematic diagram of the heat treatment process used in this article to investigate the effect of NA on mechanical properties and bake hardening properties, which can be divided into four stages. The first stage is solution treatment (540 °C, 60 min) and quench by ice water. The cooling rate of 540 °C-AA6014 alloy sheets at room temperature is about 4 °C/s. Thus, the quenching transfer time should be less than 8 s to ensure that the quenching temperature is above 500 °C. Then, PA treatment (85 °C, 8 h) is conducted. The time interval between quenching and PA should be less than 2 min. When the PA treatment is finished, AA6014 alloy is placed at room temperature for six-month NA process. For the tensile samples used in investigating the effect of NA on the bake hardening properties, bake hardening treatment (180 °C, 30 min) is conducted after the selected NA time. It is worth emphasizing that 2% pre-tensile is conducted on the tensile samples to simulate the stamping deformation of the sheet before bake hardening. The heat treatment process of each part is quite different, so the heat treatment equipment must be reasonably selected according to different treatment characteristics. Figure 2 shows the heat treatment equipment.
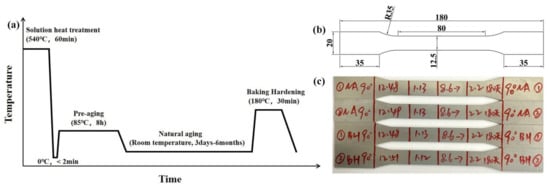
Figure 1.
Schematic diagram of heat treatment process (a); specific size of the tensile sample in mm (b); and a group of tensile samples after NA for 180 days along 90° direction (c).
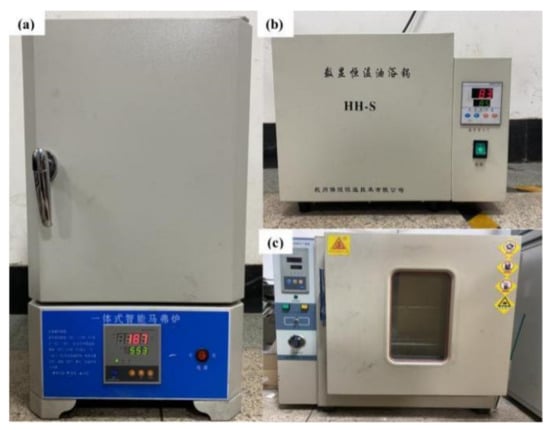
Figure 2.
Resistance furnace for solution treatment (a); oil bath furnace for pre-aging treatment (b); and 101A-18T electric heating drying oven for baking hardening (c).
2.2. Experiments
At the selected NA time points (the 3rd, 5th, 7th, 14th, 21st, 30th, 45th, 60th, 75th, 90th, 105th, 120th, 135th, 150th, 165th and 180th day during the NA process), micro-hardness measurements and tensile tests were carried out to test the mechanical properties and bake hardening properties along 0, 45, and 90° direction. The specific tensile specimen size was designed according to ASTM B 557M-2010, as shown in Figure 1b. Six mechanical properties (hardness, 0.2% offset yield strength (Rp0.2), ultimate tensile strength (Rm), plastic extension at maximum force (Ag), elongation after fracture(A), and strain hardening exponent (n-value) were used to illustrate the changes of AA6014 alloy mechanical properties and bake hardening properties during NA. For the tensile specimens without bake hardening, the fitting selection range of n value was 10%~Ag. For the tensile specimens that undergo bake hardening, the fitting selection range of n value was 5%~Ag. Tensile speed was set to 1.5 mm/min and the strain rate was 0.0005 s−1. The frequency of collecting data point in the tensile test was 100 Hz. The universal testing machine was equipped with an electronic extensometer with a gauge length of 50 mm and a measuring range of 25 mm. For the micro-hardness measurements, the load was 1.96 N and the dwell time was 15 s. Each datum was measured seven times. After removing the maximum and minimum values, the remaining were averaged. The equipment for tensile tests and hardness measurements are shown in Figure 3.
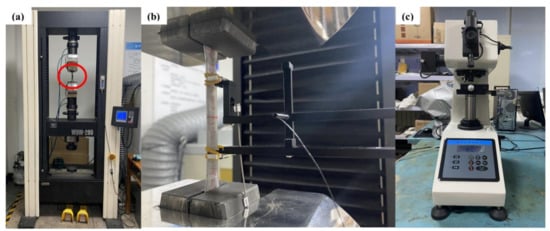
Figure 3.
WDW-200 electronic universal testing machine (a); extensometer (b); and micro-Vickers hardness tester (c).
Figure 1c shows the schematic diagram of the group of tensile samples after NA for 180 days along 90° direction. At each time point, to investigate the effect of NA on mechanical properties and bake hardening properties, two tensile specimens were selected as a group, respectively. Due to the long experiment period, many data could be obtained. The details of mechanical properties obtained at each time point along one direction are illustrated in Table 2. The labels of the experimental data obtained in the study of the effect of NA on the mechanical properties and bake hardening properties are, respectively, distinguished by NA and BH.
Table 2.
Data obtained at each time point along one direction.
Before bake hardening, the tensile samples needed to go through 2% pre-tensile. Therefore, four data points of Rp0.2 could be obtained at each time point. The remaining four mechanical properties each obtained two data points at each selected time point. Totally, 192 Rp0.2 data, 96 Rm data, 96 Ag data, 96 A data, and 96 n value (10%~Ag) data were obtained for investigating the changes of mechanical properties during NA. For the research on the effect of NA on bake hardening properties, 96 data points were obtained for each mechanical property. When the last time point during NA was finished, dot-line graphs for each mechanical property data along each direction were drawn to clearly get the trend. Three different formula models were used to fit the 196 Rp0.2 data points during the NA process. The results show that the three formulas all have good fitting effects along the three directions.
3. Results
3.1. The Changes of Mechanical Properties during Six Months of NA
3.1.1. Hardness
Figure 4 shows the hardness change curve of AA6014 alloy with and without PA treatment within six months. An enlarged the hardness change curve within the first 14 days of NA is shown for a better presentation. For the samples without PA treatment, when the solution treatment is finished, the hardness is 60 HV. In the first month of NA, the hardness increases rapidly to 81 HV; the percentage of increase is 34%. In the subsequent five months of NA, the hardness increases slowly. At the end of the NA process, the hardness is 83 HV; the percentage of increase is only 2.3%. This rapid increase in hardness, and the subsequent marginal process has been detected and discussed in detail [2,4,8,15]. After solution treatment and quenching, the alloy is in a supersaturated state. At this time, there are a lot of supersaturated solute atoms and quenching vacancies in the alloy, which is in an extremely unstable state. Therefore, at this time, Mg and Si atoms extremely easily diffuse and combine with each other to form clusters. Many clusters grow rapidly, and they have strong shear resistance with the matrix, resulting in a rapid increase in hardness within one month of NA. With the extension of NA, the vacancies and supersaturated solute atoms are gradually consumed. Atoms are not easily diffused, and clusters are difficult to form, so the macroscopic manifestation is that the hardness no longer increases rapidly. However, due to the change of precipitation phases, as the NA progresses, the hardness will still show a slow upward trend. For the samples with PA treatment, the hardness is 66 HV when the PA treatment is completed. In the first three months of NA, the hardness reaches 81 HV, which is similar to the hardness of the without PA treatment sample after one month of NA. Finally, the hardness reaches at 84 HV. Through the formation of PA clusters, PA treatment can effectively resist the formation of NA clusters, slow down the hardness change trend during the NA process, and at the same time ensure the bake hardening performance. Figure 4 shows that, when PA treatment is finished, the hardness is 66 HV, which is bigger than the hardness of the sample after quenching. This is due to the strengthening effect of PA clusters. Subsequently, with the rapid increase in the NA hardness, the PA hardness increase rate is lower because the vacancies and solute atoms in the PA sample have been partially consumed during the PA treatment. Banhart [14] found that NA stability (resistance to clustering) is improved by prolonging PA time or by lowering PA temperature. The PA treatment selected in the research is 85 °C and 8 h, which is compatible with a long PA time and low PA temperature. Therefore, it effectively maintains the NA stability, making the hardness of NA and PA specimens basically the same at the third month of NA.
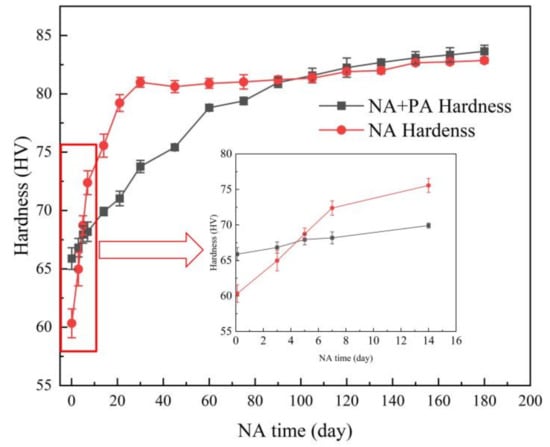
Figure 4.
Hardness change curves of AA6014 alloy with and without pre-aging (PA) treatment within six months.
3.1.2. Tensile Tests at Room Temperature
Sixteen time points (the 3rd, 5th, 7th, 14th, 21st, 30th, 45th, 60th, 75th, 90th, 105th, 120th, 135th, 150th, 165th, and 180th day of NA) were selected to perform tensile tests at room temperature along 0, 45, and 90° directions to quantitatively describe the changes of mechanical properties of AA6014 alloy during the six-month period of NA. Figure 5 shows the engineering stress–strain curves along 0° direction at the different NA times. It can be seen that the elastic deformation sections of all tensile curves basically coincide. Therefore, it can be concluded that NA has no effect on elastic deformation. In the plastic deformation stage, as shown in Figure 5a, the curves appear jagged, and the degree of jaggedness gradually becomes smoother with the extension of the NA time. However, the curves show no obvious jaggedness in Figure 5b. This kind of zigzag curve is a manifestation of the material’s plastic instability and repeated yielding. This kind of plastic instability is called the Portevin–Le Chatelier (PLC) phenomenon [18,19]. The appearance of the zigzag pattern stems from the repeated pinning and getting rid of the pinning of dislocations and solute atoms. This interaction between solute atoms and dislocations is called dynamic strain aging. Figure 5 shows that, within 60 days of NA, AA6014 alloy will have a PLC effect under the condition of a strain rate of 0.0005 s−1, which reflects the continuous change of the microstructure of the alloy. After 90 days of NA, the PLC effect almost disappears, reflecting the stability of the alloy’s microstructure. According to the results of the tensile curves along 45 and 90° directions, the zigzag shape of the tensile curves is similar to the 0° direction. Therefore, it can be concluded that, in the first 90 days of NA, under the condition of 0.0005 strain rate, AA6014 alloy will present the PLC effect, and, with the extension of NA, the PLC effect will gradually become weaker. When the NA time exceeds 90 days, the PLC effect almost disappears.
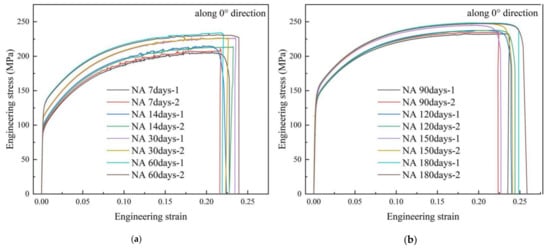
Figure 5.
Engineering stress–strain curves along 0° direction at the different NA time: 7–60 days (a); 90–180 days (b).
3.1.3. The Changes of Rp0.2, Rm, and Rp0.2/Rm during Six Months of NA along 0°, 45°, and 90° Directions
Figure 6 shows the changes of Rp0.2 and Rm along 0, 45, and 90° directions within six months in detail. It can be seen that the strength increases significantly along the three directions with the extension of NA. From the 3rd day to the 180th day of NA, along the three directions, Rp0.2, respectively, increases from 98 to 145 MPa, from 94 to 139 MPa, and from 95 to 138 MPa. The increments are 47, 45, and 43. The percent of increase are 47.7, 47.34, and 45.53%. As for the Rm along the three directions, Rm rises from 210 to 249 MPa, from 204 to 237 MPa, and from 206 to 236 MPa. The increments are 39, 33, and 30 MPa. The percent of increase are 18.62, 16.18, and 14.6%. Along 0 and 90° directions, Rp0.2 and Rm increase rapidly during the first two months of NA, while Rp0.2 and Rm increase rapidly only during the first month of NA and then slowly along 45° direction. Rp0.2 and Rm along 0° direction are higher than those along 45 and 90° directions. The strengths along 45 and 90° directions are basically the same. For the effect of NA on mechanical properties, both the increment and the percent of increase along 0° direction is higher than the those in the other two directions, and the 45° direction has a larger rise than the 90° direction. It has been proven that, apart from cluster formation and changes related to vacancies, no other microstructural changes occur at room temperature [6,7,20]. Therefore, the room temperature hardening is due to the formation of clusters and/or co-clusters. With the extension of NA, co-clusters can grow up and the larger co-clusters is sometimes referred to as coherent zones, or pre-β″ [21]. Therefore, the rising speed of the strength along the three directions reflects the changes of the clusters on the microscopic level. As mentioned in Section 3.1.2, through the comparison of the engineering stress–strain curves, the PLC effect almost disappears when the NA exceeds 90 days, which proves the stability of the microstructure at the micro level. During 90–180 days of NA, the Rp0.2 along the three directions only increases 9, 2, and 10 MPa, respectively. Therefore, it can also reflect the gradual weakening of the atoms clustering behavior.
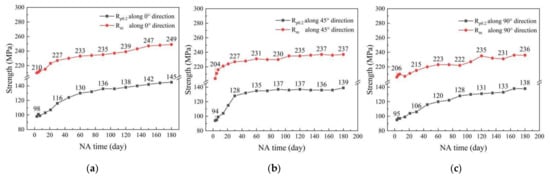
Figure 6.
The change curves of Rp0.2 and Rm along 0° (a), 45° (b), and 90° (c) directions during six months of NA.
Figure 7 shows the change curves of Rp0.2/Rm along the three directions with the extension of the NA time. The values of Rp0.2/Rm all increase at first and then maintain approximately constant. Along 0 and 90° direction, the values are all less than 0.5 within the first month of NA. Throughout the whole experiment period, the average values are 0.537, 0.545 and 0.530 along the three directions. All the values of Rp0.2/Rm are between 0.46 and 0.59.
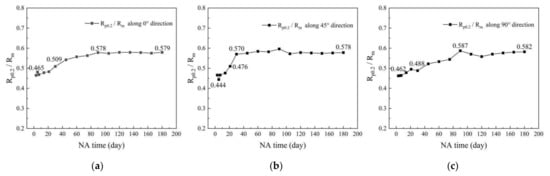
Figure 7.
The change curves of Rp0.2/Rm along 0° (a), 45° (b), and 90° (c) directions during six months of NA.
3.1.4. The Changes of Ag and A during Six Months of NA along 0, 45, and 90° Directions
Figure 8 shows the change curves of plastic extension at maximum force (Ag) and elongation after fracture (A) during six months of NA. It can be seen that, along the three directions, the elongation does not decrease significantly with the extension of NA but shows a wave dynamic potential in a certain range. Along 0° direction, the average value of Ag during the entire validity period of AA6014 alloy is 21.47%. The maximum value is 22.73%, which appears on the 75th day of NA. The minimum value is 19.27%, which appears on the 150th day of NA. The average value of A is 23.45%. The maximum value is 25.13%, which appears on the 180th day of NA. The minimum value is 22.26%, which appears on the seventh day of NA. Along 45° and 90° directions, the average value of Ag during the entire validity period of AA6014 alloy is 21.55% and 21.73%. Ag is 18.81–24.02% and 19.66–24.34%. The average value of A is 23.30 and 23.27%. A is 20.84–25.84% and 20.77–24.93%. The elongations along the three directions are basically the same.
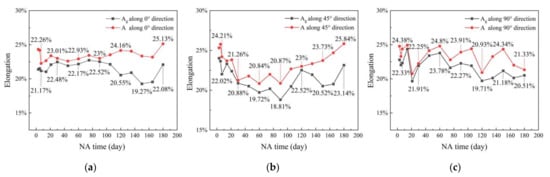
Figure 8.
The change curves of Ag and A along 0° (a), 45° (b), and 90° (c) directions during six months of NA.
3.1.5. The Changes of n Value during Six Months of NA along 0°, 45°, and 90° Directions
Figure 9 shows that the n values along the three directions all show a downward trend with the extension of NA. Along 0° direction, the average of the n value in the entire NA period is 0.2403. The maximum value is 0.2732, which appears on the third day of NA, and the minimum is 0.2155, which appears on the 135th day of NA. The overall range of variation is 0.0578. Along 45° direction, the average of the n value in the entire NA period is 0.2360. The maximum value is 0.2768, which appears on the third day of NA, and the minimum is 0.2135, which appears on the 135th day of NA. The overall range of variation is 0.0633. Along 90° direction, the average of n value in the entire NA period is 0.2445. The maximum value is 0.2770, which appears on the third day of NA, and the minimum is 0.2196, which appears on the 135th day of NA. The overall range of variation is 0.0574. Comparing the three directions, the n value along the 90° direction is the largest, followed by the 0° direction, and the n value along the 45° direction is the smallest.
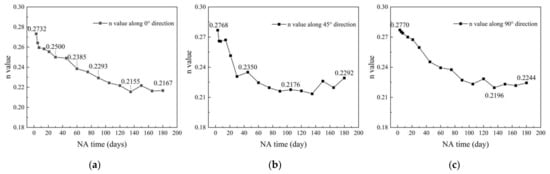
Figure 9.
The change curves of n value along 0° (a), 45° (b), and 90° (c) directions during six months of NA.
3.2. The Changes of Bake Hardening Properties during Six Months of NA
3.2.1. Tensile Tests at Room Temperature after Bake Hardening
Figure 10 shows the tensile curves at room temperature along 0° direction, which are obtained after different NA times. The figure shows that, no matter the length of the NA time, the curve does not appear jagged, indicating that there is no PLC phenomenon happening after bake hardening. The other two directions are the same as the 0° direction.
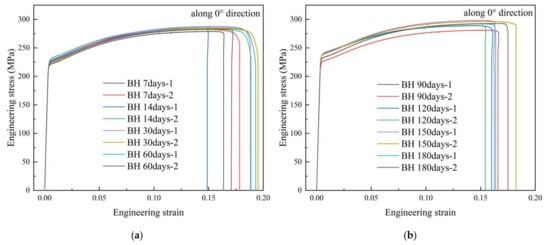
Figure 10.
Bake hardening tensile curves obtained after different NA time along 0° direction: 7–60 days (a); 90–180 days (b).
3.2.2. The Changes of Rp0.2, Rm and Rp0.2/Rm after Bake Hardening along 0, 45, and 90° Directions
Figure 11 shows the change curves of Rp0.2 and Rm obtained after bake hardening along the three directions with different NA times. It is worth emphasizing that the NA time here is the time period between PA treatment and bake hardening. It can be seen that the trends of Rp0.2 and Rm are similar along each direction but are different along the three directions. Along 0° direction, Rp0.2 obtained after bake hardening remains basically unchanged at ~224 MPa within 90 days of NA and then increases to 239 MPa within 90–120 days of NA. After that, Rp0.2 obtained after bake hardening keeps at ~239 MPa for next one month, and finally slightly decreases to 233 MPa. The maximum Rp0.2 obtained after bake hardening is 239 MPa, after undergoing 120 days of NA before bake hardening; the minimum value is 223 MPa, after undergoing seven days of NA. Rm obtained after bake hardening keeps at ~283 MPa within 90 days of NA, and then increases to 298 MPa within 90~150 days of NA. Finally, it slightly decreases to 293 MPa. The maximum Rm obtained after bake hardening is 298 MPa, after undergoing 150 days of NA; the minimum is 280 MPa, after undergoing five days of NA. Along 45° direction, Rp0.2 and Rm obtained after bake hardening show a slightly downward trend during the first four months of NA and then keep basically unchanged. The maximum Rp0.2 obtained after bake hardening is 237 MPa, after undergoing three days of NA; the minimum value is 221 MPa, after undergoing 120 days of NA. The maximum Rm obtained after bake hardening is 296 MPa, after undergoing three days of NA; the minimum value is 281 MPa, after undergoing 90–120 days of NA. Along 90° direction, Rp0.2 and Rm obtained after bake hardening show a wave trend during the whole research period. All Rp0.2 data obtained after bake hardening are between 215 and 233 MPa. All Rm data obtained after bake hardening are between 275 and 289 MPa. At present, there are many studies on the increment of strength before and after bake hardening. However, few studies on the strength after bake hardening can be found. The trend of strength after bake hardening is closely related to the precipitation of nano-sized precipitates, and it is also related to the texture change after bake hardening. Figure 11 shows that, no matter the length of NA time before bake hardening and no matter the direction, the Rp0.2 after bake hardening can reach above 215 MPa, and the Rm can reach above 289 MPa. Comparing along the three directions, the order of strength arrangement is the same as the order before bake hardening. The strength increment is often used to evaluate the bake hardening properties. There are very limited data that give the specific value of bake hardening strength. NA clusters (Cluster 1) are considered to have a very wide Mg/Si ratio and remain stable during bake hardening, and they cannot transform to β″, which is the most important strengthening phase. Through the PA treatment, the Mg/Si ratio of PA clusters become very close to β″ phase. Therefore, PA clusters can be quickly converted into β″ during bake hardening. This leads to a rapid increase in strength after bake hardening [22,23]. However, according to the existing data, the strength change after bake hardening is not monotonous, but fluctuating, which indicates that there may be many problems in the cluster changes during the bake hardening that have not been clarified. At the same time, the bake hardening parameters in this study were selected as 180 °C and 30 min. Therefore, the texture of AA6014 alloy after bake hardening definitely changed. This is also the reason for the change in strength after bake hardening. For the change of mechanical properties after bake hardening, EBSD, APT, and HRTEM were utilized for in-depth research. The different length of NA before bake hardening may lead to different precipitation sequences.
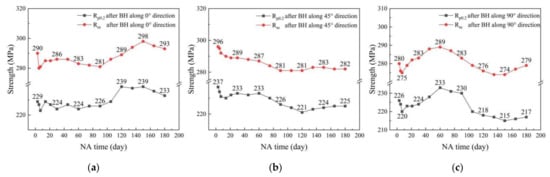
Figure 11.
The change curves of Rp0.2 and Rm after bake hardening (BH) along 0° (a), 45° (b), and 90° (c) directions.
Even though the strength changes after bake hardening along the three directions are different, the values of Rp0.2/Rm along the three directions remain relatively stable throughout the six-month NA process. Figure 12 shows the change curves of Rp0.2/Rm obtained by bake hardening along the three directions after different NA times. It can be seen that almost all the values of Rp0.2/Rm are between 0.78 and 0.82. Along the 0, 45 and 90° directions, the average values of Rp0.2/Rm are, respectively, 0.799, 0.799, and 0.795.
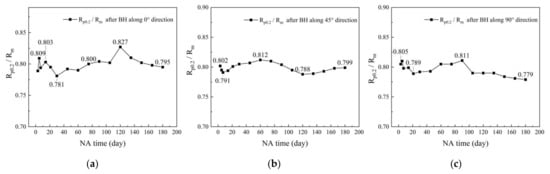
Figure 12.
The change curves of Rp0.2/Rm after bake hardening (BH) along 0° (a), 45° (b), and 90° (c) directions.
3.2.3. The Changes of Rp0.2 Increment and Rm Increment after Bake Hardening along 0, 45, and 90° Directions
Figure 13 shows the change curves of Rp0.2 increment and Rm increment obtained after bake hardening along the three directions after different NA times. Along the three directions, the increments of strength after bake hardening all show a downward trend with the extension of NA. Along 0, 45, and 90° directions, from 3 to 180 days of NA, the increments of Rp0.2 due to the simulated paint treatment, respectively, decreased from 130 to 87 MPa, from 144 to 85 MPa, and from 131 to 78 MPa. The percentages of decrease are, respectively, 33.08, 40.97, and 40.46%. The increments of Rm due to the simulated paint treatment, respectively, decreased from 80 to 44 MPa, from 92 to 45 MPa, and from 75 to 43 MPa. The percentages of decrease are, respectively, 45, 51.09, and 42.67%. The increment of strength after bake hardening along 45° direction is the largest, of which the maximum Rp0.2 increment can reach 144 MPa and the maximum Rm increment can reach 92 MPa. The maximum and minimum increments of Rp0.2 and Rm along 0° direction are 130 and 80 MPa, which are basically the same as those along 90° direction. There are two main reasons for the decrease of the bake hardening strength increment: (1) the increase in strength during NA; and (2) the decrease in bake hardening potential. Although all samples have been pre-aged at low temperature for a long time (85 °C, 8 h), there are still vacancies and supersaturated atoms existing in the alloy, which is in an unstable state. In the six-month long-term research, as described in Section 3.1.3, the strength along the three directions increases significantly. This results in the decrease of strength increment after bake hardening. As for the reduction of bake hardening potential, there are currently two main factors. One is that NA clusters cannot transform into β″ phase during bake hardening as mentioned above. Therefore, the longer is the NA time, the larger is the number of NA clusters that form, which results in the lower the bake hardening potential. The other factor is that long-term NA will cause the PA cluster size to increase and the composition to change, which will make the β″ phase formed after bake hardening become coarse and reduce the densities of β″ [24,25]. At the same time, long-term NA will also increase the transition temperature of β″ and increase the activation energy [2,5,12]. Therefore, the strengthening ability will be weakened, leading to the weakening of the bake hardening ability as well.
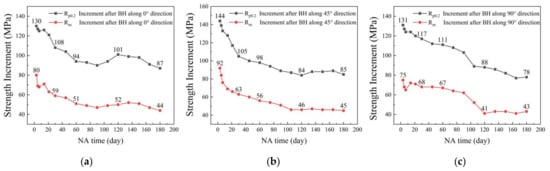
Figure 13.
The change curves of Rp0.2 increment and Rm increment after bake hardening along 0° (a), 45° (b), and 90° (c) directions.
3.2.4. The Changes of Ag and A after Bake Hardening along 0, 45, and 90° Directions
Figure 14 shows the change curves of plastic extension at maximum force (Ag) and elongation after fracture (A) obtained after bake hardening along the three directions with different NA times. It can be seen that the elongations after bake hardening fluctuate within a certain range. Along 0° direction, the average value of Ag is 14.33%, which fluctuates between 11.96 and 15.92% during the entire research period; the average value of A is 16.70%, which fluctuates between 13.05 and 19.28%. Along 45° direction, the average values of Ag and A are 14.71 and 16.95%. Ag fluctuates between 13.40 and 15.96%, while A fluctuates between 15.33 and 19.04%. Along 90° direction, the average values of Ag and A are 14.80 and 17.08%. Ag fluctuates between 12.94 and 16.18%, while A fluctuates between 14.07 and 19.04%. Compared with Figure 6, along 0° direction, the average value Ag decreased by 7.13% and the average value A decreased by 6.60%. Along 45° direction, the average values Ag and A, respectively, decreased by 6.91 and 6.35%. Along 90° direction, the average value Ag and A, respectively, decreased by 7.00 and 6.19%. Therefore, overall, Ag and A are, respectively, reduced by 7.01 and 6.38% after simulated painting treatment. The average of engineering strains of AA6014 alloy from necking to fracture after bake hardening along the three directions are, respectively, 2.51, 2.30, and 2.34%. Bake hardening will cause ~7% decrease in elongation.
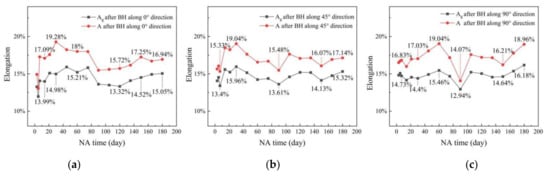
Figure 14.
The change curves of Ag and A after bake hardening along 0° (a), 45° (b), and 90° (c) directions.
3.2.5. The Changes of n Value after Bake Hardening along 0, 45, and 90° Directions
Figure 15 shows the change curves of n value obtained after bake hardening along the three directions with different NA times. It shows that the n values along the three directions all tend to be stable during the first four months and then rise during the whole research period. Along 0° direction, the average n value during the whole research period is 0.1608. The n value keeps stable around ~0.1595 during first three months and then increases to 0.1653 within 90~180 days of NA. Along 45° direction, the average n value is 0.1629, which fluctuates between 0.1592 and 0.1636 during the first three months of the NA process. Then, the n value gradually increases to 0.1674. Along 90° direction, the average n value is 0.1673, which keeps nearly unchanged at ~0.1625 during the first four months of NA. Then, the n value increases to 0.1769. The n values along the three directions after bake hardening are similar, all between 0.16 and 0.17. The n value along 90° direction is slightly larger than those of the other two directions. Generally speaking, compared with the samples without bake hardening, the n value decreases by about 0.07.
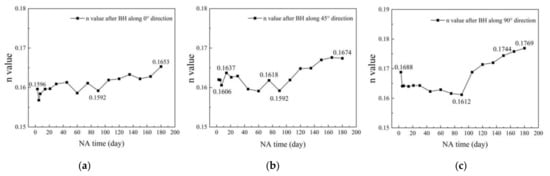
Figure 15.
The change curve of n value after bake hardening along 0° (a), 45° (b), and 90° (c) directions.
4. Discussion
4.1. Formula Fitting for the Change of Rp0.2 during the NA Process
In total, 192 Rp0.2 data were obtained during the whole experiment period. In this section, the NA time is taken as the abscissa and the yield strength as the ordinate to perform data fitting on the above data. According to the trend of Rp0.2 along the three directions, the trinomial polynomial, the HILL1 formula, and the WeibullCDF formula were selected and fitted by the Origin software (Origin 2021, OriginLab, Northampton, MA, USA).
| Trinomial polynomial | |
| HILL1 Formula | |
| WeibullCDF Formula |
Figure 16 is the fitting diagram of Rp0.2 along the three directions using the three selected formulas. It can be seen that the selected formulas all have good fitting effects. Along 0° direction, the R-square values of the trinomial polynomial, the HILL1 formula, and the WeibullCDF formula after fitting are, respectively, 0.9882, 0.9899, and 0.9873. The fitting effects of the trinomial polynomial and the HILL1 formula are better than that of the WeibullCDF formula. Along 45° direction, the R-square values of these three formulas after fitting are, respectively, 0.9733, 0.9879, and 0.9866. The fitting effects of the WeibullCDF formula and the HILL1 formula are better than that of the trinomial polynomial. Along 90° direction, the R-square values of these three formulas after fitting are, respectively, 0.9856, 0.9862, and 0.9852. All three formulas show good fitting results.
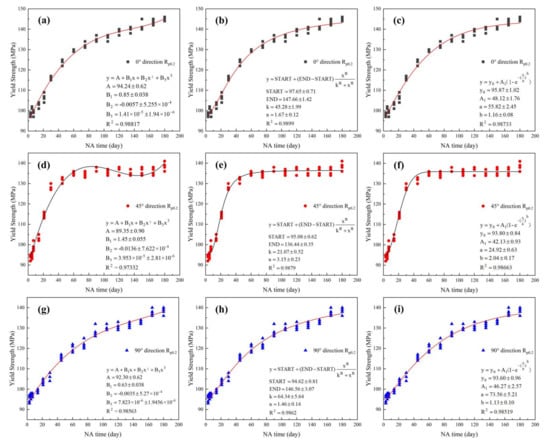
Figure 16.
Fitting diagram of Rp0.2 along 0° (a–c), 45° (d–f), and 90° (g–i) directions.
4.2. The PLC Phenomenon during the NA Process
The tensile curves along 0° direction at several specific time points (the 3rd, 7th, 14th, 21st, 30th, 60th, and 90th day during the NA process) were selected to analyze the PLC phenomenon during the NA process. The PLC phenomenon of AA6014 alloy at different NA times can be clearly seen in Figure 17a. The zigzag periodicity of each curve in the figure is very obvious. Among them, on the third and seventh days of NA, the sample undergoes six PLC cycles and then breaks. For the 14th and 21st days, the sample undergoes three PLC cycles before breaking. For the 30th and 60th days of NA, the sample fractures after two PLC cycles, and the periodic effect of PLC becomes less obvious. For the 90th day of NA, there is almost no PLC effect on the sample. The average amplitude and the critical strain are utilized to illustrate the PLC phenomenon. Figure 17b shows the variation of the average amplitude with different NA times. The average amplitude represents the severity of plastic instability. On the 3rd, 7th, 14th, 21st, 30th, and 60th days of NA, the average amplitudes are, respectively, 3.68, 3.48, 3.03, 2.73, 2.5, and 2.2 MPa. The critical strain value is the starting point where the tensile curves appear jagged. Figure 15c shows that the PLC phenomenon comes later with the extension of NA, and the critical strain values are 0.073, 0.071, 0.1, 0.1069, 0.1356, 0.1514, and 0.1726. With the extension of the NA time, the average amplitude of the PLC phenomenon continues to decrease, and the critical strain continues to increase. These all reflect that, with the extension of the NA time, the role of solute atoms and dislocations becomes weaker and weaker, and the diffusion rate of solute atoms is also continuously slowing down.
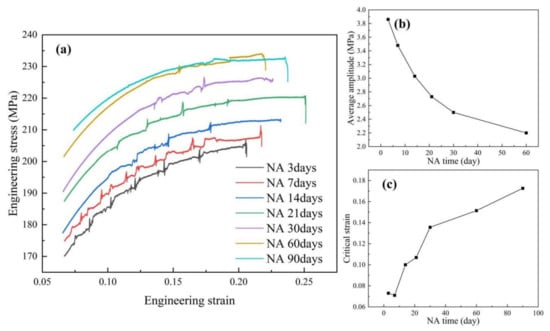
Figure 17.
The PLC phenomenon during the NA process (a); the changes of average amplitude during the NA process (b); and the changes of critical strain during the NA process (c).
5. Conclusions
This article is based on the research background of the six-month validity period of aluminum plates setting by the automobile manufacturers. Micro-hardness measurement and tensile test were used as the main research methods to quantitatively and systematically describe the change of mechanical properties and bake hardening properties of AA6014 alloy along 0, 45, and 90° directions during six-month NA. A large and systematic dataset reveals the changes of each mechanical property during NA and after bake hardening heat treatment during six months in detail, verifies the existing research, and puts forward some phenomena worthy of in-depth study. The main conclusions are as follows:
- (1)
- With the extension of NA, Rp0.2 and Rm along the three directions all change significantly and the percentage of increase is about ~46% and ~16%, respectively. Different lengths of NA time before bake hardening have a great impact on the Rp0.2 increment and Rm increment. Along 0, 45, and 90° directions, from 3 to 180 days, the Rp0.2 increment, respectively, decreased from 130 to 87 MPa, from 144 to 85 MPa, and from 131 to 78 MPa, while the Rm increment, respectively, decreased from from 80 to 44 MPa, from 92 to 45 MPa, and from 75 to 43 MPa.
- (2)
- The trends of Rp0.2 and Rm obtained by bake hardening are fluctuating and not consistent along the three directions. This is not only related to the transformation and dissolution of precipitates but also related to the texture change caused by bake hardening, which is worth further study.
- (3)
- Ag and A will not decrease significantly with the extension of NA but fluctuate within a specific range regardless of the directions or whether undergoing bake hardening. Ag remains above 18% during the six-month NA, and the average value is ~21%. A remains above 20%, and the average value is ~23%. Bake hardening will reduce elongation by ~ 7%, which is not only due to the increase in strength but also due to the decrease in the n value. The engineering strain of AA6014 alloy from necking to fracture after bake hardening is ~2.3%.
- (4)
- During the process of NA, the n value shows a downward trend, decreasing from 0.28 to 0.21. However, after bake hardening treatment, with the extension of the NA time experienced before bake hardening, the n value keeps almost unchanged during the first three months of NA and then gradually shows an upward trend. Among the three directions, the n value along 90° direction is the largest regardless of bake hardening.
- (5)
- The microstructure of AA6014 alloy at room temperature tends to be stable after 90 days of NA, which is proved by the almost disappearing PLC effect and almost constant Rp0.2.
Author Contributions
Experiment, Y.H.; formal analysis, Y.H.; investigation, Z.T.; writing—original draft, Y.H.; writing—review and editing, G.Y.; visualization, L.Y.; and supervision, Z.G. All authors have read and agreed to the published version of the manuscript.
Funding
This work was financially supported by the National Natural Science Foundation of China (No. 51101072) and Technology Development Program of Jilin Province (Nos. 20160307015GX and 3R2197212416).
Conflicts of Interest
The authors declare no conflict of interest in this work.
References
- Tisza, M.; Czinege, I. Comparative study of the application of steels and aluminium in lightweight production of automotive parts. Int. J. Lightweight Mater. Manuf. 2018, 1, 229–238. [Google Scholar] [CrossRef]
- Li, H.; Yan, Z.; Cao, L. Bake Hardening Behavior and Precipitation Kinetic of a Novel Al-Mg-Si-Cu Alu-minum Alloy for Lightweight Automotive Body. Mater. Sci. Eng. A 2018, 728, 88–94. [Google Scholar] [CrossRef]
- Gao, G.; Li, Y.; Wang, Z.; Di, H.; Li, J.; Xu, G. Effects of the Quenching Rate on the Microstructure, Mechanical Properties and Paint Bake-Hardening Response of Al–Mg–Si Automotive Sheets. Materials 2019, 12, 3587. [Google Scholar] [CrossRef] [PubMed]
- Gao, G.J.; Li, Y.; Wang, Z.D.; Misra, R.D.K.; Di, H.S.; Li, J.D.; Xu, G.M. Interaction between Natural Aging and Pre-Aging Processes and its Impact on the Age-Hardening Behavior of Al-Mg-Si Automotive Sheets. JOM 2019, 71, 4405–4413. [Google Scholar] [CrossRef]
- Fallah, V.; Langelier, B.; Ofori-Opoku, N.; Raeisinia, B.; Provatas, N.; Esmaeili, S. Cluster Evo-lution Mechanisms During Aging in Al–Mg–Si Alloys. Acta Mater. 2016, 103, 290–300. [Google Scholar] [CrossRef]
- Cao, L.; Rometsch, P.A.; Couper, M.J. Clustering Behaviour in an Al–Mg–Si–Cu Alloy During Natural Ageing and Subsequent under-Ageing. Mater. Sci. Eng. A 2013, 559, 257–261. [Google Scholar] [CrossRef]
- Ines, H.; Boumerzoug, Z.; Chabane, F. Study of Precipitation Kinetics of an Al-Mg-Si Alloy Using Differ-ential Scanning Calorimetry. Acta Metall. Slovaca 2017, 23, 155–160. [Google Scholar]
- Banhart, J.; Chang, C.S.T.; Liang, Z.; Wanderka, N.; Lay, M.D.H.; Hill, A.J. Natural Aging in Al-Mg-Si Alloys—A Process of Unexpected Complexity. Adv. Eng. Mater. 2010, 12, 559–571. [Google Scholar] [CrossRef]
- Edwards, G.A.; Stiller, K.; Dunlop, G.L.; Couper, M.J. The Precipitation Sequence in Al–Mg–Si Alloys. Acta Mater. 1998, 46, 3893–3904. [Google Scholar] [CrossRef]
- Murayama, M.; Hono, K. Pre-Precipitate Clusters and Precipitation Processes in Al–Mg–Si Alloys. Acta Mater. 1999, 47, 1537–1548. [Google Scholar] [CrossRef]
- Buha, J.; Lumley, R.N.; Crosky, A.G.; Hono, K. Secondary Precipitation in an Al–Mg–Si–Cu Alloy. Acta Mater. 2007, 55, 3015–3024. [Google Scholar] [CrossRef]
- Jin, S.; Ngai, T.; Zhang, G.; Zhai, T.; Jia, S.; Li, L. Precipitation strengthening mechanisms during natural ageing and subsequent artificial aging in an Al-Mg-Si-Cu alloy. Mater. Sci. Eng. A 2018, 724, 53–59. [Google Scholar] [CrossRef]
- Liu, C.H.; Lai, Y.X.; Chen, J.H.; Tao, G.H.; Liu, L.M.; Ma, P.P.; Wu, C.L. Natural-Aging-Induced Reversal of the Pre-cipitation Pathways in an Al–Mg–Si Alloy. Scr. Mater. 2016, 115, 150–154. [Google Scholar] [CrossRef]
- Aruga, Y.; Kozuka, M.; Takaki, Y.; Sato, T. Effects of natural aging after pre-aging on clustering and bake-hardening behavior in an Al–Mg–Si alloy. Scr. Mater. 2016, 116, 82–86. [Google Scholar] [CrossRef]
- Zi, Y.; Zeqin, L.; Leyvraz, D.; Banhart, J. Effect of pre-ageing on natural secondary ageing and paint bake hardening in Al–Mg–Si alloys. Materialia 2019, 7, 100413. [Google Scholar] [CrossRef]
- Yang, Z.; Liang, Z.; Leyvraz, D.; Banhart, J. Hardness data related to pre-ageing, natural secondary ageing, and paint bake hardening in Al-Mg-Si alloys. Data Brief 2019, 27, 104494. [Google Scholar] [CrossRef]
- Takaki, Y.; Masuda, T.; Kobayashi, E.; Sato, T. Effects of Natural Aging on Bake Hardening Behavior of Al–Mg–Si Alloys with Multi-Step Aging Process. Mater. Trans. 2014, 55, 1257–1265. [Google Scholar] [CrossRef]
- Yang, S.L.; Fu, S.H.; Cai, Y.L.; Zhang, D.; Zhang, Q.C. Experimental Investigation on the Influence of Mg Content on Portevin-Le Chatelier Effect in Al-Based Alloys by Using Digital Image Correlation. Acta Phys. Sin. 2017, 66, 100233. [Google Scholar]
- Cai, Y.; Yang, S.; Fu, S.; Zhang, D.; Zhang, Q. Investigation of Portevin–Le Chatelier Band Strain and Elastic Shrinkage in Al-Based Alloys Associated with Mg Contents. J. Mater. Sci. Technol. 2017, 33, 580–586. [Google Scholar] [CrossRef]
- Pogatscher, S.; Antrekowitsch, H.; Leitner, H.; Ebner, T.; Uggowitzer, P.J. Mechanisms Controlling the Artificial Aging of Al–Mg–Si Alloys. Acta Mater. 2011, 59, 3352–3363. [Google Scholar] [CrossRef]
- Starink, M.; Cao, L.; Rometsch, P. A model for the thermodynamics of and strengthening due to co-clusters in Al–Mg–Si-based alloys. Acta Mater. 2012, 60, 4194–4207. [Google Scholar] [CrossRef]
- Serizawa, A.; Hirosawa, S.; Sato, T. Three-Dimensional Atom Probe Characterization of Nanoclusters Responsible for Multistep Aging Behavior of an Al-Mg-Si Alloy. Met. Mater. Trans. A 2008, 39, 243–251. [Google Scholar] [CrossRef]
- Werinos, M.; Antrekowitsch, H.; Ebner, T.; Prillhofer, R.; Uggowitzer, P.J.; Pogatscher, S. Hardening of Al–Mg–Si Alloys: Effect of Trace Elements and Prolonged Natural Aging. Mater. Des. 2016, 107, 257–268. [Google Scholar] [CrossRef]
- Marioara, C.D.; Andersen, S.J.; Jansen, J.; Zandbergen, H.W. The Influence of Temperature and Storage Time at Rt on Nucleation of the Β″ Phase in a 6082 Al–Mg–Si Alloy. Acta Mater. 2003, 51, 789–796. [Google Scholar] [CrossRef]
- Yin, D.; Xiao, Q.; Chen, Y.; Liu, H.; Yi, D.; Wang, B.; Pan, S. Effect of natural ageing and pre-straining on the hardening behaviour and microstructural response during artificial ageing of an Al–Mg–Si–Cu alloy. Mater. Des. 2016, 95, 329–339. [Google Scholar] [CrossRef]


Publisher’s Note: MDPI stays neutral with regard to jurisdictional claims in published maps and institutional affiliations. |
© 2021 by the authors. Licensee MDPI, Basel, Switzerland. This article is an open access article distributed under the terms and conditions of the Creative Commons Attribution (CC BY) license (https://creativecommons.org/licenses/by/4.0/).