
The Influence of Initial Purity Level on the Refining Efficiency of Aluminum via Zone Refining


Abstract
1. Introduction
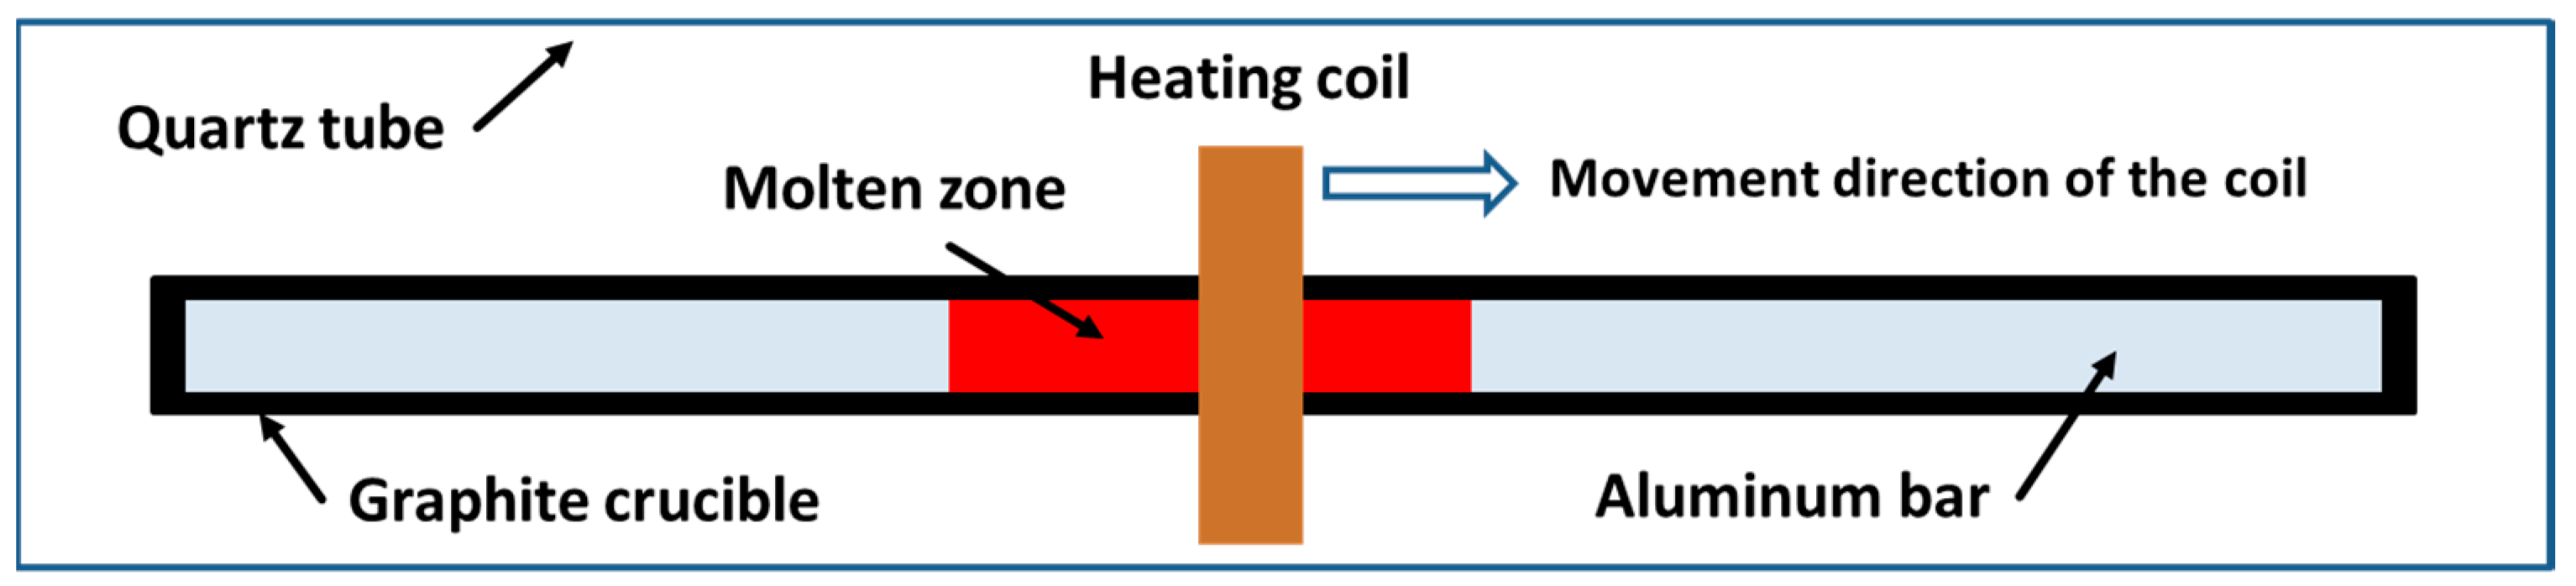
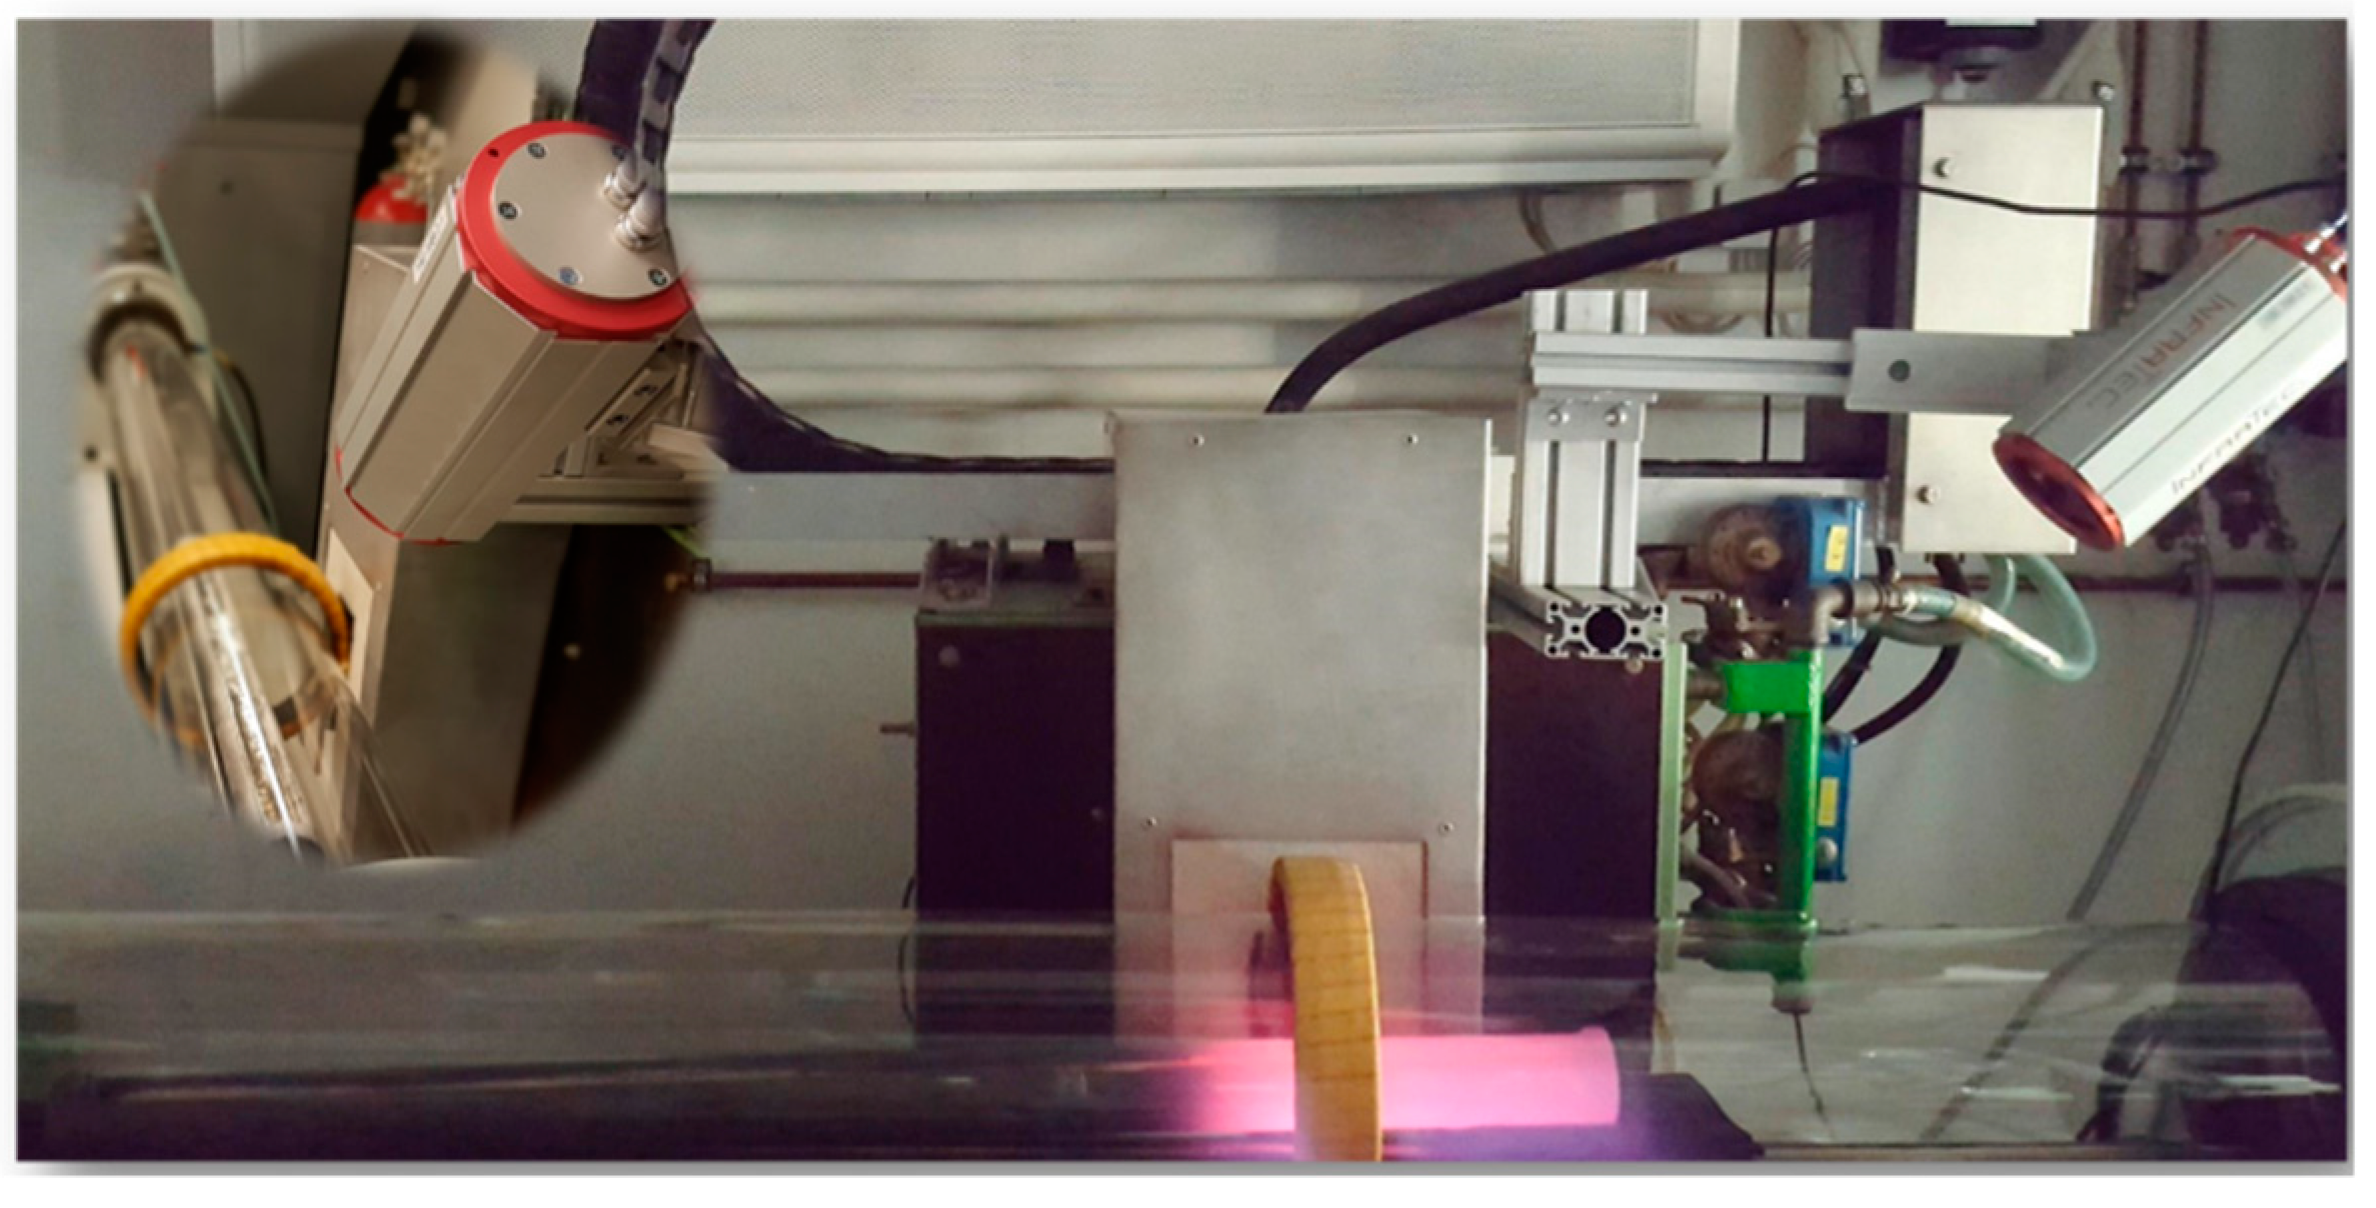
2. Experiments
3. Results and Discussion
3.1. Refining Efficiency of 4N Pure Al
3.2. Refining Efficiency of 2N8 Pure Al
3.3. Refining Efficiency of Recycled Al (1N7)
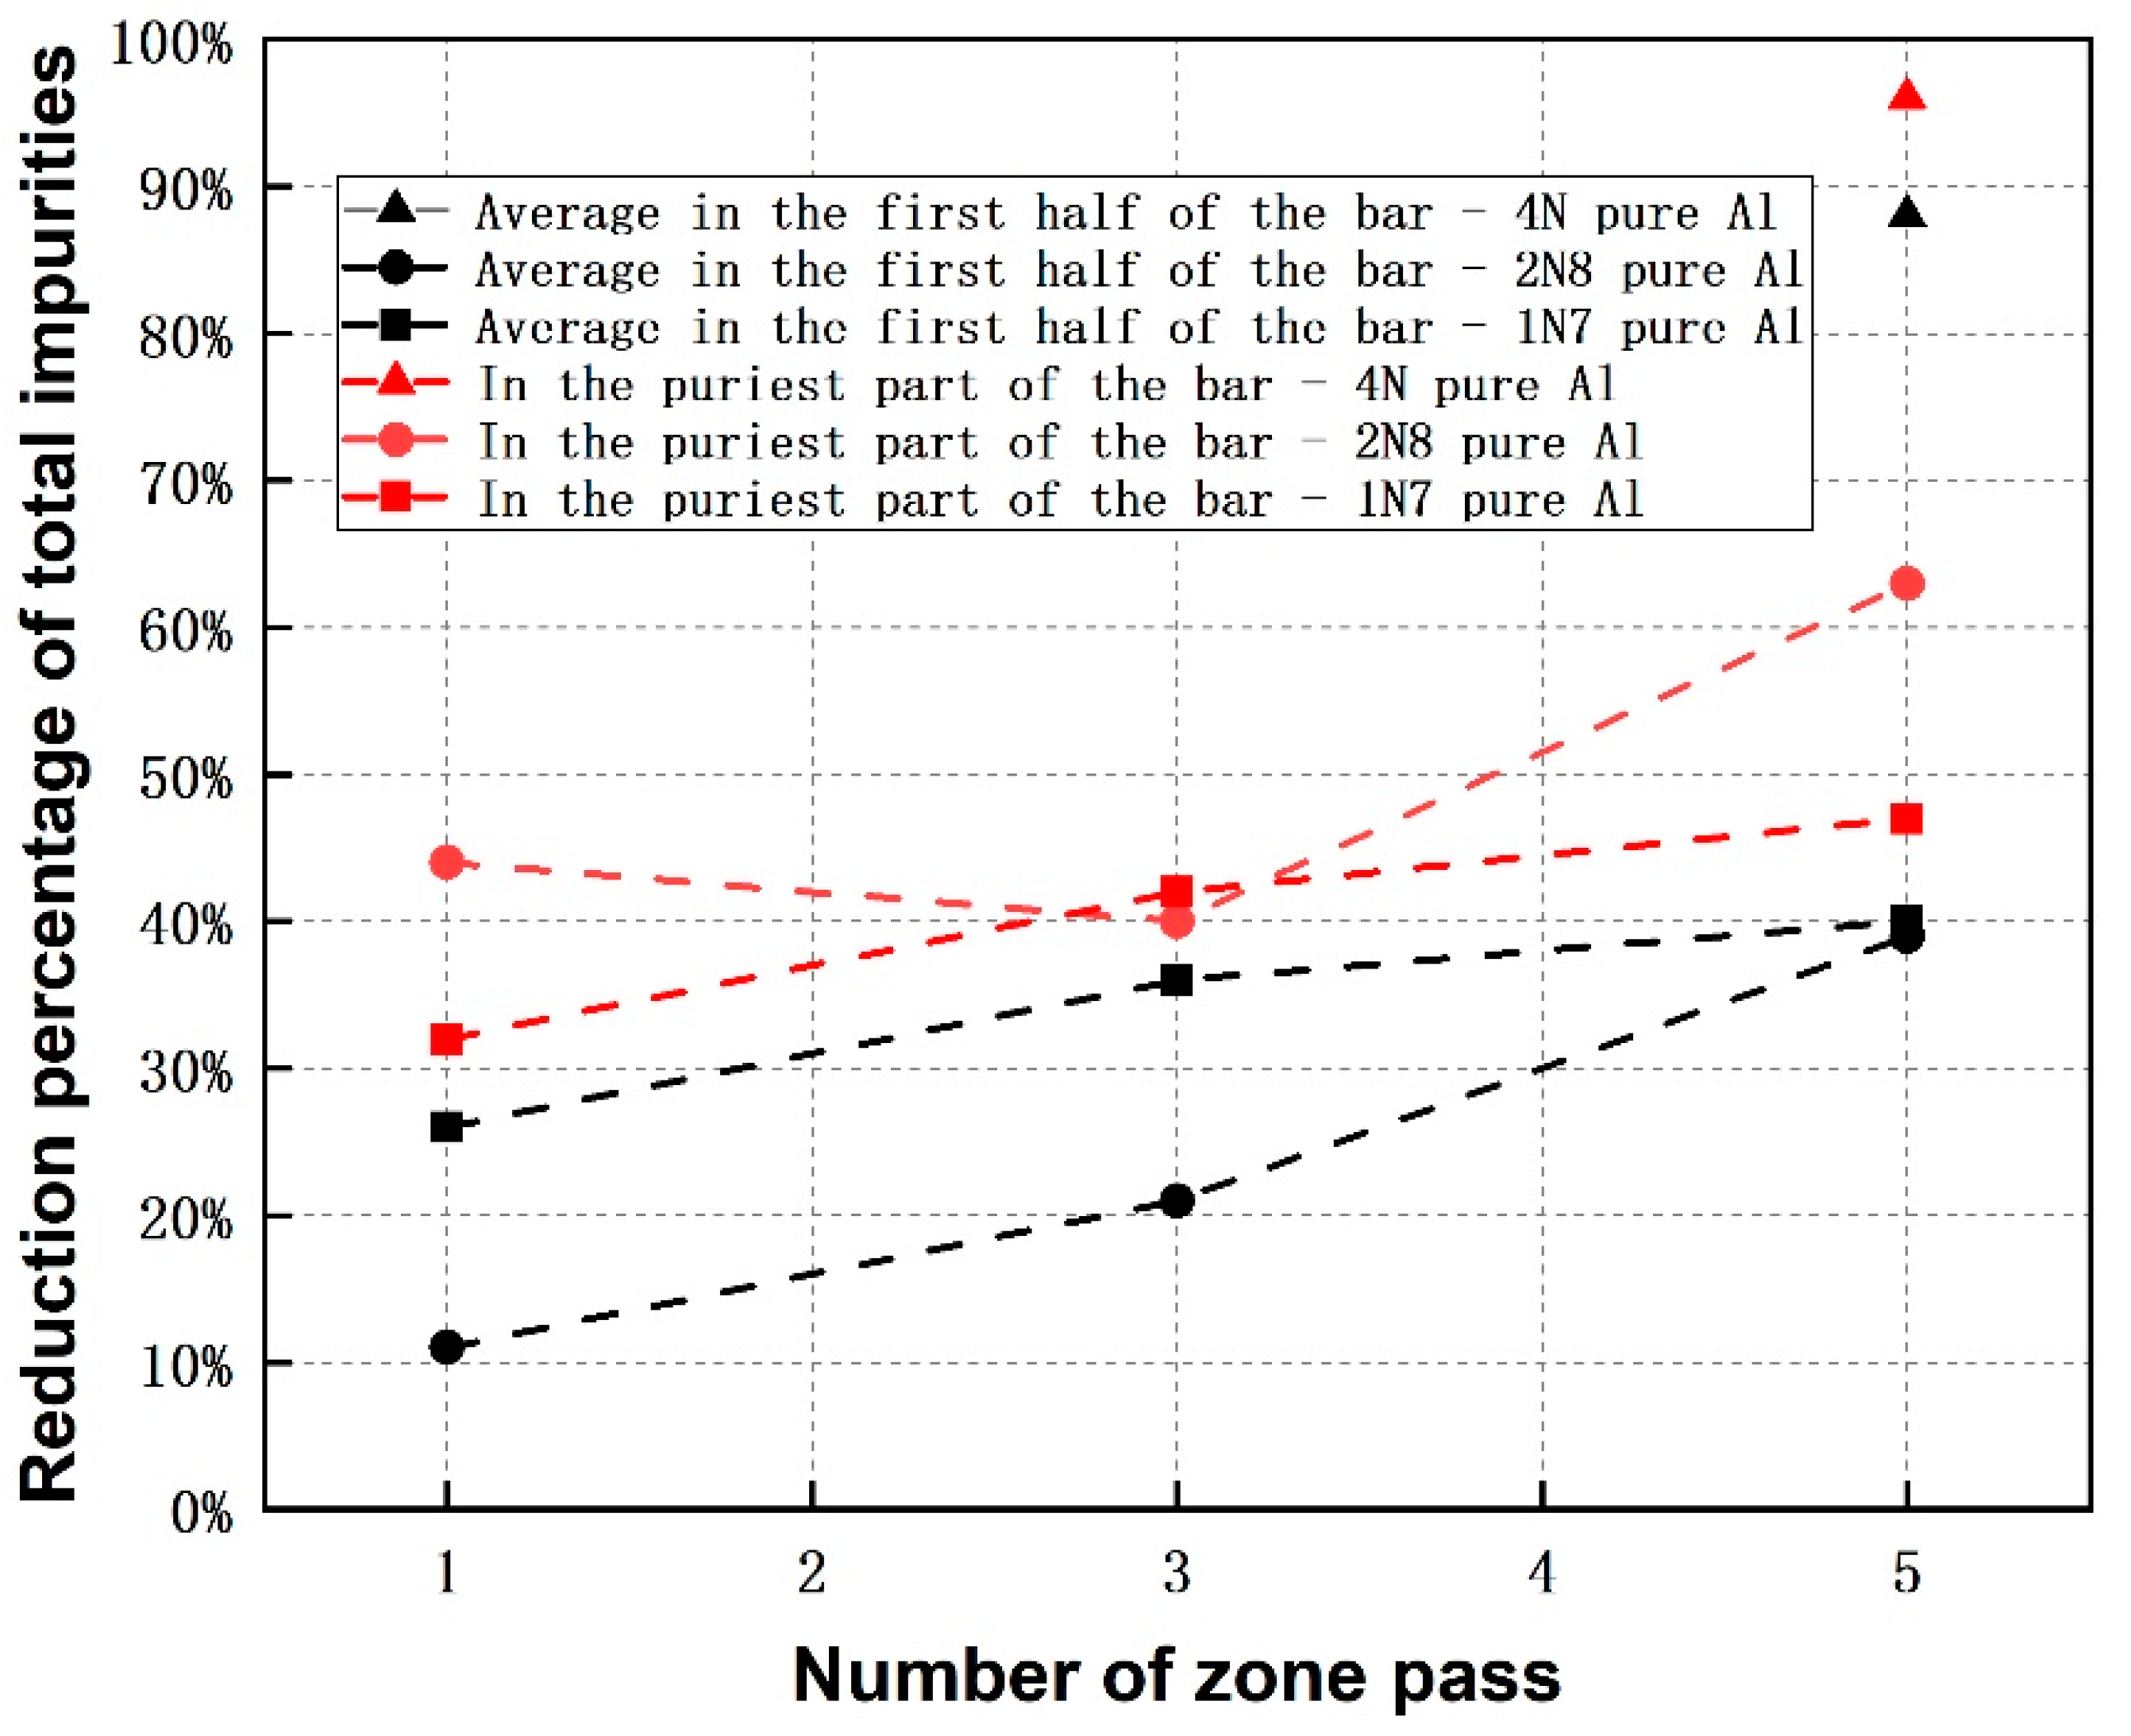
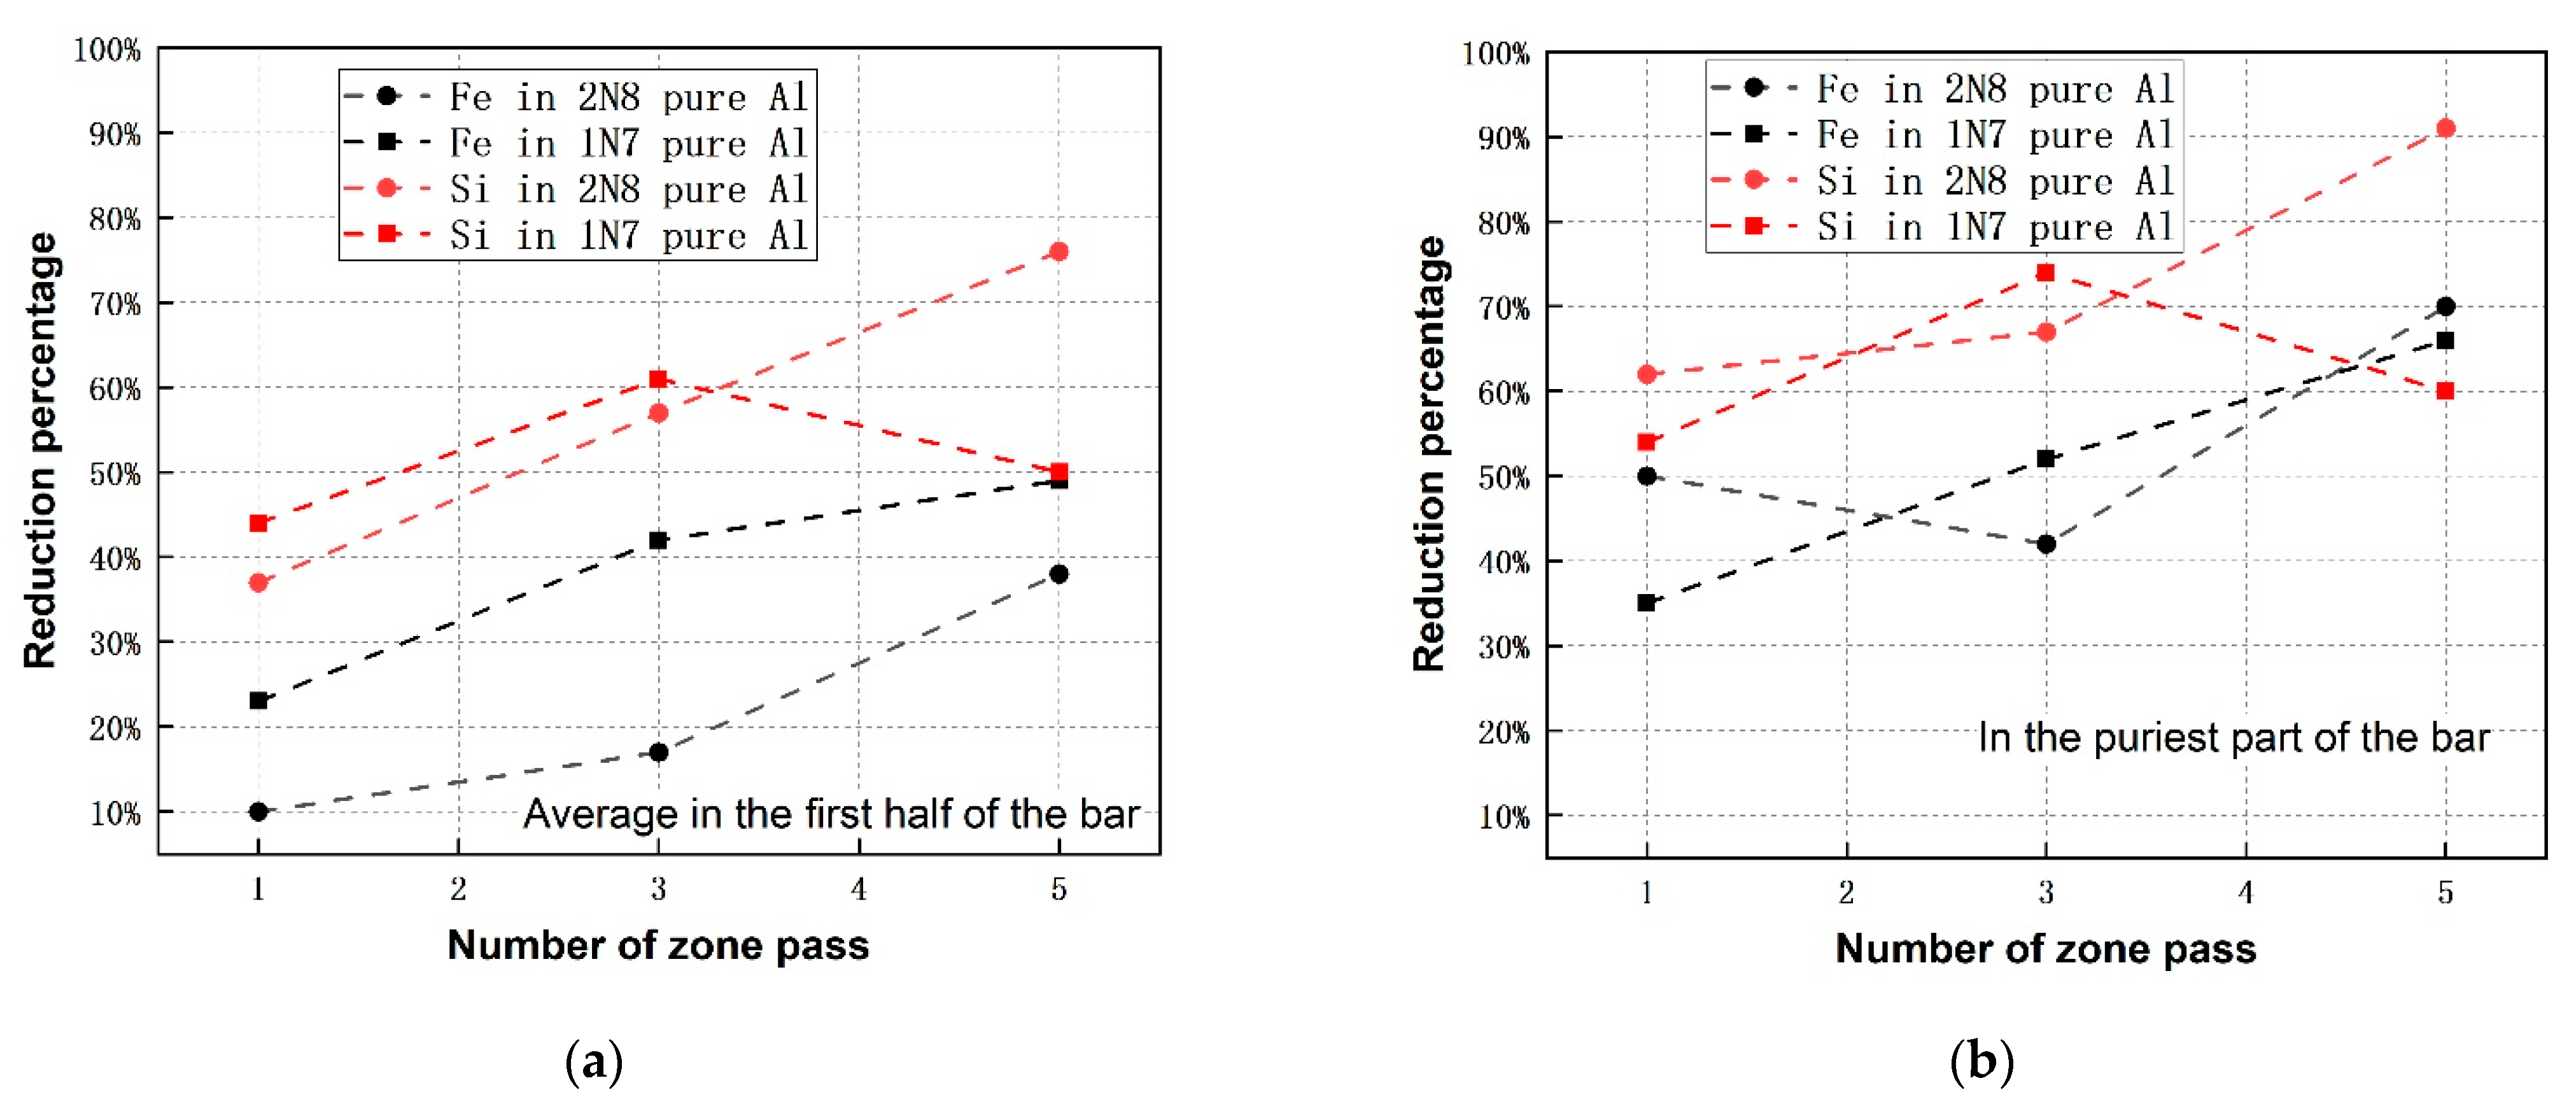
3.4. Comparison of Refining Efficiency among Zone Refining of Different Initial Purity-Levels of Al
4. Assessment and Conclusions
Author Contributions
Funding
Institutional Review Board Statement
Informed Consent Statement
Data Availability Statement
Acknowledgments
Conflicts of Interest
Appendix A

| 1.2 mm/min | Position (cm) | Fe | Si | Ga | V | Ni | Ti | Total Impurities | Al |
|---|---|---|---|---|---|---|---|---|---|
| % | ppm | ppm | ppm | ppm | ppm | % | % | ||
| Initial composition | 0.145 | 354 | 77 | 51 | 35 | 26 | 0.20 | 99.8 | |
| 1st pass | 2 | 0.16 | 228 | 95 | 73 | 34 | 29 | 0.21 | 99.8 |
| 12 | 0.14 | 170 | 78 | 84 | 26 | 37 | 0.18 | 99.8 | |
| 22 | 0.14 | 209 | 86 | 74 | 26 | 30 | 0.18 | 99.8 | |
| 32 | 0.072 | 136 | 61 | 116 | <10 | 66 | 0.11 | 99.9 | |
| 42 | 0.10 | 220 | 82 | 96 | 18 | 47 | 0.15 | 99.9 | |
| 52 | 0.17 | 370 | 131 | 72 | 47 | 29 | 0.23 | 99.8 | |
| 62 | 0.088 | 118 | 89 | 95 | 12 | 47 | 0.12 | 99.9 | |
| 72 | 0.14 | 222 | 65 | 103 | 30 | 55 | 0.19 | 99.8 | |
| 82 | 0.22 | 335 | 124 | 62 | 54 | 20 | 0.28 | 99.7 | |
| 92 | 0.23 | 479 | 167 | 57 | 65 | 14 | 0.31 | 99.7 | |
| 3rd pass | 2 | 0.13 | 199 | 81 | 89 | 30 | 43 | 0.17 | 99.8 |
| 12 | 0.11 | 131 | 62 | 92 | 17 | 45 | 0.14 | 99.9 | |
| 22 | 0.13 | 143 | 78 | 81 | 26 | 36 | 0.17 | 99.8 | |
| 32 | 0.13 | 119 | 71 | 85 | 21 | 39 | 0.16 | 99.8 | |
| 42 | 0.15 | 196 | 89 | 70 | 32 | 26 | 0.19 | 99.8 | |
| 52 | 0.084 | 118 | 67 | 100 | 14 | 49 | 0.12 | 99.9 | |
| 62 | 0.16 | 251 | 107 | 56 | 34 | 13 | 0.21 | 99.8 | |
| 72 | 0.33 | 541 | 189 | 31 | 94 | <10 | 0.42 | 99.6 | |
| 82 | 0.32 | 440 | 195 | 27 | 91 | <10 | 0.40 | 99.6 | |
| 92 | 0.50 | 990 | 312 | 14 | 162 | <10 | 0.55 | 99.5 | |
| 98 | 1.05 | 2500 | 599 | 15 | 382 | <10 | 1.15 | 98.9 | |
| 5th pass | 2 | 0.095 | 97 | 55 | 99 | 13 | 48 | 0.13 | 99.9 |
| 12 | 0.044 | 33 | 31 | 139 | <10 | 88 | 0.07 | 99.9 | |
| 22 | 0.097 | 118 | 57 | 91 | 13 | 42 | 0.13 | 99.9 | |
| 32 | 0.069 | 29 | 47 | 111 | <10 | 59 | 0.09 | 99.9 | |
| 42 | 0.11 | 106 | 75 | 82 | 24 | 35 | 0.14 | 99.9 | |
| 52 | 0.12 | 130 | 79 | 77 | 21 | 30 | 0.15 | 99.8 | |
| 62 | 0.17 | 246 | 112 | 52 | 39 | 10 | 0.22 | 99.8 | |
| 72 | 0.19 | 338 | 125 | 54 | 46 | 11 | 0.25 | 99.8 | |
| 82 | 0.35 | 538 | 211 | 28 | 103 | <10 | 0.44 | 99.6 | |
| 92 | 0.38 | 758 | 256 | 36 | 126 | <10 | 0.50 | 99.5 | |
| 98 | 0.51 | 1400 | 348 | 13 | 171 | <10 | 0.56 | 99.4 | |
| 1.2 mm/min | Position (cm) | Mg | Mn | Fe | Si | Cu | Zn | Ti | Cr | Ga | Total Impurities | Al |
|---|---|---|---|---|---|---|---|---|---|---|---|---|
| % | % | % | % | % | ppm | ppm | ppm | ppm | % | % | ||
| Initial composition | 0.99 | 0.86 | 0.42 | 0.18 | 0.15 | 310 | 180 | 140 | 90 | 2.66 | 97.3 | |
| 1st pass | 2 | 0.73 | 0.60 | 0.32 | 0.093 | 0.12 | 403 | 251 | 197 | 156 | 1.96 | 98.0 |
| 12 | 0.69 | 0.61 | 0.31 | 0.092 | 0.11 | 394 | 270 | 203 | 153 | 1.91 | 98.1 | |
| 22 | 0.74 | 0.62 | 0.34 | 0.095 | 0.12 | 411 | 212 | 197 | 159 | 2.01 | 98.0 | |
| 32 | 0.80 | 0.63 | 0.36 | 0.11 | 0.14 | 438 | 196 | 196 | 172 | 2.14 | 97.9 | |
| 42 | 0.66 | 0.60 | 0.27 | 0.082 | 0.11 | 375 | 272 | 202 | 149 | 1.82 | 98.2 | |
| 52 | 0.72 | 0.61 | 0.31 | 0.12 | 0.12 | 368 | 255 | 199 | 157 | 1.98 | 98.0 | |
| 62 | 0.69 | 0.60 | 0.28 | 0.10 | 0.11 | 340 | 277 | 201 | 151 | 1.88 | 98.1 | |
| 72 | 0.88 | 0.63 | 0.43 | 0.13 | 0.17 | 356 | 137 | 186 | 187 | 2.33 | 97.7 | |
| 82 | 0.90 | 0.65 | 0.44 | 0.16 | 0.17 | 325 | 145 | 189 | 191 | 2.41 | 97.6 | |
| 92 | 0.99 | 0.67 | 0.50 | 0.16 | 0.20 | 307 | 100 | 186 | 212 | 2.60 | 97.4 | |
| 98 | 1.19 | 0.70 | 0.66 | 0.15 | 0.27 | 339 | 35 | 171 | 256 | 3.05 | 96.9 | |
| 3rd pass | 2 | 0.61 | 0.60 | 0.24 | 0.064 | 0.094 | 339 | 352 | 204 | 136 | 1.71 | 98.3 |
| 12 | 0.55 | 0.58 | 0.21 | 0.048 | 0.080 | 313 | 391 | 210 | 129 | 1.57 | 98.4 | |
| 22 | 0.54 | 0.58 | 0.20 | 0.047 | 0.080 | 297 | 405 | 212 | 129 | 1.55 | 98.4 | |
| 32 | 0.64 | 0.61 | 0.26 | 0.066 | 0.10 | 314 | 280 | 203 | 142 | 1.77 | 98.2 | |
| 42 | 0.60 | 0.59 | 0.21 | 0.091 | 0.089 | 277 | 200 | 199 | 133 | 1.66 | 98.3 | |
| 52 | 0.69 | 0.61 | 0.30 | 0.093 | 0.12 | 273 | 179 | 191 | 152 | 1.89 | 98.1 | |
| 62 | 0.72 | 0.63 | 0.33 | 0.11 | 0.12 | 238 | 131 | 190 | 158 | 1.98 | 98.0 | |
| 72 | 1.03 | 0.68 | 0.58 | 0.20 | 0.21 | 245 | 49 | 173 | 212 | 2.77 | 97.2 | |
| 82 | 1.09 | 0.68 | 0.62 | 0.22 | 0.24 | 220 | 34 | 169 | 233 | 2.92 | 97.1 | |
| 92 | 1.12 | 0.65 | 0.60 | 0.18 | 0.25 | 216 | 34 | 170 | 248 | 2.87 | 97.1 | |
| 98 | 1.27 | 0.68 | 0.72 | 0.20 | 0.31 | 233 | 15 | 161 | 283 | 3.25 | 96.8 | |
| 5th pass | 2 | 0.44 | 0.56 | 0.14 | 0.071 | 0.062 | 261 | 694 | 227 | 119 | 1.40 | 98.6 |
| 12 | 0.50 | 0.58 | 0.17 | 0.089 | 0.070 | 278 | 417 | 217 | 122 | 1.51 | 98.5 | |
| 22 | 0.45 | 0.58 | 0.16 | 0.072 | 0.07 | 244 | 445 | 219 | 117 | 1.43 | 98.6 | |
| 32 | 0.54 | 0.59 | 0.22 | 0.092 | 0.08 | 255 | 256 | 204 | 130 | 1.61 | 98.4 | |
| 42 | 0.61 | 0.61 | 0.27 | 0.10 | 0.10 | 235 | 156 | 200 | 143 | 1.76 | 98.2 | |
| 52 | 0.65 | 0.62 | 0.30 | 0.094 | 0.11 | 217 | 126 | 193 | 151 | 1.84 | 98.2 | |
| 62 | 0.70 | 0.64 | 0.35 | 0.11 | 0.12 | 208 | 79 | 190 | 163 | 1.98 | 98.0 | |
| 72 | 0.84 | 0.68 | 0.46 | 0.16 | 0.16 | 195 | 63 | 185 | 188 | 2.36 | 97.6 | |
| 82 | 1.10 | 0.66 | 0.63 | 0.23 | 0.25 | 202 | 18 | 164 | 245 | 2.93 | 97.1 | |
| 92 | 1.19 | 0.64 | 0.64 | 0.22 | 0.28 | 201 | 15 | 158 | 267 | 3.03 | 97.0 | |
| 98 | 1.35 | 0.61 | 0.71 | 0.20 | 0.34 | 217 | <5 | 149 | 306 | 3.28 | 96.7 | |
References
- Curtolo, D.; Friedrich, S.; Bellin, D.; Nayak, G.; Friedrich, B. Definition of a First Process Window for Purification of aluminum via “Cooled Finger” Crystallization Technique. Metals 2017, 7, 341. [Google Scholar] [CrossRef]
- Pearce, J.V. Distribution coefficients of impurities in metals. Int. J. Thermophys. 2014, 35, 628–635. [Google Scholar] [CrossRef]
- Huntley, D.A.; Shah, J.S. High resistance ratio antimony. J. Cryst. Growth 1970, 6, 216–218. [Google Scholar] [CrossRef]
- Hashimoto, E.; Ueda, Y. Zone Refining of high-purity aluminum. Mater. Trans. 1994, 35, 262–265. [Google Scholar] [CrossRef]
- Munirathnam, N.R.; Prasad, D.S.; Sudheer, C.; Prakash, T.L. Purification of tellurium to 6N + by quadruple zone refining. J. Cryst. Growth 2003, 254, 262–266. [Google Scholar] [CrossRef]
- Munirathnam, N.R.; Prasad, D.S.; Sudheer, C.H.; Rao, J.V.; Prakash, T.L. Zone refining of cadmium and related characterization. Bull. Mater. Sci. 2005, 28, 209–212. [Google Scholar] [CrossRef]
- Yang, G.; Guan, Y.T.; Jian, F.Y.; Wagner, M.D.; Mei, H.; Wang, G.J.; Howard, S.M.; Mei, D.M.; Nelson, A.; Marshal, J.; et al. Zone Refinement of Germanium Crystals. J. Phys. Conf. Ser. 2015, 606, 012014. [Google Scholar] [CrossRef]
- Pfann, W.G. Principles of zone melting. Trans. AIME 1952, 194, 747. [Google Scholar] [CrossRef]
- Vigdorovich, V.N. Purification of Metals and Semiconductors by Crystallization; Freund Publishing Houste: Moscow, Russia, 1969. [Google Scholar]
- Ghosh, K.; Mani, V.N.; Dhar, S. A modeling approach for the purification of group III metals (Ga and In) by zone refining. J. Appl. Phys. 2008, 104. [Google Scholar] [CrossRef]
- Ghosh, K.; Mani, V.N.; Dhar, S. Numerical study and experimental investigation of zone refining in ultra-high purification of gallium and its use in the growth of GaAs epitaxial layers. J. Cryst. Growth 2009, 311, 1521–1528. [Google Scholar] [CrossRef]
- Kino, T.; Kamigaki, N.; Yamasaki, H.; Kawai, J.; Deguchi, Y.; Nakamichi, I. Zone Refining in aluminum. Trans. Jpn. Inst. Met. 1976, 17, 645–648. [Google Scholar] [CrossRef]
- Nakamura, M.; Watanabe, M.; Tanaka, K.; Kirihata, A.; Sumomogi, T.; Hiroaki, H.; Tanaka, I. Zone Refining of aluminum and its Simulation. Mater. Trans. 2014, 55, 664–670. [Google Scholar] [CrossRef]
- Yang, G.; Govani, J.; Mei, H.; Guan, Y.; Wang, G.; Huang, M.; Mei, D. Investigation of influential factors on the purification of zone-refined germanium ingot. Cryst. Res. Technol. 2014, 49, 269–275. [Google Scholar] [CrossRef]
- Munirathnam, N.R.; Prasad, D.S.; Sudheer, C.; Singh, A.J.; Prakash, T.L. Preparation of high purity tellurium by zone refining. Bull. Mater. Sci. 2002, 25, 79–83. [Google Scholar] [CrossRef]
- Curtolo, D.; Zhang, X.; Rojas, M.; Friedrich, S.; Friedrich, B. Realization of the Zone Length Measurement during Zone Refining Process via Implementation of an Infrared Camera. Appl. Sci. 2018, 8, 875. [Google Scholar] [CrossRef]
- Spim, J.A.; Bernadou, M.J.S.; Garcia, A. Numerical modeling and optimization of zone refining. J. Alloy. Compd. 2000, 298, 299–305. [Google Scholar] [CrossRef]
- Leslie Burris, J.; Stockman, C.H.; Dillon, I.G. Contribution to mathematics of zone refining. J. Miner. Met. Mater. Soc. 1955, 7, 1017–1023. [Google Scholar] [CrossRef]
- Pfann, W.G. Zone Melting, 2nd ed.; John Wiley and Sons Inc.: New York, NY, USA, 1966. [Google Scholar]
- Ho, C.; Yeh, H.; Yeh, T. Numerical analysis on optimal zone lengths for each pass in multipass zone-refining processes. Can. J. Chem. Eng. 1998, 76, 3–9. [Google Scholar] [CrossRef]
- Rodway, G.H.; Hunt, J.D. Optimizing zone refining. J. Cryst. Growth 1989, 97, 680–688. [Google Scholar] [CrossRef]
- Zhang, X.; Friedrich, S.; Friedrich, B. Characterization and interpretation of the aluminum zone refining through infrared thermographic analysis. Materials 2018, 11, 2039. [Google Scholar] [CrossRef] [PubMed]


| Element | Range of k | Element | Range of k |
|---|---|---|---|
| Ti | 7–11 | Cu | 0.15–0.153 |
| V | 3.3–4.3 | Si | 0.082–0.12 |
| Zr | 2.3–3 | Ga | 0.11 |
| Cr | 1.8 | Sb | 0.09 |
| Sc | 0.9 | Ni | 0.004–0.09 |
| Mn | 0.55–0.9 | Ca | 0.006–0.08 |
| K | 0.56 | Fe | 0.018–0.053 |
| Mg | 0.29–0.5 | Na | 0.013 |
| Zn | 0.35–0.47 | P | <0.01 |
| Ag | 0.2–0.3 | Pb | 0.0007 |
| Au | 0.18 | - | - |
| Purity | Ga | Al | Ge | Te | ||||
|---|---|---|---|---|---|---|---|---|
| Initial | 4N6 | 5N2 | 5N | 6N | 5N | 5N | 4N | 5N |
| Final | 6N5 [10] | 7N2 [11] | 6N [12] | 7N [4,13] | 5N5 [7] | 7N [14] | 5N5 [15] | 6N [5] |
| Three-layer electrolysis Al 1 | Si | Na | Ti | Fe | Sn | Zn | Cu | P | Pb | Total impurities | Al (%) |
| <5 | 18 | 9 | <5 | 19 | 23 | 8 | 15 | 24 | 116 | 99.99 | |
| Commercial pure Al 2 | Fe | Ga | Ni | Si | Ti | V | - | - | - | Total impurities | Al (%) |
| 1450 | 77 | 35 | 354 | 26 | 51 | - | - | - | 1993 | 99.8 | |
| Recycled Al 2 | Si | Fe | Cu | Mn | Mg | Cr | Zn | Ti | Ga | Total impurities | Al (%) |
| 1790 | 4150 | 1500 | 8550 | 9900 | 140 | 310 | 180 | 90 | 26,610 | 97.3 |
| Zone Pass | Optimum Zone Length [10] | Zone Length (Practical) * | Length of Al Bar (L) | Moving Velocity | ||
|---|---|---|---|---|---|---|
| 4N-Pure Al | 2N8-Pure Al | 1N7 Pure Al | ||||
| 1st | 1 L | 0.24–0.34 L | 0.17–0.36 L | 0.23–0.32 L | 100 cm | 1.2 mm/min |
| 2nd | 0.35 L | 0.17–0.30 L | 0.17–0.30 L | 0.14–0.29 L | ||
| 3rd | 0.25 L | 0.17–0.28 L | 0.20–0.30 L | 0.20–0.30 L | ||
| 4th | 0.20 L | 0.16–0.25 L | 0.14–0.23 L | 0.12–0.24 L | ||
| 5th | 0.15 L | 0.15–0.25 L | 0.12–0.25 L | 0.18–0.25 L | ||
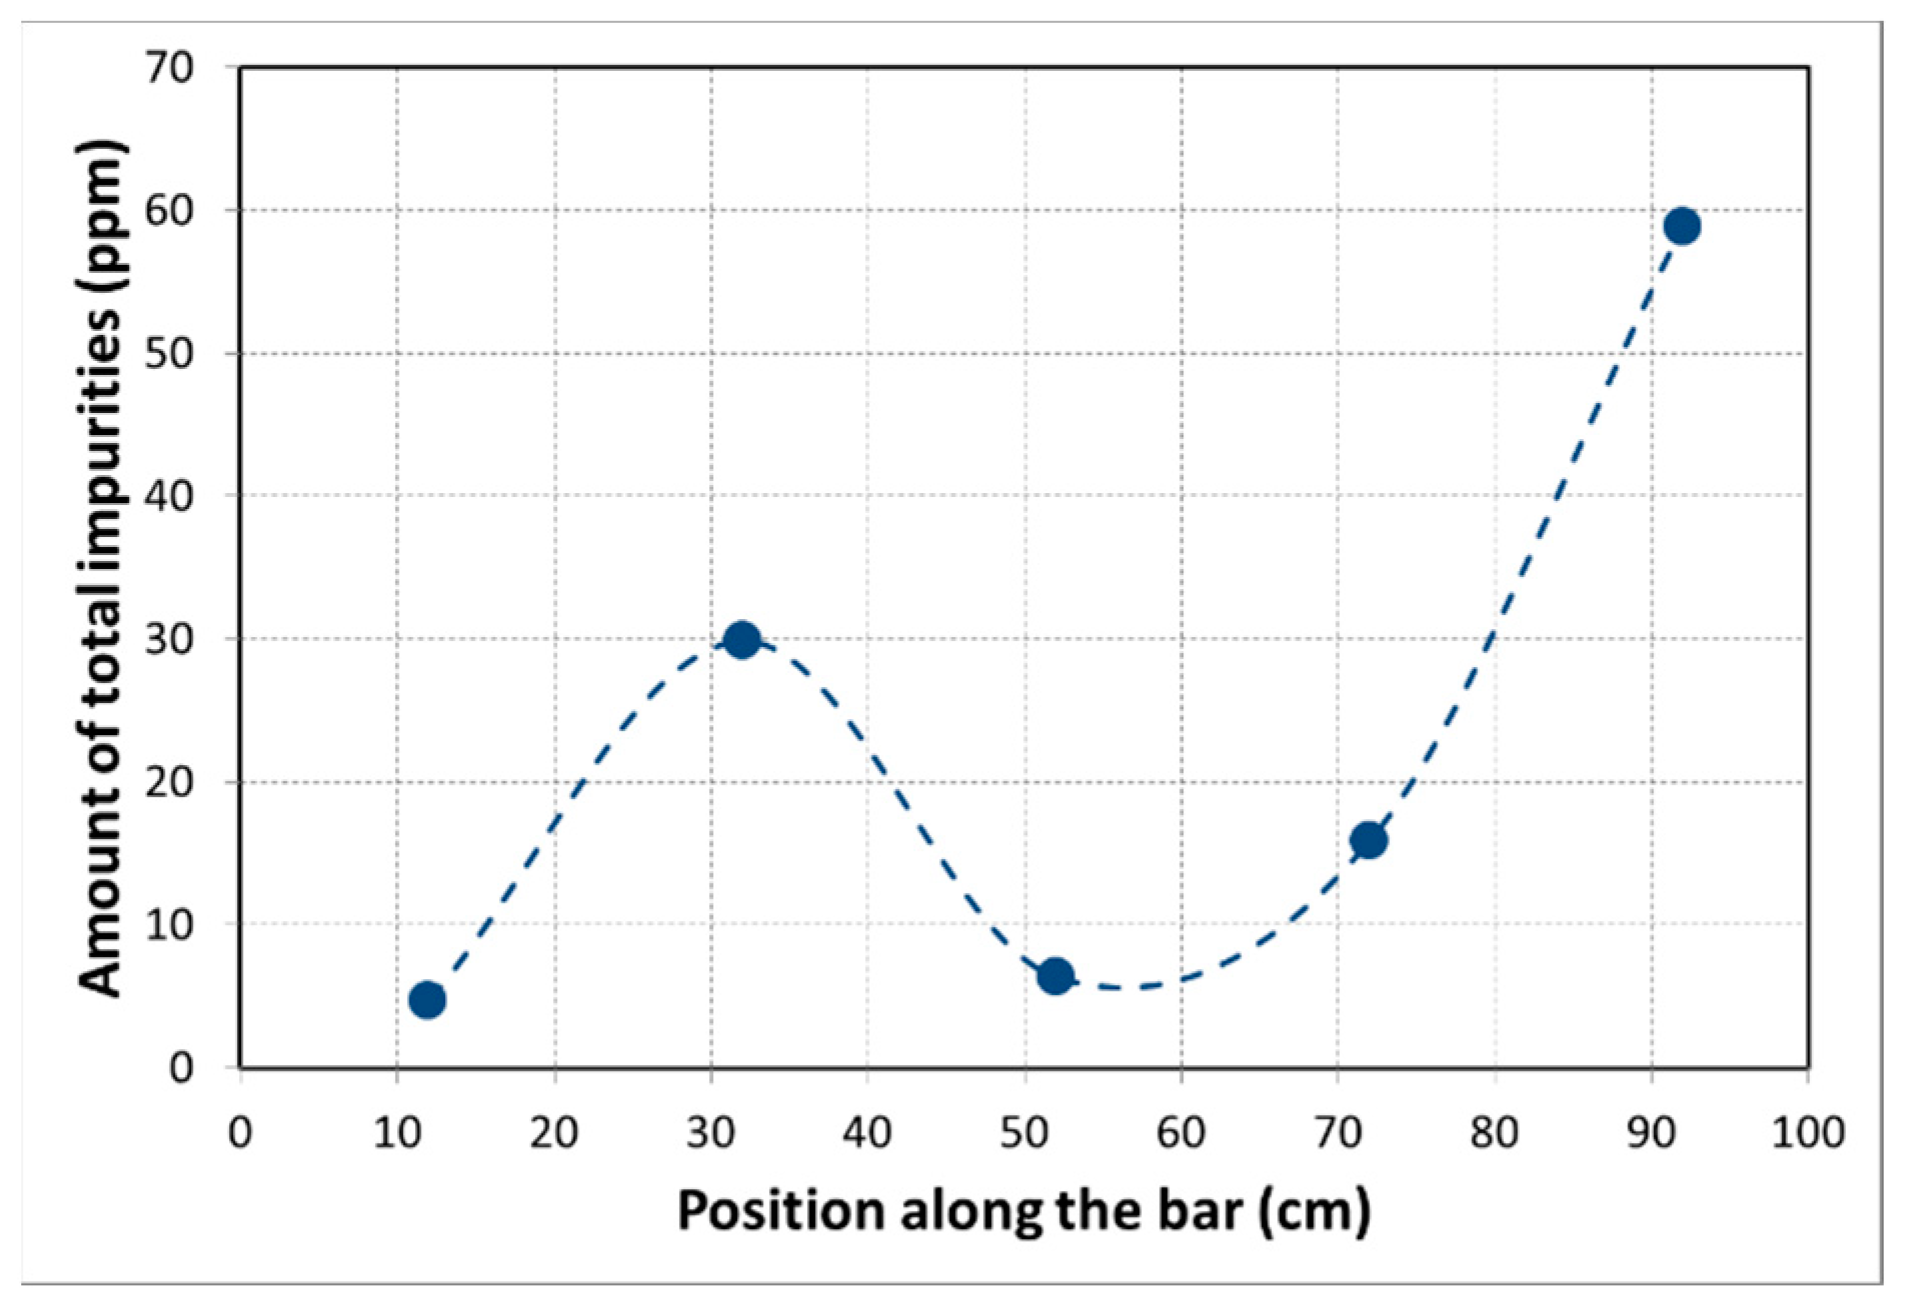
| Position (cm) | Si | Na | Ti | Fe | Sn | Zn | Cu | P | Pb | Total Impurities | Al (%) |
|---|---|---|---|---|---|---|---|---|---|---|---|
| Initial * | <5 | 18 | 9 | <5 | 19 | 23 | 8 | 15 | 24 | 116 | 99.99 |
| 12 | 0.98 | 0.06 | 0.10 | 0.03 | 1.50 | 1.49 | 0.22 | 0.04 | 0.01 | 4.69 | 99.9995 |
| 32 | 2.05 | 0.15 | 0.25 | 3.45 | 0.04 | 20.95 | 1.62 | 0.09 | 1.09 | 29.86 | 99.997 |
| 52 | 1.49 | 0.12 | 0.15 | 1.45 | 0.08 | 1.32 | 1.21 | 0.07 | 0.44 | 6.34 | 99.9994 |
| 72 | 4.01 | 0.04 | 0.04 | 0.76 | 0.01 | 10.56 | 0.28 | 0.09 | 0.00 | 15.86 | 99.998 |
| 92 | 30.37 | 0.04 | 0.03 | 16.54 | 1.28 | 2.93 | 2.22 | 4.96 | 0.51 | 58.89 | 99.994 |
| Impurity Elements | Fe | Si | Ga | V | Ni | Ti | Total Impurities |
|---|---|---|---|---|---|---|---|
| Initial material | 1450 | 354 | 77 | 51 | 35 | 26 | 1993 |
| 1st pass | 1300 | 222 | 89 | 86 | 30 | 40 | 1767 |
| 3rd pass | 1200 | 151 | 75 | 86 | 23 | 40 | 1575 |
| 5th pass | 900 | 86 | 57 | 100 | 18 | 50 | 1211 |
| Reduction (1st pass) | 10% | 37% | −16% | −69% | 14% | −54% | 11% |
| Reduction (3rd pass) | 17% | 57% | 3% | −69% | 34% | −54% | 21% |
| Reduction (5th pass) | 38% | 76% | 26% | −96% | 49% | −92% | 39% |
| Impurity Elements | Fe | Si | Ga | V | Ni | Ti | Total Impurities |
|---|---|---|---|---|---|---|---|
| Initial material | 1450 | 354 | 77 | 51 | 35 | 26 | 1993 |
| 1st pass (at 32 cm) | 720 | 136 | 61 | 116 | <10 | 66 | 1099 |
| 3rd pass (at 52 cm) | 840 | 118 | 67 | 100 | 14 | 49 | 1188 |
| 5th pass (at 12 cm) | 440 | 33 | 31 | 139 | <10 | 88 | 731 |
| Reduction (1st pass) | 50% | 62% | 21% | −127% | >71% | −154% | 44% |
| Reduction (3rd pass) | 42% | 67% | 13% | −96% | 60% | −88% | 40% |
| Reduction (5th pass) | 70% | 91% | 60% | −173% | >71% | −238% | 63% |
| Impurity Elements | Mg | Mn | Fe | Si | Cu | Zn | Ti | Cr | Ga | Total Impurities |
|---|---|---|---|---|---|---|---|---|---|---|
| Initial material | 9900 | 8550 | 4150 | 1790 | 1500 | 310 | 180 | 140 | 90 | 26,610 |
| 1st pass | 7200 | 6100 | 3200 | 1000 | 1200 | 398 | 243 | 199 | 158 | 19,698 |
| 3rd pass | 6100 | 6000 | 2400 | 700 | 900 | 302 | 301 | 203 | 137 | 17,043 |
| 5th pass | 5300 | 5900 | 2100 | 900 | 800 | 248 | 349 | 210 | 130 | 15,937 |
| Reduction (1st pass) | 27% | 29% | 23% | 44% | 20% | −28% | −35% | −42% | −76% | 26% |
| Reduction (3rd pass) | 38% | 30% | 42% | 61% | 40% | 3% | −67% | −45% | −52% | 36% |
| Reduction (5th pass) | 46% | 31% | 49% | 50% | 47% | 20% | −94% | −50% | −44% | 40% |
| Impurity Elements | Mg | Mn | Fe | Si | Cu | Zn | Ti | Cr | Ga | Total Impurities |
|---|---|---|---|---|---|---|---|---|---|---|
| Initial material | 9900 | 8550 | 4150 | 1790 | 1500 | 310 | 180 | 140 | 90 | 26,610 |
| 1st pass (at 42 cm) | 6600 | 6000 | 2700 | 820 | 1100 | 375 | 272 | 202 | 149 | 18,218 |
| 3rd pass (at 22 cm) | 5400 | 5800 | 2000 | 470 | 800 | 297 | 405 | 212 | 129 | 15,513 |
| 5th pass (at 2 cm) | 4400 | 5600 | 1400 | 710 | 620 | 261 | 694 | 227 | 119 | 14,031 |
| Reduction (1st pass) | 33% | 30% | 35% | 54% | 27% | −21% | −51% | −44% | −66% | 32% |
| Reduction (3rd pass) | 45% | 32% | 52% | 74% | 47% | 4% | −125% | −51% | −43% | 42% |
| Reduction (5th pass) | 56% | 35% | 66% | 60% | 59% | 16% | −286% | −62% | −32% | 47% |
Publisher’s Note: MDPI stays neutral with regard to jurisdictional claims in published maps and institutional affiliations. |
© 2021 by the authors. Licensee MDPI, Basel, Switzerland. This article is an open access article distributed under the terms and conditions of the Creative Commons Attribution (CC BY) license (http://creativecommons.org/licenses/by/4.0/).
Share and Cite
Zhang, X.; Friedrich, S.; Friedrich, B. The Influence of Initial Purity Level on the Refining Efficiency of Aluminum via Zone Refining. Metals 2021, 11, 201. https://doi.org/10.3390/met11020201
Zhang X, Friedrich S, Friedrich B. The Influence of Initial Purity Level on the Refining Efficiency of Aluminum via Zone Refining. Metals. 2021; 11(2):201. https://doi.org/10.3390/met11020201
Chicago/Turabian StyleZhang, Xiaoxin, Semiramis Friedrich, and Bernd Friedrich. 2021. "The Influence of Initial Purity Level on the Refining Efficiency of Aluminum via Zone Refining" Metals 11, no. 2: 201. https://doi.org/10.3390/met11020201
APA StyleZhang, X., Friedrich, S., & Friedrich, B. (2021). The Influence of Initial Purity Level on the Refining Efficiency of Aluminum via Zone Refining. Metals, 11(2), 201. https://doi.org/10.3390/met11020201