Abstract
The coefficient of friction (COF) in superlubrication systems exhibits highly strong correlation with experimental parameters. However, previous studies mainly reported the stable superlubrication formed at small sliding radii (2–5 mm), often without clearly specifying the friction radius. This lack of critical parametric not only affects the reproducibility of the experimental results but also hinders the fundamental understanding of superlubrication formation. In this work, the effects of friction radius and linear velocity on lubrication performance were investigated by using a graphene oxide–ethylene glycol (GO-EG) model lubricant in ball-on-disk rotational sliding. The results showed that superlubricity is also achievable within a large radius range (>5 mm). The GO-EG lubricant attained a stable superlubrication state with a minimum COF of 0.0065 under the conditions of a linear velocity of 0.40 m/s and a friction radius of 6 mm. This value was approximately 50% lower than that under a 2 mm radius condition. Even when the friction radius is increased to 8 mm while maintaining the same linear velocity, stable superlubricity can still be retained. Subsequently, a systematic analysis of the tribological experimental data revealed that at different fixed velocity ranges, the average COF showed different radius dependence. At low linear velocity (<0.2 m/s), the COF decreased with increasing radius, whereas at higher velocity (>0.3 m/s), the COF first decreased and then increased with radius. Mechanistic analysis showed that friction radius governed the COF by modulating rotational speed, shear rate, running-in states, and water-film evolution, including evaporation-driven viscosity changes and hydration-layer stability. This study enhances the understanding of superlubrication formation conditions and provides guidance for the evaluation and measurement of lubrication systems.
1. Introduction
The friction and wear that occur on the surfaces of machine parts result in significant energy and material losses [1,2]. According to relevant surveys, the annual economic loss caused by friction and wear accounts for approximately 6% of the gross national product in developed countries [3,4]. Therefore, it is necessary to reduce friction or wear, improve the efficiency of energy utilization, and extend the service life of machinery [5,6]. Researchers have made great efforts to develop lubrication systems with high durability and good anti-wear properties [7,8,9,10]. Following the seminal proposal of “superlubrication” by Hirano and Shinjoo in 1990 [11], researchers have devoted decades of effort to developing superlubrication systems and exploring their potential application [12,13,14]. Superlubrication is defined as a lubrication state with the COF below 0.01. Among them, liquid superlubrication can not only provide surface protection, but also dissipates heat and transfers debris, indicating more promising applications in industry [15,16,17].
Based on the Stribeck curve, the lubrication behavior of liquid lubricants is highly influenced by sliding velocity. The velocity has a direct impact on the thickness of the lubrication film, which influences the formation of superlubrication [18]. Currently, researchers usually list the velocity parameters in their publications to give a clear understanding of the COF [19,20,21,22,23,24,25,26]. Table 1 summarizes the lubricant compositions and experimental parameters under the ball-on-disk rotational mode in superlubrication research in recent years [27,28,29,30,31,32,33,34,35,36,37,38,39,40,41,42,43,44,45]. It can be clearly found that most superlubrication occurred at a suitable sliding velocity. In addition, superlubrication was easy to achieve at a lower radius range (2–5 mm). However, it appears that the radius conditions seem to be ignored in some publications. In fact, the linear velocity is highly related to the radius, according to the equation: linear velocity = angular velocity × radius. Different radii at the same linear velocity correspond to different shear rates, which can affect the formation or thickness of the lubricating film in the contact zone [46]. This neglect can lead to serious consequences in industrial applications. If the friction radius is not clearly specified, the difference in shear rate under the same linear velocity may aggravate the wear of key mechanical components, increase energy consumption, and even cause mechanical failures, which reduces productivity and raises maintenance costs. Therefore, it is necessary to conduct a systematic study of this issue to provide more accurate formation conditions for future lubrication measurement and superlubrication research, and reduce unnecessary losses caused by improper parameter settings in industrial production.

Table 1.
Current conditions for superlubrication research.
In this study, a graphene oxide–ethylene glycol aqueous dispersion was used as a model lubricant. The tribological experiments under different radii and velocities were investigated. A stable superlubrication state was achieved within a large radius range (6–8 mm) and a wide linear velocity range (0.2–0.4 m/s). Based on the results of the tribology test, the formation behavior of superlubrication was further summarized and discussed. This study emphasizes the role of radius in superlubrication and provides insights to improve the reproducibility of the experimental measurements, thereby deepening the understanding of the superlubrication mechanism for future research.
2. Materials and Methods
2.1. Materials
The graphene oxide (GO) aqueous dispersion (lateral dimension: 3–8 μm, concentration: 21.26 mg/g) was commercially obtained from Hangzhou Gaoxi Technology Co., Ltd. (Hangzhou, China). Ethylene glycol (EG, 99% purity) was purchased from Shanghai Titan Scientific Co., Ltd. (Shanghai, China). The GO dispersion was diluted with pure water (Wahaha Group Co., Ltd., Hangzhou, China) under continuous magnetic stirring (500 rpm) for 60 min to achieve a homogeneous low-concentration dispersion (2 mg/g). Subsequently, an aqueous ethylene glycol solution was prepared by mixing pure water and EG in a mass ratio of 5:1 (H2O:EG). The diluted GO dispersion was then combined with the aqueous EG solution at a volumetric ratio of 1:5. The mixture underwent magnetic stirring (500 rpm, 15 min) followed by ultrasonication (40 W, 15 min) using a probe so nicator to obtain the final test solution.
2.2. Tribological Tests
Tribology tests were performed using a UMT TriboLab tribometer (Bruker Corporation, USA) in a ball-on-flat configuration. The tribopair consisted of an upper silicon nitride (Si3N4) ball (Hanshuo Hardware Products Co., Ltd., Shanghai, China, diameter: 6 mm, surface roughness (Ra): 20 nm) and a lower sapphire substrate (Chongqing Zhaohong Technology Co., Chongqing, China; dimensions: 20 × 20 × 1 mm3, Ra: 2 nm). Testing parameters included: normal load 2 N, sliding velocity 0.05–0.5 m/s, and track radius 2–8 mm (Figure 1). This experimental design enabled the systematic investigation of shear rate effects (through radius variation) under constant linear velocity conditions. Prior to testing, the sample solution was ultrasonicated (40 kHz, 5 min) to ensure dispersion stability. The tribopair surfaces were sequentially cleaned with deionized water and ethanol (≥99.7%) in an ultrasonic bath. Subsequently, 10~50 μL of the samples were dispensed onto the sapphire substrate using a pipette gun for tribological experiments. To ensure all experiments were conducted under ambient conditions (25 ± 1 °C, 60 ± 5% RH), the laboratory’s air circulation and temperature–humidity control equipment will be utilized for real-time monitoring and regulations. The steady-state COF was determined by averaging data from the stable phase (the last 60% of the test duration), with two replicate tests performed for each condition. Measurement uncertainty was maintained at ±0.001.
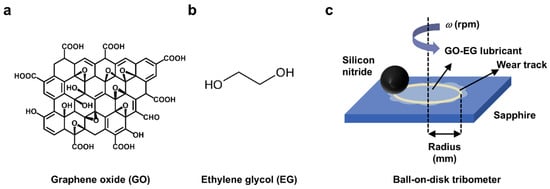
Figure 1.
(a) Molecular structure of GO, (b) molecular structure of EG, (c) schematic of friction test of a silicon nitride ball on a sapphire glass sheet; the ball remains stationary while the glass substrate rotates around the ball.
2.3. Characterizations
Fourier-transform infrared spectroscopy (FTIR, PerkinElmer Paragon 1000) equipped with an attenuated total reflection (ATR) accessory was employed for functional group identification in the range of 4000–500 cm−1. Raman spectroscopy (Raman, Thermo Scientific DXR2, Newark, DE, USA) was used to analyze the surface structure and vibration characteristics of graphene oxide nanosheets. X-ray Photoelectron Spectroscopy (XPS, Thermo Scientific K-Alpha, Newark, DE, USA) was utilized to determine the GO functional groups and elemental contents. Transmission electron microscopy (TEM, Zeiss Gemini 300, Oberkochen, Germany) and atomic force microscopy (AFM, Bruker Dimension Icon, Oberkochen, Germany) were used to determine the GO micro surface morphology. The wear track characterization was performed using a laser confocal microscope (Keyence China, Keyence VK-X150, Shanghai, China) to acquire the three-dimensional surface topography, roughness average (Ra), and wear volume through multi-plane reconstruction. The kinematic viscosity of the dispersion was measured using a low-temperature kinematic viscometer (Beijing Xuxin Instrument Equipment Co., Ltd., Model ST-1516A, Beijing, China). Furthermore, the lubricating film thickness in the worn region was calculated using the Hamrock–Dowson formula, and the lubrication states under different friction conditions were determined by calculating the film thickness ratio (λ). Chemical characterization of wear scars was carried out via X-ray photoelectron spectroscopy (XPS, Thermo Scientific K-Alpha) with charge compensation. The mechanism of friction chemical film formation was focused on by comparing the C1s (284.8 eV) of the worn surfaces.
3. Results
3.1. Material Characterizations
The composition and structure results of GO nanosheets are shown in Figure 2. The FTIR spectra of GO in Figure 2a exhibited typical peaks at 1042 cm−1 (C–OH), 1612 cm−1 (C=C), 1730 cm−1 (C=O in carboxylic acid), and 3400 cm−1(O–H) [35], which indicated an abundance of oxygen-containing functional groups on the GO surface. The defect and vibration characteristics of the GO nanosheets detected by Raman spectroscopy are shown in Figure 2b. The D peak at 1350 cm−1 indicated the defects on the GO nanosheets, while the G peak at 1590 cm−1 proved the existence of ordered, unoxidized, or partially oxidized graphene regions [47]. Due to the severe damage of the sp2 conjugate network and numerous structural defects, the 2D peak at 2590 cm−1 was weak and difficult to distinguish. The presence of the D + G peak at 2935 cm−1 indicated that the GO nanosheets used showed a high degree of disorder and defect density. In addition, the XPS results showed a C/O ratio of approximately 2.184, indicating a comparatively high oxygen content in the GO. High-resolution C1s spectra were processed for peak area fitting, and the characteristic peaks were C-C (284.6 eV), C-O 286.6 eV, and C=O 288.1 eV [48,49]. The area under each peak was 43.5%, 53%, and 3.5%, respectively, which suggests that the oxygen-containing groups of pristine GO are mainly hydroxyl and epoxy groups, with fewer carboxyl groups (Figure 2c). The TEM result showed that the GO was a flat sheet with a two-dimensional structure (Figure 2d). The wrinkles were observed on both the basal plane and edge of the GO sheets, which can be attributed to the presence of oxygen-containing functional groups [50,51]. The AFM results indicated that the GO was highly exfoliated, showing a thickness of approximately 0.8–1.2 nm (Figure 2e–f). In contrast, the thickness of pristine graphene is about 0.33 nm [52]. The increase in thickness of the GO sheet can be attributed to the presence of hydroxyl and epoxy groups on the surface [53].
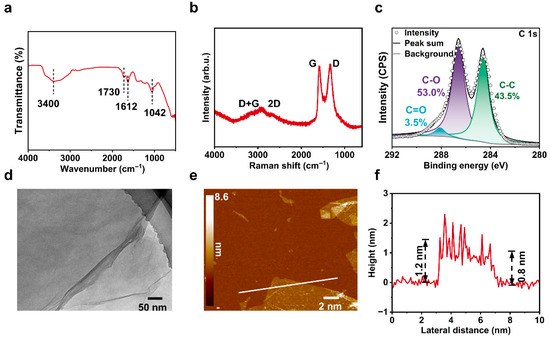
Figure 2.
Characterizations of GO. (a) FTIR, (b) Raman, (c) C1s spectra, (d) TEM, and (e,f) AFM.
3.2. Tribological Experiments
The measurements under different sliding velocities (0.20, 0.40, and 0.50 m/s) and rotation radii (2 mm and 6 mm) were carried out to explore the effect of these two parameters on the COF. The results showed that the rotation radius can influence the formation of superlubrication under the same velocity. As shown in Figure 3a, the COF exhibited similar decreasing trends versus time at 0.20 m/s but eventually stabilized at 0.007 (2 mm radius) and 0.012 (6 mm radius). At a 2 mm radius, the system showed stable superlubrication after about a 2193 s running-in period. However, there was no superlubrication formation at a 6 mm radius under the same velocity (0.20 m/s). In contrast, when the velocity was increased to 0.40 m/s, the COF curve showed a shorter running-in period at a 6 mm radius. The stable COF value under a 2 mm radius (~0.012) was slightly higher than the superlubrication level (Figure 3b). With a further increase in velocity to 0.50 m/s (Figure 3c), the COF curve showed a sharp increase after 1394 s at a 2 mm radius. In this case, the rotational speed was up to 2400 rpm, which may result in the breakdown of the stable lubrication film. The COF curve results in Figure 3 indicate that the GO-EG dispersion owned linear velocity and radius dependence, which might be attributed to the interface shear effect resulting from the combined action of both factors.
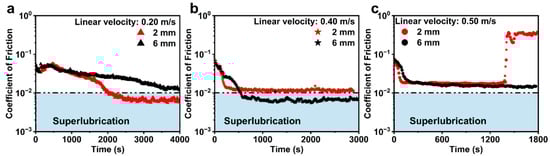
Figure 3.
COF curves of the GO-EG dispersion at rotation radii of 2 mm and 6 mm, with the fixed linear velocity of (a) 0.2 m/s, (b) 0.4 m/s, and (c) 0.5 m/s.
Tribology tests were further extended to cover seven linear velocities (0.05, 0.10, 0.15, 0.20, 0.30, 0.40, and 0.5 m/s) and rotation radii ranging 2, 3, 4, 5, 6, 7, and 8 mm. The COF curves are shown in Figure 4. The stable superlubrication was achieved at a moderate linear velocity range (0.20–0.40 m/s), while it failed to occur at both lower (0.05–0.15 m/s) and higher (0.50 m/s) velocities. Notably, at 0.15 m/s with a 2 mm radius (720 rpm rotational speed), the COF reached below 0.015 (Figure 4c), approaching the superlubrication level. In Figure 4d, stable superlubrication was achieved at 0.20 m/s-2 mm and 0.20 m/s-4 mm (960 rpm and 480 rpm, respectively), though requiring longer running-in periods (2005 s and 3122 s). When the sliding velocity was increased to 0.30 m/s, the running-in period for reaching superlubrication was significantly reduced to 612–1125 s (Figure 4e). The stable superlubrication occurred under 0.40 m/s linear velocity over a broad radius range, with the relatively shorter running-in period (Figure 4f). Although the COF at a 2 mm radius under this velocity remained slightly above 0.01, it was already very close to the superlubrication level (stable COF ≈ 0.012). Remarkably, at 0.50 m/s, superlubrication failed at all tested radii (2–8 mm), particularly in the 2–4 mm range. The COF exhibited a sharp increase due to the lubricant film breakdown resulting from direct contact (Figure 4g).
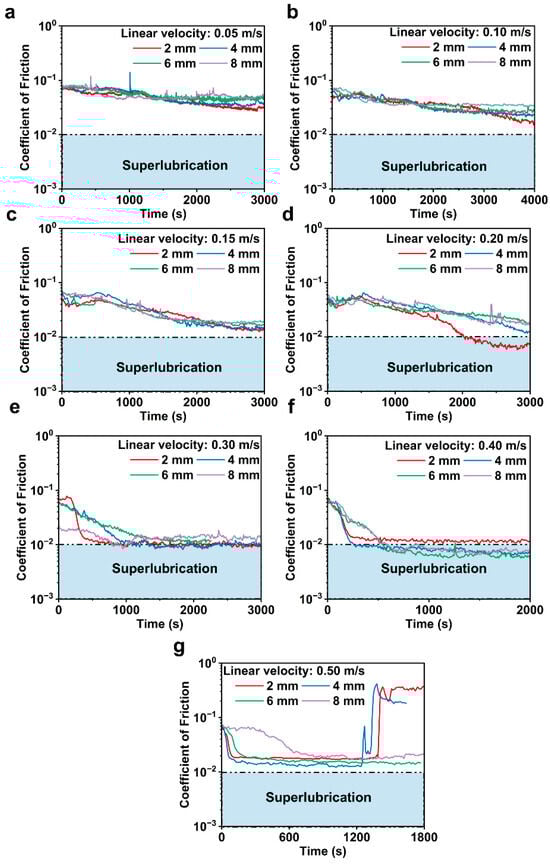
Figure 4.
COF curves versus time at different linear velocities and rotational radii: (a) 0.05 m/s, (b) 0.10 m/s, (c) 0.15 m/s, (d) 0.20 m/s, (e) 0.30 m/s, (f) 0.40 m/s, and (g) 0.50 m/s.
The average COF was determined by calculating the COF values in the steady-state regime under different test conditions (Figure 5). Firstly, Figure 5a exhibits the variation in the average COF with rotational radii at constant linear velocities. The average COF at lower linear velocities (0.05, 0.10, and 0.15 m/s) showed an increasing trend with rotational radius. At 0.05 m/s, as the radius increased from 2 mm to 8 mm, the rotational speed varied from 240 to 60 rpm, and the stable average COF increased by 40.6% (from a minimum of 0.032 to a maximum of 0.045). At 0.10 m/s, the increasing trend became more obvious. The stable COF soared by 118.7%, from 0.016 (at 2 mm) to 0.035 (at 8 mm). At 0.15 m/s, a similar increase (from 0.012 to 0.019) occurred. Although the lubrication performance was significantly improved by increasing linear velocity, the average COF was still out of the superlubrication level. Superlubrication was achieved at 0.20 m/s linear velocity in the range of 2–5 mm rotational radius. The lowest COF of approximately 0.007 was observed at 2 mm. The lubrication performance was improved with the increase in the radius, reaching about 0.010 at 5 mm. The average COF gradually increased with rotational radius, exiting superlubrication level. Notably, at higher linear velocities (0.30, 0.40, and 0.50 m/s), the average COF exhibited a different trend compared to that at 0.05–0.20 m/s. As shown in Figure 5a, the average COF as a function of radius exhibited an optimal performance range. At the linear velocity of 0.30 m/s, when the rotational radius was 2 mm, the COF was approximately 0.010, which was the edge of superlubrication. As the rotational radius increased, the COF started to enter the superlubrication state and remained stable up to the radius of 5 mm (~0.010). When the linear velocity was 0.40 m/s, stable superlubrication was achieved across a broad radius range including larger values (6–8 mm). The stable COF reached a minimum value of about 0.006 at 6 mm, a decrease of about 50% compared to that at 2 mm. Then, it started to increase, and finally reached 0.009 at 8 mm, a 33.3% increase compared to the value at 6 mm. Obviously, at lower velocity, the weak hydrodynamics effect was insufficient to sustain an effective lubrication film, while the increase in linear velocity improved the hydrodynamics effect of GO-EG dispersion, resulting in stronger stress distribution. However, the excessive linear velocity can destroy the liquid film, resulting in direct contact between friction pairs and a COF increase beyond the superlubrication level (as shown at 0.50 m/s in Figure 5a).
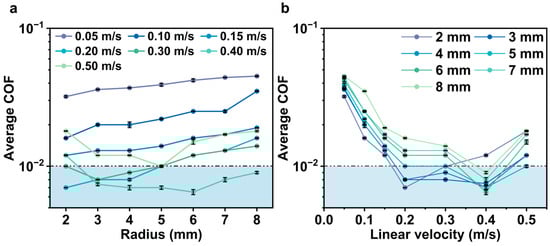
Figure 5.
The relationship between the average COF in the stable lubrication period and (a) radii of 2–8 mm and (b) velocities of 0.05–0.50 m/s.
In order to further explore the variation in average COF, the rotational radius was fixed and the influence of linear velocity on COF was analyzed. When the average COF results were reorganized at a fixed rotational radius, a clear trend in COF variation with linear velocity was observed (Figure 5b), in agreement with previous studies [54,55]. This phenomenon also originated from the tribological characteristics of liquid lubricants, which have been well discussed in previous studies [56,57,58]. In addition, the differences in friction-reducing performance at the same linear velocity but different radii were most significant in the moderate velocity range (0.15–0.30 m/s), which affected the accurate description of superlubrication formation conditions.
A comprehensive analysis of the COF results in Figure 4 and Figure 5 reveals that the dependence of the COF curve of the GO-EG dispersion system on rotation radius and linear velocity follows the following relationships. The running-in period is negatively correlated with linear velocity and positively correlated with rotation radius. Under low linear velocity conditions (0.05–0.20 m/s), the COF shows a negative correlation with the rotation radius. Under high linear velocity conditions (0.30–0.50 m/s), the COF first decreases and then increases as the rotation radius increases. As for the relationship between COF and linear velocity, the COF also decreases first and then increases with the increase in linear velocity.
Based on the large amount of experimental data, further regularity was summarized, and the friction condition with an average COF of more than 0.020 was defined as the “non-superlubricity” regime. The region between the superlubricity and non-superlubricity regimes is typically defined as the transition region, with the average COF within the 0.010 to 0.020 range. All average COF values were summarized to obtain the correlations between the average COF during stable lubrication and the test parameters (radius and velocity), as shown in Figure 6.
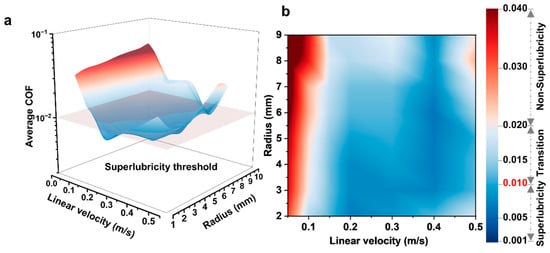
Figure 6.
(a) Three-dimensional and (b) two-dimensional correlation plots between radius, linear velocity, and average COF.
Based on this, a more in-depth discussion was conducted to analyze the influencing factors of radius and linear velocity changes on average COF. Under the conditions of the same radius and different linear velocities, the COF first decreased and then increased with linear velocity. This variation conforms to the change law between linear velocity and COF in the Stribeck curve. When the linear velocity was kept constant, changing the friction radius had an impact on the COF; moreover, under different linear velocities, the variation trend of COF with radius also differed. The reason for this phenomenon may be that the change in lubrication state leads to the change in the COF. According to the Stribeck curve, the influencing factors of the lubrication state include the viscosity of the lubricant, sliding velocity, and load. From this, it can be further inferred that the change in radius may affect the rotational speed, which in turn leads to a change in the viscosity of the lubricant in the contact area, and ultimately causes a change in the COF.
3.3. Surface and Lubrication State Analysis
Subsequently, a series of characterizations were conducted to verify the previously proposed speculation. First, the roughness average (Ra) of the worn area was measured, and the wear rate was calculated by a laser confocal microscope (Figure 7b). Explore the influence of the variation in radius linear velocity on the wear rate.
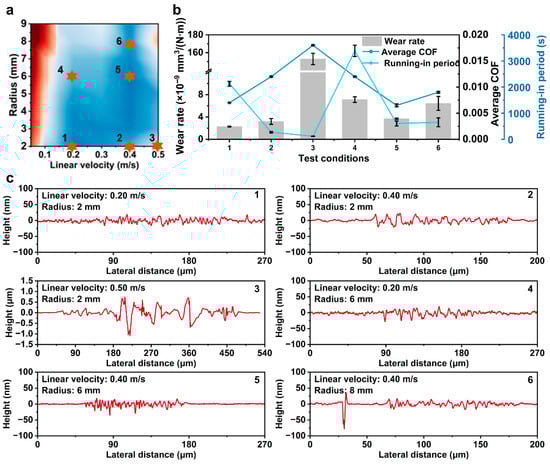
Figure 7.
Laser confocal microscope results of wear tracks on the substrate after friction. (a) Correlation plot between radius, linear velocity, and average COF. (b) Wear rate. (c1–c6) 0.20 m/s-2 mm, 0.40 m/s-2 mm, 0.50 m/s-2 mm, 0.20 m/s-6 mm, 0.40 m/s-6 mm, and 0.40 m/s-8 mm.
The wear behavior under different linear velocities was investigated when the friction radius was 2 mm. At the linear velocity of 0.20 m/s, the stable COF was 0.008, and the wear rate was 2.27 × 10⁻⁹ mm3/(N·m) (Figure 7b), corresponding to a low Ra value of 5 nm (Figure 7(c1)). When the velocity increased to 0.40 m/s, the Ra of the worn area remained unchanged at 5 nm (Figure 7(c2)), the COF increased to 0.012, and the wear rate also increased to 3.19 × 10⁻⁹ mm3/(N·m) (Figure 7b). Notably, when the linear velocity surged to 0.50 m/s, the COF increased sharply, the wear rate rose to 1.53 × 10⁻⁷ mm3/(N·m) (Figure 7b), and the Ra increased significantly to 209 nm (Figure 7(c3)). The change in linear velocity causes a variation in tribological properties, as reflected in the changes in COF and wear rate, indicating that a certain hydrodynamic effect exists in the system. Meanwhile, under the condition of high linear velocity (0.5 m/s), obvious grooves appeared, resulting in significant adhesive wear, which may be caused by direct contact between the upper and lower surfaces during the running-in period.
Subsequently, an analysis was conducted under the conditions of the same linear velocity and different friction radii. Under the condition of a linear velocity of 0.20 m/s: When the friction radius increased to 6 mm, the wear rate rose to 7.12 × 10⁻⁹ mm3/(N·m) (Figure 7b), the Ra increased slightly to 7 nm (Figure 7(c4)), and the COF also increased to 0.012.
Under the condition of a linear velocity of 0.40 m/s, when the friction radius was 2 mm, the Ra was 5 nm (Figure 7(c2)), the wear rate was 3.19 × 10⁻⁹ mm3/(N·m) (Figure 7b), and the COF was 0.012. When the friction radius increased to 6 mm, the COF decreased to 0.006, and the Ra decreased to 4 nm (Figure 7(c5)), while the wear rate increased slightly to 3.7 × 10⁻⁹ mm3/(N·m) (Figure 7b). When the friction radius continued to increase to 8 mm, compared with the condition of 6 mm, Ra and COF increase slightly, showing a higher wear rate (Figure 7b,(c6)). Under this condition, the variation trends of wear rate and COF corresponding to friction radii of 2 mm and 6 mm were inconsistent. The reason for this phenomenon is speculated as follows. When the linear velocity is kept constant, an increase in the friction radius leads to a decrease in rotational speed, which in turn prolongs the running-in period during the friction process; the lubrication state during the running-in period is mainly boundary lubrication, where the two friction pairs are in direct contact, resulting in a large amount of wear. Therefore, the prolonged running-in period leads to an increase in the wear rate.
To accurately analyze the lubrication state, the Hamrock–Dowson (H-D) formula was employed to calculate the lubricating film thickness (
) between the surfaces of the upper and lower friction pairs in different lubrication regions.
The calculation formula for the theoretical film thickness hc is as follows [22].
Among the parameters, Q = κE’, S = ηu/(E’R), and M = w/(E’R2), where κ denotes the PVC of GO-EG, with a specific value of κ ≈ 4 GPa−1 [22]; η represents the dynamic viscosity of the lubricant; u stands for the average linear velocity of the friction pairs; the applied load is w = 2 N; c is the calculated ellipticity, a constant with c ≈ 1.03 [22]; and E’ refers to the equivalent elastic modulus of the friction pairs.
Based on the above equations, the theoretical lubricating film thicknesses between the upper and lower friction pairs in different regions were calculated, as presented in Table 2. The final λ values were then derived using the calculated film thicknesses and the surface roughness values of the upper and lower friction pairs via the following relationship:
Table 2.
Values of linear velocity (u), wear spot diameter (d), dynamic viscosity (η), equivalent radius (R), contact pressure (P) in the friction area, lubricating film thickness (
), and corresponding symbols for the samples in Figure 7 (Number).
The lubrication states corresponding to the three distinct COF levels were determined using the calculated λ values (Table 3). First, under the condition of 0.10 m/s (linear velocity) and 6 mm (friction radius), the corresponding COF level region is a non-ultra-lubrication region. At this point, the λ value is 0.896, and the corresponding lubrication state is the boundary lubrication state. This is due to the fact that at lower velocities, the liquid film is thinner, and the resulting hydrodynamic effects do not provide sufficient carrying capacity. Under the conditions of 0.20 m/s linear velocity and 6 mm radius, as the system operated under the lubrication condition of relatively low linear velocity and large radius, the interlayer shear between the friction pairs and the lubricant was limited. Stable lubrication mainly relied on the formation of a lubricating film through long-term running-in and shear processes. The lambda (λ) value was 2.048, which corresponded to mixed lubrication, and the COF level fell within the transition region. Under the condition of 0.40 m/s, the λ values corresponding to friction radii of 6 mm and 8 mm are all higher than 3, which means that these cases were in the hydrodynamic lubrication state. Their corresponding COF level was the superlubrication level. Notably, when the stable lubrication was formed at a 2 mm radius, high velocity (0.40 m/s) can lead to a very high rotational speed (approximately 1920 rpm), which may generate considerable heat and cause the water in the liquid lubricant to evaporate. The viscosity value of the remaining GO-EG mixture was too high to be measured. At this point, the dynamic viscosity of the lubricant in the contact area during stable lubrication must be significantly higher than those of lubricants corresponding to 6 and 8 mm due to the removal of water. Since the values of other physical quantities used for calculating the λ were close to each other, the λ value at 2 mm should be higher than those at 6 mm (7.248) and 8 mm (11.573), which is also true for hydrodynamic lubrication. At 2 mm, the COF level was in the transition region, while the COF was the superlubrication level at 6 and 8 mm. The correlation of COF values with lubricant viscosity was consistent with the results of the hydrodynamic lubrication state in the Stribeck curve. Compared to the condition at 0.40 m (which was confirmed to be in the hydrodynamic lubrication regime), the higher linear velocity of 0.50 m/s increased the rotational speed, which rose from 1920 rpm to 2400 rpm under a constant radius (2 mm). This enhanced the evaporation behavior of water in the lubricant, ultimately resulting in the viscosity. According to the Stribeck curve, for the 0.50 m/s-2 mm condition relative to the 0.40 m/s-2 mm one, the increases in viscosity and linear velocity indicated that the 0.50 m/s condition initially was in the hydrodynamic lubrication state, prior to the observed sudden surge in the COF curve.
Table 3.
Roughness average of upper and lower friction pairs (σ1, σ2), theoretical film thickness ratios (λ), lubrication state in different friction regions, and corresponding symbols for the samples in Figure 7 (Number).
The transition in lubrication state was attributed to the longer high interfacial shear. This intense shear generated lots of heat, which evaporates nearly all the moisture in the lubricant. The stability of the hydration layer relies on the synergistic effects of the energy barrier against water depletion, water content, and the hydrophilic functional groups on GO surface. Firstly, a stable hydration layer requires a sufficiently high energy barrier for removing interfacial water under load and shear. In this work, the shear characteristics of two-dimensional GO sheets are easy to form a low-shear interface, increasing the energy barrier for hydration layer destruction. However, excessive shear can damage the stable interlayer structure, causing a low barrier and collapsed hydration layer. Secondly, in a water-based lubrication system, an appropriate water content in the lubricant is crucial for maintaining lubrication stability. It not only meets the requirement for constructing a continuous and water-permeable hydrogen-bond network at contact interface, but also, excessive evaporation of water significantly reduces the supply of interfacial water and weakens the hydration layer. Thirdly, the abundant oxygen-containing functional groups (–OH, –COOH, and epoxy) on the GO surface provide sufficient binding sites for the construction of hydrogen bond networks. However, excessive interlayer shear can result in local delamination or GO sheet destruction, leading to the detachment of oxygen-containing functional groups and impairing the stability of the hydration layer. In summary, factors such as excessive interlayer shear, insufficient interfacial water supply, and the degradation of the GO sheet may destroy the hydration layer, making it difficult to maintain the stability of the lubricating film [22]. When the hydration layer was collapsed, the lubrication state was transferred to boundary lubrication, which was clearly evidenced by the sharp increase in the COF curve (Figure 4g) and the obvious wear track on the substrate (Figure S1c).
The above analysis results can be interpreted through a Stribeck curve. When the friction radius was kept constant, linear velocity showed a dominant influence on the COF. As shown in Table 3 (6 mm radius), with the increased velocity, the lubrication state transferred from the boundary to mixed lubrication finally changes to hydrodynamic lubrication. This is attributed to the enhancement of the hydrodynamic effect of lubricant (non-Newtonian fluid), leading to a stronger lubricating film. This dense film can provide load-bearing capacity, thereby reducing the COF. Owing to the shear thinning effect of the lubricant, hydrodynamic lubrication dominated by fluid shear was formed, enabling the COF to reach the superlubrication level.
The impact of radius variation on the COF varied across different ranges. In lower linear velocity ranges (<0.10 m/s), regardless of the radius, the shearing effect of the upper and lower friction pairs on the lubricant was limited. This led to insufficient hydrodynamic effect, failing to form a lubricating film of a certain thickness. When the linear velocity exceeded 0.10 m/s, the sufficient linear velocity could provide strong shear strength. This not only enhanced the hydrodynamic effect but also accelerated the evaporation of moisture in the lubricant, increasing the viscosity of the lubricant. The combined effect of these two factors increased the thickness of the lubricating film and changed the lubrication state.
To analyze the presence of lubricating films in the wear area of friction pairs under different conditions, subsequently, XPS analysis was further performed on the worn surfaces of the friction pairs in different lubrication regions (Figure 8). Distinct C 1s signals were detected on the substrate surfaces exhibiting different COF levels, confirming the presence of surface friction films. Under boundary and mixed lubrication regimes, the boundary friction films were formed by the interaction between the lubricant and the upper/lower friction pairs. During the friction process, GO nanosheets formed adsorption films on the surface of friction pairs via electrostatic adsorption. Under hydrodynamic lubrication, although there was no direct contact in the contact zone, a running-in period was experienced before the formation of stable lubrication. During this running-in period, direct contact between the friction pairs led to the formation of friction films, which provided a foundation for the subsequent stable superlubricity. At this point, the lubrication state tended more toward full-film lubrication.
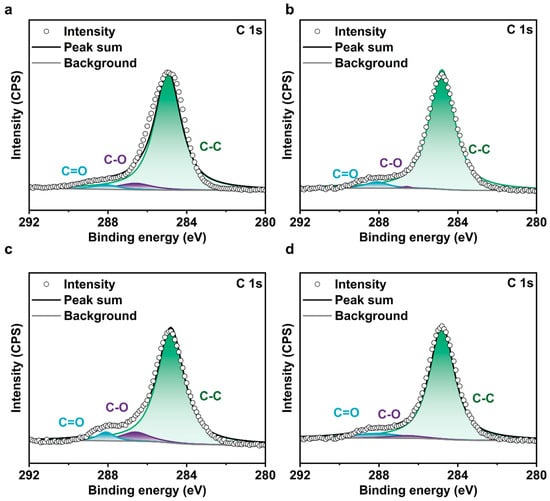
Figure 8.
C1s XPS results of wear tracks on the substrate after friction testing: (a) 0.40 m/s-2 mm, (b) 0.10 m/s-6 mm, (c) 0.20 m/s-6 mm, and (d) 0.40 m/s-6 mm.
3.4. Lubrication Mechanisms
Based on the above experimental results, the lubrication mechanism at different velocities and radii were proposed (Figure 9a). Under the condition of low linear velocity (<0.10 m/s), the system was in a boundary lubrication state and maintained a low shear state at any radius. The hydrodynamic effect generated at this time could not provide sufficient load-carrying capacity, resulting in poor lubrication performance and relatively high COF. When the linear velocity increased to 0.20 m/s (Figure 9b), the mixed lubrication was formed. A slight increase in linear velocity improved the shearing effect, but the limited linear velocity increase was insufficient to support the rapid transition of the lubrication state. Stable lubrication mainly relied on a long running-in period. Even if the friction radius was reduced to further enhance the shear strength, the running-in period required to form stable lubrication still reached 2193 s.
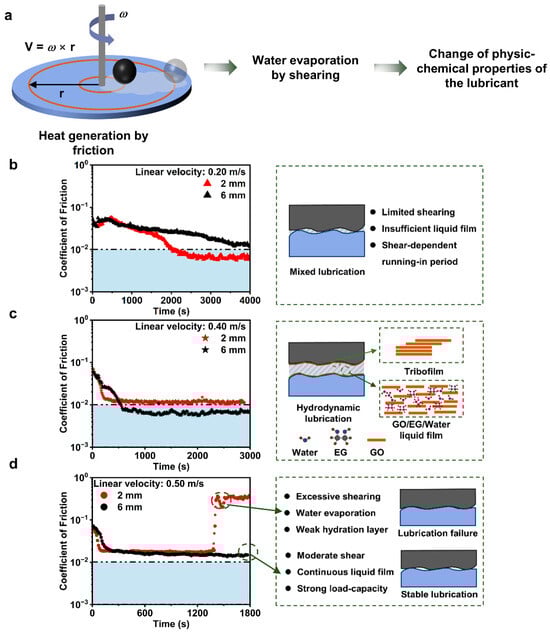
Figure 9.
Lubrication mechanism of the GO-EG lubrication system with a radius varying with COF at different linear velocity levels. (a) Lubrication mechanism. COF curves and schematic diagrams at the friction interface under conditions of (b) 0.20 m/s, (c) 0.40 m/s, and (d) 0.50 m/s.
When the linear velocity increased to 0.40 m/s, the significantly increased linear velocity remarkably improved the shear strength. High-speed interlayer shearing brought about a strong hydrodynamic effect and simultaneously accelerated the evaporation rate of water during the shearing process, which greatly shortened the running-in period required for stable lubrication. Moreover, during the running-in process, the boundary film formed on the surfaces of the friction pairs interacted with the liquid film, achieving stable superlubrication. In this case, the lubrication model was thin-film lubrication, and the COF was determined by the viscosity of the lubricant. The moisture evaporation caused by shearing and the moisture absorption of the lubricant from the air reached a dynamic equilibrium, thus stabilizing the hydration in the liquid film. However, a decrease in the friction radius would lead to an accelerated water loss, which weakened the hydration, and an increase in lubricant viscosity increased the shear resistance, ultimately resulting in a rise in the COF (Figure 9c). When the linear velocity increased to 0.50 m/s (Figure 9d), the rotational speed reached approximately 2400 rpm at the radius of 2 mm. Excessive interlayer shearing caused a large amount of heat during the friction process, triggering massive evaporation of the water in the lubricant, and thereby affecting the load-carrying capacity of the lubricating film. As the shearing process continued, the lubricating film broke, the friction pairs came into direct contact, and lubrication failure occurred. In contrast, under the condition of a 6 mm radius, the increase in radius reduced the shear rate, thereby slowing down water loss. The continuous and stable lubricating film exhibited strong load-carrying capacity, ensuring the stability of lubrication (Figure 9d).
4. Conclusions
Based on a comprehensive literature review, this study found that the neglect of the friction radius condition in superlubricity research can influence the reliability and reproducibility of the COF results. A GO-EG lubrication system was adopted to investigate the synergistic effects of friction radius and linear velocity on the COF. The following conclusions were drawn.
The results revealed that superlubricity can be achieved not only at low linear velocities within a small radius range (2–5 mm), but also at high linear velocities with larger radii (>5 mm). This breaks through the limitations of traditional laboratory research on superlubricity that focuses on small radii of 2–5 mm. Furthermore, the system is more prone to achieving superlubricity at moderate linear velocities (0.20–0.40 m/s). Through a systematic study of radius (2–8 mm) across a linear velocity range of 0.05–0.50 m/s, it was found that the COF increased with increasing radius at low linear velocity conditions (0.05–0.20 m/s), while at higher linear velocity conditions (0.30–0.50 m/s), the COF first decreased and then increased as the friction radius increased. The correlation with wear, running-in period, and lubrication states were established. The tribological performance of GO-EG showed an obvious radius-dependent effect. It may be attributed to the concomitant change in rotational speed, which is intrinsically linked to radius variation at a fixed linear velocity. The changes in radius led to the variations in the evaporation of water in the lubricants, which in turn influenced the liquid viscosity and film thickness. Ultimately, this chain of effects modified the lubrication state, with the impact manifested as changes in the COF. XPS characterization results indicated the formation of a boundary film during the running-in period. The stable superlubrication achieved in this study may have been in the state of thin-film lubrication. This research focuses on the friction radius, a long-overlooked critical parameter in the field of superlubricity, and systematically reveals its synergistic mechanism with linear velocity, effectively filling the research gap in this area. It provides important guidance for the standardized setting of parameters in superlubricity experiments and the improvement of result reproducibility. It provides a relatively systematic parameter-matching mechanism for the processing field of components such as small bearings and precision gears, lays a solid theoretical foundation for the accurate matching between experimental parameters and actual working conditions in subsequent engineering applications, and also offers new insights for future superlubricity research.
Supplementary Materials
The following supporting information can be downloaded at: https://www.mdpi.com/article/10.3390/lubricants14020049/s1. Figure S1. The surface profile maps of different lubrication areas were measured using a laser confocal microscope: (a) 0.20 m/s-2 mm, (b) 0.40 m/s-2 mm, (c) 0.50 m/s-2 mm, (d) 0.20 m/s-6 mm, (e) 0.40 m/s-6 mm, and (f) 0.40 m/s-8 mm. Figure S2. XPS results of wear tracks on the lower friction sub-surface after friction test t (a–d) C1s: (a) 0.20 m/s-2 mm, (b) 0.40 m/s-8 mm, (c) 0.50 m/s-2 mm, and (d) 0.50 m/s-8 mm. Figure S3. XPS results of wear tracks on the lower friction sub-surface after friction testing. Table S1. Measure the initial concentration component content of the lubricant under different lubrication conditions, the concentration component content after the completion of the friction experiment, and the dynamic viscosity under different conditions after the completion of friction; corresponding symbols for the samples in Figure 7 (Number). Table S2. Table of roughness average, wear rate, average COF, and the proportion of C-O and C=O bond contents in different wear areas; corresponding symbols for the samples in Figure 7 (Number). Table S3. The meanings of the symbols used in this paper.
Author Contributions
Conceptualization, H.L. (Hengyi Lu) and J.L.; methodology, H.L. (Hanglin Li); validation, T.J.; formal analysis, T.J.; investigation, T.J.; resources, J.L.; data curation, H.L. (Hanglin Li); writing—original draft preparation, T.J.; writing—review and editing, H.L. (Hanglin Li) and X.S.; supervision, H.L. (Hengyi Lu) and J.L.; and project administration, J.L. All authors have read and agreed to the published version of the manuscript.
Funding
This work was supported by the Strategic Priority Research Program of the Chinese Academy of Sciences (No. XDB0470202) and the International Partnership Program of the Chinese Academy of Sciences (No. 307GJHZ2022034GC).
Data Availability Statement
The data presented in this study are available in the article and Supplementary Materials. Further inquiries can be directed to the corresponding authors.
Conflicts of Interest
The authors declare no conflicts of interest.
References
- Li, X.; Wang, C.; Liang, A. Friction and wear behaviors of Ta-based nanocrystalline composite coating under extreme sliding conditions. Surf. Coat. Technol. 2023, 465, 129607. [Google Scholar] [CrossRef]
- Chouhan, A.; Sarkar, T.K.; Kumari, S.; Vemuluri, S.; Khatri, O.P. Synergistic lubrication performance by incommensurately stacked ZnO-decorated reduced graphene oxide/MoS2 heterostructure. J. Colloid Interface Sci. 2020, 580, 730–739. [Google Scholar] [CrossRef]
- Liu, H.; Yang, B.; Wang, C.; Han, Y.; Liu, D. The mechanisms and applications of friction energy dissipation. Friction 2023, 11, 839–864. [Google Scholar] [CrossRef]
- Guo, Z.; Yuan, C.; Liu, A.; Jiang, S. Study on tribological properties of novel biomimetic material for water-lubricated stern tube bearing. Wear 2017, 376–377, 911–919. [Google Scholar] [CrossRef]
- Liu, Y.; Chen, L.; Jiang, B.; Liu, Y.; Zhang, B.; Xiao, C.; Zhang, J.; Qian, L. Origin of low friction in hydrogenated diamond-like carbon films due to graphene nanoscroll formation depending on sliding mode: Unidirection and reciprocation. Carbon 2021, 173, 696–704. [Google Scholar] [CrossRef]
- Renouf, M.; Massi, F.; Fillot, N.; Saulot, A. Numerical tribology of a dry contact. Tribol. Int. 2011, 44, 834–844. [Google Scholar] [CrossRef]
- Schönherr, H.; Tocha, E.; Vancso, G.J. Friction and Surface Dynamics of Polymers on the Nanoscale by AFM. In STM and AFM Studies on (Bio)Molecular Systems: Unravelling the Nanoworld; Springer: Berlin/Heidelberg, Germany, 2008; pp. 103–156. [Google Scholar] [CrossRef]
- Vasco, M.C.; Villanova, R.L.; Pintaude, G. Tribological Behavior of Anodized Aluminum Oxide (AAO) Under the Addition of PAO6 Lubrication with Nano-Alumina. Lubricants 2025, 13, 97. [Google Scholar] [CrossRef]
- Sethurajaperumal, A.; Srivastava, S.; Ganesh, G.; Sundara, R.; Varrla, E. Natural Surfactant Stabilized Aqueous MoS2 Nano-Lubricants for Reducing Friction and Wear. Chem. Eng. J. 2024, 496, 154080. [Google Scholar] [CrossRef]
- Özakın, B.; Gültekin, K.; Yurdgülü, H. Improvement of oxidation stability, hydrolytic stability and tribological properties of kaolin particles doped bio-based green palm oil. Colloids Surf. A Physicochem. Eng. Asp. 2025, 712, 136441. [Google Scholar] [CrossRef]
- Hirano, M.; Shinjo, K. Atomistic locking and friction. Phys. Rev. B 1990, 41, 11837–11851. [Google Scholar] [CrossRef]
- Song, Y.; Mandelli, D.; Hod, O.; Urbakh, M.; Ma, M.; Zheng, Q. Robust microscale superlubricity in graphite/hexagonal boron nitride layered heterojunctions. Nat. Mater. 2018, 17, 894–899. [Google Scholar] [CrossRef]
- Wang, Y.; Gao, K.; Zhang, B.; Wang, Q.; Zhang, J. Structure effects of sp2-rich carbon films under super-low friction contact. Carbon 2018, 137, 49–56. [Google Scholar] [CrossRef]
- Raviv, U.; Klein, J. Fluidity of Bound Hydration Layers. Science 2002, 297, 1540–1543. [Google Scholar] [CrossRef]
- Shi, Y.; Minami, I.; Grahn, M.; Björling, M.; Larsson, R. Boundary and elastohydrodynamic lubrication studies of glycerol aqueous solutions as green lubricants. Tribol. Int. 2014, 69, 39–45. [Google Scholar] [CrossRef]
- Dong, Y.; Wang, N.; Yang, D.; Wang, J.; Lu, W.; Wang, D. Robust Solid-Liquid Triboelectric Nanogenerators: Mechanisms, Strategies and Applications. Adv. Funct. Mater. 2023, 33, 2300764. [Google Scholar] [CrossRef]
- Zeng, Q.; Zhang, W. A Systematic Review of the Recent Advances in Superlubricity Research. Coatings 2023, 13, 1989. [Google Scholar] [CrossRef]
- Wei, P.; Hou, X.; Han, S.; Wen, X.; Zhou, X.; Meng, Y.; Yue, L.; Zhao, H.; Wen, G.; Cao, H.; et al. Superlubrication of poly-α-olefin-8 (PAO8) enabled by MXene/PI coating. Friction 2025, 13, 9440967. [Google Scholar] [CrossRef]
- Lin, B.; Rustamov, I.; Zhang, L.; Luo, J.; Wan, X. Graphene-Reinforced Lithium Grease for Antifriction and Antiwear. ACS Appl. Nano Mater. 2020, 3, 10508–10521. [Google Scholar] [CrossRef]
- Xian, H.W.; Sidik, N.A.; Saidur, R. Impact of different surfactants and ultrasonication time on the stability and thermophysical properties of hybrid nanofluids. Int. Commun. Heat Mass Transf. 2020, 110, 104389. [Google Scholar] [CrossRef]
- Zhang, Y.; Jia, X.; Tian, Q.; Yang, J.; Wang, S.; Li, Y.; Shao, D.; Feng, L.; Song, H. Nitrogen-Doped Carbon Dot as a Lubricant Additive in Polar and Non-polar Oils for Superior Tribological Properties via Condensation Reaction. Langmuir 2023, 39, 3589–3600. [Google Scholar] [CrossRef]
- Ge, X.; Li, J.; Luo, R.; Zhang, C.; Luo, J. Macroscale Superlubricity Enabled by the Synergy Effect of Graphene-Oxide Nanoflakes and Ethanediol. ACS Appl. Mater. Interfaces 2018, 10, 40863–40870. [Google Scholar] [CrossRef]
- Ge, X.; Chai, Z.; Shi, Q.; Liu, Y.; Tang, J.; Wang, W. Liquid Superlubricity Enabled by the Synergy Effect of Graphene Oxide and Lithium Salts. Materials 2022, 15, 3546. [Google Scholar] [CrossRef]
- Berman, D.; Erdemir, A.; Sumant, A.V. Approaches for Achieving Superlubricity in Two-Dimensional Materials. ACS Nano 2018, 12, 2122–2137. [Google Scholar] [CrossRef]
- Zhai, W.; Zhou, K. Nanomaterials in Superlubricity. Adv. Funct. Mater. 2019, 29, 1806395. [Google Scholar] [CrossRef]
- Hod, O.; Meyer, E.; Zheng, Q.; Urbakh, M. Structural superlubricity and ultralow friction across the length scales. Nature 2018, 563, 485–492. [Google Scholar] [CrossRef]
- Han, K.; Ma, L.; Tian, Y.; Luo, J. Photoinduced superlubricity on TiO2 surfaces. Friction 2024, 12, 428–438. [Google Scholar] [CrossRef]
- Liu, Y.; Li, J.; Ge, X.; Yi, S.; Wang, H.; Liu, Y.; Luo, J. Macroscale Superlubricity Achieved on the Hydrophobic Graphene Coating with Glycerol. ACS Appl. Mater. Interfaces 2020, 12, 18859–18869. [Google Scholar] [CrossRef]
- Sun, S.; Li, J.; Li, J.; Luo, J. Enhanced superlubricity on a-C films by lubrication with 3-hydroxypropionic acid. Carbon 2022, 199, 161–169. [Google Scholar] [CrossRef]
- Ge, X.; Li, J.; Zhang, C.; Luo, J. Liquid Superlubricity of Polyethylene Glycol Aqueous Solution Achieved with Boric Acid Additive. Langmuir 2018, 34, 3578–3587. [Google Scholar] [CrossRef]
- Liu, Y.; Yu, S.; Li, J.; Ge, X.; Zhao, Z.; Wang, W. Quantum dots of graphene oxide as nano-additives trigger macroscale superlubricity with an extremely short running-in period. Mater. Today Nano 2022, 18, 100219. [Google Scholar] [CrossRef]
- Sun, S.; Yi, S.; Li, J.; Ding, Z.; Song, W.; Luo, J. Lithium Citrate Triggered Macroscopic Superlubricity with Near-Zero Wear on an Amorphous Carbon Film. ACS Appl. Mater. Interfaces 2023, 15, 19705–19714. [Google Scholar] [CrossRef]
- Han, T.; Yi, S.; Zhang, C.; Li, J.; Chen, X.; Luo, J.; Banquy, X. Superlubrication obtained with mixtures of hydrated ions and polyethylene glycol solutions in the mixed and hydrodynamic lubrication regimes. J. Colloid Interface Sci. 2020, 579, 479–488. [Google Scholar] [CrossRef]
- Liang, H.; Yin, T.; Liu, M.; Fu, C.; Xia, X.; Zou, S.; Hua, X.; Fu, Y.; Bu, Y. Unravelling High-Load Superlubricity of Ionic Liquid Analogues by In Situ Raman: Incomplete Hydration Induced by Competitive Exchange of External Water with Crystalline Water. J. Phys. Chem. Lett. 2023, 14, 453–459. [Google Scholar] [CrossRef]
- Ge, X.; Chai, Z.; Shi, Q.; Li, J.; Tang, J.; Liu, Y.; Wang, W. Functionalized graphene-oxide nanosheets with amino groups facilitate macroscale superlubricity. Friction 2022, 11, 187–200. [Google Scholar] [CrossRef]
- Yi, S.; Guo, Y.; Li, J.; Zhang, Y.; Zhou, A.; Luo, J. Two-dimensional molybdenum carbide (MXene) as an efficient nanoadditive for achieving superlubricity under ultrahigh pressure. Friction 2023, 11, 369–382. [Google Scholar] [CrossRef]
- Wang, K.; Liu, L.; Song, A.; Ma, T.; Wang, H.; Luo, J.; Liu, Y. Macroscale superlubricity under ultrahigh contact pressure in the presence of layered double hydroxide nanosheets. Nano Res. 2022, 15, 4700–4709. [Google Scholar] [CrossRef]
- Liang, H.; Liu, M.; Yin, T.; Zou, S.; Xia, X.; Hua, X.; Fu, Y.; Zhang, J.; Bu, Y.; Ren, X. Carbon Dots as Ligand Operons to Expand Cluster Size Distribution for High Load-bearing Liquid Superlubricity. Adv. Funct. Mater. 2024, 34, 2311600. [Google Scholar] [CrossRef]
- Le, K.; Zhao, Y.; Zheng, X.; Zhao, Q.; Chen, X.; Liu, Y.; Kim, D.-E.; Xu, S.; Liu, W. Insight into macroscale superlubricity triggered by neutral NaH2PO2 aqueous. Tribol. Int. 2025, 204, 110547. [Google Scholar] [CrossRef]
- Lan, J.; Mo, C.; Chen, X.; Hu, T.; Li, X.; Zhang, C. Carbon fiber/nano SiO2 reinforced polyelectrolyte-graft UHMWPE for water lubricated superlubricity. Tribol. Int. 2025, 202, 110303. [Google Scholar] [CrossRef]
- Nadeem, I.; Finšgar, M.; Dražić, G.; Malok, M.; Morina, A.; Kalin, M. Robust and durable superlubricity enabled by carboxylated graphene quantum dots in lubricated steel contacts. Carbon 2024, 226, 119226. [Google Scholar] [CrossRef]
- Polacek, T.; Šperka, P.; Krupka, I. Liquid superlubricity of lubricants containing hydroxyl groups and their aqueous solution under rolling/sliding conditions. Friction 2024, 12, 164–173. [Google Scholar] [CrossRef]
- Tortora, A.M.; Veeregowda, D.H. Effects of two sliding motions on the superlubricity and wear of self-mated bearing steel lubricated by aqueous glycerol with and without nanodiamonds. Wear 2017, 386–387, 173–178. [Google Scholar] [CrossRef]
- Beheshti, A.; Huang, Y.; Blakey, I.; Stokes, J.R. Macroscale superlubricity induced by film-forming polymer brush-grafted colloidal additives. J. Colloid Interface Sci. 2023, 634, 703–714. [Google Scholar] [CrossRef]
- Poláček, T.; Kadlec, M.; Smilek, J.; Hartl, M.; Šperka, P. Superlubricity of polyethylene glycol solutions: Running-in effects, thickness changes, and rheology. Friction 2025. [Google Scholar] [CrossRef]
- Xu, X.; Su, F.; Yu, H.; Liu, R.; Xu, Z. Black phosphorus nanosheet dotted with Fe3O4-PDA nanoparticles: A novel lubricant additive for tribological applications. Tribol. Int. 2025, 207, 110607. [Google Scholar] [CrossRef]
- Samanta, S.; Yoon, D.-H.; Sahoo, R.R. Fabrication of covalently modified graphene oxide-based assembled polymer brushes as efficient aqueous lubricant additive. J. Mol. Liq. 2024, 416, 126505. [Google Scholar] [CrossRef]
- Shi, J.; Yin, S.; Li, H.; Yi, X.; Wu, H.; Cao, T.; Fan, X.; Liu, J.; Zhou, F. Operando formation of hydration layer and tribofilm of graphene oxide for achieving synergistic lubrication on electrochemical boronizing surface. Carbon 2025, 235, 120089. [Google Scholar] [CrossRef]
- Liu, Y.; Yu, S.; Fan, Z.; Ge, X.; Wang, W. How does lateral size influence the tribological behaviors of graphene oxide as nanoadditive for water-based lubrication? Carbon 2024, 219, 118803. [Google Scholar] [CrossRef]
- Yang, Y.; Ma, L.; Wang, H.; Jia, W.; Zhu, J.; Wang, J.; Fan, X.; Liu, J.; Zhou, F. A novel water-based lubricating additive of GO@PTFE: Superior tribological performances from the synergistic effect. Tribol. Int. 2022, 169, 107485. [Google Scholar] [CrossRef]
- Li, H.; Shang, Y.; Zeng, X.; Liu, H.; Li, J. Study on the Liquid–Liquid and Liquid–Solid Interfacial Behavior of Functionalized Graphene Oxide. Langmuir 2022, 38, 482–494. [Google Scholar] [CrossRef]
- Li, H.; Liu, C.; Chen, J.; de Vries, I.; de Beer, S.; Zhang, L.; Zhang, X.; Ma, J.; Li, J.; Zeng, X.; et al. Study on the fabrication and tribological behavior of self-assembled functionalized graphene oxide in water. Colloids Surf. A Physicochem. Eng. Asp. 2021, 616, 126153. [Google Scholar] [CrossRef]
- Guo, Y.; Li, H.; Li, J.; Zeng, X. Stable graphene oxide-based lyotropic liquid crystals for interfacial lubrication. Friction 2024, 12, 954–967. [Google Scholar] [CrossRef]
- Han, T.; Zhang, C.; Li, J.; Yuan, S.; Chen, X.; Zhang, J.; Luo, J. Origins of Superlubricity Promoted by Hydrated Multivalent Ions. J. Phys. Chem. Lett. 2020, 11, 184–190. [Google Scholar] [CrossRef]
- Xiao, C.; Li, J.; Chen, L.; Zhang, C.; Zhou, N.; Qian, L.; Luo, J. Speed dependence of liquid superlubricity stability with H3PO4 solution. RSC Adv. 2017, 7, 49337–49343. [Google Scholar] [CrossRef]
- Du, C.; Yu, T.; Zhang, L.; Deng, H.; Shen, R.; Li, X.; Feng, Y.; Wang, D. Macroscale Superlubricity with Ultralow Wear and Ultrashort Running-In Period (∼1 s) through Phytic Acid-Based Complex Green Liquid Lubricants. ACS Appl. Mater. Interfaces 2023, 15, 10302–10314. [Google Scholar] [CrossRef] [PubMed]
- Ren, X.; Yang, X.; Xie, G.; Luo, J. Black Phosphorus Quantum Dots in Aqueous Ethylene Glycol for Macroscale Superlubricity. ACS Appl. Nano Mater. 2020, 3, 4799–4809. [Google Scholar] [CrossRef]
- Liu, Y.; Li, J.; Li, J.; Yi, S.; Ge, X.; Zhang, X.; Luo, J. Shear-Induced Interfacial Structural Conversion Triggers Macroscale Superlubricity: From Black Phosphorus Nanoflakes to Phosphorus Oxide. ACS Appl. Mater. Interfaces 2021, 13, 31947–31956. [Google Scholar] [CrossRef]
Disclaimer/Publisher’s Note: The statements, opinions and data contained in all publications are solely those of the individual author(s) and contributor(s) and not of MDPI and/or the editor(s). MDPI and/or the editor(s) disclaim responsibility for any injury to people or property resulting from any ideas, methods, instructions or products referred to in the content. |
© 2026 by the authors. Licensee MDPI, Basel, Switzerland. This article is an open access article distributed under the terms and conditions of the Creative Commons Attribution (CC BY) license.