Abstract
Fiber laser surface texturing was applied to AA1050 aluminum to improve friction and wear performance of PTFE coatings. A Taguchi L16 design varied texture geometry (square, diamond, hexagon, circle), scanned area ratio (20% to 80%), and laser power (40 to 100 W) prior to primer plus PTFE topcoat deposition (25 to 35 µm). Dry reciprocating sliding against a 6 mm 100Cr6 ball was conducted at 20 N, 1 Hz, and 50 m, and wear track geometry was measured by non-contact profilometry. The non-textured reference exhibited an average COF of 0.143, whereas the lowest mean COF was achieved with diamond 60% and 40 W (0.095) and the highest with hexagon 60% and 100 W (0.156); hexagon 20% and 60 W matched the reference. ANOVA indicated scanned area ratio as the dominant contributor to COF (39.72%), followed by geometry (35.07%) and power (25.21%). Profilometry confirmed reduced coating penetration for optimized textures: the reference wear track was approximately 1240 µm wide and 82 µm deep, compared with 930 µm and 34 µm for square 80% and 40 W, 997 µm and 39 µm for diamond 60% and 40 W, and 965 µm and 36 µm for hexagon 40% and 40 W.
1. Introduction
AA 1050, with a composition consisting of at least 99.5% aluminum, is a commercially pure aluminum alloy of the 1xxx series, prized for its very high workability, conductivity, and resistance to corrosion [1]. Though it has a lower mechanical strength compared to other aluminum alloys, surface treatment methods such as hardening can significantly improve its performance. This particular alloy also exhibits high ductility, hardness, and resistance to low-cycle fatigue at low temperatures, making it amenable for deep drawing and bending and applications involving exposure to low and extreme variations [2]. Notably, the oxide layer naturally formed on its surface also improves the resistance to abrasive wear. Although it exhibits comparatively lower yield strength and hardness, when viewed along with the corrosion resistance, conductivity, and ease of shaping, it remains a very widely used aluminum alloy variant for applications in aircraft, transportation, and electrical sectors, where lighter yet strong materials have been long sought [3].
Surface roughening is a commonly employed technique in materials science to impart specific functionalities based on the intended uses [4], with a major thrust given to improve the coating and material adhesion properties and related composite materials [5]. An increased surface roughness helps to improve the mechanical interlocking and provide a larger contact area, thereby increasing the overall paint, polymer, and metallic film adhesive properties of the material [6]. It also helps vary the overall surface wettability, a crucial parameter in fluids-related applications such as heat exchangers, biomedical devices, and self-cleaning surfaces [7]. Surface treatment techniques such as laser surface texture, sandblasting, chemical etching, and mechanical abrading are some common techniques employed to induce these characteristics and properties on a wide range of materials with scientific and technological uses [8]. Laser surface roughening is a novel material processing technique developed to vary the overall surface properties with the help of high-intensity lasers to improve the material properties and functionalities with scientific and technological uses [9,10]. Additionally, laser material processing techniques are environmentally clean and benign, avoiding the need to use hazardous chemicals and waste generation issues associated with existing material processing techniques. By employing varied parameters of laser irradiations, it is possible to vary the overall surface functionalities and properties, including factors such as improved surface wettability, overall material and coating properties, and the overall material properties, including increased friction and wear properties, with scientific and technological uses and utilities [11]. Traditionally, the surface engineering of metal materials has relied to some extent on coating technologies, including solid lubricating films, polymeric coatings, and composite coatings, with the aim of mitigating friction and wear through material layering. Despite their high efficiency, these coating technologies often suffer from associated difficulties related to coating failure by delamination, the emergence of cracks between the coating and the surface layer, and accumulations of stresses within the boundary region between the coating and the surface layer, particularly when the surface is subjected to cyclic loads and harsh contact conditions [12]. In contrast, laser surface texturing represents an original non-material-adding method for metal surface modification that has the potential for the enhancement of the friction-reducing and wear-resisting abilities of metal surfaces, not by adding protective coating layers but through the direct modification of the topography of the original metal surface itself with precision and accuracy [13]. Furthermore, the resulting micro-textured surfaces prepared using laser surface texturing possess considerable flexibility through the adjustable geometry and dimensions of the surface-textured regions, which significantly affects the real contact area and surface pressure distribution and the third-body dynamics involved in the friction process, the very core of the quasi-stationary process of friction and wear [12]. In addition, properly designed micro-textured surfaces formed using laser surface texturing techniques may act simultaneously as lubricating reservoirs and load-supporting regions, thus providing enhanced stabilized functional characteristics for tribo-systems and surfaces over and above the capabilities of coatings [12]. Additionally, surface texturing techniques when accomplished jointly with the application of solid lubricants or polymer coatings have already shown the capacity to contribute to an improved stabilized transfer layer and an enhanced lubricating layer transfer with the resulting strongly synergetic enhancement of the friction-reducing and wear-resisting abilities of the surface-textured and coated surfaces [14]. Taking into consideration the features enumerated and explained above, surface texturing using lasers represents neither an additional method nor an innovative surface engineering process for surfaces made from metal materials, with the surface engineering process having significant relevance only in applications when the primary question and technological problem are the surface stability and quality of coatings primarily used for the enhancement of surface friction and wear-resisting abilities [13].
In addition, poly(tetrafluoroethylene), known as PTFE, is also widely used on aluminum substrates because of its high resistance to chemicals and heat, properties that make it usable as an anti-stick material. These include utensils, chemical processing apparatus, aerospace parts, and industrial machinery [15]. PTFE coatings significantly lower the COF due to their naturally low surface energy and the establishment of a self-lubricating transfer layer; therefore, they are widely utilized to reduce wear in sliding mechanical components, non-stick coatings, industrial molds, frictional contact parts, and separation seals [16]. However, it is acknowledged that the mechanical resilience of the coating during bi-directional sliding is largely governed by the strength of the adhesion at the coating–substrate interface, and hence, poor interfacial strength accelerates localized delamination and irregular disruption of the transfer layer, resulting in a consequent increase in both COF and the rate of wear [16,17]. Bi-directional wear tests are very enlightening in understanding the characteristics of the resulting transfer layer, stability, and dynamic delamination properties, usually exhibiting a short start-up phase followed by either stabilized frictional forces or abrupt peaks in COF associated with material degradation in the coating layers [17].
It is pertinent to mention that laser-induced surface textures act as lubricant reservoirs and traps for debris, thus assisting in the creation and maintenance of the transfer layer within the contact track. This particular aspect has been shown to result in a reduction in friction coefficients and rates of wear. In an industrial context, the importance of surface pre-treated optimization has been emphasized with regard to the enhancement of the lifespan and reduction in energy losses in the case of components made of PTFE-coated Al used in non-stick cooking wares, molds, and parts with recurrent friction motion and thermal-chemical loading cycles [17,18]. Under the aforementioned context, the reciprocal sliding wear test can be effectively employed in the laboratory for the comparative study of various surface treatment processes on the basis of the parameters of (i) the stability of the transfer layer, (ii) the threshold of delamination of the coating, and (iii) the respective evolution of the coefficient of friction with the passage of time. There have been unequivocal signs within the literature that the enhanced cohesion between the layers via optimized surface pre-treated processes is an important factor within the reduction in friction coefficients and the enhancement of the durability against wear degradation [16,17,19,20,21,22]. Soltani-Kordshuli et al. [22] proved that the laser surface texturing process on thin PTFE or on metal substrates strongly improved the durability and friction stability of the surface. These texturized surfaces also increased the retention of the transferred films and the lifetime of the coatings up to 29 times. In the study conducted by Chen et al. [17], the friction coefficient of the composite material containing C-MoS2-PTFE on the 4032-aluminum alloy was found to be in the range of 0.08–0.09 when the force applied was about 5 N. However, it increased to 0.12–0.13 for 10 N and, further, to 0.20–0.21 for 15 N. In comparison with the anodized aluminum and the metal surface, the PTFE composite surface demonstrated a lower frictional rate and improved resistance against peeling or delamination due to the formation of a uniform continuous self-lubricating layer. In another study that complements the previous discussion on modifying the surface friction properties using PTFE surface treatments, the authors found the incorporation of PTFE nanoparticles into porous anodic oxide films on AA1050 improved the tribological properties with significant reductions in the friction coefficient and increases in the lifetime beyond 70-fold compared with anodized surface controls [23]. Here, the porous anodic structure acted as a reservoir for PTFE nanoparticles for continuous replenishment during the sliding process.
Though much research has focused on the relationship of the surface roughness with wettability and hydrophobicity, existing studies have largely focused on qualitative measures of roughness or static contact angles, neglecting the interrelation among quantitative values of roughness coefficients, tribological properties, and coating life.
More specifically, there remains a dearth of research examining systems of joint wettability and the friction–wear behavior of PTFE-coated laser-textured aluminum. The current study proposes a comprehensive experimental approach in addressing these outstanding issues. Aluminum alloy 1050 samples have been subjected to optimized patterns of laser processing in terms of geometries, area ratios, and power levels for creating controlled surface microtextures. These textured specimens have been coated with PTFE, for which the wettability was characterized by static contact-angle measurement analyses, in addition to tribological property studies through dry reciprocating friction–wear tests, where time-dependent friction coefficients have been determined for all textured specimens. Post-test surface damage and coating degradation were examined by scanning electron microscopy, enabling direct correlations between the friction coefficient evolution, coating failure mechanisms, and microtextural features. The optimization of the processing variables for carbon–oxide fluoropolymer (COF) was performed using the Taguchi technique, while the effect of the texture geometry, scan area ratio, or laser power was measured through analysis of variance (ANOVA). The originality of the paper lies in the fact that the work combines the evaluation of the hydrophobic property, friction–wear motion, and the mechanism of damage based on microtexture features, which goes beyond the scope of the existing works, based on the evaluation of the hydrophobic property alone, specifically for applications in the aerospace, biomedicine, or antifouling fields.
2. Materials and Methods
2.1. Materials
Aluminum sheets of 2 mm thickness were purchased from Altek Metal (in Kocaeli, Türkiye). The chemical properties of the Aluminum 1050 alloy are listed in Table 1, which was supplied by the manufacturer.

Table 1.
Al 1050-0 alloy properties.
2.2. Laser Surface Texturing
The primary purpose of using fiber laser surface texturing (LST) on the AA1050 aluminum substrate is to ensure that the tribological properties of the PTFE topcoat coating are optimized. Through the creation of specific micro-geometries, the goal of the research is to ensure that the friction and wear can be reduced through the reduced real contact area and the creation of micro-traps for the wear debris.
The surface texturing of the AA1050 aluminum samples was performed using a fiber laser system. In order to ensure that the results obtained were reproducible, the scanning speed was maintained at a constant 500 mm/s, the pulse frequency at 100 kHz, and a focused spot size of 50 μm. Initial test parameters were designed and set through preliminary experimentation to determine the parameters that could successfully alter the aluminum surfaces without excessive thermal damage and/or burning of the aluminum. The effect of the laser treatment on the tribological properties was then tested with the consideration of the following: four geometric designs of the surfaces, laser power, and scanning ratio. In the effort to enhance the efficiency of the experimental work, the 16-run experimental design was performed using the Taguchi L16 Orthogonal Array, as shown in Table 2.
Table 2.
Experimental sets suitable for L16 orthogonal array prepared according to Taguchi method.
In the presented research, the L16 orthogonal array of the Taguchi was used to optimize the process of laser texturing. In the designed experiment, the following three basic process parameters were investigated as control factors: the type of texture (consisting of four geometries: square, diamond, hexagon, and circle), the scanned area ratio with levels of 80%, 60%, 40%, and 20%, and the laser power with 40 W, 60 W, 80 W, and 100 W power levels.
Prior to the laser microtexturing (LST) process, AA1050 aluminum alloy samples were used as supplied (as-received), and no mechanical polishing was applied to the surfaces. Although smooth surfaces are preferred for microtexturing in the literature, considering the high reflectivity of aluminum, it was assessed that a polished surface could significantly reflect the laser radiation, reducing the energy absorption and processing accuracy. Therefore, by maintaining the existing surface condition, the thermal effect of the laser energy on the material was optimized, and the targeted microgeometries were successfully created in the 40–100 W power range. To prevent surface contamination before and after the process, the samples were meticulously cleaned; alkaline cleaners and organic solvents were used to completely remove oil and residues from the surface.
2.3. PTFE Coating of Laser Surface Textured Surfaces
AA1050 samples were coated with a commercial PTFE on the same industrial coating line in order to obtain a nominal dry film thickness of approximately 15 µm under identical conditions for all texture variants and for the non-textured reference surface (Figure 1). The coating procedure followed a conventional PTFE process route including degreasing, surface inspection, primer application, flash curing, PTFE topcoat deposition, sintering, and final quality control. This ensured that the only systematic variable in the study was the laser generated surface topography of the aluminum substrate.
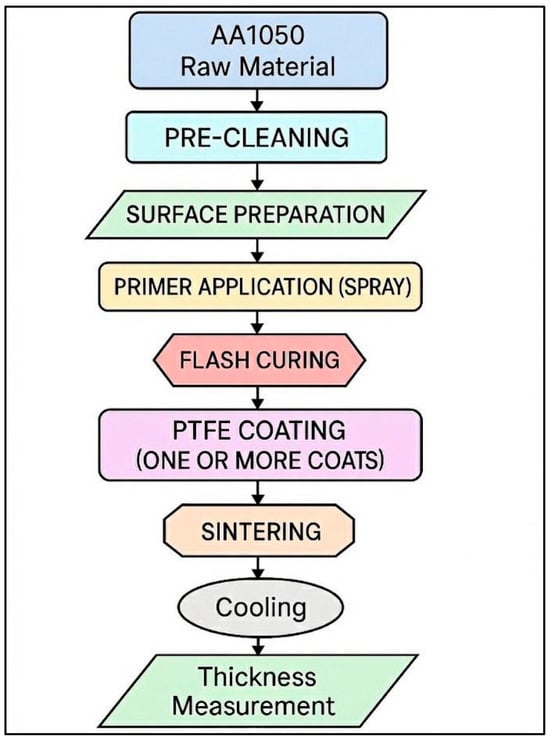
Figure 1.
PTFE coating process of AA1050 alloy.
Before the coatings could be applied, the AA1050 aluminum plates, which had been textured using a laser-texturing process, had to be handled using gloves to keep them free from contaminants. Subsequently, the AA1050 aluminum plates underwent an alkaline and solvent-based treatment process meant to eliminate the effects of previous oil sheens and other contaminants that may result from previous machining and laser processing. The specific treatment process entailed immersing the samples into an industrial alkaline cleaner, followed by a thorough rinsing using deionized water. Later, the samples underwent an organic solvent bath and a final rinsing using deionized water. Finally, the samples were dried using warm circulating air and then visually inspected to confirm the lack of any stains or fingerprints.
After cleaning, a PTFE compatible primer was applied to all specimens to promote adhesion between the low surface energy fluoropolymer and the aluminum substrate. The primer was sprayed using an atomizing spray gun at a fixed nozzle-to-substrate distance, with a constant traverse speed, in order to obtain a thin and homogeneous wet film. Excess material at the specimen edges was removed to avoid local thickening. The primed plates were then subjected to a low temperature flash curing step in a convection oven, and the dwell time was specified by the coating manufacturer, to evaporate the carrier, fix the primer to the substrate, and develop an adherent interface for the subsequent PTFE topcoat.
The PTFE topcoat was deposited by spray coating in one or more cross passes until the target dry film thickness of 15 µm was reached. The spray parameters, including the atomization pressure, gun movement speed, and overlap ratio, were kept constant for all samples, and the specimens were mounted so that the laser-textured side faced the gun and received a uniform coating. Between successive passes, a short flash off period at room temperature was allowed to minimize sagging and to promote leveling of the film over the underlying textured relief.
Following application of the topcoat, the coated samples were subjected to a controlled sintering cycle in a forced air industrial oven. The temperature was increased according to the supplier specified heating profile up to a peak value above the PTFE melting range, held for a prescribed dwell time to allow coalescence of the fluoropolymer particles into a continuous film, and then reduced to room temperature under controlled cooling to avoid thermal shock. After cooling, the specimens were visually inspected for defects such as blisters, pinholes, runs, or color non uniformity, and any defective samples were discarded.
The final thickness of this PTFE coating, consisting of the primer and topcoat, was measured at a number of points within the treated area on each specimen using a magnetic thickness gauge. The mean thickness of application varied between 25 and 35 µm, with little variation between specimens, as expected by the process specifications of thin tribological PTFE coating systems. A similar PTFE coating process, with the same application of primer and topcoat, was also performed on the non-textured specimen control samples. This not only allowed the influence of the changes in surface roughness due to the laser application on the coefficient of friction (COF) and wear to be verified but also ruled out any effects of differences in coating thickness.
2.4. Reciprocating Wear Tests
All sixteen laser-textured characteristics obtained with different texture types, scanned area ratios, and laser powers, as listed in Table 2, as well as a PTFE-coated but non-textured reference surface, were tested. The tests were performed using a UTS Tribolog™ Multi-Function Tribometer (Istanbul, Türkiye) operated in linear reciprocating mode. A stationary 6 mm diameter 100Cr6 bearing steel ball, with a hardness between 60 and 66 HRC and an as supplied surface roughness Ra below 0.05 µm, was pressed against the flat coated plate under a constant normal load of 20 N, while the specimen stage oscillated at a frequency of 1 Hz to generate an elongated wear track. The stroke length was adjusted by the tribometer, so that each experiment corresponded to a total sliding distance of 50 m. The reciprocating stroke length, peak-to-peak, was set to 10 mm, which corresponds to a displacement amplitude of 5 mm. At a frequency of 1 Hz, achieving a total sliding distance of 50 m corresponds to 2500 cycles and a total test duration of 41.67 min. Each surface condition was tested in three independent runs (n = 3), and the reported COF and wear-track metrics represent the mean of these independent repetitions. All tests were conducted under ambient laboratory conditions, approximately 23 ± 2 °C and 50 ± 5% relative humidity, without external lubrication, in order to emphasize the intrinsic tribological response of the laser-textured and PTFE-coated aluminum surfaces. Prior to testing, the coated specimens were gently cleaned and handled with gloves to minimize contamination of the PTFE surface. During each experiment, the normal load and tangential friction force were continuously recorded by the tribometer data acquisition system, and the instantaneous COF was calculated as the ratio of the friction force to the normal load. For every surface, a COF versus sliding distance curve was obtained, and the steady-state COF was determined by averaging the COF signal over the region after the initial running in stage, where the curve reached a quasi-constant value. These steady-state COF values were then used to compare the tribological performance of the laser-textured PTFE-coated AA1050 surfaces with that of the non-textured reference coating and to correlate the influence of the texture type, scanned area, and laser power with the roughness results reported in the next subsection.
2.5. Profilometer Roughness Analysis
Throughout the roughness test, a Nanovea PS50 non-contact laser profilometer (NANOVEA, Irvine, CA, USA) was used to measure the surface roughness of various laser-textured PTFE-coated AA 1050 samples. This was then used in viewing the topography and shapes of the samples. The profilometry scans were set with a scan distance of 1 mm on the X-axis and steps of 20 μm. The Y-axis scan was set over a 12 mm distance, using increased steps of 30 μm. The scan velocity remained at 20 mm/s, given the best compromise between the accuracy of the data and the efficiency of operations. The sensor settings can also be altered to output high-resolution topographic data in 1000 Hz. This result is in accordance with ISO 25178 [24] for the measurement of areal surface texture parameters and ISO 4287 [25] for the determination of line roughness. Following these standards, there has been an accurate capture of surface parameters, such as Sa and Ra, to allow the standardized evaluation of the roughness and texture features. All profilometric measurements involved the following: A depth profile across the wear track width at each location was recorded. The wear track width is defined as the horizontal spacing between the two sides of the scratch, wherein the surface level deviates significantly from the base level. It also included the depth of the wear track, known as the maximum vertical distance from the surface baseline to the bottom of the wear track, in addition to the depth of surface material moved by reciprocating contact.
2.6. Scanning Electron Microscopy (SEM) Analyses
To examine the wear track surfaces in detail after reciprocating sliding tests, the sample surfaces were gold-coated with the Cressington Sputter Coater 108 Auto device (Cressington, Watford, UK), and then SEM (Scanning Electron Microscopy) images were taken with JEO JSM-6060LV device (JEOL, Tokyo, Japan).
3. Results and Discussion
3.1. Roughness Analysis of Textured AA1050 Surfaces
Relative to the untextured AA1050 reference surface, which exhibits a low Sa of 4 µm (Figure 2i), all the laser-textured conditions increased the areal roughness amplitude to varying extents, confirming that the imposed microcavity fields and their re-solidified rims dominate the surface height distribution, as captured by non-contact profilometry (Sa-based areal evaluation). For the square geometry, the Sa spans from 14 to 51 µm, with the highest value obtained at 80% scanned area and 40 W (Sa = 51 µm, Figure 2a), while reducing the scanned area progressively decreased the Sa despite the concurrent rise in laser power, reaching Sa = 14 µm at 20% and 100 W (Figure 2d); this indicates that, for square textures, the areal density of the features (and the cumulative contribution of edge ridges within the measurement window) is a stronger driver of Sa than power alone, while the power primarily modulates the feature depth and rim prominence in a secondary non-monotonic manner (for example, 40% and 80 W yields Sa = 26 µm versus 60% and 60 W yielding Sa = 22 µm). In contrast, the diamond geometry shows a wider spread, from Sa = 5 µm at 60% and 40 W (Figure 2f) to the overall maximum of Sa = 55 µm at 40% and 100 W (Figure 2g), demonstrating a strong interaction between the laser power and texture pitch, where high power can generate deeper cavities and more pronounced re-deposition ridges that markedly broaden the height distribution even at intermediate scanned areas. Taken together, Figure 2a–h show that laser texturing can be tuned from a near-reference roughness state (diamond 60% and 40 W) to highly developed topographies (diamond 40% and 100 W; square 80% and 40 W), which is consequential for the subsequent coating stage, because moderate Sa increases can enhance the mechanical interlocking and effective contact area for primer/PTFE deposition, whereas an excessively high Sa may promote local stress concentrations and coating non-uniformity over sharp texture rims.
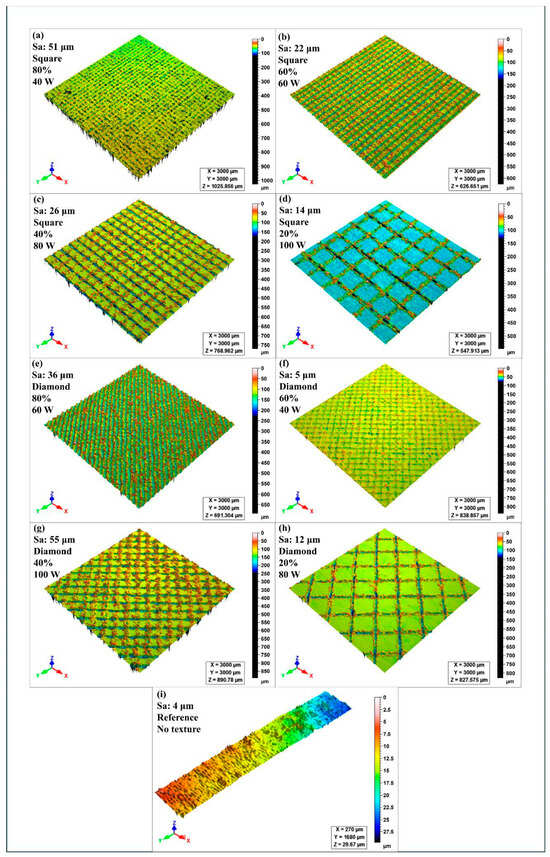
Figure 2.
Effect of laser-texturing parameters on Sa values without coating: (a) square 80% scanned area, 40 W laser power; (b) square 60% scanned area, 60 W laser power; (c) square 40% scanned area, 80 W laser power; (d) square 20% scanned area, 100 W laser power; (e) diamond 80% scanned area, 60 W laser power; (f) diamond 60% scanned area, 40 W laser power; (g) diamond 40% scanned area, 100 W laser power; (h) diamond 20% scanned area, 80 W laser power; (i) reference (no texture).
Across Figure 3, the untextured reference surface in Figure 3i exhibits a low Sa of 4 µm, whereas all the laser-textured conditions modify the areal height distribution to different extents depending on the geometry, scanned area, and power. For the hexagon pattern, Sa is 45 µm in Figure 3a at 80% scanned area and 80 W, remains similarly high at 46 µm in Figure 3b at 60% and 100 W, decreases to 23 µm in Figure 3c at 40% and 40 W, and then rises sharply to 83 µm in Figure 3d at 20% and 60 W, indicating a non-monotonic coupling, where a reduced processed fraction can still generate a large Sa when the remaining features develop high rim relief and strong local height contrast. For the circle pattern, the highest roughness is obtained in Figure 3e with Sa = 108 µm at 80% and 100 W; then, Sa drops to 46 µm in Figure 3f at 60% and 80 W and to 16 µm in Figure 3g at 40% and 60 W, while Figure 3h at 20% and 40 W yields Sa = 2 µm, which is comparable to and slightly below the reference in Figure 3i, consistent with a plateau dominated surface, where the limited areal contribution of textured depressions does not significantly broaden the overall height distribution.
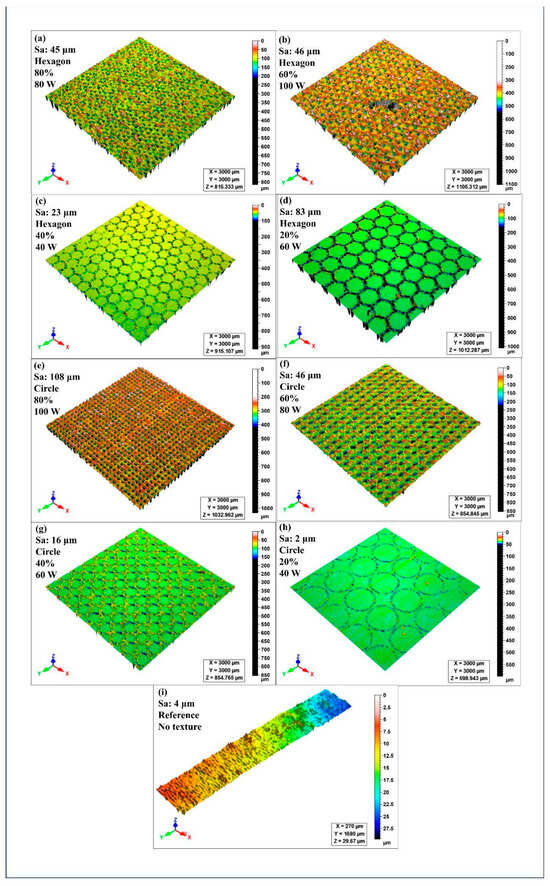
Figure 3.
Effect of laser-texturing parameters on Sa values without coating: (a) hexagon 80% scanned area, 80 W laser power; (b) hexagon 60% scanned area, 100 W laser power; (c) hexagon 40% scanned area, 40 W laser power; (d) hexagon 20% scanned area, 60 W laser power; (e) circle 80% scanned area, 100 W laser power; (f) circle 60% scanned area, 80 W laser power; (g) circle 40% scanned area, 60 W laser power; (h) circle 20% scanned area, 40 W laser power; (i) reference (no texture).
In Figure 4, optical micrographs of the 10× mag views for the different conditions further attest to the Sa trends inferred from the profilometry plots. In Figure 4a (square, 80%, 40 W), the surface is crowded with laser-influenced texture and characteristic re-deposited debris and mill-scale height variations characteristic of the highest square Sa of 51 µm. In Figure 4b (square, 60%, 60 W), the texture is continuous with a more regular and less debris-filled pattern in comparison with Figure 4a, consistent with the lower Sa of 22 µm. In Figure 4c (square, 40%, 80 W), a more defined square Arris pattern exists with marked track crossings and ridged sides reflecting an intermediate Sa of 26 µm, signifying more marked height variation, yet restricted spatial density of the surface features, like in Figure 4a. In Figure 4d (square, 20%, 100 W), large plateaus and a sparse textured boundary frame occur with a consequent lowered height dispersion Sa of 14 µm, despite the increase in power input; this indicates a processed area restriction tending to reduce the prominence of characteristic floor and summit topography in the height dispersion metric. In the diamond textures, in Figure 4e (diamond, 80%, 60 W), there is a crowded diagonal ribbing with frequent peripheral re-forming of the topographic summits, signifying the high Sa of 36 µm. In Figure 4f (diamond, 60%, 40 W), the diamond geometry is more refined with a dearth of topographic summits, yet limited summital build-up with a more continuous summit area signifying the near-standard Sa of 5 µm. In this image, the diagonal pattern is rawer with deeper and darker topographic ribs with adequate summital buildup and the summit–depression contrast signifying the maximum Sa of either the square or the diamond sa of 55 µm. In Figure 4h (diamond, 20%, 80 W), the topographic area is large, and the summit regions are continuous, yet with maintained topographic ribbing, signifying a moderate Sa of 12 µm. In image Figure 4i (reference), machining induced directional markings from the original workpiece topography with no regular summital topographic cavities occur, signifying the lowest Sa of 4 µm and confirming the prior observations of Sa for the processed surfaces. Figure 4a–h result from laser texturing rather than baseline surface preparation.
Figure 5 shows that the optical micrographs at 10× magnification are in good qualitative agreement with the Sa values reported for the uncoated textures, because the apparent density of laser affected features, the continuity of the plateau regions, and the prominence of the re-solidified rims collectively control the areal height dispersion. In Figure 5a (hexagon, 80%, 80 W), the surface is densely populated by laser-induced melt re-solidification marks and short-range height fluctuations, which is consistent with the elevated Sa = 45 µm, relative to the reference. In Figure 5b (hexagon, 60%, 100 W), a similarly rough and highly modified morphology is observed with frequent local relief and debris-like features, yielding Sa = 46 µm that remains comparable to Figure 5a, despite the change in scanned area and power. In Figure 5c (hexagon, 40%, 40 W), the hexagonal pattern is more distinguishable, and the plateaus are more continuous, but the ridges are less accentuated, as expected for a smaller Sa of 23 µm. In Figure 5d (hexagon, 20%, 60 W), the hexagons are coarser, and the ridge boundaries are thicker and darker to reflect a higher level of rim development and local height variation, which contributes to the marked increase of Sa to 83 µm, despite the smaller scan area. Turning to the circular patterns, Figure 5e (circle, 80%, 100 W) illustrates a closely spaced and heavily developed pit field with notable edge relief and re-deposition everywhere, reflecting the highest Sa of 108 µm. In Figure 5f (circle, 60%, 80 W), the circular spots remain dense; however, the demarcation between the pits and plateaus is less sharp than that of Figure 5e, reflecting the smaller but still high Sa of 46 µm. In Figure 5g (circle, 40%, 60 W), the circular pattern is clearly defined but the plateaus dominate the field of view, and the rim relief is comparatively moderate, consistent with Sa = 16 µm. In Figure 5h (circle, 20%, 40 W), large plateau regions with machining related directionality remain prevalent, and only sparse circular boundaries are visible, resulting in Sa = 2 µm, which is close to the untextured baseline. Finally, Figure 5i (reference) shows the expected machined surface with no organized laser-induced features and a low Sa = 4 µm, confirming that the roughness amplification in Figure 5a–g is driven by the texture-induced rim and cavity formation, whereas the low energy and low area condition in Figure 5h does not significantly broaden the areal height distribution.

Figure 4.
Optical microscope surface images of laser-textured surfaces without coating: (a) square 80% scanned area, 40 W laser power; (b) square 60% scanned area, 60 W laser power; (c) square 40% scanned area, 80 W laser power; (d) square 20% scanned area, 100 W laser power; (e) diamond 80% scanned area, 60 W laser power; (f) diamond 60% scanned area, 40 W laser power; (g) diamond 40% scanned area, 100 W laser power; (h) diamond 20% scanned area, 80 W laser power; (i) reference (no texture).

Figure 5.
Optical microscope surface images of laser-textured surfaces without coating: (a) hexagon 80% scanned area, 80 W laser power; (b) hexagon 60% scanned area, 100 W laser power; (c) hexagon 40% scanned area, 40 W laser power; (d) hexagon 20% scanned area, 60 W laser power; (e) circle 80% scanned area, 100 W laser power; (f) circle 60% scanned area, 80 W laser power; (g) circle 40% scanned area, 60 W laser power; (h) circle 20% scanned area, 40 W laser power; (i) reference (no texture).
3.2. COF Analysis of Reciprocating Wear Tests
Figure 6 summarizes the evolution of the COF as a function of the sliding distance for the PTFE-coated AA1050 surfaces with and without laser square texturing under the identical test conditions of a 20 N normal load, 1 Hz frequency, and 50 m sliding distance. The left column shows the COF–distance curve, while the right column presents an optical micrograph of the corresponding wear track and the surrounding textured region.
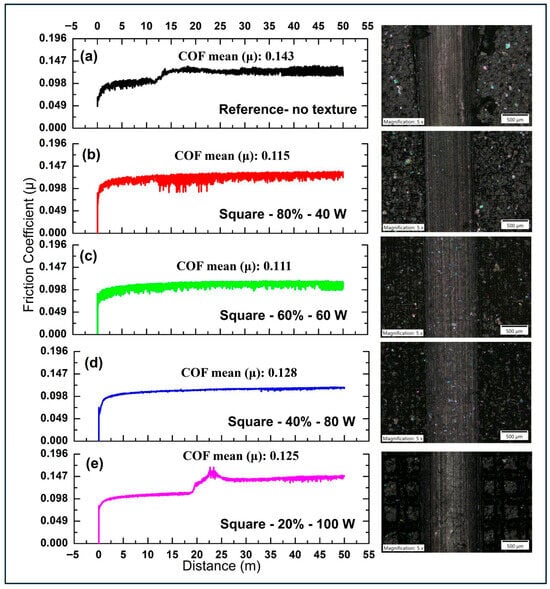
Figure 6.
Effect of laser square texturing parameters on COF values at 20 N, 1 Hz, and 50 m wear tests: (a) reference (no texture); (b) square 80% scanned area, 40 W laser power; (c) square 60% scanned area, 60 W laser power; (d) square 40% scanned area, 80 W laser power; (e) square 20% scanned area, 100 W laser power.
Figure 6a displays the behavior of the untextured PTFE-coated reference surface. After a short running period within the first few meters, the COF value rapidly increases to values in the range of about 0.09–0.10 and then gradually rises to slightly higher levels toward the end of the 50 m test, indicating a modest but continuous increase in the interfacial shear resistance. The COF signal is relatively smooth, which is consistent with the optical image showing a homogeneous wear scar without any regular microfeatures. This response represents the baseline dry sliding behavior of the intact PTFE coating against the 100Cr6 steel ball, where the friction is governed by the progressive formation of a transfer film and gradual thinning of the polymer coating.
Figure 6b illustrates a surface with a square dimple pattern that encompasses an area of 80% of the scan region at a laser power of 40 W. The running-in duration continues to be short and similar to that of the reference samples, and the COF also converges to a similar value, remaining largely at a level similar to that of reference samples. Nevertheless, there are sharper oscillations at high frequency, and these may be ascribed to the repeated scanning action by the counter face across a region with a high areal density of square cavities and intervening lands. The optical micrograph bears testimony to a region of high texturing that encompasses the wear track, with a small pitch between the dimples. The high areal coverage at low laser power results largely in a similar value of COF but a slightly more irregular trend.
Figure 6c shows the friction response of the surface processed with a 60% scanned area at an increased laser power of 60 W. In this case, the steady-state COF after running in tends to remain slightly lower than that of both the reference and the 80%–40 W surface, staying below about 0.10 for most of the sliding distance. The fluctuations are of moderate amplitude, suggesting repeated engagement with the texture while still maintaining a relatively continuous PTFE coating within the wear track. The micrograph reveals a somewhat reduced dimple density compared with the 80% surface, together with well-defined square cells that can act as micro-reservoirs and debris traps. This combination of intermediate coverage and higher laser energy appears to facilitate a more effective reduction in the real contact area and adhesive interactions, resulting in a modest but noticeable decrease in the mean friction.
Figure 6d represents the surface textured with a 40% scanned area at 80 W laser power. This yields the lowest COF among the square textured samples. After the initial rise during the first few meters, the COF value rapidly reaches a plateau near 0.09 and maintains this value almost constantly over the entire 50 m distance, with minimal noise and virtually no progressive increase. The corresponding optical image shows a smooth and continuous wear scar running between uniformly spaced square dimples that are positioned farther from the track centerline than in the higher coverage cases. This suggests that, at 40% areal coverage, the texture provides sufficient interruption of the contact and efficient trapping of wear debris while preserving an intact PTFE coating in the main load supporting region. The balance between the texture density and supporting land area achieved with 40%–80 W therefore appears optimal for friction reduction under the present test conditions.
Figure 6e illustrates the behavior of the surface with the lowest scanned area, 20%, produced at the highest laser power of 100 W. Initially, the COF increases during running to values comparable with those of the 40% and 60% textures. Subsequently, however, a pronounced peak develops around the midpoint of the test, where the COF value rises toward values close to 0.15 before decreasing again to a new quasi-steady-state level. This transient instability indicates a change in the contact behavior, most likely associated with local damage of the PTFE coating, partial exposure of the AA1050 substrate, or accumulation and ejection of debris, induced by the combination of high laser energy and sparse texture. The optical micrograph shows widely spaced deep square dimples with large untextured land areas that carry most of the load, which can lead to stress concentration and accelerated coating degradation. As a result, the final steady-state COF of the 20%–100 W surface is higher than that of the 40% and 60% textures and approaches and even exceeds the reference value, demonstrating that an excessively low texture density combined with high laser power is detrimental to the friction performance, despite the presence of microcavities.
Figure 7, which shows the development of the coefficient of friction (COF) against the sliding distance for the PTFE-coated AA1050 series samples subjected to the dry reciprocating test at 20 N, 1 Hz, and a distance of 50 m, compares the diamond laser-textured samples with varied scanned area ratios and power to the untextured samples. In the untextured PTFE-coated sample, as shown in Figure 7a, the initial short start-up or running-in period at the beginning of the test, within the first few meters, is followed by a gradual increase in the COF to slightly above 0.09, with a steadily increasing trend towards the end of the test at the 50th meter. There are no marked amplitude changes, indicating a smooth, possibly continuous, wear track, which corresponds to the homogeneous wear track observed in the micrograph. This confirms the general level of friction resistance to the gradual deformation and transfer film development of the pristine Teflon coating subjected to the defined contact.
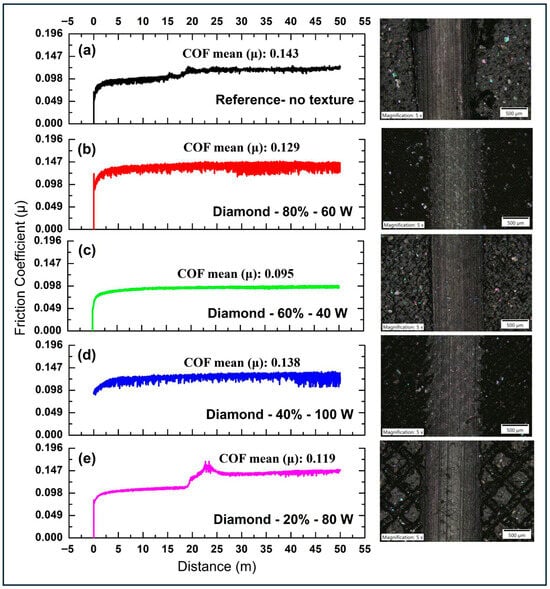
Figure 7.
Effect of laser diamond texturing parameters on COF values at 20 N, 1 Hz, and 50 m wear tests: (a) reference (no texture); (b) diamond 80% scanned area, 60 W laser power; (c) diamond 60% scanned area, 40 W laser power; (d) diamond 40% scanned area, 100 W laser power; (e) diamond 20% scanned area, 80 W laser power.
Figure 7b corresponds to the surface textured with diamond-shaped features covering 80% of the scanned area at a laser power of 60 W. After an initially sharp rise from very low values, the COF stabilizes close to the reference level, remaining within a similar range for the remainder of the test but with a noticeably more fluctuating signal. The increased noise is associated with the frequent passage of the counter face over closely spaced diamond cavities and intervening plateaus, which leads to repeated local changes in the contact stiffness and micro-ploughing. The optical image confirms a very dense texture field intersected by the wear track. Overall, the high coverage diamond texturing at moderate power does not significantly reduce the average friction coefficient compared with the reference but modifies the local contact mechanics and promotes a more irregular, yet still steady, sliding state.
In Figure 7c, the specimen processed with a 60% scanned area and 40 W laser power shows a distinctly lower and smoother COF response. After running in, the curve rapidly approaches a quasi-steady-state value that remains below the reference and 80% textured over the full 50 m distance, with very limited high frequency noise. The micrograph reveals a moderately dense diamond pattern with well-defined pockets that can act as traps for wear debris while maintaining a continuous PTFE coating along the load-carrying path. This combination of intermediate coverage and lower laser power appears to be favorable for minimizing the real contact area and adhesive interactions, resulting in the lowest and most steady mean COF among the diamond-textured surfaces.
Figure 7d represents the surface textured with a 40% scanned area at the highest laser power of 100 W. The COF after running in remains comparable to, or slightly lower than, that of the reference, but the curve exhibits more pronounced fluctuations than the 60%–40 W and a subtle tendency to increase toward the end of the test. The corresponding micrograph shows more widely spaced diamond features with larger untextured regions within the wear track, which suggests that the contact is borne mainly by the PTFE-coated plateaus that may experience higher local stresses because of the increased texture depth associated with the elevated laser power. As a consequence, the friction reduction is limited, and the system displays a somewhat more unsteady sliding behavior than the optimum 60%–40 W case.
Figure 7e shows the response of the surface textured with the lowest scanned area, 20%, at 80 W laser power. After a relatively smooth running in stage that leads to COF values similar to those of the other diamond textures, a pronounced friction peak develops at approximately the midpoint of the test, where the COF climbs toward about 0.14–0.15 before decreasing again to a new steady-state level that remains higher than those observed for the 60% and 40% textures. This transient instability indicates a significant change in the contact situations, most probably related to local damage of the PTFE coating, partial exposure of the aluminum sample, or abrupt removal of accumulated debris, which is consistent with the micrograph showing deep widely spaced diamond cells and large continuous land areas that carry the majority of the load. These results demonstrate that too low a texture density combined with a relatively high laser power can lead to stress concentration and accelerated coating degradation, thereby increasing the average friction coefficient rather than providing a beneficial texturing effect.
Figure 8 presents the evolution of the COF as a function of sliding distance for the PTFE-coated AA1050 surfaces textured with hexagonal patterns produced at different scanned area ratios and laser powers, in comparison with the untextured reference coating. All tests were conducted at 20 N normal load, 1 Hz frequency, and a total sliding distance of 50 m under dry wear. Figure 8a shows the behavior of the untextured PTFE-coated reference surface. After a short run-on stage within the first few meters, the COF rises to approximately 0.09–0.10 and remains relatively steady until about the midpoint of the test. Beyond roughly 25 m, a pronounced step-like increase occurs, and the COF reaches values approaching the upper end of the plotted range, accompanied by increased signal noise. The optical image reveals a continuous wear track without regular microfeatures, suggesting that the late increase in friction is associated with the progressive degradation or thinning of the PTFE coating and a corresponding increase in the real contact area and interfacial shear.
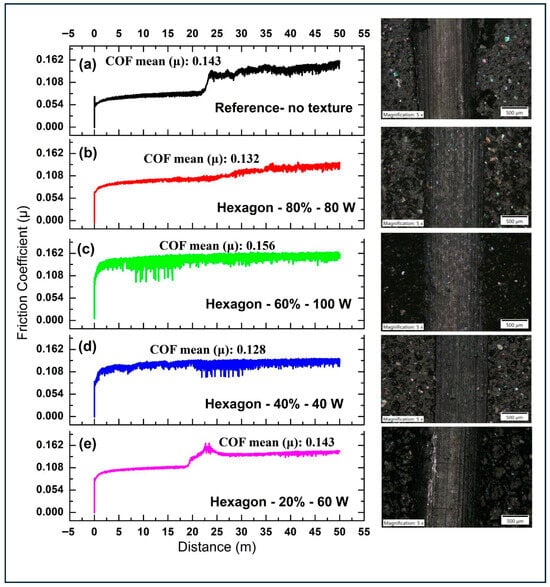
Figure 8.
Effect of laser hexagon texturing parameters on COF values at 20 N, 1 Hz, and 50 m wear tests: (a) reference (no texture); (b) hexagon 80% scanned area, 80 W laser power; (c) hexagon 60% scanned area, 100 W laser power; (d) hexagon 40% scanned area, 40 W laser power; (e) hexagon 20% scanned area, 60 W laser power.
Figure 8b corresponds to the surface textured with hexagonal cells covering 80% of the scanned area at 80 W laser power. The COF curve exhibits a rapid initial rise similar to the reference and then stabilizes at values that remain slightly lower than or comparable to the reference for most of the 50 m sliding distance. Unlike the reference, however, there is no abrupt jump at mid distance; instead, the COF shows a mild monotonic increase with moderately high frequency fluctuations. The micrograph indicates a dense field of hexagon dimples intersected by the wear track, which distributes the load over alternating plateau and cavity regions and provides trapping sites for debris. This high coverage configuration therefore mitigates the sudden friction increase observed on the untextured surface, although it does not provide a substantial reduction in the average COF.
In Figure 8c, the specimen processed with a 60% scanned area at the highest laser power of 100 W exhibits the most irregular COF response among the hexagon-textured samples. After running in stage, the COF quickly reaches relatively high values close to or slightly above those of the 80% surface and then fluctuates strongly around this level for the remainder of the test. The pronounced noise suggests repeated local stick–slip events and intermittent disruption of the contact, as the ball traverses deep hexagonal cavities produced by the high laser energy. The optical image confirms a moderately dense hexagon pattern with a significant topographical contrast between the dimples and the surrounding land areas. The increased texture depth appears to promote local stress concentrations and unstable debris entrainment, which offsets any potential friction reduction from the reduced real contact area.
Figure 8d illustrates the textured surface with the 40% scanned area, subjected to a lower laser power of 40 W. This gives the lowest and most steady coefficient of friction (COF) values among all the hexagonal textures. There is a short run-in stage before the COF settles to almost 0.09 at the plateau stage, and this stays constant up to 50 m without major fluctuations, unlike in the 80% and 60% textures, and without the step-wise transition typical of the smooth sample. The micrograph analysis shows a sparse array of hexagons side by side, but not densely packed in the central wear track, suggesting that the main contact is through the continuous PTFE layer periodically interrupted in shallow dimples acting as reservoirs and traps for debris. The balance of the 40%/40 W combination, half-way in terms of both texture density and lowered laser power output, captures the most beneficial regime in terms of maintaining the original layer structure and reducing the interfacial stickiness, hence its better frictional performance.
Figure 8e shows the response of the specimen textured with the lowest hexagon coverage, 20%, at 60 W laser power. The initial evolution of the COF is similar to that of the other textured surfaces, with a rapid increase and early stabilization. However, around the midpoint of the test, a marked friction peak develops, with the COF rising toward values comparable to or higher than the jump observed in the untextured reference, before decreasing again to a new steady-state level that remains elevated. The corresponding micrograph reveals widely spaced hexagon dimples separated by large untextured land areas within the wear track, which causes the majority of the load to be supported by the limited PTFE-covered regions. In combination with the relatively high laser power, this sparse texture likely promotes accelerated local coating damage and intermittent exposure of the aluminum substrate, leading to the observed friction peak and higher final COF. Consequently, too low a hexagon texture density is detrimental, while the intermediate 40% coverage at low power offers the most effective friction control for the PTFE-coated AA1050 surfaces.
Figure 9 illustrates the evolution of the COF as a function of the sliding distance for the PTFE-coated AA1050 specimens textured with circular dimples at different scanned area ratios and laser powers in comparison with the untextured reference coating. Figure 9 therefore enables a direct assessment of how the areal density and depth of circular features, governed by the laser processing parameters listed in the texture matrix, influence the frictional response relative to the baseline coating.
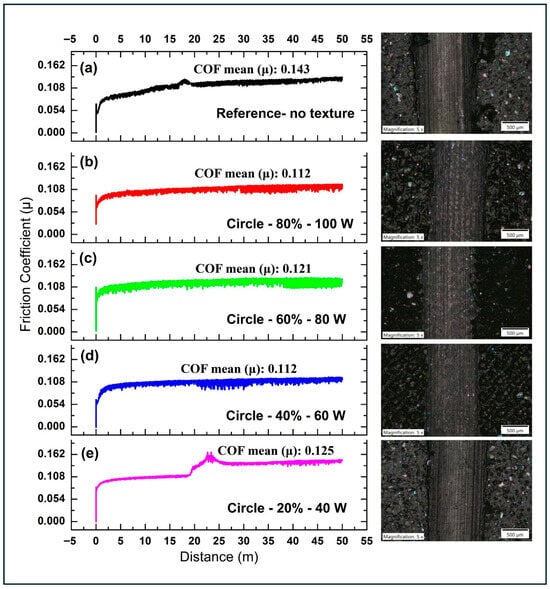
Figure 9.
Effect of laser circle texturing parameters on COF values at 20 N, 1 Hz, and 50 m wear tests: (a) reference (no texture); (b) circle 80% scanned area, 100 W laser power; (c) circle 60% scanned area, 80 W laser power; (d) circle 40% scanned area, 60 W laser power; (e) circle 20% scanned area, 40 W laser power.
Figure 9a shows the behavior of the untextured PTFE-coated reference surface. After a short run-in stage within the first few meters of sliding, the COF increases rapidly from near zero to values around 0.09 and then gradually rises toward slightly higher levels as the distance approaches 50 m. The signal remains comparatively smooth with modest noise, which is consistent with the optical micrograph showing a continuous wear track without regular microfeatures. This response is attributed to the progressive shear deformation and transfer film formation of the PTFE-coating layer and serves as the baseline friction level against which the laser-textured surfaces are evaluated.
Figure 9b corresponds to the surface textured with circular dimples covering 80% of the scanned area at a laser power of 100 W. The COF rises quickly during running in and stabilizes at values very close to those of the reference, typically around 0.09 to 0.10 over the entire 50 m distance, with a slightly more fluctuating signal. The micrograph indicates a dense array of circular depressions intersected by the wear track, which repeatedly perturbs the contact as the ball traverses the alternating plateau and cavity regions. Although this high coverage limits the long-term upward drift of friction observed on the reference, the average COF remains similar, indicating that the very dense circular texturing at high power primarily modifies the local contact mechanics without providing a significant overall reduction in friction.
In Figure 9c, the specimen processed with a 60% scanned area and 80 W laser power exhibits a COF response that remains modestly higher than that of the 80%–100 W surface for most of the test. After the initial rise, the friction coefficient stabilizes slightly above 0.10 and shows a gentle increasing trend with small amplitude oscillations. The corresponding micrograph reveals a moderately dense distribution of circular dimples, with somewhat larger land areas between adjacent features compared with the 80% surface. The real contact area carried by the PTFE-coated plateaus is increased, while the cavities remain deep due to the relatively high laser power, which reduces the effectiveness of the dimples as load sharing and debris trapping sites and, therefore, does not yield a friction benefit with respect to the reference.
Figure 9d represents the surface textured with a 40% scanned area at a lower laser power of 60 W. This configuration yields the lowest COF among the circle-textured specimens. Following running in, the friction coefficient quickly reaches a plateau near 0.09 and remains nearly constant up to 50 m, with reduced high frequency noise and without any pronounced increase in friction. The optical image shows a sparser array of circular dimples positioned adjacent to, but not densely packed within, the main load carrying region of the wear track, indicating that the contact is primarily supported by a continuous PTFE coating that is periodically interrupted by shallow cavities acting as micro-reservoirs and debris sinks. The balance between the moderate areal density and reduced laser energy achieved at 40%–60 W therefore appears optimal for preserving the coating integrity and minimizing adhesive interactions, leading to a slight but consistent reduction in the average COF compared with both the reference and the higher coverage circle textures.
Figure 9e shows the COF evolution for the specimen textured with the lowest circular coverage, 20%, at 40 W laser power. The early part of the curve is similar to the other textured with a rapid increase, followed by an initial stabilization at values comparable to those of the 40% and 60% surfaces. Around the midpoint of the test, however, a marked friction peak develops, where the COF rises to approximately 0.14 to 0.15 before decreasing again toward a new steady-state level that remains higher than the values observed for the 40%–60 W surface and close to or above the reference. The micrograph reveals widely spaced circular dimples and large untextured land areas within the wear track, meaning that the load is concentrated on relatively small regions of the PTFE coating. This sparse texture distribution, even at moderate laser power, likely promotes accelerated local coating degradation and intermittent exposure of the aluminum substrate, which in turn causes the transient friction spike and the elevated final COF. Consequently, the results for Figure 9 confirm that an intermediate circular texture density with moderate laser power is most effective for friction control, whereas overly low coverage is detrimental in a similar manner to that observed for the other geometries. The combined COF responses from Figure 6, Figure 7, Figure 8 and Figure 9 consistently indicate that moderate areal coverages (40–60%) produced at midrange laser powers produce the lowest coefficients of friction for PTFE-coated AA1050 under the tested situations, whereas both very high-coverage and very low-coverage textures lead to increased COF fluctuations, midtest friction spikes, and eventual coating distress. This behavior can be explained by three interacting texture driven mechanisms: (1) appropriately sized and spaced micro-dimples reduce the real contact area and act as debris traps and transfer film replenishment sites, promoting an intact and stable polymer transfer film in the main load-bearing region; (2) excessive texture density increases the number of cavity edges encountered per stroke, intensifying repeated micro-impacts and local ploughing that manifest as high-frequency COF noise; and (3) overly sparse textures concentrate stresses on untextured land regions, causing localized coating rupture and abrupt COF peaks. Together, these mechanisms rationalize why the 40–60%/moderate-power cases in all four geometries show the most favorable frictional performance, while the 80% (over-dense) and 20% (over-sparse) cases reproduce the destabilizing effects seen in the literature. Kovalchenko et al. [26] experimentally showed that surface texturing can change the lubrication regimes and that suboptimal texture geometries may shift contacts into less favorable frictional states, consistent with the high-power/sparse-texture COF spikes. Podgornik et al. [27] reported that intermediate area fractions generally provide optimal tribological performance by preserving a continuous lubricating or transfer film between textured pockets, matching the low-COF zones at 40–60%. Wakuda et al. [28] found that excessively dense dimple fields increase the ploughing at cavity edges and thus raise the frictional noise, which explains the elevated COF fluctuations for many of the 80% coverage cases. Rapoport et al. [29] demonstrated that laser texturing improves the wear life and adhesion stability of solid lubricant/transfer films when the texture geometry is optimized, and conversely, poor texture design reduces these benefits, a finding that directly supports the linkage between transfer-film persistence and the mid-run COF behavior.
3.3. Texture–Friction-Damage-Integrated Profilometric Analysis
Figure 10 compiles the quantitative comparison of the wear track dimensions obtained from the tests on the PTFE-coated AA1050 surfaces for all the laser-textured and reference samples. Non-contact profilometry was used to extract the average wear scar width and depth from five independent line profiles for each specimen, and the error bars represent the corresponding standard deviations, which remain below 2.5% for both parameters, confirming the good repeatability of the measurements. The reference non-textured coating is plotted at the bottom of each graph and provides the baseline against which the influence of the texture geometry, scanned area, and laser power on the wear resistance can be assessed.
In Figure 10a, where the width of the wear tracks for the textured and non-textured surfaces is shown, the reference sample portrays the widest wear track, with a width significantly larger than the other laser-textured specimens. This observation reveals a beneficial effect of fiber laser surface texturing, independent of geometry, on suppressing the lateral damage spread for the PTFE-coated AA1050 alloy material. For laser-textured specimens, the square 80%/40 W exhibits a narrower wear track, indicating better resistance against lateral wear growth. This was followed by the square 60%/60 W and diamond 60%/40 W, showing a considerable reduction in width compared with the reference sample, followed by the hexagon 40%/40 W and circle 40–60%/60–80 W, portrayed in an intermediate region. However, laser textures produced with low scanned areas and/or high laser powers, namely square 20%/100 W, diamond 20%/80 W, hexagon 20%/60 W, and circle 20%/40 W, show increased widths and approach the width for the reference sample, indicating lower load-sharing performance and debris entrapment. The bar representation, thus, enforces the benefit of either high or intermediate areal coverage and moderate laser powers for resisting lateral wear growth.
The corresponding wear track depths are shown in Figure 10b. There are observable similarities in the trends among the wear track depths, which are similar to the trends among the wear track widths. The wear scar on the reference sample coating has the largest depth, which affirms that the lack of microtexture leads to higher penetration of the PTFE layer. The shallowest scars are obtained for square 80%/40 W, square 60%/60 W, and diamond 60%/40 W, followed closely by hexagon 40%/40 W and the circle 40–60%/60–80 W configurations, all of which exhibit depths that are markedly lower than the reference. These textures correspond to the specimens that also showed relatively lower COF values in Figure 6, Figure 7, Figure 8 and Figure 9, suggesting that a reduced real contact area and efficient debris accommodation translate simultaneously into lower friction and lower wear. By contrast, the low coverage and higher power textures such as diamond 20%/80 W, hexagon 20%/60 W, and circle 20%/40 W exhibit deeper scars, in some cases approaching the reference depth, in agreement with their higher and lower friction coefficients.

Figure 10.
Effect of laser-texturing parameters on wear track width and depth values at 20 N, 1 Hz, and 50 m wear tests: (a) wear scar width; (b) wear scar depth. (The average value was calculated after five repetitions for each measurement).
For the wear track width/depth for different laser-textured surfaces, the error bars represent the standard deviation (<2.5%). The results obtained from the ANOVA analysis, as shown in Table 3, confirmed a high degree of statistical evidence to validate the results of the wear track dimension measurements shown in Figure 10. For purposes of validating the experimental results and enhancing the overall experiment replicability, it should be noted that all points used within this analysis were averaged based on a minimum of three trials under each test condition (n = 3). The results of this analysis suggested that the scanned area ratio had a high degree of statistical evidence in determining the wear track width (p < 0.001), which directly supports Figure 10, in which surfaces that did not have a high degree of areal coverage (20%) tended to be close to that of the non-textured surface in dimension. Additionally, high degrees of statistical evidence existed within both the texture type and laser power (p ≤ 0.003), which further supports that the differences within each set of results did not occur by random chance but through highly systematic values of tailored optimal laser processing conditions.
Table 3.
Analysis of variance (ANOVA) results for wear track width based on the data in Figure 6, obtained from the average of three independent experimental measurements (n = 3).
Figure 11 provides a direct visual link between the reciprocating wear response and the post-test surface morphology of selected PTFE-coated AA1050 samples. Three-dimensional topography maps are shown alongside corresponding transverse line profiles for the wear tracks generated at 20 N, 1 Hz, and 50 m, allowing simultaneous assessment of the wear scar shape, lateral extent, and minimum penetration depth. The five cases comprise the non-textured reference coating and four representative laser-textured surfaces that span the range from the most favorable to a relatively less effective friction and wear response, namely square 80%/40 W, diamond 60%/40 W, hexagon 40%/40 W, and circle 20%/40 W. The numerical width and depth values extracted from these profiles are consistent with the statistical analysis shown in Figure 10 and enable a texture-specific comparison of the damage morphology.
Figure 11a corresponds to the non-textured reference surface and clearly shows the most severe damage among all cases. The three-dimensional map reveals a deep narrow valley surrounded by pronounced pile up ridges and isolated debris agglomerates, which indicates extensive plastic deformation of the PTFE layer and local material removal. The transverse profile confirms a maximum wear track width of approximately 1240 µm and a minimum depth of about 82 µm, substantially larger than the values measured for the textured specimens. The steep flanks and sharp valley bottom are consistent with intense contact pressures and limited capacity for debris accommodation, which is in line with the comparatively high and progressively increasing COF recorded for the reference surface during sliding.

Figure 11.
Comparison of 3D surface topography maps and cross-sectional wear scar width and minimum depth values at 20 N, 1 Hz, and 50 m wear tests according to texture types: (a) reference (no texture); (b) square 80%, 40 W, (c) diamond 60%, 40 W, (d) hexagon 40%, 40 W, (e) circle 20%, 40 W.
Figure 11b shows the wear track morphology for the square 80% scanned area, 40 W, which previously exhibited one of the lowest wear scar dimensions and a stable COF response. The topography map indicates a well-defined but relatively shallow groove embedded in a densely textured field of square cells, with much less loose debris and pile up than in the reference case. The cross-sectional profile confirms a substantial reduction in the wear track width, down to about 930 µm, and depth, down to approximately 34 µm. The valley shows a smooth gentle-sloping surface, indicative of a more even load distribution, suggesting that the transferred PTFE layer is still a continuous film on the surface. This, along with the square dimples around it, acts as a trapping mechanism for the delaminated particles and as a reservoir for the transfer film. This could be the reason for the observed decrease in friction and wear.
Figure 11c corresponds to the diamond 60% scanned area, 40 W surface, that was identified by the Taguchi analysis as the optimum parameter set for minimizing the average COF. The three-dimensional map shows a slender uniformly shaped wear groove flanked by a moderately dense diamond pattern, with very limited pile up and debris accumulation. The line profile indicates a wear track width of roughly 997 µm and a minimum depth of about 39 µm, slightly higher than those of the square 80%/40 W specimen but still markedly lower than the reference. The broader, yet still shallow, valley suggests that the diamond texture provides an efficient balance between load carrying plateaus and recessed pockets, distributing stresses while enabling debris entrapment. This morphology is consistent with the very low and smooth COF evolution measured for this configuration and confirms that the optimum friction performance is accompanied by a significantly reduced penetration of the PTFE-coating layer.
Figure 11d shows the topography and cross section for the hexagon 40% scanned area, 40 W specimen, which also displayed a very low COF in Figure 8 and intermediate wear scar dimensions in Figure 10. The three-dimensional map exhibits a long narrow groove with smooth edges running between sparsely arranged hexagonal cells. The transverse profile yields a wear track width of about 965 µm and a depth of roughly 36 µm, values that lie between those of the square 80%/40 W and diamond 60%/40 W cases but remain far below the reference. The gently curved valley and absence of sharp discontinuities indicate that the PTFE coat experiences mainly mild distributed deformation, rather than catastrophic removal, while the neighboring hexagon cavities provide sufficient space for debris storage without excessively fragmenting the load bearing area. This balanced morphology explains why the hexagon 40%/40 W texture achieves a friction and wear performance comparable to the best square and diamond configurations.
Figure 11e represents the circle 20% scanned area, 40 W surface, selected as a representative of the low coverage textures that showed less favorable tribological behavior. The topography map reveals a relatively wide central groove on a mostly untextured background with only sparsely distributed circular dimples, and the presence of local pile up and small debris clusters is more evident than for the square, diamond, and hexagon cases. The line profile indicates a wear track width of approximately 1106 µm and a depth of about 45 µm, values that are clearly larger than those of the three optimized textures and approach the reference case. The broader and deeper valley confirms that the low area fraction of circular cavities is insufficient to significantly relieve the contact stresses or to efficiently accommodate wear debris; so, the majority of the load is carried by limited PTFE-coated regions that are prone to localized damage.
The SEM picture of the reference sample (Figure 12a) reveals a continuous and relatively smooth contact area with significant smearing of the PTFE layer in the direction of the motion. Also visible are the localized microcracks and flattened areas on the contact area. These are an indication of the continuous plastic flow on the polymeric layer. This is due to the absence of surface topography on the counterpart surface that would have helped in trapping debris. This is shown in the third-body abrasion on the polymeric layer. This correlates with the high coefficients of friction shown for the respective samples. For the square texture sample (80% scanned area, 40 W), the wear track, circumscribed by fully existing square microcavities, is observed to be reasonably confined and narrow (Figure 12b). The PTFE coating is also reasonably continuous in the wear track, with very little cracking. The small debris is selectively trapped inside the square dimples, thus suppressing abrasive action in the contact region. These SEM results support the assertion that a dense square texture laser processed with a moderate laser power can significantly improve the PTFE coating longevity by virtue of debris entrapment. On the other hand, for the square-textured sample scanned with 20% of the scanned area at 100 W, the wear mark appears wider and less consistent in the SEM photograph (Figure 12c). There are local areas where delamination and consequent exposure of the substrate have occurred, as well as along the median rubbing track. This is because the large pitch between square features forces a localized load on smooth areas, with deeper laser-ablated features also contributing to exacerbated stress concentration at the edges of ablated features, as a result of the high laser power used for ablation.
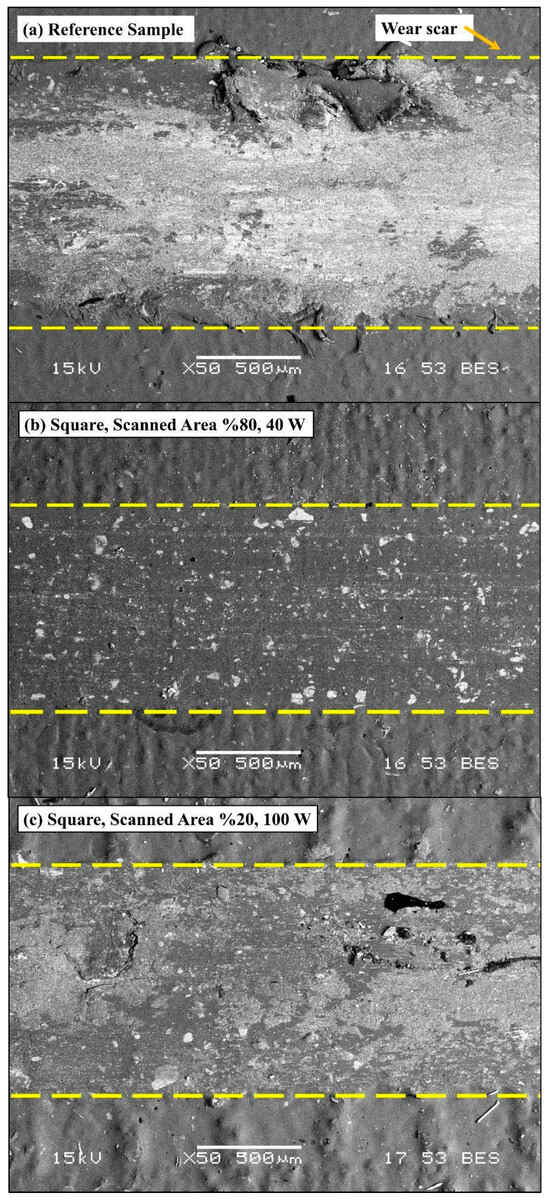
Figure 12.
SEM micrographs of square-textured and reference PTFE-coated AA1050 surfaces after wear tests: (a) reference (no texture), (b) square 80%, 40 W, (c) square 20%, 100 W.
A scanning electron micrograph of the diamond-textured specimen with a scanned area of 60%, at a power of 40 W, depicts a smooth wear track with no damage to the PTFE coating, as can be seen in Figure 13a. There are no flattened diamond features, apart from the wear track, which shields the wear debris. There are only very subtle polishing marks aligned with the sliding direction, which shows that the slider exhibits a consistent motion trend, hence the dominance of the transfer-film lubrication mechanism rather than the abrasive wear. Consistent with this observation, the SEM image proves that this diamond texturing layout provides the most balanced loads with an optimal PTFE film retention. On the other hand, the diamond-textured sample, with a scanned area of 40%, at the highest power of 100 W, exhibits some point damage to the coating, along with some micro-fractures around the cavity edges, as can be seen from the more detailed image provided in Figure 13b. A higher laser power applied increases the size of the diamond cavities, which are conducive to the repeated build-up and removal of the wear debris, eventually inducing unsteady contact.
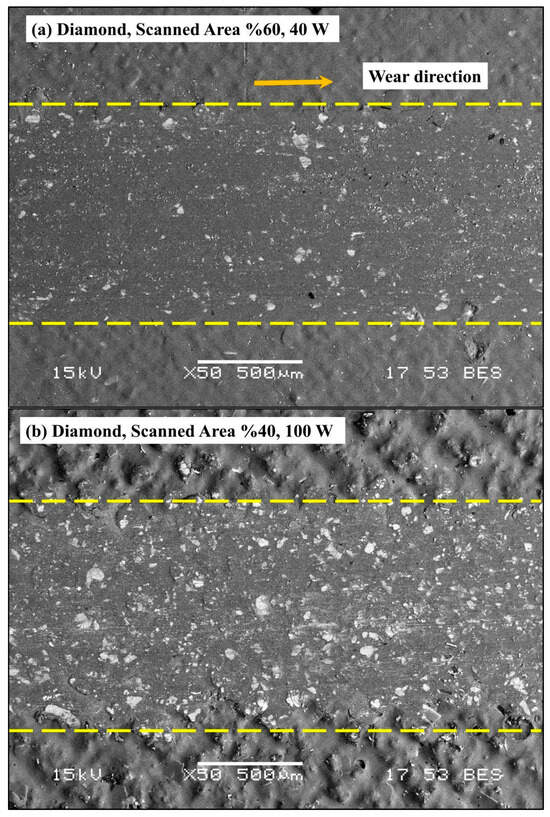
Figure 13.
SEM micrographs of diamond-textured PTFE-coated AA1050 surfaces after wear tests: (a) diamond 60%, 40 W, (b) diamond 40%, 100 W.
For the hexagon-textured specimen scanned at a 60% area with 100 W, observable surface roughness within the wear track, characterized by micro-ploughing, polytetrafluoroethylene (PTFE) debris, and hexagonal cavities, can be seen in the scanning electron microscopy images (Figure 14a). Due to the deep hexagonal cavities, the interface experiences frequent mechanical interactions, causing unstable contact and thus higher third-body abrasion. For the hexagon-textured specimen scanned at 40% area with 40 W, a smooth continuous PTFE layer, minimal wear debris, and insignificant coating removal within the wear track can be observed. There are intact hexagonal cavities acting as efficient reservoirs of the debris. This occurs because the hexagon-textured specimen scanned at 40% area with 40 W exhibits a low-value coefficient of friction (COF) plateau with moderate wear size; thus, the reduced laser power flux causes moderate hexagon density, preserving the coating intact, with stabilized friction (Figure 14b).
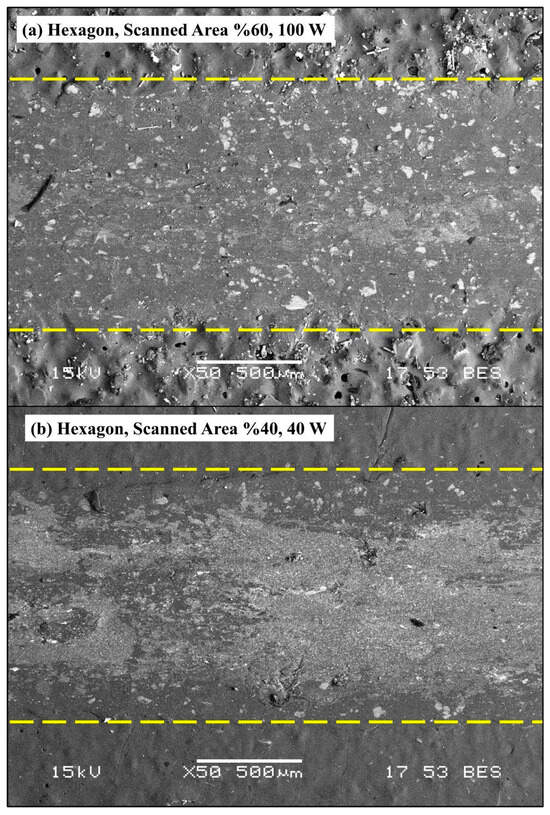
Figure 14.
SEM micrographs of hexagon-textured PTFE-coated AA1050 surfaces after wear tests: (a) hexagon 60%, 100 W, (b) hexagon 40%, 40 W.
The comparative SEM analysis of the diamond-textured surface produced at 60% scanned area and 40 W (Figure 13a) and the hexagonal texture fabricated at the same area ratio, but a higher laser power of 100 W (Figure 14a), reveals a fundamental shift in the governing failure mechanism of the PTFE coating. In the diamond texture processed at lower laser power, the smoother cavity walls and reduced texture depth promote a more homogeneous stress distribution along the coating–substrate interface, allowing the microcavities to function effectively as debris traps and transfer-film cavities. This supports the formation of a steady and continuous PTFE transfer layer, consistent with the classical framework proposed by Etsion [30], who emphasized that optimized laser surface textures reduce the real contact area while avoiding excessive stress concentration at texture edges. Conversely, the hexagonal pattern created at a power of 100 W has more defined topographic features and sharp edges of the cavities, which result in localized stress concentration at the edges of the coating. Therefore, instead of providing a debris-trapping benefit, the aggressive topographic feature allows for micro-cracking, coating failure, and localized delamination of the coating along the wear track, as shown in Figure 14a. Indeed, the findings of the current research support the evaluation of Gachot et al. [12], which indicated that the use of high-depth laser-created topographic features can result in the failure of the tribological benefit of surface texturing, due to stress-induced failure of the coating. Therefore, the poor tribological performance of the high-power hexagonal pattern is mainly attributed to the stress concentration caused by the excessive laser power input.
In the SEM photograph of the specimens scanned at an area of 80% and power consumption of 100 W, the periodic arrangement can be observed within the circular dimple, leading to markings within the wear track (Figure 15a). Although the specimens have limited damage due to the coatings, the cyclic micro-impact process carried out around the perimeter boundaries results in the creation of polishing influences within the micro-grooves. This corresponds to a COF similar to that of the reference specimen and moderate wear depth, confirming that overly high concentrations of textures are insufficient to significantly promote the tribological properties. In contrast, for the specimen with a 20% scanned area and a power of 40 W, a wide wear track and corresponding coating thinning together with local debris accumulation are observed (Figure 15b). The low concentration of textures is insufficient to offer debris capacity, and the resulting stress concentrations within the PTFE-coated surfaces of the plateau regions are increased. SEM images from these specimens support coating failures that correspond to a detected COF peak and increased wear depth as derived from the profilometry.
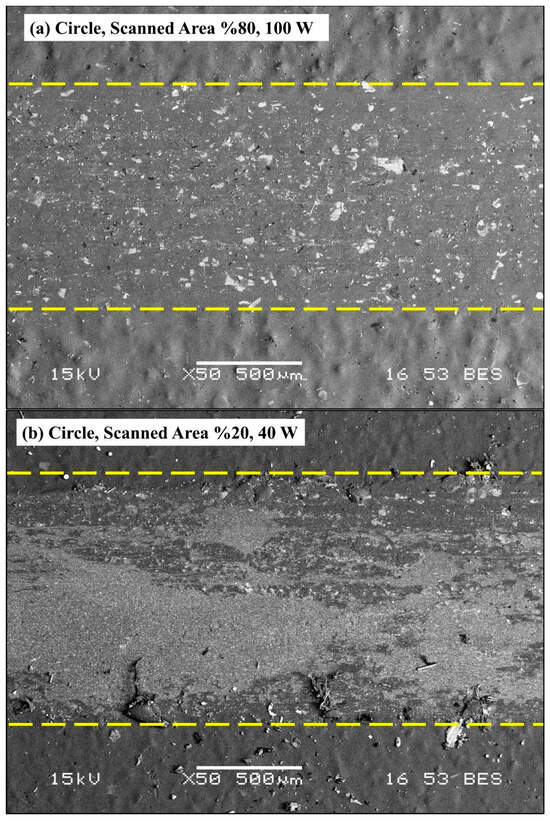
Figure 15.
SEM micrographs of circle-textured PTFE-coated AA1050 surfaces after wear tests: (a) circle 80%, 100 W, (b) circle 20%, 40 W.
During the process of surface texturing through the use of a laser, coupled with the subsequent friction tests, the coatings are susceptible to the effect of residual stresses caused by localized thermal cycles, as well as the difference in the rates of thermal expansion between the two different substances, namely the coating and the metallic substrate on which it is applied. The phenomenon of fast heating due to the application of a laser surface treatment, followed by fast cooling, could cause the coating to experience stress, which will depend on the amount of energy imparted to the surface through the use of a laser. The solid lubricant coating, which can also act as a polymer coating, would experience stresses due to the effect of heating, which upon subsequent cooling would cause the coating to debond from the metallic surface. Through SEM analysis, the geometry of the texture, as well as the amount of laser power, indirectly affects the stress state on the coating surface. The texture with a lower amount of laser power would experience a smoother edge, along with a shallow cavity, which would help to reduce the stress concentrations on the coating–texture interface, thus ensuring that the continuous coating transfer layer is maintained. On the contrary, the texture would exhibit sharper edges along with deeper cavities, which would help to enhance the stress concentrations on the coating layer due to the effect of lasers, thus leading to a higher stress state on the coating surface, which would trigger the coating failure process due to the formation of cracks along the surface. Furthermore, the surface textures would help to affect the stress relaxation processes along the coating surface due to the difference in the pressure level of the two surfaces, thus leading to a change in the stress state along the coating surface. The texture would help to ensure a reduced real contact surface, along with the effect of reduced pressure, which would help to ensure that the stress level on the coating surface is also reduced. The aggressive surface texture would help to restrict the deformation along the edges, thus leading to a higher stress state along the surface due to the reduced deformation level.
3.4. Optimization of Laser Processing Parameters for Minimizing the COF Values Using the Taguchi Method
Taguchi methods can be regarded as a superior statistical tool for optimizing processes in various fields of engineering, which can be used to enhance the process performance and product quality in an efficient manner [31]. One of the major advantages over other traditional full factor experiments is that these methods can be used to determine optimal process conditions in a short period, leading to time, cost, and resource savings. The Taguchi method also uses a signal-to-noise (S/N) ratio, which measures a system’s robustness, distinguishing undesired process variables (noise) from desired variables (signals) in a process under observation, which plays a significant role in optimizing the process performance, especially in a scenario where external environmental variables are uncontrollable in nature [32]. The signal-to-noise ratio (S/N) in the Taguchi method takes into account the effect of noise caused by the uncontrollable factors. As such, the best result is achieved by maximizing the S/N ratio. By using the Taguchi method, three different states can be defined, and the associated S/N ratios are calculated as described in references [33,34].
(1) The lower the better:
(2) The larger the better:
(3) The nominal value is the best:
The
value in these equations represents the measurement results for each trial. The analysis of variance (ANOVA) is an important statistical tool used as a basis for analyzing and obtaining results within the Taguchi approach to analyze the effects of multiple variables on a system and process [35]. The Taguchi-based ANOVA utilizes an orthogonal array design approach that cuts down on the need for a comprehensive experiment series, thus saving time and resources. Taguchi–ANOVA allows scientists and engineers to make better process design optimizations by highlighting and determining the percentage contribution of each variable considered toward overall variability.
In this study, we aimed to obtain a surface with a smaller COF value. The averages of the measurement results and the signal/noise ratios calculated according to a lower COF are given in Table 4. For this purpose, the lower the better characteristic given in Equation 1 was used in the calculations made according to the Taguchi method. The COF value of the PTFE-coated aluminum surfaces was measured from three different areas of the surface to reduce the error rate. To better interpret the change in the COF, the COF values of the PTFE-coated aluminum surfaces without laser texture were measured as a reference surface. The average COF value of the reference surface was 0.143. Except for experiment numbers 10 and 12, all the experimental results showed that the laser texturing decreased the COF values of the surfaces. It is observed that the COF values of the PTFE-coated various laser-textured surfaces obtained with experiment set number 12 did not change, and the COF obtained with the laser-texturing process with experiment set number 10 was higher than the COF value of the reference surface.
Table 4.
Experimental set with average COF values of PTFE-coated various laser-textured aluminum surfaces and S/N values of each COF value.
The ANOVA table obtained by using the results in Table 4 and calculations according to the Taguchi method is given in Table 5.
Table 5.
Response table according to Taguchi method.
As seen from the ANOVA calculations, the minimum COF value was obtained with the experimental set where the texture type was diamond, the scan area rate was 60%, and the laser power was 40 W. These optimum experimental results are found in experimental set number 6. Instead of 64 experiments conducted with traditional experimental designs, the optimum result was obtained with 16 experiments suitable for the L16 orthogonal array suggested by the Taguchi method. As an exceptional case, specific to this study, the friction coefficient of the surface obtained with test set number 12 is equal to the COF value of the reference surface, which is the surface that has not undergone any laser-texturing process. As seen in Table 5, the parameter that affected the result most effectively was calculated as a scan area rate with a rate of 39.72%. The parameter that affected the result least was a laser power with a rate of 25.21%. The detailed topographic image of the laser-textured and PTFE-coated AA1050 sample obtained with the high-resolution profilometer obtained with experimental set number 6 is given in Figure 16.
Although the Taguchi results table compares the laser-texturing parameters to one another, the main effect plots analyze the effect of the laser-texturing parameters separately. It describes a change in the system of a factor on the response variable, regardless of the system of any other factors, indicating a main effect. In a main effects plot, the mean response of a factor at a particular level is usually graphed to evaluate the possible trends, such as linear, nonlinear, small, and nonsignificant effects, among others. A graph that is not as steep shows little or minimum effect, whereas a steep graph shows the large effect of a factor. Figure 17 shows the main effect plots for COF.
In the first of the three main effect plots shown in Figure 17, the effect of the laser-texture type on the COF values on the AA1050 sample is seen independently. The lowest COF value was obtained when the texture type was circle. The lowest COF value was obtained when the scan area rate was 60%. It is observed that when the scan area rate increased from 20% to 40% to 60%, the COF of the aluminum surface decreased. But when the scan area rate increased from 60% to 80%, the COF value of the aluminum surface increased slightly. The minimum COF value was observed when 40 W laser power was applied. When the laser power decreased from 40 W to 10 W, the COF value increased almost linearly.

Figure 16.
(a) Detailed topographic image of the laser-textured and PTFE-coated AA1050 sample surface obtained with the experiment set number (diamond, 60%, 40 W). (b) Extracted profile along the black line seen on the topographic image.

Figure 17.
Main effect plots for coefficient of friction.
In multivariate experimental design scenarios involving the simultaneous effects of two or more independent factors on the response variable, regression analysis is an effective statistical method. Regression analysis helps in the formulation of predictive models for understanding the individual and interaction effects of factors, as well as exploring the complex relationships between variables. In experimental design, regression analysis helps identify the dominant variables, thus allowing the efficient selection of the more influential variables with the aim of reducing the cost of experiments. In the current experimental study, since there were three different laser processing factors that separately contribute to the coefficient of friction (COF) between the two materials, regression analysis was used to investigate the interaction effects caused by the variables. p-values, R-squared, and the adjusted R-squared were used in the analysis to ensure the validity of the applicability of the optimization technique in the study. A regression equation developed using Minitab 21.1.1 is shown below.
On comparing the calculated results using the regression equation, as depicted in Table 5, with the experimental data, it is clear that there is a very close fit between them, except in three experiments, where the variation is between 0.55% and 12.16%. This further clarifies that a high degree of reliability was established through these regression equations. Table 6 gives the comparison between the regression-based predictions and the experimental results.imental results.
Table 6.
Comparison of the results obtained with the regression equation with experimental results.
Table 6.
Comparison of the results obtained with the regression equation with experimental results.
| Sample No | Average of COF | COF from Reg. Equation | Differences% |
|---|---|---|---|
| 1 | 0.115 | 0.123 | 7.30 |
| 2 | 0.111 | 0.124 | 11.95 |
| 3 | 0.128 | 0.125 | 2.25 |
| 4 | 0.125 | 0.126 | 0.78 |
| 5 | 0.129 | 0.133 | 3.16 |
| 6 | 0.095 | 0.125 | 32.08 |
| 7 | 0.138 | 0.139 | 0.55 |
| 8 | 0.119 | 0.131 | 10.22 |
| 9 | 0.132 | 0.158 | 19.55 |
| 10 | 0.156 | 0.161 | 2.97 |
| 11 | 0.128 | 0.143 | 11.41 |
| 12 | 0.143 | 0.145 | 1.71 |
| 13 | 0.112 | 0.141 | 25.73 |
| 14 | 0.121 | 0.133 | 10.10 |
| 15 | 0.112 | 0.126 | 12.16 |
| 16 | 0.125 | 0.118 | 5.58 |
4. Conclusions
This study demonstrated that controlled fiber laser surface texturing of AA1050 prior to PTFE coating can substantially improve the dry friction stability and wear resistance, provided that the texture density and laser energy are balanced. A Taguchi L16 design was used to vary the texture geometry (square, diamond, hexagon, circle), the scanned area ratio, and the laser power, enabling the systematic identification of process–performance relationships with a reduced experimental set.
Across the textured conditions, the steady-state friction response strongly depended on the combined effect of the texture type, areal coverage, and laser power. The lowest measured mean COF among the 16 trials was obtained for the diamond texture at 60% scanned area and 40 W (experiment 6, COF = 0.095), whereas the highest mean COF occurred for the hexagon texture at 60% scanned area and 100 W (experiment 10, COF = 0.156). In addition, the hexagon 20% scanned area at 60 W (experiment 12) produced a COF that did not change relative to the untextured reference, while experiment 10 exceeded the reference friction level, highlighting that sparse or overly aggressive texturing can negate the intended tribological benefit.
The profilometry and post-wear microscopy confirmed that the friction trends were accompanied by clear differences in coating damage evolution and wear track geometry. The untextured reference exhibited the most severe damage, with a wear-track width of approximately 1240 µm and a minimum depth of about 82 µm, while optimized textures markedly reduced the penetration and lateral spreading. For example, the square 80% scanned area and 40 W case reduced the wear track to about 930 µm width and 34 µm depth, and the Taguchi-identified diamond 60% and 40 W case yielded about 997 µm width and 39 µm depth, both far below the reference in depth and substantially improved in overall scar morphology. The SEM observations were consistent with these findings, showing that well-designed textures preserved a more continuous PTFE-coated layer and promoted debris entrapment within cavities, whereas sparse textures and/or high-power exhibited localized coating rupture and more irregular wear scars.
To verify the reliability of the observed differences in wear performance, a one-way ANOVA was performed. The results confirmed that the reductions in wear track dimensions for optimized textures (e.g., diamond 60%–40 W and square 40%–80 W) were statistically significant (p < 0.05) compared to the non-textured reference. Based on the Taguchi–ANOVA optimization, the best combination of factors involving the reduction in the CoF could be achieved with diamond-shaped textures with a scanned area of 60%, as well as laser power at 40 W, with a corresponding CoF of 0.09. In addition, based on the ANOVA outputs, the factors that influenced the studied response showed that the scanned area ratio had the highest weight among the factors, at 39.72%, followed by the type of texture at 35.07% and the laser power at 25.21%. These results clearly indicate that the control of the density of the textures acts as the key design parameter to make the friction of the PTFE-coated AA1050 independent of the applied conditions. The overall outputs provide processing information to produce the PTFE-coated surface of the aluminum materials to enhance durability and predictability at the same time.
While the Taguchi-identified optimum (diamond texture, 60% scanned area, 40 W) exhibited the most favorable performance under the present dry reciprocating conditions (20 N, 1 Hz, 50 m, ambient laboratory temperature and humidity), its friction-reduction mechanisms may be sensitive to service environments that were not addressed in this study. At high relative humidity, condensation or capillary water retention within the microcavities may partially occupy the debris-storage volume, promote the formation of a debris–moisture slurry, and destabilize the PTFE transfer film, thereby attenuating the third-body accommodation benefit of the texture. At elevated temperatures, thermally activated viscoelastic creep and the reduced mechanical stiffness of the polymer layers, together with increased thermal-mismatch stresses at the coating–substrate interface, may accelerate coating wear and interfacial damage around texture edges. Accordingly, the proposed optimum should be regarded as valid within the tested parameter window, and future work should quantify its robustness through humidity- and temperature-controlled tribological experiments, including longer sliding distances and thermal cycling, to define reliable operating envelopes for practical deployment.
Author Contributions
T.C., design, data collection, analysis, and writing. S.F., original draft preparation and writing—review and editing. M.Ö.B., formal analysis, methodology, and writing—review and editing. S.Ü., visualization and writing—review and editing. D.T.Ü., experimental investigation, data analysis, and preparation of the original draft of the manuscript. M.İ.Ö., conceptualization, methodology, and writing—review and editing. All authors have read and agreed to the published version of the manuscript.
Funding
This research received no specific grant from any funding agency in the public, commercial, or not-for-profit sectors.
Data Availability Statement
The datasets presented in this article are not readily available because the data are part of an ongoing study. Requests to access the datasets should be directed to the corresponding author.
Conflicts of Interest
The authors declare no conflicts of interest.
Abbreviations
The following abbreviations are used in this manuscript:
| COF | Coefficient of friction |
| ANOVA | Analysis of variance |
| SEM | Scanning electron microscope |
References
- Witkowska, M. Interrogation of the Manufacturing Route of Aluminium AA1050 Used in Lithographic Application. Ph.D. Thesis, The University of Manchester, Manchester, UK, 2013. [Google Scholar]
- Zhu, Z.; Zhang, X.; Liu, Y.; Wang, Z. Effects of tensile elastic pre-deformation at different strain rates on the high-cycle fatigue behavior of SAE 1050 steel and fatigue life prediction. J. Mater. Res. 2016, 31, 2825–2837. [Google Scholar] [CrossRef]
- Gadallah, E.A.; El-Mahallawy, N.; El-Sayed, A. Microstructure characterizations and mechanical properties of 1050 aluminum deformed by equal channel angular pressing. Port-Said Eng. Res. J. 2024, 28, 110–118. [Google Scholar]
- Hashmi, A.W.; Mali, H.S.; Meena, A. Improving the surface characteristics of additively manufactured parts: A review. Mater. Today Proc. 2023, 81, 723–738. [Google Scholar] [CrossRef]
- Yudhanto, A.; Alfano, M.; Lubineau, G. Surface preparation strategies in secondary bonded thermoset-based composite materials: A review. Compos. Part A 2021, 147, 106443. [Google Scholar] [CrossRef]
- Gautam, K.; Singh, R.; Kumar, A. Surface modifications of polymer-based 3D-printed structures: Metal coating prospects and challenges. Polym. Adv. Technol. 2024, 35, e6369. [Google Scholar] [CrossRef]
- Abbas, A.; Khan, M.; Ahmad, Z. Artificial super-wettable surfaces based on bioinspired polymeric materials for biomedical applications. Polymers 2022, 14, 238. [Google Scholar] [CrossRef]
- Vishnoi, M.; Kumar, P.; Murtaza, Q. Surface texturing techniques to enhance tribological performance: A review. Surf. Interfaces 2021, 27, 101463. [Google Scholar] [CrossRef]
- Wang, H.; Liu, Y.; Zhang, J. Laser-processed functional surface structures for multifunctional applications. J. Manuf. Process. 2024, 116, 247–283. [Google Scholar] [CrossRef]
- Wu, Z.; Zhang, S.; Li, H. Tribological characteristics and advanced processing methods of textured surfaces. Int. J. Adv. Manuf. Technol. 2021, 114, 1241–1277. [Google Scholar] [CrossRef]
- Arulvel, S.; Kumar, S.; Prakash, R. Laser processing techniques for surface property enhancement. Surf. Interfaces 2023, 42, 103293. [Google Scholar] [CrossRef]
- Gachot, C.; Rosenkranz, A.; Hsu, S.M.; Costa, H.L. A critical assessment of surface texturing for friction and wear improvement. Wear 2017, 372–373, 21–41. [Google Scholar] [CrossRef]
- Mao, B.; Siddaiah, A.; Liao, Y.; Menezes, P.L. Laser surface texturing and related techniques for enhancing tribological performance of engineering materials: A review. J. Manuf. Process. 2020, 53, 153–173. [Google Scholar] [CrossRef]
- Rosenkranz, A.; Costa, H.L.; Baykara, M.Z.; Martini, A. Synergetic effects of surface texturing and solid lubricants to tailor friction and wear. Tribol. Int. 2021, 155, 106792. [Google Scholar] [CrossRef]
- Ayanleye, O.; Adewuyi, B.; Salami, A. Utilization of PTFE for insulating aerospace cables. Int. J. Adv. Res. Eng. Technol. 2024, 15, 57–64. [Google Scholar] [CrossRef]
- Amenta, F.; Bolelli, G.; De Lorenzis, S.; Bertarini, A.; Lusvarghi, L. Tribological behavior of reinforced PTFE composites. Lubricants 2022, 10, 5. [Google Scholar] [CrossRef]
- Chen, X.; Zhang, Y.; Li, C.; Huang, L.; Wang, Y.; Gao, T.; Zhang, Z.; Liu, W. Wear properties of C–MoS2–PTFE composite coatings. Lubricants 2022, 10, 181. [Google Scholar] [CrossRef]
- Singh, V.; Singla, A.K.; Bansal, A. Influence of laser texturing with PTFE topcoat on erosion resistance. Surf. Coat. Technol. 2023, 470, 129858. [Google Scholar] [CrossRef]
- Bendarma, A.; Rusinek, A.; Akhzouz, H. Impact and perforation behavior of aluminum alloy 1050. Mater. Today Proc. 2022, 52, 40–44. [Google Scholar] [CrossRef]
- Garcia-Alonso, D.; Serres, N.; Demian, C.; Costil, S.; Langlade, C.; Coddet, C. Laser processes to enhance adhesion of thermal-sprayed coatings. J. Therm. Spray Technol. 2011, 20, 719–735. [Google Scholar] [CrossRef]
- Rudawska, A.; Danczak, I.; Müller, M.; Valášek, P. The effect of sandblasting on surface properties for adhesion. Int. J. Adhes. Adhes. 2016, 70, 176–190. [Google Scholar] [CrossRef]
- Soltani-Kordshuli, F.; Miller, C.; Harris, N.; Zou, M. Laser surface texturing of PTFE coatings. Polym. Test. 2023, 117, 107852. [Google Scholar] [CrossRef]
- Escobar, J.; Arurault, L.; Turq, V. Tribological behavior of PTFE–anodic film composites on AA1050. Appl. Surf. Sci. 2012, 258, 8199–8208. [Google Scholar] [CrossRef][Green Version]
- Standard’s ISO 25178-2:2021; Geometrical Product Specifications (GPS)—Surface Texture: Areal. Part 2: Terms, Definitions and Surface Texture Parameters. International Organization for Standardization: Geneva, Switzerland, 2021.
- ISO 4287: 1997; Geometrical Product Specifications (GPS)—Surface Texture: Profile Method—Terms, Definitions and Surface Texture Parameters. International Organization for Standardization: Vernier, Switzerland, 1997.
- Kovalchenko, A.; Ajayi, O.; Erdemir, A.; Fenske, G.; Etsion, I. Effect of laser surface texturing on lubrication regimes. Tribol. Int. 2005, 38, 219–225. [Google Scholar] [CrossRef]
- Podgornik, B.; Vilhena, L.M.; Sedlaček, M.; Rek, Z.; Žun, I. Effectiveness and design of surface texturing. Meccanica 2012, 47, 1613–1622. [Google Scholar] [CrossRef]
- Wakuda, M.; Yamauchi, Y.; Kanzaki, S.; Yasuda, Y. Effect of surface texturing on friction reduction. Wear 2003, 254, 356–363. [Google Scholar] [CrossRef]
- Rapoport, L.; Moshkovich, A.; Perfilyev, V.; Gedanken, A.; Etsion, I. Wear life of solid lubricant films on laser-textured surfaces. Wear 2009, 267, 1203–1207. [Google Scholar] [CrossRef]
- Etsion, I. State of the Art in Laser Surface Texturing. ASME J. Tribol. 2005, 127, 248–253. [Google Scholar] [CrossRef]
- Chen, W.-H.; Uribe, M.C.; Kwon, E.E.; Lin, K.Y.; Park, Y.K.; Ding, L.; Saw, L.H. Thermoelectric generation optimization using Taguchi, ANOVA and RSM. Renew. Sustain. Energy Rev. 2022, 169, 112917. [Google Scholar] [CrossRef]
- Isaic-Maniu, A.; Dragan, I.M.; Grigore, A.M.; Constantin, F. Taguchi risk and process capability. Risks 2023, 11, 178. [Google Scholar] [CrossRef]
- Unal, R.; Dean, E.B. Taguchi approach to design optimization for Quality and Cost: An Overview. In Proceedings of the 1991 Annual Conference of the International Society of Parametric Analysts, United States, 1 January 1991. [Google Scholar]
- Freddi, A.; Salmon, M. Introduction to the Taguchi method. In Design Principles and Methodologies; Springer: Cham, Switzerland, 2019; pp. 159–180. [Google Scholar]
- Bademlioglu, A.; Canbolat, A.S.; Yamankaradeniz, N.; Kaynakli, O. Investigation of parameters affecting Organic Rankine Cycle efficiency by using Taguchi and ANOVA methods. Appl. Therm. Eng. 2018, 145, 221–228. [Google Scholar] [CrossRef]
Disclaimer/Publisher’s Note: The statements, opinions and data contained in all publications are solely those of the individual author(s) and contributor(s) and not of MDPI and/or the editor(s). MDPI and/or the editor(s) disclaim responsibility for any injury to people or property resulting from any ideas, methods, instructions or products referred to in the content. |
© 2026 by the authors. Licensee MDPI, Basel, Switzerland. This article is an open access article distributed under the terms and conditions of the Creative Commons Attribution (CC BY) license.