Abstract
Low adhesion conditions can lead to significant wheel slip during braking for high-speed trains, resulting in severe wheel–rail rolling contact fatigue issues. The objective of this paper is to reproduce the dynamic wheel–rail adhesion characteristics of high-speed train braking with large creepage using the transient non-Hertzian ECF model under wet conditions and to clarify the underlying mechanisms. The Kik–Piotrowski (KP) model is used to solve the wheel–rail normal contact problem, and the corresponding non-elliptical adaptive method is adopted to modify the ECF model considering time-dependent effects for solving the tangential contact problem. The dynamic large creepage adhesion characteristics of high-speed trains under wet conditions during braking are analyzed. Furthermore, the effect of braking initial speeds and longitudinal creepage variation curves on dynamic adhesion characteristics is discussed. The results indicate that the large creepage adhesion characteristic curve of high-speed trains during braking exhibits a loading stable phase and an unloading stable phase, both of which effectively enhance the utilization of wheel–rail adhesion.
1. Introduction
Wheel–rail adhesion plays an important role on the traction and braking of high-speed trains. Experimental and numerical results show that wheel–rail adhesion drops dramatically under wet conditions. During the braking of high-speed trains on rainy days, insufficient adhesion can result in large creepage, which may prevent the trains from stopping promptly during emergency situations and increase the risk of accidents. Currently, traditional wheel–rail rolling contact theories and their corresponding extended models generally yield creep curves that reach a saturation value at small creepage and then remain constant or exhibit a decreasing trend, an indication that the curves only have one peak. However, experimental results have shown that after the first peak at small creepage, the adhesion coefficient increases again with the increase in creepage, leading to a second peak [1]. Moreover, when the wheel and rail experience large creepage during braking, the creep curve shows an unloading peak, which indicates the process of adhesion recovery. However, currently, such phenomena can only be obtained through experiments, and there is no theoretical model that can reproduce the aforementioned adhesion behaviors, making it impossible to theoretically explain the underlying mechanisms of these phenomena.
To investigate the dynamic adhesion characteristics of wheel–rail contact, the development of wheel–rail rolling contact models is fundamental. However, the traditional wheel–rail rolling contact models such as Shen’s theory [2], FASTSIM [3], and Polach model [4] were established considering quasi-static conditions and cannot consider transient conditions. Recently, Meierhofer et al. [5] proposed a novel wheel–rail rolling contact model called the extended creep force (ECF) model based on the concept of the third body layer (3BL). This model not only considers the effects of pressure and temperature on the elastoplastic behavior of the 3BL but also replicates the transient effects of creepage and normal force over time. Based on the ECF model, Meierhofer et al. [6] carried out a series of vehicle tests on a section of track surrounded by forest and compared the test results with the numerical results obtained by the ECF model. The results indicated a significant impact of leaves on wheel–rail adhesion, especially on sunny days. Evans [7] and Skipper et al. [8] first conducted experiments on conditions with different pollutants between the wheel and rail using a high-pressure torsion test, then parameterized the ECF model based on the obtained experimental results, and finally used the model to predict full-scale creep curves.
Under water lubrication conditions, many scholars have observed adhesion characteristics different from traditional theories through experiments, especially an increase in the adhesion coefficient with the increase in creepage at large creepages. In 1986, French scholar Boiteux obtained the adhesion characteristic curve of trains running at speeds of 80 to 240 km/h under wet rail conditions through track experiments [9]. It was found that after reaching the first peak value of the adhesion coefficient at small creepage, with the further increase in the relative sliding speed of the wheel, the adhesion coefficient exhibited a second peak. In recent years, Japanese scholar Tanimoto et al. [10] found that there is a recovery of the adhesion coefficient at large creepages when studying the influence of roughness and temperature on the adhesion at a speed of 100 km/h and creepages of 0 to 20%. Zhou et al. [11] investigated the adhesion characteristics of wheel–rail contact at large creepages under wet conditions through full-scale test rig experiments. The results indicated that the adhesion coefficient does not decrease after reaching the saturation point but continues to increase with the increase in creepage. Chang et al. [1] experimentally reported the adhesion recovery phenomenon under large creepage in water conditions, validating the generation mechanism of the second peak observed in this study. Voltr [12] and Bosso et al. [13] also observed the phenomenon of adhesion recovery in their respective experiments.
To address the issue of the adhesion coefficient increasing again at large creepages under water lubrication conditions, current researchers are mainly confined to experimental studies and empirical theoretical explanations. Krettek [14] believes that the main reason for this phenomenon is the generation of frictional heat from wheel–rail friction, causing the evaporation of the water medium, leading to an increase in the solid contact ratio, thereby causing the adhesion coefficient to rise. Dellmann and Viereck [15], on the other hand, believe that the reason lies in the surface wear of the wheel and rail. The contact conditions change due to wear, leading to an increase in the adhesion coefficient. Voltr [12] believes that the cleaning effect generated by energy dissipation in the wheel–rail contact area under low adhesion causes a change in the contact conditions, thereby increasing the adhesion level. The phenomenon of the further increase in the adhesion coefficient can be considered as the transition process from the adhesion characteristics under water lubrication conditions to the adhesion characteristics under dry conditions. While many scholars have proposed corresponding theoretical explanations, there are few numerical models that further analyze this phenomenon.
In recent years, some progress has been made in the numerical modeling of wheel–rail rolling contact. Jin et al. [16] systematically compiled the research progress on high-speed railway wheel–rail relationships, summarizing not only the achieved technological breakthroughs and practical accomplishments but also outlining critical future research directions in this field. Wu et al. [17,18] have made breakthrough progress in developing temperature models and transient wheel–rail adhesion models successfully and provided crucial theoretical foundations for constructing the temperature-dependent dynamic adhesion model in this work. Huang et al. [19] established a numerical framework combining simplified EHL with the ECF model to predict adhesion under wet conditions, examining speed-dependent adhesion–slip behavior. Wu et al. [20] established a novel non-Hertzian adhesion model that accounts for surface roughness to address the need for precise characterization of wheel–rail adhesion under wet conditions for high-speed trains. Wang et al. [21] proposed a non-Hertzian dynamic adhesion model combining mixed lubrication and ECF formulations to study adhesion on wet curved tracks. Wang et al. [22] proposed a modified semi-Hertzian contact model to more accurately analyze the light rail transit wheel wear problem when the wheelset experiences a large lateral displacement and yaw angle.
In summary, existing wet-state non-Hertzian adhesion models fail to fully account for the dynamic temporal variations in factors such as creepage and temperature in the ECF model and thus cannot simulate the full loading–unloading cycle evolution of the adhesion coefficient during train braking. To bridge this research gap, this paper modifies the time-dependent ECF model using non-Hertzian contact theory, establishing a numerical dynamic adhesion model for high-speed trains under large creepage braking conditions with water lubrication. The dynamic large creepage adhesion characteristics during high-speed train braking are analyzed, and the effects of initial braking speed and longitudinal creepage variation curves on the dynamic adhesion characteristics are further discussed.
2. Numerical Model
The longitudinal creepage varies with time during the braking of high-speed trains. Traditional wheel–rail rolling contact theories, which focus on quasi-static conditions, fail to reproduce the dynamic evolution of the adhesion coefficient over time. The ECF model developed by Meierhofer et al. [5] can account for time-dependent effects, specifically variations in operational parameters over time such as speed and creepage. Therefore, the ECF model is employed in this paper to simulate large creepage adhesion during the braking of high-speed trains. Furthermore, to accurately reflect the real wheel–rail contact, it is essential to extend it to non-Hertzian contact conditions.
2.1. The Normal Contact Model
The normal contact parameters used in the ECF model are derived from Hertzian contact theory and cannot precisely represent the real wheel–rail contact. Therefore, employing non-Hertzian contact theory becomes essential for accurately addressing the normal contact problem. In this paper, the KP method [23] is used to determine the non-Hertzian contact pressure and contact area. It calculates the size of the non-Hertzian contact area using the virtual penetration method, as shown in Figure 1. The core principle of the virtual penetration method is to determine the actual contact area and pressure distribution under non-Hertzian conditions by defining a virtual penetration depth between the wheel and rail, based on geometric and elastic deformation characteristics. The expression for the boundary of the contact area in the y direction is as follows:
where ε0 = 0.55 in this paper and δ is the penetration.
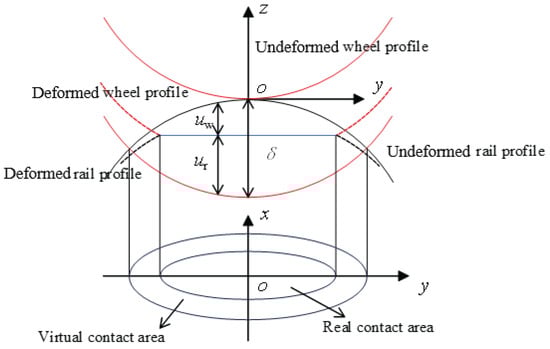
Figure 1.
Schematic diagram of the virtual penetration method.
The coordinates of the leading and trailing edges of the contact area in the x direction are calculated by the following equation:
where R is the radius of the wheel at the contact point.
When the actual contact area is elliptical, the shape of the contact area determined by Equations (1) and (2) deviates from that of the ellipse. Therefore, it is necessary to adjust the shape of the contact area, as detailed in reference [24].
The normal pressure distribution within the contact area in the KP method follows the following equation:
where p0 is the maximum normal pressure and its expression is as follows:
where N is calculated by the following equation:
where υ is the Poisson’s ratio.
2.2. The Tangential Contact Model
As a train operates, a third body layer (3BL) forms between the wheel and rail, consisting of solid particles, asperities, microcracks, and the surface layers of the wheel and rail. As shown in Figure 2, the 3BL is evidently an inhomogeneous and heterogeneous material. However, since the thickness of the 3BL is significantly smaller at the macro scale compared to the dimensions of the wheel and rail, it can be treated as a homogeneous and isotropic material with negligible variations in tangential stress and temperature along the thickness of the 3BL. Meierhofer [24] developed a wheel–rail rolling contact model called the ECF model based on the concept of the 3BL, considering the effects of pressure and temperature on the elastoplastic behavior of the 3BL. Their studies have verified that the homogeneous isotropic assumption of the 3BL, while simplifying the model, can still capture its core elastoplastic and temperature-dependent characteristics. This assumption does not alter the qualitative trend of adhesion behavior, only leading to minor quantitative differences in the adhesion coefficient. As depicted in Figure 3, elastic deformation of the 3BL occurs when the tangential stress is less than the first critical shear stress τc1. The 3BL deforms plastically when the tangential stress exceeds τc1 but is less than the second critical shear stress τc2. The material parameters τc1 and τc2 are expressed as follows [16]:
where
,
,
,
,
, and
are constants, which are obtained by experimental tests [24]; T is the temperature of the 3BL; and T0 is the initial temperature.
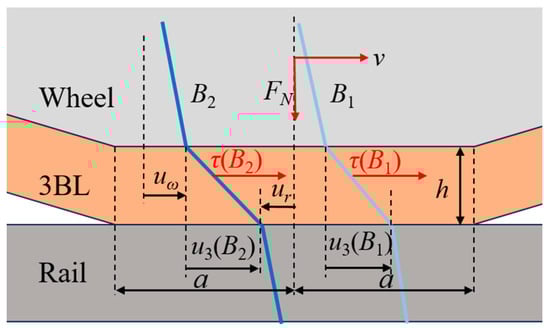
Figure 2.
Model diagram of the 3BL.
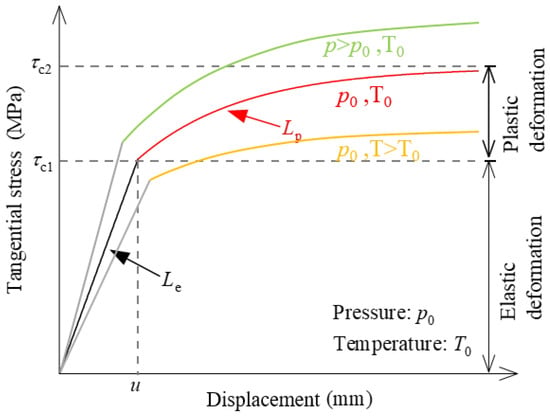
Figure 3.
The elastoplastic behavior of the 3BL.
The expressions for the inverted elastic stiffness Le and the plastic factor Lp in Figure 3 are as follows [24]:
where
,
,
,
,
, and
are constants, which are also obtained by experimental tests [24].
According to reference [25], it can be assumed that the 3BL consists of numerous individual bristles, and the normal stress, tangential stress, and temperature remain constant along each bristle, as shown in Figure 4. When a bristle moves from the leading edge of the contact area at time t = t0 to the trailing edge at time t = tn, the normal stress, tangential stress, and temperature will change with time. Simultaneously, with an increase in displacement, the bristle gradually changes from elastic deformation to plastic deformation. The total displacement of each bristle is composed of three parts: the displacement of the wheel uw, the displacement of the rail ur, and the displacement of the 3BL u3. The expression for the total displacement at a given time t is as follows:
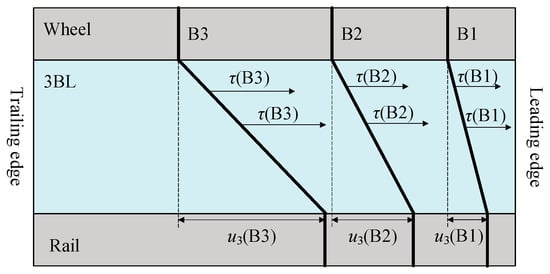
Figure 4.
Schematic diagram of 3BL model consisting of individual brushes (B1, B2, and B3).
To calculate the total displacement of a bristle, it is assumed that the coordinate system is fixed on the wheel. Derivation based on the kinematic equation of the bristle yields the following expression:
where vx and vy are the velocities of the wheel in the x and y directions, respectively. The detailed derivation process can be found in reference [24].
As mentioned above, the bristle enters the contact area at time t = t0 and leaves the contact area at time t = tn. To solve the integral in Equation (9), the time interval from t0 to tn is discretized using the following equation:
where Δt = (tn − t0)/n.
It is assumed that the creepage and the velocity of the wheel remain constant over the time interval ti−1 < t ≤ ti, i.e., ξx(t) = ξx(ti), ξy(t) = ξy(ti), ξs(t) = ξs(ti), vx(t) = vx(ti), and vy(t) = vy(ti). By solving Equation (9), the expression for the total displacement of the bristle is as follows [24]:
As shown in Figure 3, elastic deformation of the 3BL occurs when τ ≤ τc1. In this case, the expression for the tangential stress is as follows:
To describe the elastic behavior of the wheel and rail, Kalker’s flexibility coefficients are substituted into Equation (11) and combined with Equation (12) to obtain the tangential stress at elastic deformation and its expression is as follows:
When τc1 < τ < τc2, plastic deformation occurs. In this case, the displacements of the wheel and rail are very small relative to the displacement of the 3BL and can be neglected, i.e., u(t) ≈ u3(t). To calculate the tangential stress at plastic deformation, the Voce material hardening law [26] is used, which is expressed as follows:
where Δu = τc1Le. According to the exponential nature of the expression, the tangential stress will not be greater than τc2.
After obtaining the tangential stress, it is utilized for temperature calculation. Given that the 3BL is primarily composed of iron and its oxides with a negligible thickness compared to the dimensions of the wheel and rail, it is assumed that the temperature remains constant along each bristle. To compute the temperature of the 3BL, it is necessary to first obtain the frictional power density at a given time t, which is expressed as follows:
where 0 ≤ kq ≤ 1 is the dissipation coefficient, which can be taken as kq ≈ 1 according to reference [27], and ue is the elastic displacement. The exact calculation procedure can be found in reference [24].
Figure 5 illustrates the temperature calculation. With the temperature remaining constant along the direction of each bristle, it can be assumed that the temperature on the surfaces of the wheel and rail are equal. However, considering the disparities in velocity and material between the wheel and rail, it is not appropriate to assume that the frictional power density flows uniformly to both the wheel and rail [28]. Instead, the frictional power densities flowing to the wheel qw(t) and to the rail qr(t) need to be calculated using the following equation:
where α is the heat partitioning factor and its expression is as follows:
where
; λw(r) is the thermal conductivity of the wheel and rail; κw(r) is the thermal diffusivity of the wheel and rail; vw is the circumferential velocity of the wheel; and v0 is the vehicle velocity.
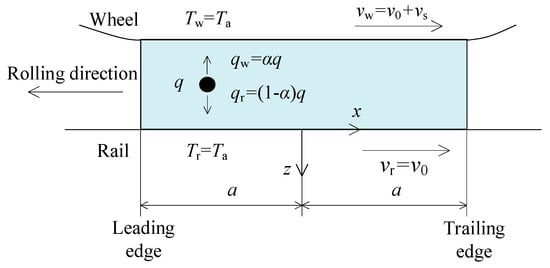
Figure 5.
Schematic diagram of temperature calculation.
During the normal operation of high-speed trains, the Péclet number always exceeds 10. As a result, heat transfer occurs solely in the direction perpendicular to the contact area, disregarding longitudinal and transverse heat transfer [28]. The temperature at a given time t is obtained by the following equation [28]:
To solve the integral in Equation (18), the same method employed to solve the integral in Equation (9) is utilized, assuming that the frictional power density remains constant over the time interval ti−1 < t ≤ ti, i.e., qw(t) = qw(ti). After solving the integral, the following expression can be obtained:
Once the temperature calculation is completed, the resulting temperature is used to correct τc1, τc2, Le, and Lp according to Equations (6) and (7). Subsequently, the tangential stress is recalculated. Repeat the aforementioned process until the temperature error is satisfied to obtain the final distribution of tangential stress. Ultimately, the creep force and moment are derived by integrating the tangential stress across the contact area.
The ECF model is proposed for elliptical contact areas, and to apply it to non-Hertzian contact areas, it needs to be modified using non-elliptical adaptation methods. Common non-elliptical adaptation methods include the KP, Linder, Stripes, and Alonso equivalent ellipse methods [29]. In this paper, the KP equivalent ellipse method, which is compatible with the KP method, is employed, as shown in Figure 6. The red dashed line in the figure represents the equivalent ellipse, with its semi-axis lengths ae and be satisfying the following equation:
where L and W are the length and width of the non-Hertzian contact area, respectively.
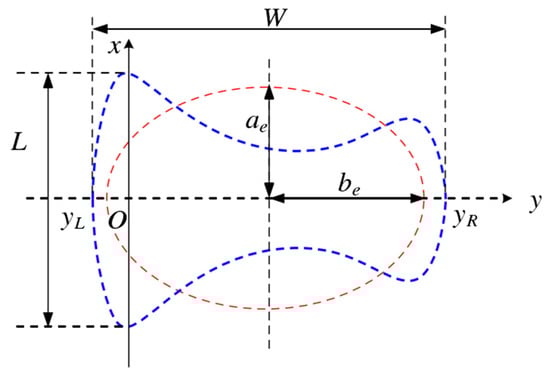
Figure 6.
The KP equivalent ellipse method.
Furthermore, based on the equivalent ellipse, it is necessary to use linear theory to modify Kalker’s flexibility coefficients:
where Rc is the corrected radius; Ac is the contact area; and c11, c22, and c23 are the slip coefficients determined based on the equivalent ellipse.
3. Results and Discussions
Based on the wheel–rail rolling contact model established earlier, this section analyzes the large creepage adhesion characteristics during the braking of high-speed trains under wet conditions. To simulate the train braking process, this section adopts the traditional train emergency braking deceleration curve, depicted in Figure 7a. The initial braking speed of the train is set at 300 km/h with a deceleration of 0.75 m/s2. Referring to the paper by Chang et al. [1], assuming the train starts braking at time t = 0 s and stops braking at time t = 10 s, the corresponding speed variation curve is shown in Figure 7b. It should be noted that the braking time does not have a significant impact on the trend of the adhesion curve. The axle weight of the train is taken to be 14 t and the ambient temperature is taken to be 25 °C. Since the relative lateral displacement between the wheel and rail is very small during straight-line travel and can be neglected, Δy is taken as 0 mm. The expression for the variation in the longitudinal creepage with time during braking is as follows:
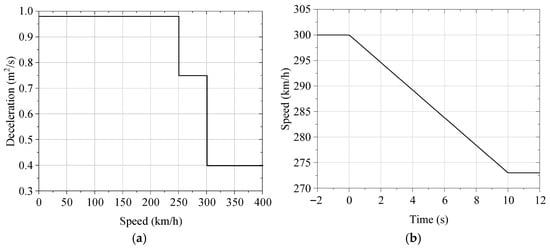
Figure 7.
Train deceleration and speed curves during the emergency braking process: (a) train deceleration curve; (b) train speed curve.
3.1. Analysis of Adhesion Characteristics
Figure 8 presents the large creepage adhesion characteristics of a train during braking at an initial speed of 300 km/h. In Figure 8a, the braking load is applied (loading) at time t = 0 s and released (unloading) at time t = 5 s. The longitudinal creepage increases from 0% to 30%, during which the adhesion coefficient first increases linearly to the first peak (point A), reaching approximately 0.04. At this point, the longitudinal creepage is around 0.6%. Subsequently, the adhesion coefficient slightly decreases to point B, with a value of approximately 0.035, while the longitudinal creepage is about 2%. The adhesion coefficient then rises again to the second peak (point C) with a value of about 0.07, while the longitudinal creepage is about 4%. Finally, the adhesion coefficient gradually decreases to the unloading point (point D), where the adhesion coefficient is about 0.03 and the longitudinal creepage is 30%. After the train is unloaded, the longitudinal creepage decreases from 30% to 0%. At this point, the adhesion coefficient first rises to the third peak (point E) and then rapidly decreases to 0, which coincides with the initial phase of linear increase in the adhesion coefficient.
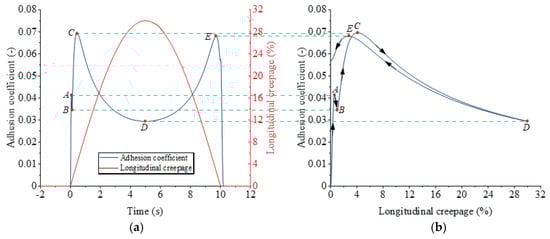
Figure 8.
The large creepage adhesion characteristics of a train during braking at an initial speed of 300 km/h: (a) the longitudinal creepage and adhesion coefficient change curves; (b) the adhesion characteristic curve.
It is worth noting that the adhesion coefficient does not decrease to 0 when the longitudinal creepage is 0%. This is because, at this point, only some of the bristles in the wheel–rail contact area experience a longitudinal creepage of 0%, while the rest of the bristles still experience a longitudinal creepage greater than 0%.
The adhesion characteristic curve in Figure 8b also shows distinctive features, where the classification of “stable” and “unstable” phases is based on the slope of the adhesion coefficient–creepage curve from the perspective of high-speed train braking operation and anti-skid control (not a formal dynamic stability analysis). When the longitudinal creepage increases from 0% to around 0.6%, the adhesion coefficient linearly increases to point A. As the longitudinal creepage increases from 0.6% to around 2%, the adhesion coefficient slightly decreases, showing a clear negative slope characteristic, which belongs to the unstable loading phase. As the adhesion characteristic curve increases from point B to point C, the adhesion coefficient exhibits a positive slope characteristic, indicating the stable loading phase. Subsequently, the adhesion coefficient decreases from point C to point D, and the curve similarly shows a negative slope characteristic. When the longitudinal creepage decreases from 30%, the adhesion characteristic curve increases from point D to point E, belonging to the stable unloading phase. In summary, during the train braking process, segments AB and CD are inherent transient unstable phases in the adhesion evolution, which cannot be physically circumvented. Although these unstable phases are inevitable during transient braking, they should not be maintained as steady operating points in anti-skid control. The core reason lies in the trend exhibited by the adhesion–creepage curve in these phases, which may trigger uncontrollable wheel slip and compromise braking stability. In contrast, segment BC (stable loading phase) and segment DE (stable unloading phase) allow for effective adjustment of the adhesion coefficient through optimization of the creepage rate. These stable phases are suitable as steady operating points for anti-skid control, contributing to enhanced utilization of wheel–rail adhesion while ensuring braking stability.
To explore the reasons for the changes in the large creepage adhesion characteristic curve during the braking of high-speed trains, Figure 9 gives the tangential stress distributions at points A, B, C, D, and E in Figure 8, where the upper side is the leading edge of the contact area and the lower side is the trailing edge. From the figures, it can be observed that the tangential stress distributions exhibit clear non-Hertzian characteristics. At points A and B where the creepages are relatively small, there is partial elastic deformation in the contact area, while at the other three points, plastic deformation occurs throughout the contact area. At point D with a creepage of 30%, the maximum tangential stress occurs at the leading edge, while at the other four points, the maximum tangential stress occurs at the trailing edge. Furthermore, by comparing the maximum tangential stresses in the contact area at the five points, it can be observed that the maximum tangential stresses at points C and D are larger than those at the other three points. This verifies the phenomenon observed in Figure 8b, where points C and D represent the two peaks of the adhesion characteristic curve, corresponding to the stable loading and unloading phases, respectively, favorable for utilizing wheel–rail adhesion. Since the ECF model used in this paper considers the effects of both temperature and pressure, the temperature distributions at the five points have a significant impact on the tangential stress distributions.
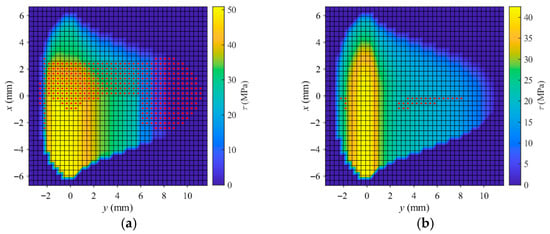
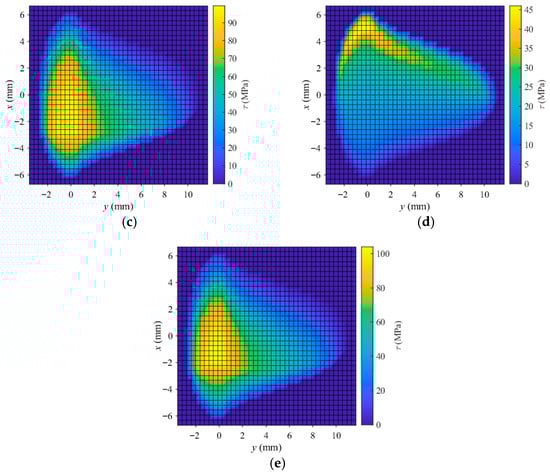
Figure 9.
Tangential stress distributions at different points (solid red points in the contact area indicate elastic deformation and the rest indicate plastic deformation): (a) point A; (b) point B; (c) point C; (d) point D; (e) point E.
Figure 10 shows the temperature distributions within the contact area at the five points mentioned above. It can be noticed from the figures that the temperature distributions also exhibit clear non-Hertzian characteristics. At point D, the maximum temperature reaches 227.6 °C, which is the highest among the five points, while at points C and E, the maximum temperatures are higher than those at points A and B. Table 1 summarizes the maximum tangential stress, maximum temperature, longitudinal creepage, and adhesion coefficient at these five points. Comparative analysis reveals that when the creepage exceeds 4%, the larger the creepage, the higher the temperature in the contact area, with the maximum temperature occurring at the trailing edge. During the stable loading phase, an increase in temperature leads to an increase in tangential stress; during the stable unloading phase, a decrease in temperature also results in an increase in tangential stress, whereas in the unstable phase, an increase in temperature causes a decrease in tangential stress. To explain this phenomenon, based on the elastoplastic theory of the third body layer (3BL) and frictional thermodynamics analysis, it can be inferred that during the unstable loading phase AB, the temperature in the contact area rises from 26.02 °C to 104.3 °C. The material softens due to thermal effects, leading to a decrease in tangential stress and adhesion coefficient. In the stable loading phase BC, the temperature gradually decreases from 104.3 °C to 28.1 °C. As the temperature drops, the material recovers its elastoplastic properties, and the tangential stress increases from 42.7 MPa to 98.2 MPa, thereby enhancing its critical shear stress. During the unstable unloading phase CD, the temperature rises from 28.1 °C to 227.6 °C. The excessive temperature increase induces slight oxidation of the contact surface and softening of the 3BL, reducing its shear strength and causing the tangential stress to decrease from 98.2 MPa to 45.4 MPa. In the stable unloading phase DE, the temperature gradually decreases from 227.6 °C to 119.0 °C. The thermal softening effect weakens relatively, and the shear strength of the 3BL partially recovers, resulting in an increase in tangential stress. The adhesion coefficient rises from 0.03 to 0.068, forming a negative correlation between temperature and adhesion coefficient.
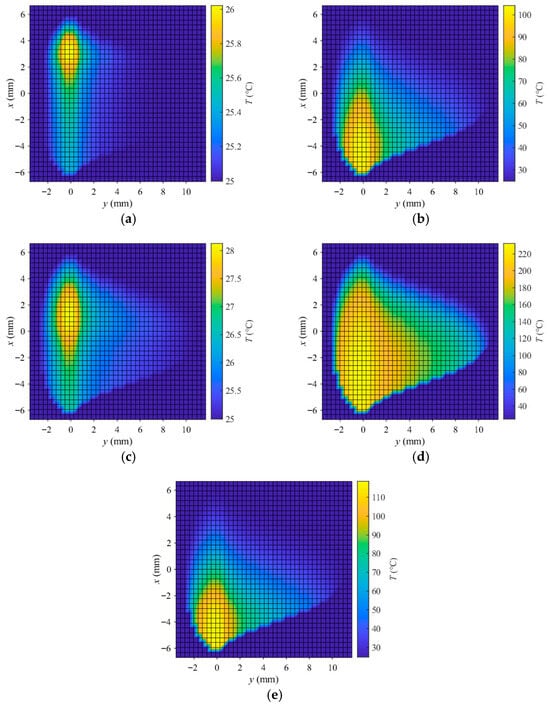
Figure 10.
Temperature distributions at different points: (a) point A; (b) point B; (c) point C; (d) point D; (e) point E.

Table 1.
Typical parameters of different points.
Thus, it can be concluded that during braking under large creepage conditions, temperature fluctuations influence the tangential stress distribution, thereby leading to changes in the adhesion coefficient. Based on the above analysis and tribological mechanism interpretation, temperature is considered the primary factor driving the variations in tangential stress and adhesion coefficient. The different correlation trends between temperature and adhesion coefficient across various phases are essentially determined by temperature-dependent state transitions of the third body layer (3BL) and their corresponding tribological mechanisms. This further validates the core conclusion that temperature governs the dynamic adhesion characteristics under wet and large creepage conditions.
To further illustrate the influence of temperature on the large creepage adhesion characteristics during the braking of high-speed trains, this paper only considers the effect of pressure on the elastoplastic behavior of the material in the ECF model and the adhesion characteristic curve obtained is shown in Figure 11. From the figure, it can be observed that the adhesion coefficient first increases linearly to point A, with a longitudinal creepage of about 0.6% at this stage. Then the adhesion coefficient slightly rises in the segment AB, with a longitudinal creepage of around 2% at point B. Subsequently, the adhesion coefficient gradually increases with the increasing longitudinal creepage up to point C. After unloading, the adhesion coefficient decreases as the decreasing longitudinal creepage decreases. Therefore, compared with Figure 8b, the lack of consideration of the effect of temperature results in the adhesion characteristic curve not exhibiting negative slope characteristics in the segments AB and BC, leading to a continuous increase in the adhesion coefficient, which is inconsistent with reality.
Figure 11.
Adhesion curve without considering the effect of temperature.
In conclusion, when large creepage occurs during the braking of high-speed trains under wet conditions, temperature is the primary factor causing changes in the adhesion characteristic curve, especially with larger creepage. Temperature variations lead to changes in the tangential stress distribution in the contact area, thereby altering the adhesion coefficient.
3.2. Effects of Different Initial Braking Speeds and Longitudinal Creepage Change Curves
3.2.1. Effect of Different Initial Braking Speeds
Figure 12 shows the adhesion characteristic curves under different initial braking speeds. The speeds chosen in Figure 12 represent the typical operational speed range of high-speed trains. Among these, 300 km/h serves as the reference baseline, as it is the most common operating speed for high-speed EMUs in practice; 200 km/h represents the lower limit of the high-speed range, while 400 km/h corresponds to the current upper limit of high-speed train design speeds. This selection covers the key speed intervals relevant to engineering applications and enables a systematic investigation of how adhesion characteristics vary with speed, which is crucial for developing anti-slip control strategies adaptable to different operational scenarios. Furthermore, in the simulations of different initial braking speeds, all other parameters were kept strictly unchanged to isolate the independent effect of speed. From the figure, it can be observed that the initial braking speed primarily affects the magnitude of the adhesion coefficient, while the changing trend of the adhesion characteristic curves is essentially the same at different initial speeds. The peak values of the curves in the two stable phases decrease with increasing speed. Furthermore, the degree of variation in the first peak value of the curve is smaller than that of the second and third peak values, indicating that the initial braking speed has a significant impact on the effective utilization of wheel–rail adhesion. Therefore, trains should avoid braking at large initial speeds under wet conditions.
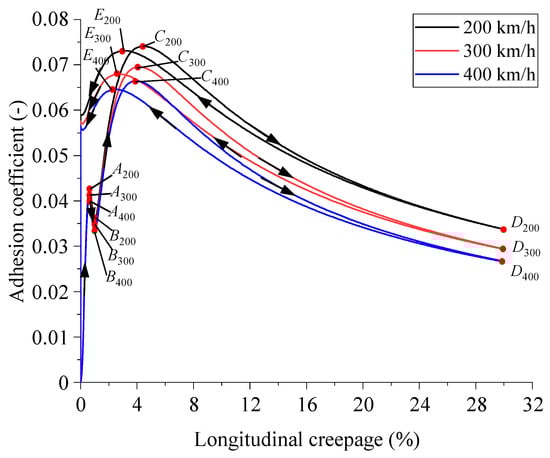
Figure 12.
Effect of different initial braking speeds on adhesion characteristics.
3.2.2. Effect of Different Longitudinal Creepage Change Curves
The longitudinal creepage change curve over time in Section 3.1 is determined by a trigonometric function. To study the effect of different longitudinal creepage change curves on the braking adhesion characteristics of the train, the longitudinal creepage in this section is determined by the following formula, and its change curve over time is shown in Figure 13a.
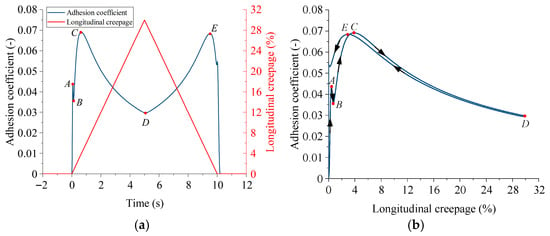
Figure 13.
Braking adhesion characteristics of a train at an initial speed of 300 km/h (the maximum longitudinal creepage is 30%): (a) the longitudinal creepage and adhesion coefficient change curves; (b) the adhesion characteristic curve.
Figure 13b shows the adhesion characteristic curve of the longitudinal creepage changing according to Equation (23). It can be observed from the figure that the overall trend of the curve is consistent with Figure 8b: segments AB and CD are inherent transient unstable phases, which should not be maintained as steady operating points in anti-skid control; segments BC (stable loading phase) and DE (stable unloading phase) are suitable for steady control application, as they help to enhance wheel–rail adhesion utilization.
High-speed trains are usually equipped with anti-skid controllers, whose basic principle is to take immediate measures to restore the adhesion coefficient as soon as a decrease is detected due to external factors or excessive braking force. This adhesion restoration should aim for the optimal adhesion allowed by the condition, ensuring that the adhesion recovery maximizes the adhesion utilization. The premise for devising anti-skid control strategies is to understand the adhesion characteristics during train braking. Therefore, this section also analyzes the adhesion characteristics under two longitudinal creepage change curves, as shown in Figure 14 and Figure 15.
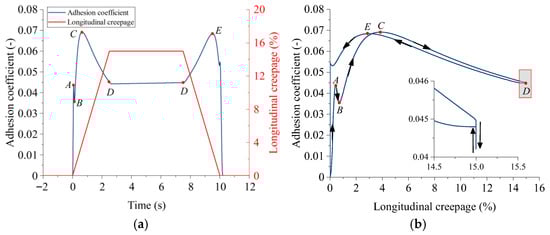
Figure 14.
Braking adhesion characteristics of a train at an initial speed of 300 km/h (the maximum longitudinal creepage is 15%): (a) the longitudinal creepage and adhesion coefficient change curves; (b) the adhesion characteristic curve.
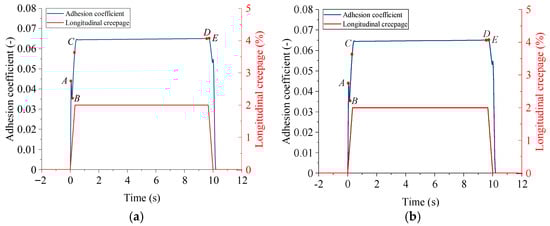
Figure 15.
Braking adhesion characteristics of a train at an initial speed of 300 km/h (the maximum longitudinal creepage is 2%): (a) the longitudinal creepage and adhesion coefficient change curves; (b) the adhesion characteristic curve.
In Figure 14, the longitudinal creepage in Figure 13a is controlled to be no more than 15%. At this point, the variation trend of the wheel–rail adhesion characteristic curve is basically the same as shown in Figure 13b. The only difference is that at point D, the adhesion coefficient first decreases to around 0.041, then increases to about 0.044, and then enters the unloading stable phase. In Figure 15, the longitudinal creepage in Figure 13a does not exceed 2%. At this point, the adhesion characteristic curve first increases approximately linearly up to point A and then slightly decreases to point B, exhibiting negative friction characteristics. Subsequently, it rises to point C, representing the stable loading phase. Following this, the curve rapidly increases from point C to point D, showing a phenomenon of adhesion increasing again. Finally, the adhesion characteristic curve gradually rises to point E and then decreases. Obviously, the adhesion coefficients at segments BC, CD, and DE can effectively enhance the utilization of wheel–rail adhesion. Therefore, the above analysis can provide a certain theoretical reference for the formulation of anti-skid control strategies for high-speed trains during the braking process.
Experiments revealed that the adhesion coefficient exhibits significant non-monotonic variations within the large creepage range, specifically showing recovery growth (the second peak) after the initial peak and adhesion rebound during the unloading process. The temperature in the contact area was identified as the core factor driving these dynamic characteristics, as its accumulation and dissipation directly influence the elastoplastic state and interfacial shear strength of the third body layer (3BL). It is noteworthy that although the core conclusions of this study are primarily based on the simulated conditions and parameters specified in the manuscript, the overall trend of the adhesion curve does not exhibit significant changes with varying operating conditions. This is because the key parameters of the ECF model (e.g., τc1, τc2, Le, and Lp) are calibrated based on experimental data from Meierhofer [24], which are applicable to typical wheel/rail contact scenarios. If these parameters are adjusted for specific materials or operating conditions, the quantitative results (e.g., adhesion coefficient peak values, temperature distribution) may change, but the model’s ability to reproduce dynamic adhesion phenomena (e.g., second peak, unloading peak) stems from its inherent integration of transient time effects and non-Hertzian contact, which are not fundamentally altered by specific parameter calibrations. Compared to real-world scenarios, the simulated conditions in this study are simplified, and factors such as wheel/rail wear, mixed contaminants (e.g., oil, leaves), and lateral creepage are not considered. Moreover, the model validation is limited to qualitative consistency with existing experimental phenomena [1,9,10], and quantitative validation using full-scale test data is lacking. Therefore, this paper primarily focuses on a preliminary theoretical investigation of the adhesion process during large-creepage braking of high-speed trains. Future research should expand the range of parameters, validate the model with experimental data, and incorporate factors such as wheel/rail wear and mixed contaminants to enhance the model’s applicability. Additionally, further investigation into the coupled effects of lateral and longitudinal creepage under wet conditions would improve the comprehensiveness of the model.
4. Conclusions
This paper first uses the KP method to solve the normal contact problem of high-speed trains during the braking process with large creepages and adopts the corresponding non-elliptical adaptive method to modify the ECF model considering time-dependent effects for solving the tangential contact problem. Then, using this model, the large creepage during the braking of high-speed trains under wet conditions is simulated and analyzed. Finally, this paper analyzes the large creepage adhesion characteristic curve of high-speed trains during the braking process and investigates the effect of different initial braking speeds and longitudinal creepage change curves on adhesion characteristics. The conclusions obtained are as follows:
- (1)
- The adhesion characteristic curve of high-speed trains under wet, large-creepage braking conditions (longitudinal creepage 0–30%) exhibits two stable phases: the loading stable phase and the unloading stable phase, both of which effectively enhance wheel–rail adhesion utilization. Temperature is the primary influencing factor driving variations in the adhesion curve, highlighting that the ECF model incorporating temperature effects better aligns with real-world scenarios.
- (2)
- Through the application of non-Hertzian contact theory, the distributions of tangential stress and temperature display distinct non-Hertzian characteristics. Furthermore, the maximum tangential stress at the peak points of the stable phases exceeds that at other locations, corresponding to the maximum adhesion coefficient.
- (3)
- Under wet conditions, the adhesion coefficient of high-speed trains decreases as the initial braking speed increases. Moreover, by controlling the reduction in maximum longitudinal creepage, adhesion recovery can be induced in the adhesion curve, further improving wheel–rail adhesion utilization.
- (4)
- Based on the adhesion characteristics in stable phases (loading stable phase BC and unloading stable phase DE) and the correlation between adhesion coefficient and temperature, theoretical engineering guidance can be provided for specific braking pressure adjustment thresholds and control logic of anti-skid controllers.
Author Contributions
Conceptualization, P.S. and B.W.; methodology, J.H.; software, J.H.; validation, P.S., B.W. and Z.W.; formal analysis, Z.W.; investigation, J.H.; resources, B.W.; data curation, P.S.; writing—original draft preparation, J.H.; writing—review and editing, B.W.; visualization, P.S.; supervision, B.W.; project administration, P.S. and J.Z.; funding acquisition, B.W. and J.Z. All authors have read and agreed to the published version of the manuscript.
Funding
The present work was supported by the National Nature Science Foundation of China (Nos. 52372391 and U21A20167); the National Key Research and Development Program of China (2024YFB4303301); and the Research Fund of CRRC Corporation Limited (2022CYY006).
Data Availability Statement
No new data were created or analyzed in this study. Data sharing is not applicable to this article.
Conflicts of Interest
The authors declare no conflicts of interest.
References
- Chang, C.; Chen, B.; Cai, Y.; Wang, J. Experimental investigation of high-speed wheel-rail adhesion characteristics under large creepage and water conditions. Wear 2024, 540, 205254. [Google Scholar] [CrossRef]
- Shen, Z.Y.; Hedrick, J.K.; Elkins, J.A. A comparison of alternative creep force models for rail vehicle dynamic analysis. Veh. Syst. Dyn. 1983, 12, 79–83. [Google Scholar] [CrossRef]
- Kalker, J.J. A fast algorithm for the simplified theory of rolling contact. Veh. Syst. Dyn. 1982, 11, 1–13. [Google Scholar] [CrossRef]
- Spiryagin, M.; Polach, O.; Cole, C. Creep force modelling for rail traction vehicles based on the Fastsim algorithm. Veh. Syst. Dyn. 2013, 51, 1765–1783. [Google Scholar] [CrossRef]
- Meierhofer, A.; Müller, G.; Six, K.; Dietmaier, P. A wheel-rail creep force model considering normal stress and temperature dependent plasticity effects. In The Dynamics of Vehicles on Roads and Tracks, Proceedings of the 24th Symposium of the International Association for Vehicle System Dynamics (IAVSD 2015), Graz, Austria, 15–19 August 2025; CRC Press: Boca Raton, FL, USA, 2015; pp. 1–10. [Google Scholar]
- Meierhofer, A.; Trummer, G.; Bernsteiner, C.; Six, K. Vehicle tests showing how the weather in autumn influences the wheel–rail traction characteristics. Proc. Inst. Mech. Eng. Part F J. Rail Rapid Transit 2020, 234, 426–435. [Google Scholar] [CrossRef]
- Evans, M.; Skipper, W.; Buckley-Johnstone, L.; Meierhofer, A.; Six, K.; Lewis, R. The development of a high pressure torsion test methodology for simulating wheel/rail contacts. Tribol. Int. 2021, 156, 106842. [Google Scholar] [CrossRef]
- Skipper, W.; Meierhofer, A.; Chalisey, A.; Six, K.; Lewis, R. Generation of sanded creep curves using the extended creep force model with high pressure torsion data. Wear 2024, 542–543, 205278. [Google Scholar] [CrossRef]
- Boiteux, M. Problème de L’Adhérence en Freinage. Rev. Générale Chemins Fer 1986, 105, 59–72. [Google Scholar]
- Tanimoto, H.; Chen, H. Influence of Surface Roughness and Temperature on Wheel/Rail Adhesion in Wet Conditions. Q. Rep. RTRI 2015, 56, 206–211. [Google Scholar] [CrossRef]
- Zhou, J.J.; Wu, M.L.; Chun, T.; Yuan, Z.W.; Chao, C. Experimental investigation on wheel–rail adhesion characteristics under water and large sliding conditions. Ind. Lubr. Tribol. 2020, 73, 366–372. [Google Scholar] [CrossRef]
- Voltr, P.; Lata, M. Transient wheel–rail adhesion characteristics under the cleaning effect of sliding. Veh. Syst. Dyn. 2015, 53, 605–618. [Google Scholar] [CrossRef]
- Bosso, N.; Gugliotta, A.; Magelli, M.; Oresta, I.F.; Zampieri, N. Study of wheel-rail adhesion during braking maneuvers. Procedia Struct. Integr. 2019, 24, 680–691. [Google Scholar] [CrossRef]
- Krettek, O. Zur Schlupfgesetzmasigkeit bei Bremsung mit gleitschutzüberwachten Scheibenbremsen. In Proceedings of the International Conference on Railway Bogies and Running Gears; Technical University of Budapest: Budapest, Hungary, 2007. [Google Scholar]
- Dellmann, T.; Viereck, U. Dynamisches Kraftschluss-Schlupfmodell zur Beschreibung von Bremsvorgängen. ZEVrail 2008, 132, 144–153. [Google Scholar]
- Jin, X. Research progress of high-speed wheel–rail relationship. Lubricants 2022, 10, 248. [Google Scholar] [CrossRef]
- Wu, B.; Wu, T.; Wen, Z.F.; Jin, X.S. Numerical analysis of high-speed wheel/rail adhesion under interfacial liquid contamination using an elastic-plastic asperity contact model. Proc. Inst. Mech. Eng. Part J-J. Eng. Tribol. 2017, 231, 63–74. [Google Scholar] [CrossRef]
- Wu, B.; Wu, T.; An, B.Y. Numerical investigation on the high-speed wheel/rail adhesion under the starved interfacial contaminations with surface roughness. Lubr. Sci. 2020, 32, 93–107. [Google Scholar] [CrossRef]
- Huang, J.Q.; Wu, B.; Xiao, G.W.; Shen, Q. Numerical investigation of wheel-rail adhesion using a simplified three-dimensional model considering surface roughness and temperature. Lubr. Sci. 2024, 36, 88–103. [Google Scholar] [CrossRef]
- Wu, B.; Huang, J.Q.; Su, X.L. A novel non-Hertzian wheel-rail adhesion model under wet conditions considering surface roughness. J. Cent. South Univ. 2025, 32, 4092–4104. [Google Scholar] [CrossRef]
- Wang, Z.Y.; Wu, B.; Huang, J.Q.; Ji, Y.J.; Li, D.K.; Wu, S. Dynamic wheel-rail adhesion characteristics on wet curved tracks considering surface roughness. Phys. Fluids 2025, 37, 022104. [Google Scholar] [CrossRef]
- Wang, Q.; Zhu, B.; Zhang, F.; Jiang, X.; Wang, J. Research on wheel wear of the light rail transit based on a modified semi-Hertzian contact model. Ind. Lubr. Tribol. 2023, 75, 211–220. [Google Scholar] [CrossRef]
- Piotrowski, J.; Kik, W. A simplified model of wheel/rail contact mechanics for non-Hertzian problems and its application in rail vehicle dynamic simulations. Veh. Syst. Dyn. 2008, 46, 27–48. [Google Scholar] [CrossRef]
- Meierhofer, A. A New Wheel-Rail Creep Force Model Based on Elasto-Plastic Third Body Layers. Ph.D. Thesis, Graz University of Technology, Graz, Austria, 2015. [Google Scholar]
- Goryacheva, I.; Sadeghi, F. Contact characteristics of a rolling/sliding cylinder and a viscoelastic layer bonded to an elastic substrate. Wear 1995, 184, 125–132. [Google Scholar] [CrossRef]
- Voce, E. The relationship between stress and strain for homogeneous deformation. J. Inst. Met. 1948, 74, 537–562. [Google Scholar]
- Tomberger, C.; Dietmaier, P.; Sextro, W.; Six, K. Friction in wheel–rail contact: A model comprising interfacial fluids, surface roughness and temperature. Wear 2011, 271, 2–12. [Google Scholar] [CrossRef]
- Ertz, M.; Knothe, K. A comparison of analytical and numerical methods for the calculation of temperatures in wheel/rail contact. Wear 2002, 253, 498–508. [Google Scholar] [CrossRef]
- Alonso, A.; Giménez, J.G. Tangential problem solution for non-elliptical contact areas with the FastSim algorithm. Veh. Syst. Dyn. 2007, 45, 341–357. [Google Scholar] [CrossRef]
Disclaimer/Publisher’s Note: The statements, opinions and data contained in all publications are solely those of the individual author(s) and contributor(s) and not of MDPI and/or the editor(s). MDPI and/or the editor(s) disclaim responsibility for any injury to people or property resulting from any ideas, methods, instructions or products referred to in the content. |
© 2026 by the authors. Licensee MDPI, Basel, Switzerland. This article is an open access article distributed under the terms and conditions of the Creative Commons Attribution (CC BY) license.