Abstract
The gap seal ring is a critical component in high-speed centrifugal pumps. The leakage rate and performance of the pump are sensitive to variation in seal ring parameters. This study investigates the influence of seal ring tooth profile on the leakage flow of pump chambers. Numerical simulation and experimental tests are used to analyze the impact of four different tooth-height labyrinth seal ring structures on the pressure pulsation characteristics of pump leakage chambers. It can be concluded that the use of labyrinth seal rings can significantly reduce the pressure pulsation and leakage rate of pump chambers. For the Case 2 structure with a tooth height of 0.18 mm, the pressure pulsation in the pump chamber can be reduced by a maximum of 22.5%, and the leakage rate can be reduced by 41.1%. For the Case 3 structure with a tooth height of 0.23 mm, the pressure pulsation in the pump chamber can be reduced by a maximum of 30.3%, and the leakage rate can be reduced by 40.6%. The use of labyrinth seal rings significantly reduces the pressure pulsation intensity of the impeller surfaces, which improves the force stability of the high-speed centrifugal pump impeller. This study is helpful in providing theoretical support for the design of labyrinth seal rings in high-speed centrifugal pumps.
1. Introduction
High-speed centrifugal pumps are widely used in fluid transmission and energy conversion systems across energy, aerospace, and other related fields [1,2]. As the core equipment of fluid transmission systems, the stability and efficiency of their operation are directly influenced by the dynamic characteristics of the internal flow field [3,4]. Research indicates that pressure pulsation represents a critical dynamic phenomenon during the operation of a high-speed centrifugal pump. It will intensify the noise and vibration of the equipment and reduce pump efficiency [5,6,7]. Therefore, controlling pressure pulsations is of significant importance.
As a key component for suppressing leakage and improving pump efficiency, the parameter design of the seal ring tooth profile not only affects the leakage rate but also influences the pressure pulsation of the internal flow field in centrifugal pumps [8,9]. The seal ring prevents the high-pressure side fluid of the impeller from flowing to the low-pressure side at the impeller inlet by forming a small throttling gap. In practical operation, a notable pressure differential occurs across the two sides of the seal ring, which inevitably leads to slight fluid leakage through the seal clearance and forms a leakage path. The flow regime within this leakage path is characterized by complexity and variability, interacting with the primary flow, thereby amplifying pressure pulsations within the pump. In recent years, scholars both domestically and internationally have conducted a series of studies on the flow characteristics within the seal ring. Zhao et al. [10] compared the front and back seal rings using the Reynolds-averaged Navier–Stokes equations and the RNG k-ε turbulence model, finding that the front seal ring has a significant impact on the performance of centrifugal pumps. Wang et al. [11] studied the arrangement of sealed teeth and found that the turbulence kinetic energy flow peaked near the gap and rapidly decreased in the chamber. Matros et al. [12] estimated the force generated in the seal components through a study of annular seal fluid–structure interaction to evaluate the total force acting on the impeller and assess the stability of the seal ring. DaqiqShirazi et al. [13] studied the effect of the seal ring gap and found that the volumetric efficiency drops significantly when the seal ring gap increases threefold. Chen et al. [14] analyzed centrifugal pump efficiency in terms of turbulence kinetic energy, vorticity, and radial force angle, concluding that a decrease in the seal ring gap reduces the turbulence kinetic energy and energy dissipation inside the impeller, thereby improving efficiency. Zhang et al. [15] studied the turbulence energy dissipation rate in the gap seal and found that the gap value, shape, and seal surface structure on the rotor significantly affect the leakage characteristics of the gap seal. Zhou et al. [16], based on the nonlinear Muszynska seal model, demonstrated that a decrease in the seal gap significantly suppresses rotor vibrations, and increasing the seal length enhances the fluid excitation force, reducing the amplitude. Dong et al. [17] analyzed the fluid flow distribution in the back chamber of the centrifugal pump, finding that fluid flow in the back chamber involves the core region and fluid leakage. The influence of leakage flow leads to a non-axisymmetric velocity distribution.
Meanwhile, some researchers are devoted to the pressure pulsations of centrifugal pumps. Cui et al. [18] used a vortex separation simulation method to study pressure pulsations in centrifugal pumps and concluded that the impeller outlet pressure pulsation is related to periodic vortex shedding. Zhang et al. [19] found that different peaks at the blade transfer frequency (fBPF) are strongly affected by rotor–stator interactions and are closely related to the position of the monitoring point. Zheng et al. [20] analyzed the presence of gap flow, which can lead to loss of high-energy fluid inside the centrifugal pump, alleviate pressure pulsation, and lead to degradation of external performance. The main frequency of pressure pulsation in the gap flow channel is mainly affected by the interaction between the impeller and volute. Liu et al. [21] analyzed the potential relationship between the change in the seal ring gap and the transient flow in the leakage chamber, thereby obtaining the pressure distribution in the anterior chamber of different seal ring gaps. Gao et al. [22] conducted a study on the performance of centrifugal pumps with varying seal ring gaps, finding that when the seal ring gap gradually increases, there exists a specific gap where the amplitude of pressure pulsation reaches a certain maximum value. Tang et al. [23] studied the effect of seal gap leakage on rotational occlusion velocity characteristics and pointed out that the leakage significantly changes the spectral characteristics of pressure pulsation. Lu et al. [24] determined the relationship between flow instability and pressure pulsation at the pump inlet and outlet, aiming to develop effective flow state detection methods. Zheng et al. [25] found that gap flow and mainstream collision lead to vortex formation at the impeller inlet, and gap flow significantly affects the pressure within the impeller. Chalghoum et al. [26] analyzed the effects of instantaneous pressure pulsation in centrifugal pumps and found that it aggravates vibration and leads to operational instability.
Although existing studies have confirmed that the seal ring gap has a significant influence on the leakage volume and pressure pulsation of the centrifugal pump, the seal ring profile has a limited effect on leakage flow, and the optimization mechanism of seal ring geometric parameters is still unclear. Especially in high-speed centrifugal pumps, there is a lack of systematic research on how tooth height affects the pressure pulsation by regulating the vortex structure of the leakage flow, the distribution of turbulence kinetic energy, and the interaction with the main flow. The research model pump presented in this paper aims to regulate the vortex structure and turbulence kinetic energy of the leakage flow through tooth height, thereby affecting pressure pulsation.
2. Physical Model
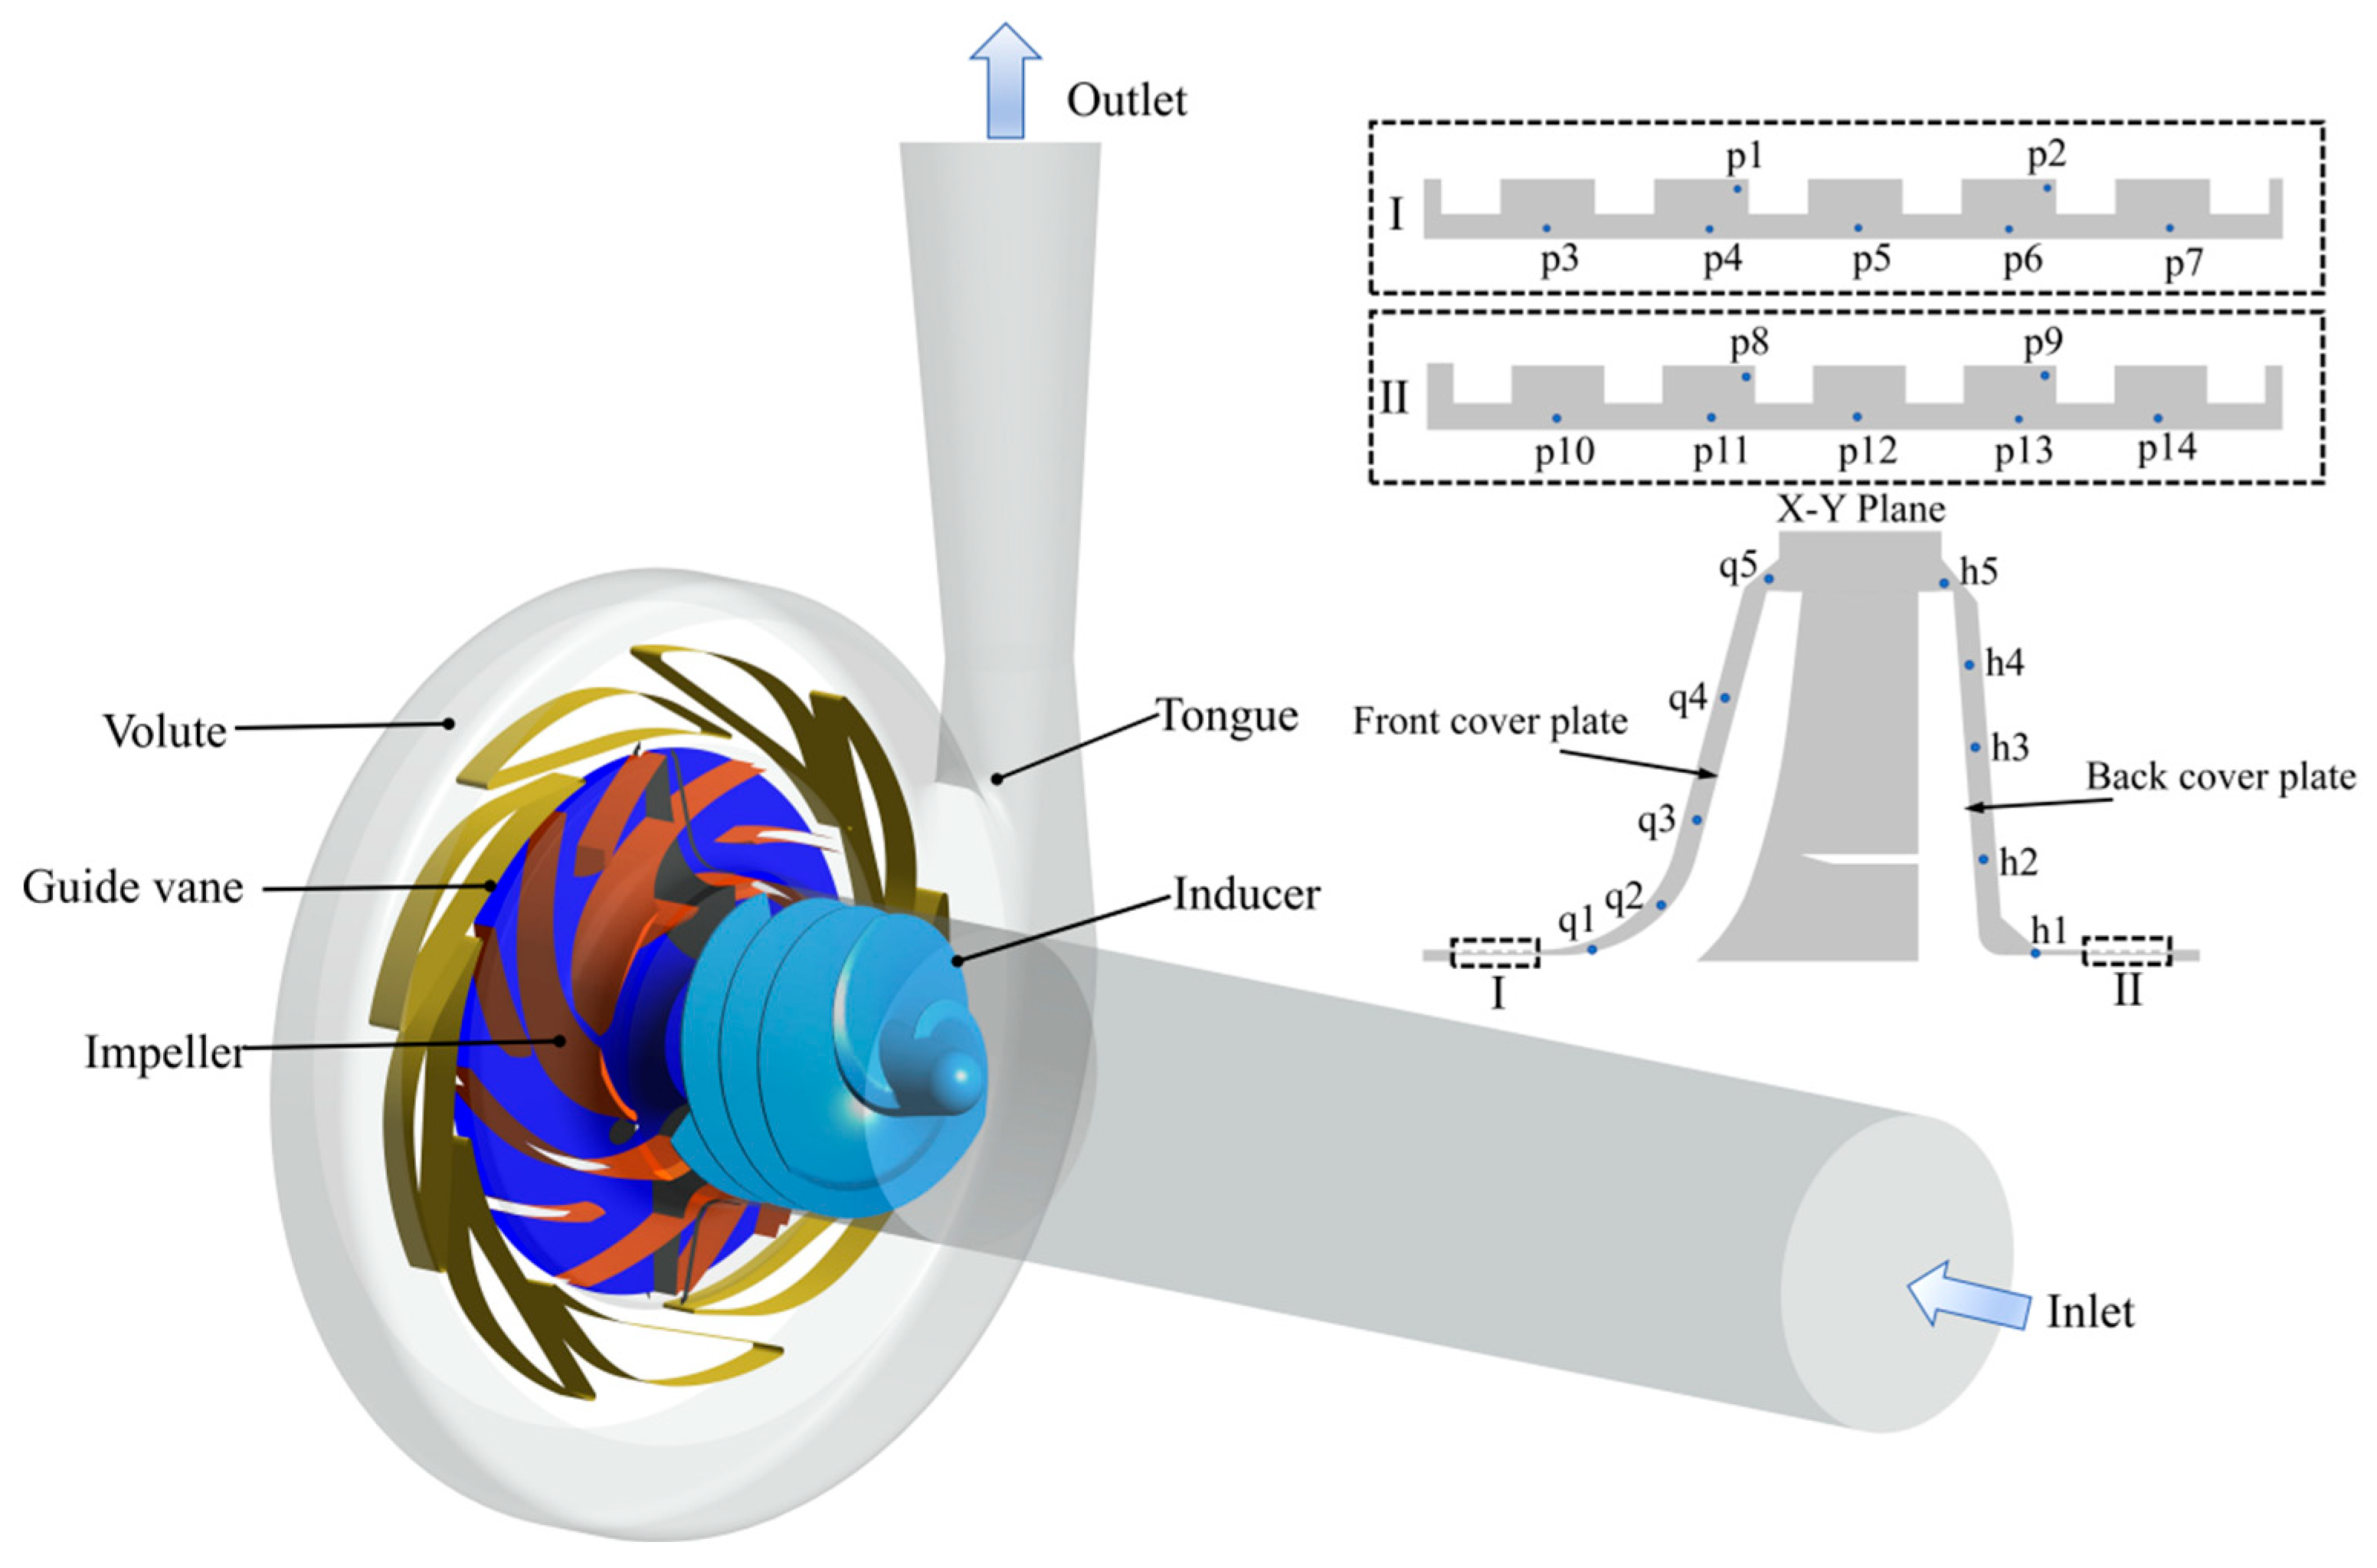
The present investigation focuses on a single-stage high-speed centrifugal pump, with its primary structure depicted in Figure 1. The pump rated operating parameters are as follows: rated flow Qd = 130 m3/h, rated speed n = 9685 rpm, and design head H = 400 m. Detailed geometric parameters are provided in Table 1. The original sealing structure of this model pump has no teeth, only a gap. The gap width is 0.48 mm.
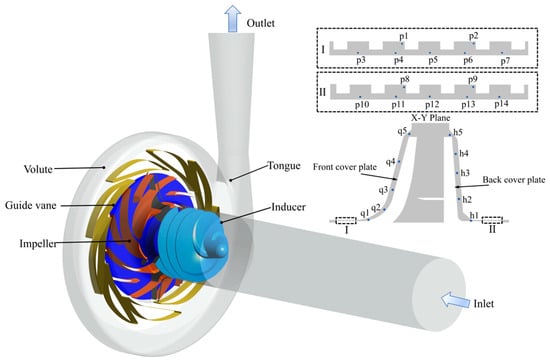
Figure 1.
Pump structure and monitoring points.

Table 1.
Parameters of the model pump.
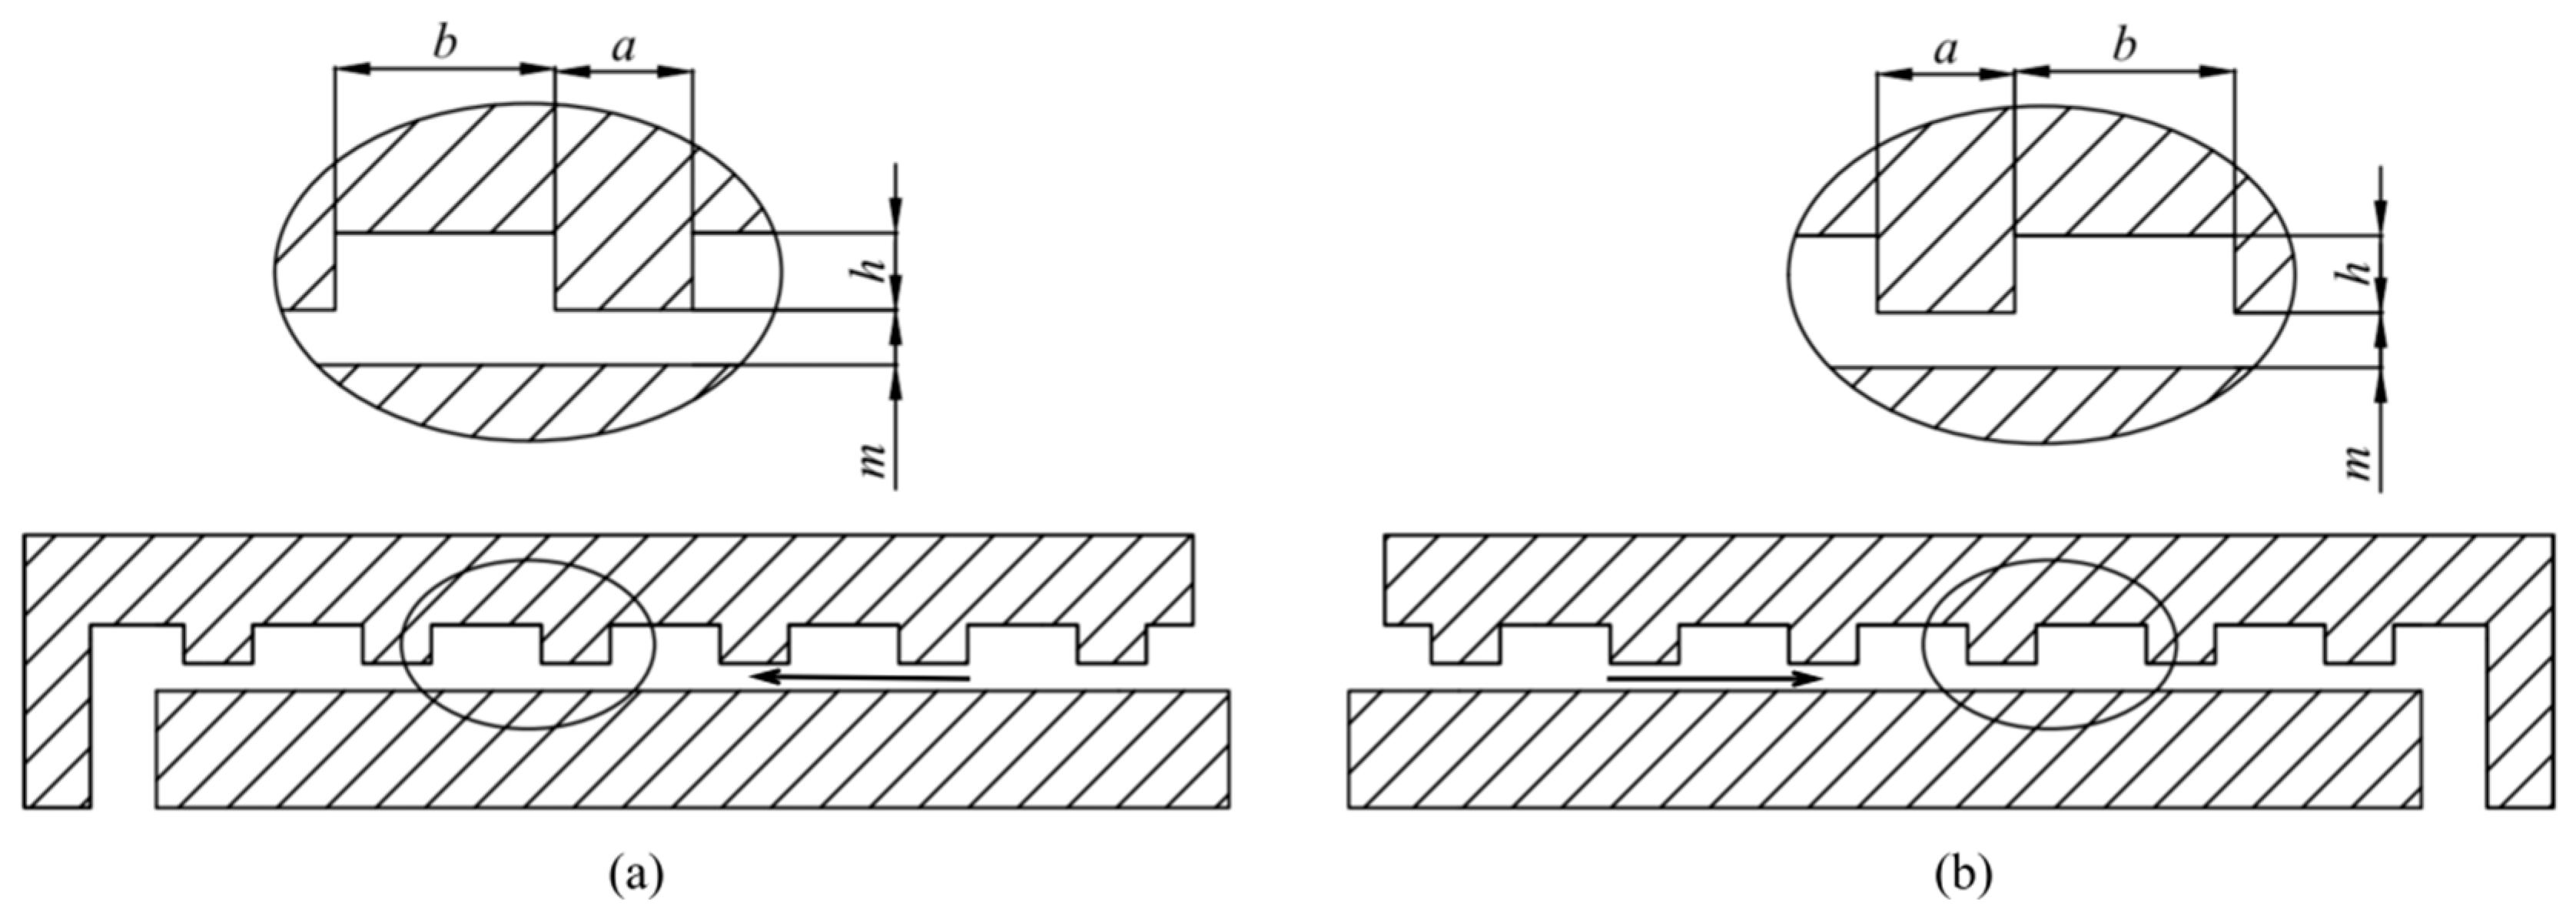
Figure 2 illustrates the cross-section of the seal ring, with arrows indicating the direction of fluid flow inside the ring. Where a is tooth width, b is cavity width, h is tooth height, and m is gap width. To investigate the influence of labyrinth seal ring tooth profile on the pressure pulsations in the centrifugal pump leakage chambers, the study was designed based on the single-variable control principle. Four groups of seal ring structural parameters with different tooth heights were designed, as shown in Table 2. The minimum tooth height is 0.13 mm and the maximum is 0.28 mm. The tooth height was increased by 0.05 mm for each iteration to better capture the nonlinear effects of pressure pulsations.
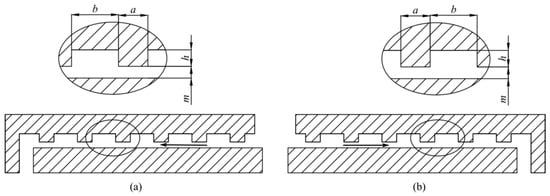
Figure 2.
Cross-sectional structure of the seal ring: (a) front seal ring and (b) back seal ring.

Table 2.
Parameters of seal rings.
3. Experimental Setup
Figure 3a shows the experimental system of the centrifugal pump used in this study, which primarily aims to obtain performance characteristic curves of the centrifugal pump to validate the feasibility of numerical calculations. The experimental system includes a pressure sensor, water tank, valves, flow meter, centrifugal pump, and piping. Figure 3b presents the experimental device, where multiple tests were performed under identical conditions and flow rates. It is necessary to calculate the average value of the measured data. By introducing the theoretical analysis of experimental measurement uncertainty, calculate the uncertainty through Equations (1) and (2) [27]. Table 3 shows the measurement uncertainties of each parameter.

Figure 3.
Experimental setup: (a) system schematic and (b) physical device.

Table 3.
Uncertainty of measurement parameters.
The pump head is calculated based on the pressures monitored at the inlet and outlet using the following Equation (3), and pump efficiency was calculated using the following Equation (4):
where pout is the pressure at the outlet, pin is the pressure at the inlet, ρ is the density of water, g is the gravitational acceleration, Δz is the height difference of the monitoring point, n is the impeller rotational speed, T is the torque, and T0 is the no-load torque.
4. Numerical Simulation
4.1. Governing Equations
Given that the fluid velocity in the centrifugal pump model is significantly lower than the local speed of sound, the fluid medium was treated as incompressible throughout the computational process. This treatment significantly simplifies the computational procedure and ensures accuracy within the scope of this research. Based on Reynolds-Averaged Navier–Stokes (RANS) equations [28], numerical simulations of the high-speed centrifugal pump were conducted using ANSYS CFX 2018. The equations of continuity and momentum are expressed in Equations (5) and (6):
where ρ is the fluid density, t is time, ui is velocity, xi is the coordinate, is the mean component of pressure p, μ is viscosity, are called the Reynolds stresses, and is the mean component of body force gi acting on the fluid.
The fluid flow in centrifugal pumps is typically in a turbulent state. To more accurately simulate the effects of turbulence, the RNG k-ε turbulence model is used [29]. The model applies a mathematical method of renormalizing groups to perform proportional conversion and statistical average of the Navier–Stokes equation, thereby modifying the transmission equation of dissipation rate ε. It increases the R period to account for the anisotropic effect of turbulence and the vortex characteristics of turbulence, thereby further improving the prediction accuracy of complex turbulence.
Equation (7) presents the transport equation for turbulence kinetic energy k:
Equation (12) presents the transport equation for the turbulence kinetic energy dissipation rate ε:
Rz is an additional term (13):
where αk = 1.39, μeff can be obtained from Equation (8), μ is the molecular viscosity coefficient, and μt is the turbulent viscosity coefficient determined using Equation (9), Cμ = 0.0845. Gk (10) is the turbulence kinetic energy generation term caused by the mean velocity gradient. Gb (11) is the turbulence kinetic energy generation term caused by buoyancy, β is the thermal expansion coefficient, and the gravitational acceleration component. ρε is the turbulence kinetic energy dissipation term, and the fluid is incompressible Ym = 0, αε = 1.39, C1ε = 1.42, C2ε = 1.68. The equation follows the Einstein summation convention.
4.2. Computational Setup
In the numerical simulation of centrifugal pumps, accurately defining the boundary conditions at the wall surface is paramount for faithfully capturing fluid–wall interaction dynamics. The wall interface is treated with a no-slip assumption, stipulating that the fluid velocity matches that of the solid boundary. This approach streamlines the computational process while boosting solution stability and convergence. Furthermore, thermal effects are excluded from consideration throughout the flow analysis, resulting in an isothermal calculation scenario. Consequently, the physical properties of the fluid medium remain invariant. Water was selected as the fluid medium for this calculation, with a temperature of T = 25 °C, density ρ = 998.2 kg/m3, and viscosity μ = 0.895 × 10⁻³ Pa·s. The inlet is set as a pressure inlet with p = 101,325 Pa, and the outlet flow rate is Qd = 130 m3/h. Before performing the transient calculation, a steady-state calculation was carried out. For the steady-state calculation, 2000 iterations were set with a convergence criterion of 1 × 10⁻⁵. The steady-state results were subsequently applied as the initial conditions for the transient calculation. The impeller rotates 3 degrees as one time step, which ensures both calculation accuracy and reasonable control of computational cost. A total of 10 cycles were computed, with the convergence criterion set to 1 × 10⁻⁵ during the calculation process.
4.3. Mesh Independence Verification
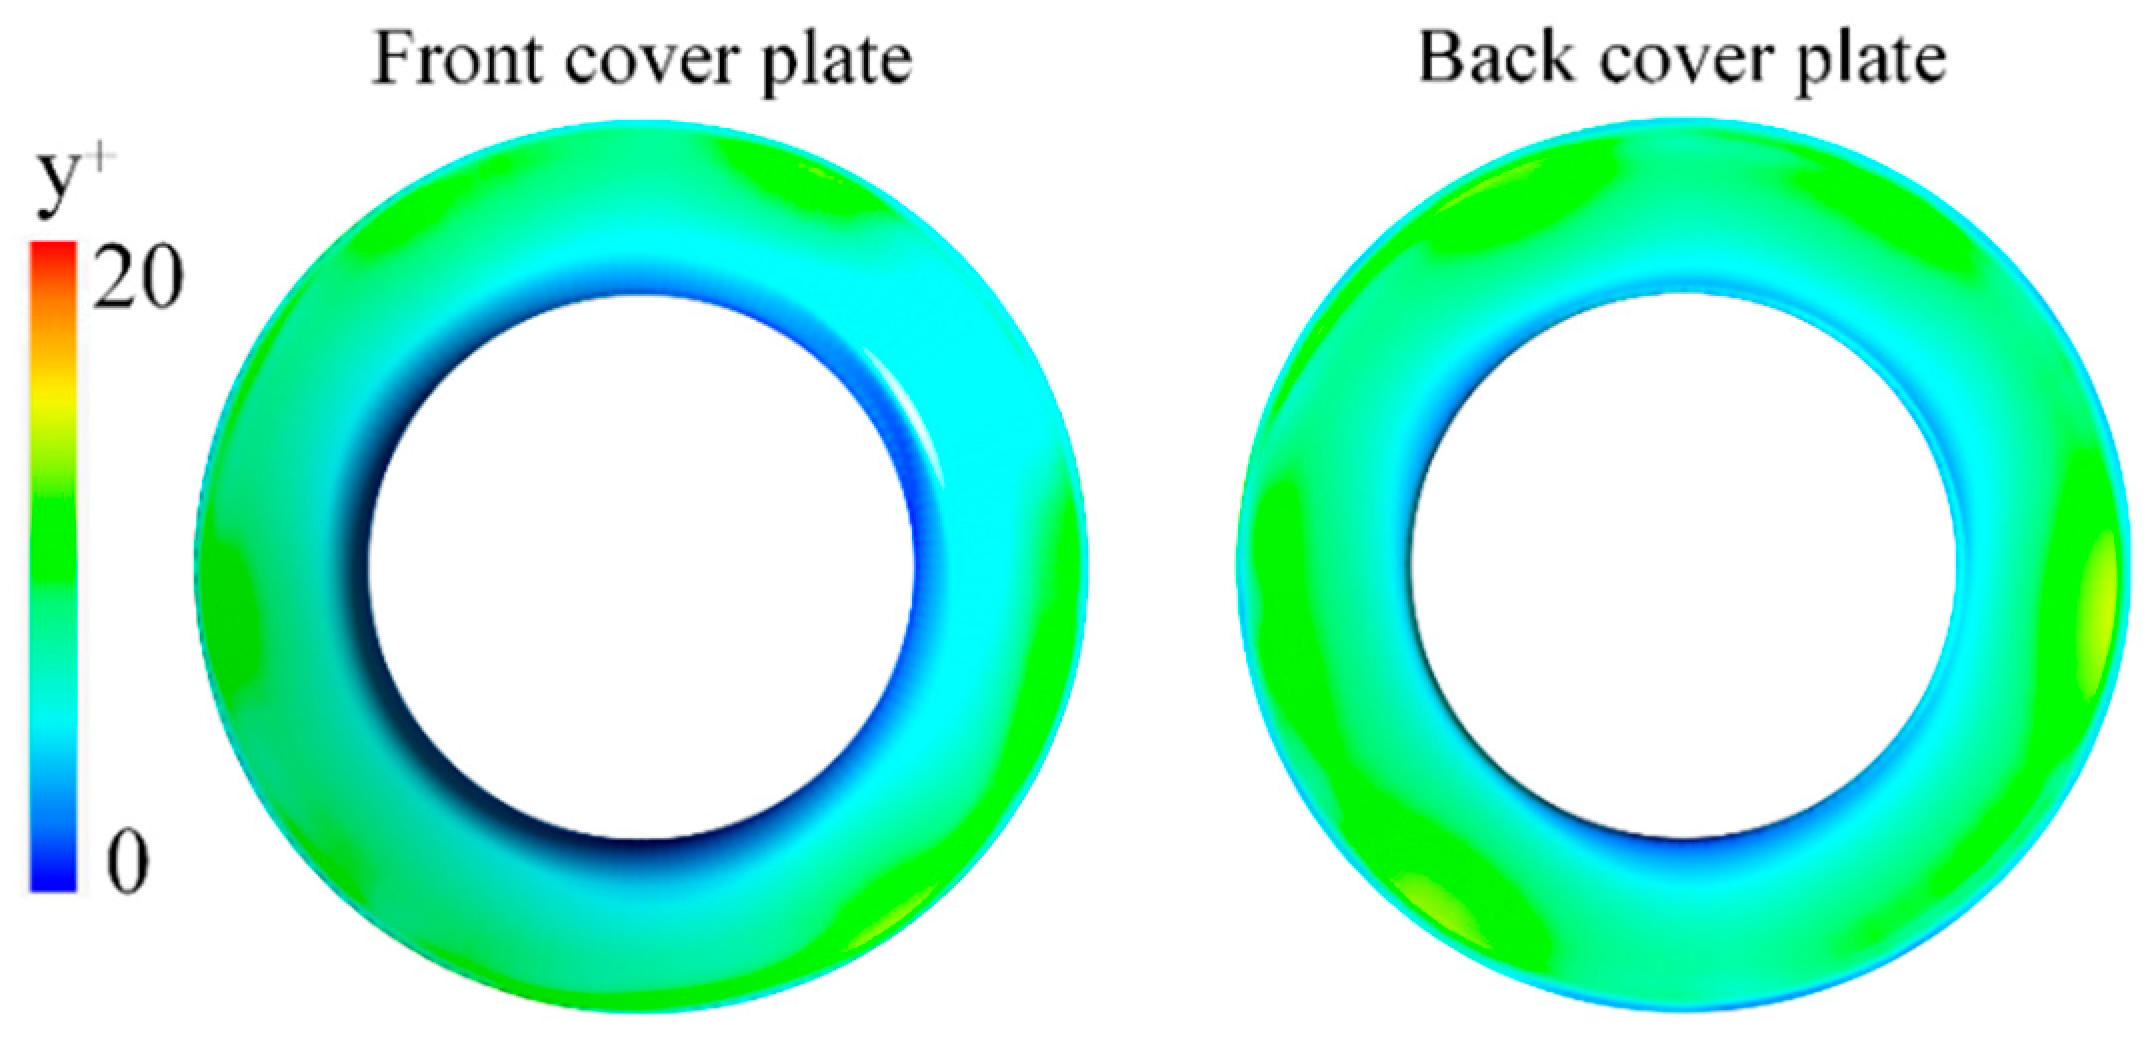
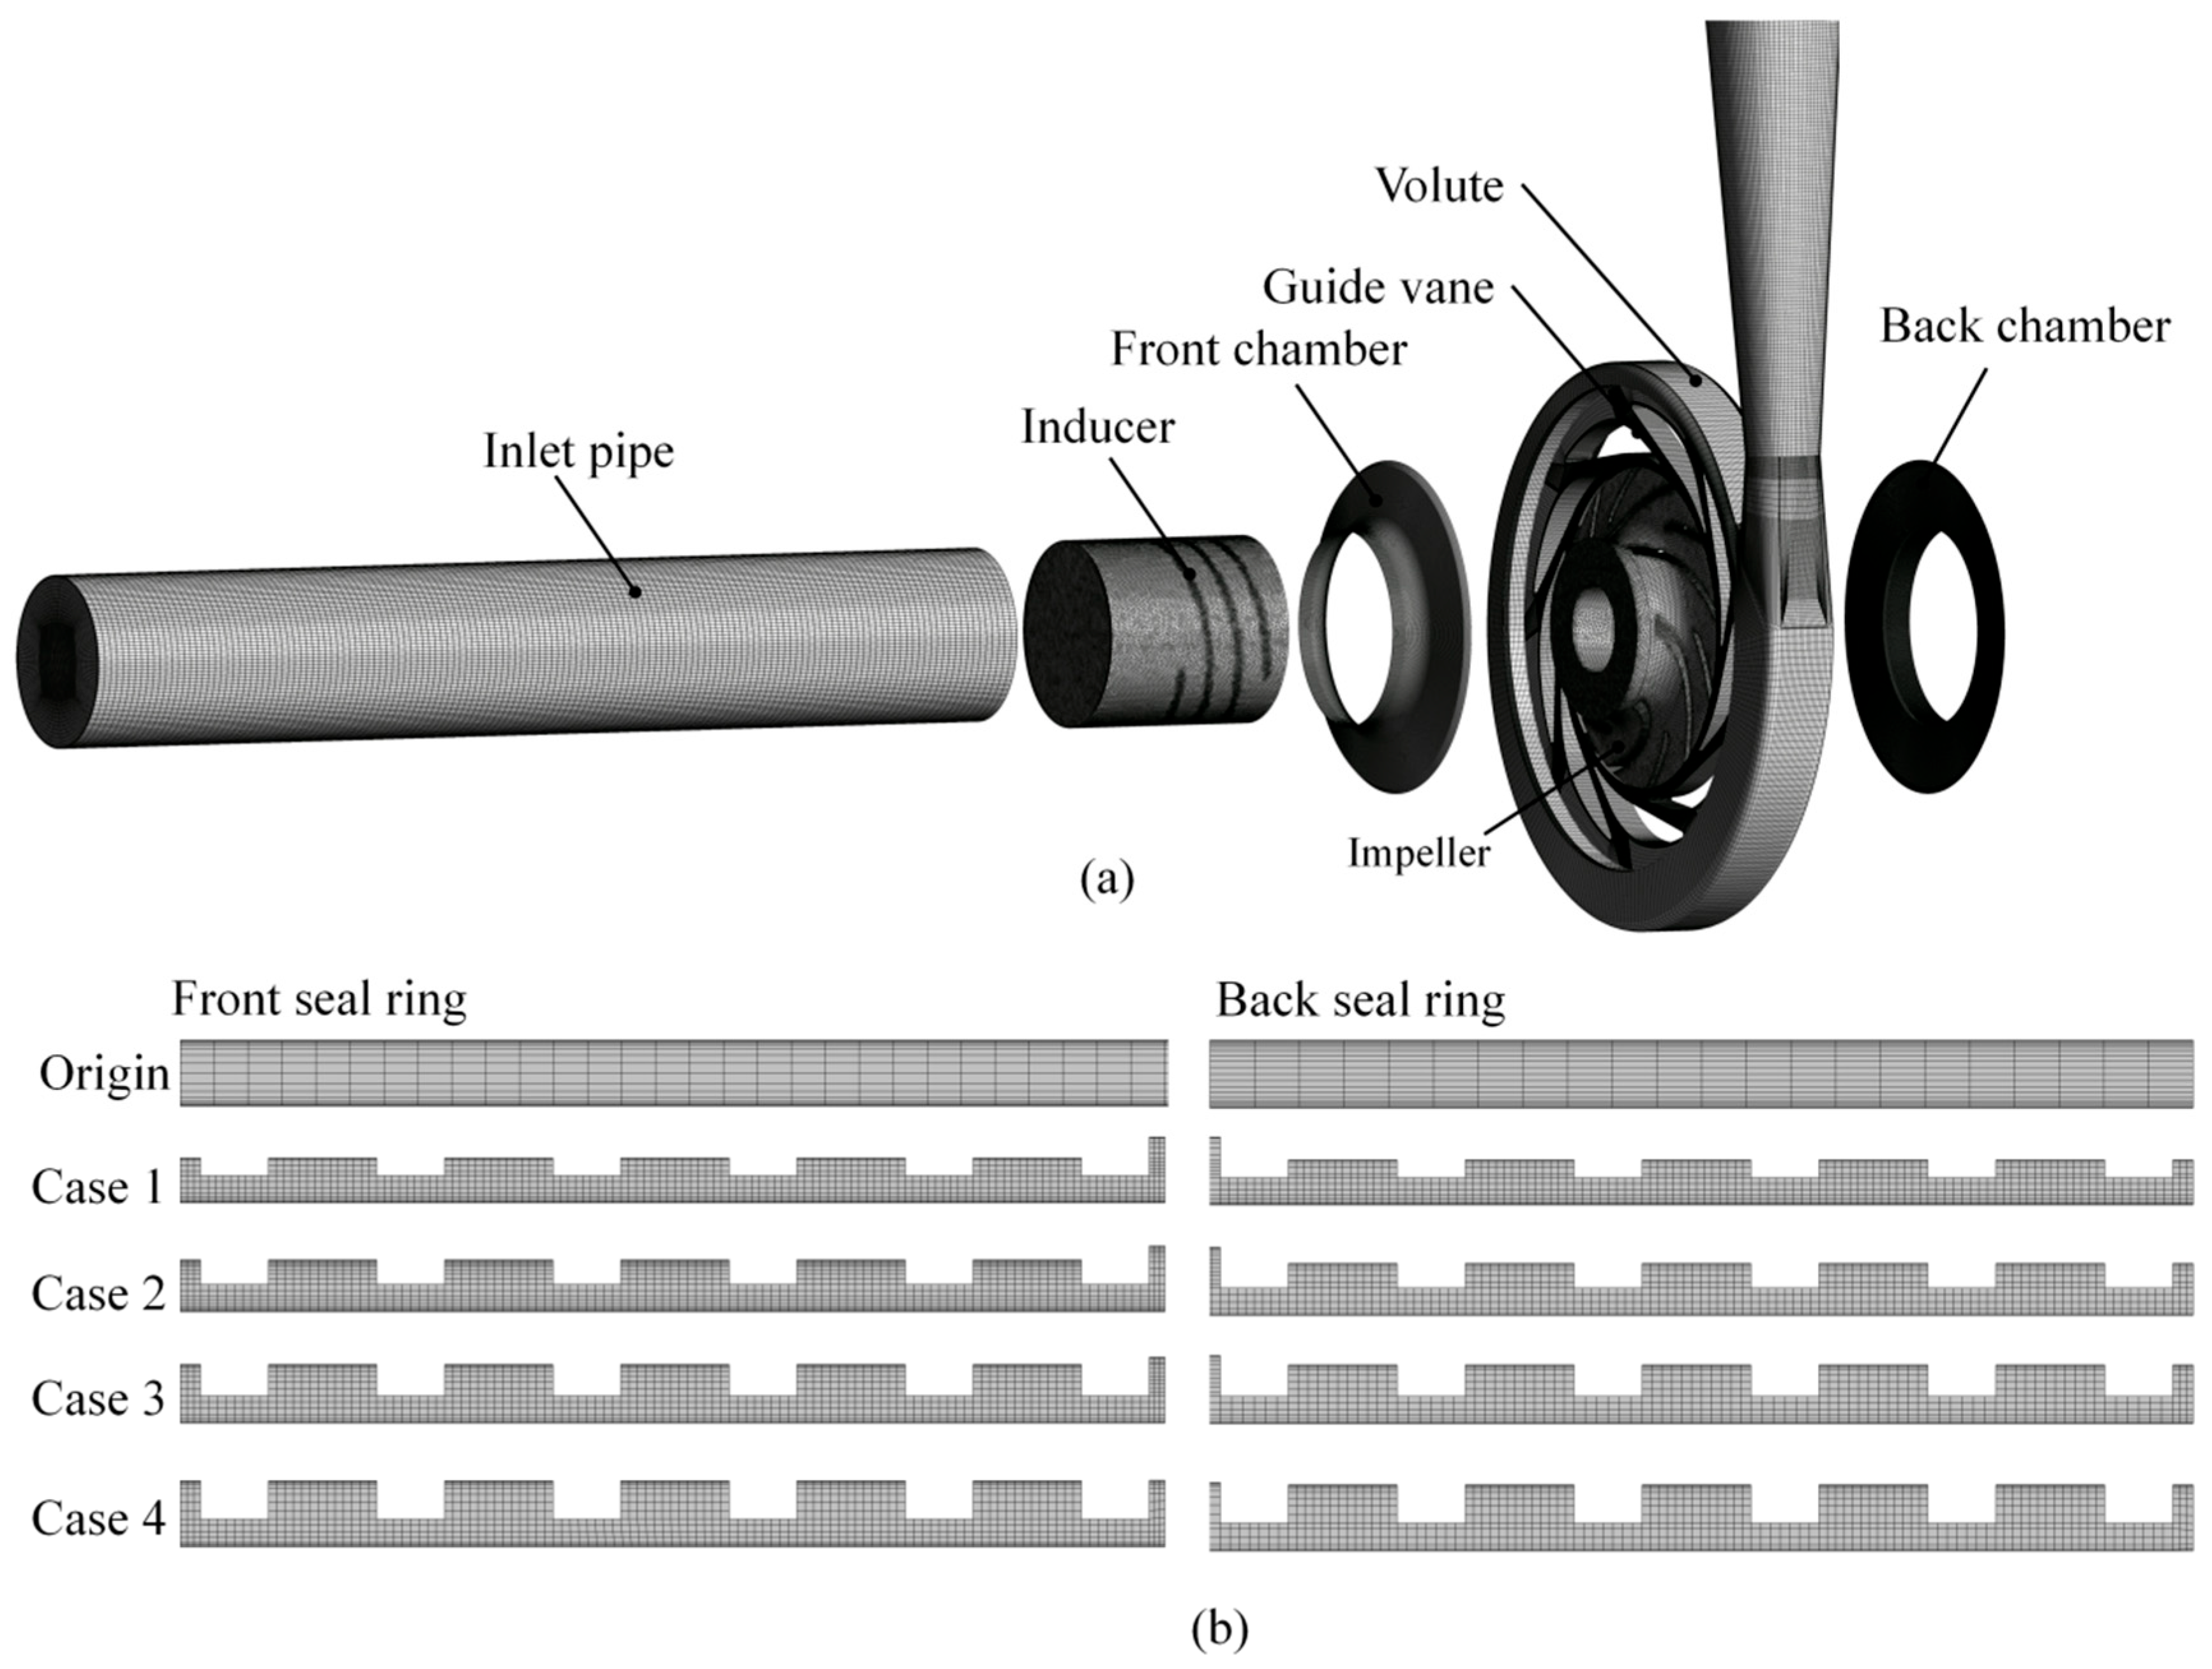
The entire fluid domain consists of the following components: inlet pipe, inducer, impeller, guide vanes, volute, front chamber, back chamber, and outlet pipe. Due to the relatively complex structure of the inducer and impeller, ANSYS ICEM CFD 2018 software was used to generate the mesh. Local mesh refinement was implemented in regions featuring complex geometries and narrow gaps. The remaining structures were divided into a hexahedral mesh. To improve mesh quality, O-type and C-type meshing techniques were employed to accurately map the flow passages, followed by detailed node adjustments. For the critical area of the labyrinth seal, structured meshes were employed to discretize the seal ring region. This was performed to precisely capture the intricate flow characteristics within its narrow clearances. A mesh number of roughly 1.1 million elements within this zone guaranteed the computational accuracy and result dependability. To enhance solution accuracy and resolve near-wall flow physics, the height of the first mesh layer adjacent to the walls was determined based on a target y+ value. Figure 4 shows the y+ distribution for the front and back covers of the impeller, where a growth rate of 1.2 was set to transition the boundary layer mesh to the core region of the flow passage. The computational mesh is shown in Figure 5.
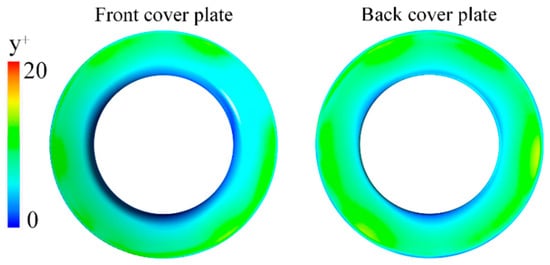
Figure 4.
Distribution of y+ on the front cover plate and the back cover plate.
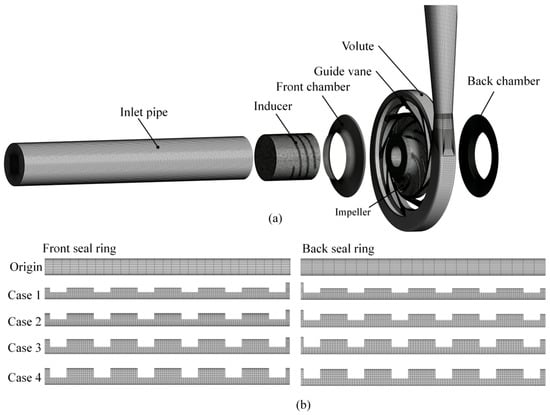
Figure 5.
Mesh details of the model pump and seal ring, (a) global mesh, (b) mesh detail at seal rings.
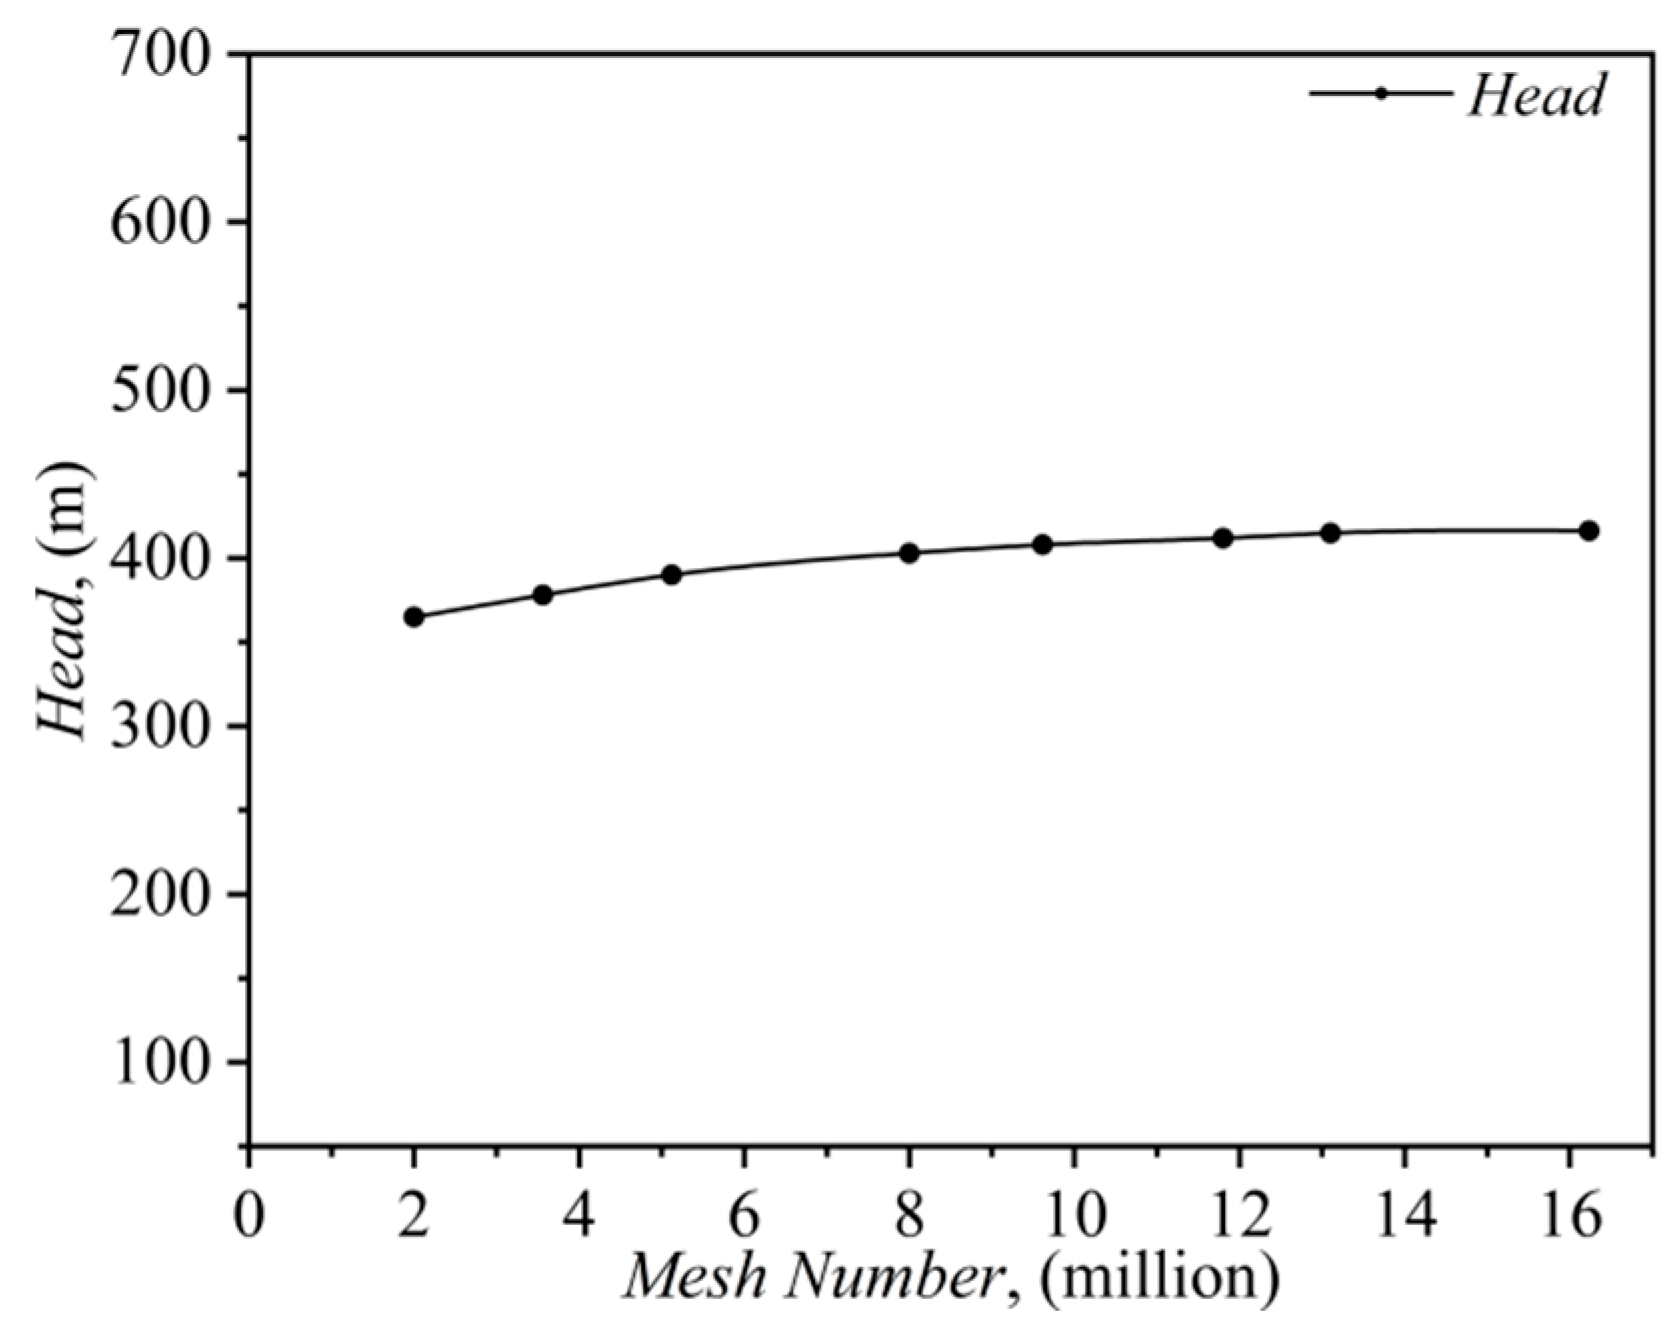
In this study, we performed mesh independence verification of the adopted centrifugal pump model, dividing the mesh into eight different densities, and steady-state solutions were carried out for each mesh to obtain corresponding head data, as shown in Figure 6. When the mesh number exceeds 13.3 million, the calculated head values stabilize, indicating that further increasing the mesh density has no significant effect on the head calculation results. Considering the balance between computational accuracy and resource requirements, a mesh of 13.3 million elements was selected as the final mesh density for subsequent simulation calculations.
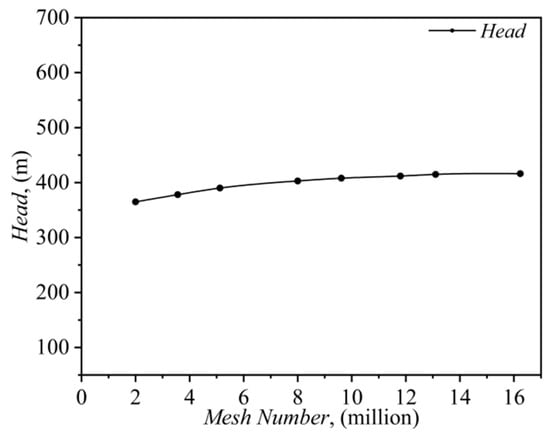
Figure 6.
Mesh independence verification.
5. Results and Discussion
5.1. Experimental Validation
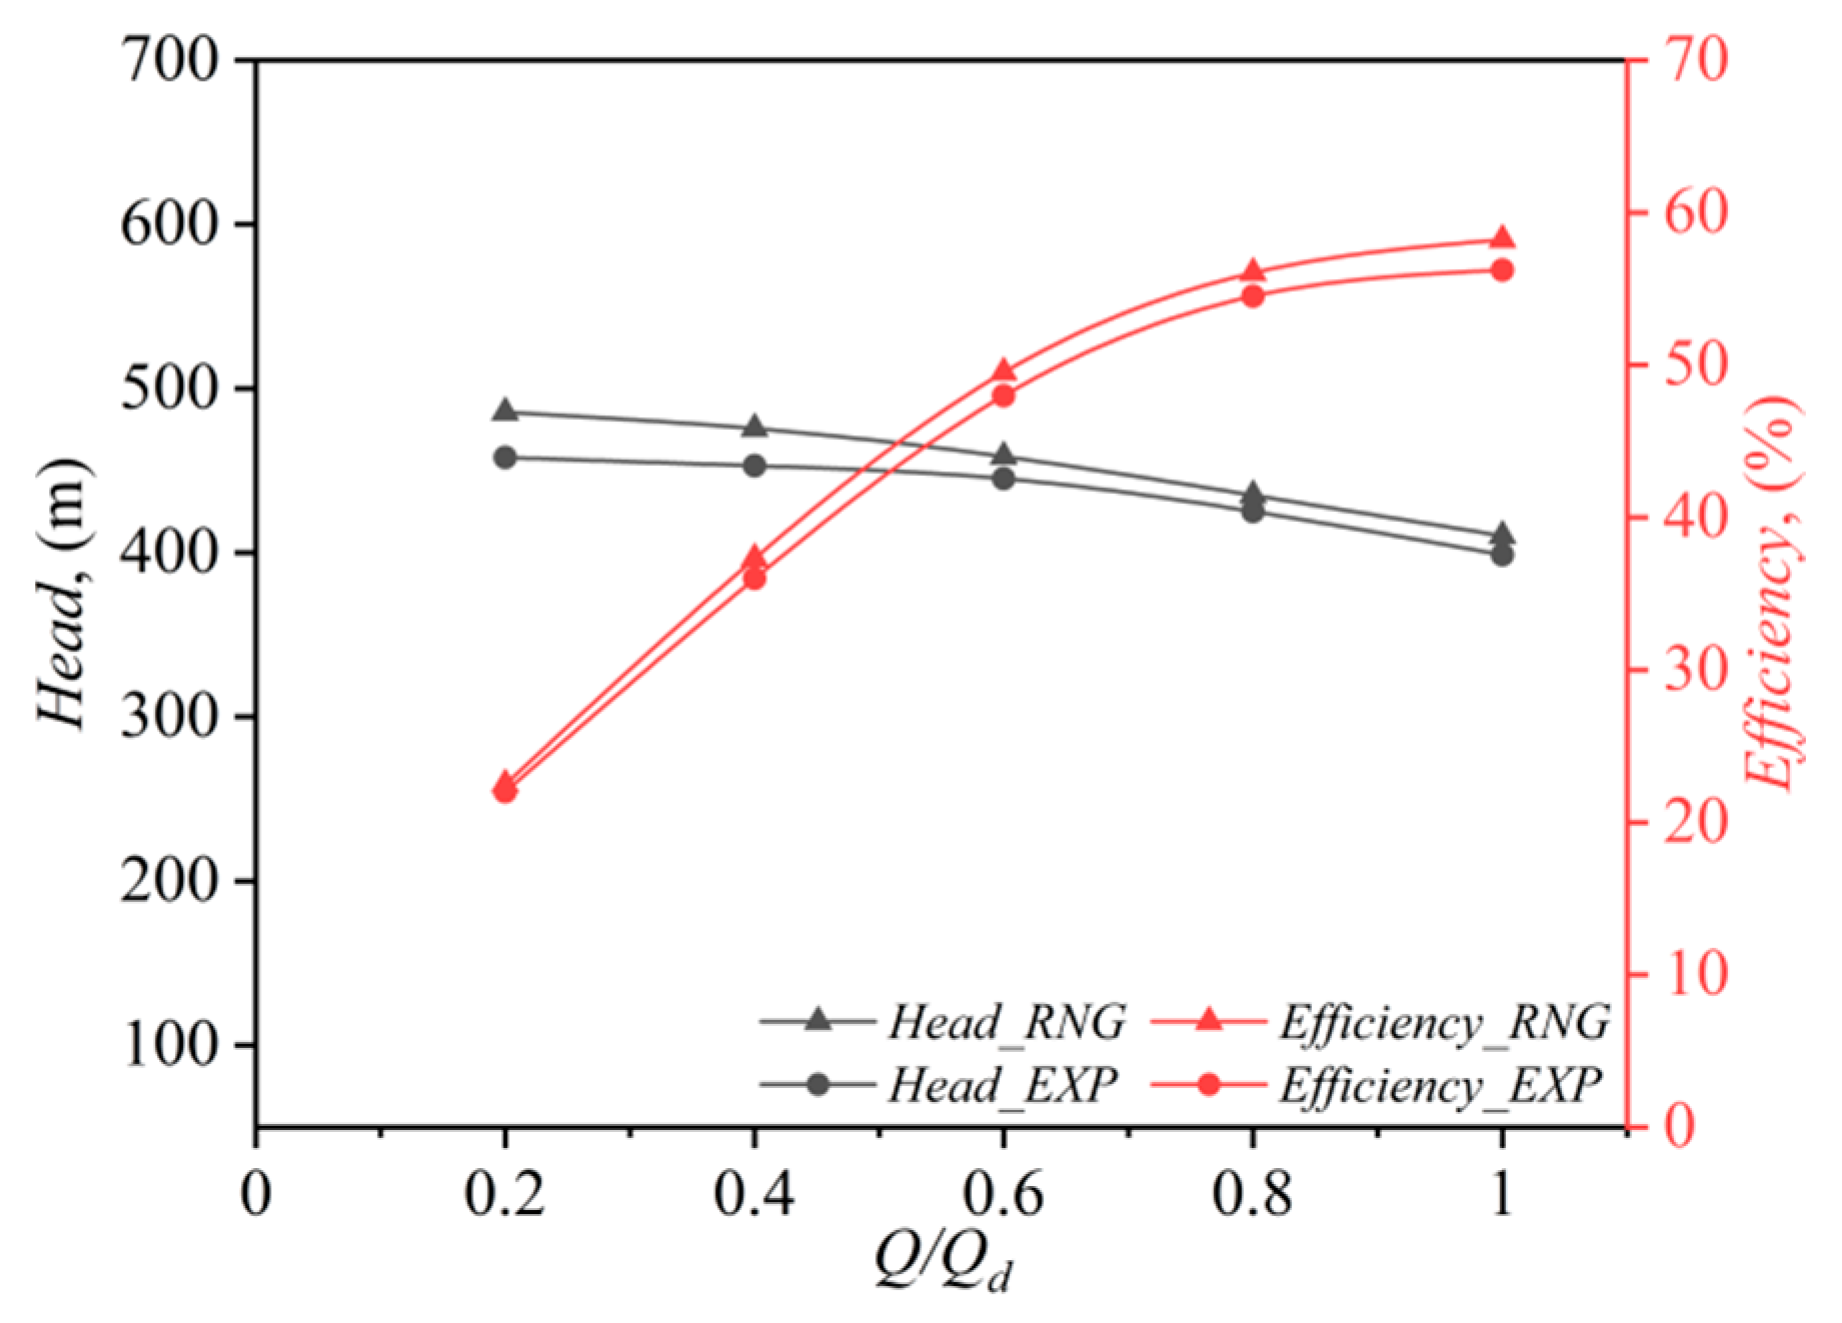
Figure 7 presents the pump performance characteristics, which are derived from a comprehensive analysis of experimental data and numerical simulation results. In this study, we conducted calculations on the prototype model across different flow conditions ranging from 0.2Qd to Qd and averaged the simulation results to obtain the mean values of head and efficiency. These values were compared with experimental data. At the rated flow Qd = 130 m3/h, the calculated head was 410.32 m, while the experimental measurement was 400 m, with an error of 2.58%. The calculated efficiency was 58.21%, while the experimental efficiency was 56.23%, with a small error of only 3.52%. Although discrepancies exist between the numerical and experimental results at specific points, the overall trend of the simulated characteristic curves aligns well with experimental data, validating the reliability of the adopted numerical methodology for subsequent analyses. Based on this, the subsequent computational studies were conducted under design flow conditions.
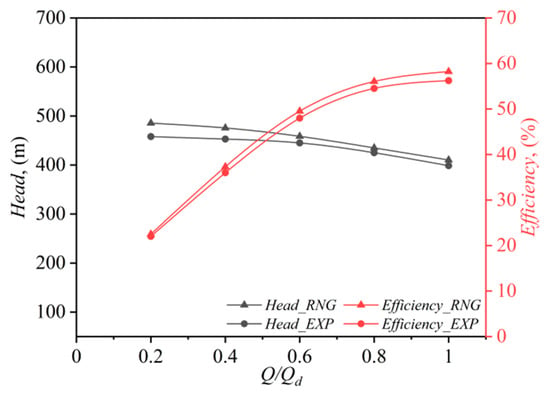
Figure 7.
Comparison of numerical results and the experimental test.
5.2. Analysis of Pump Performance and Leakage Rate
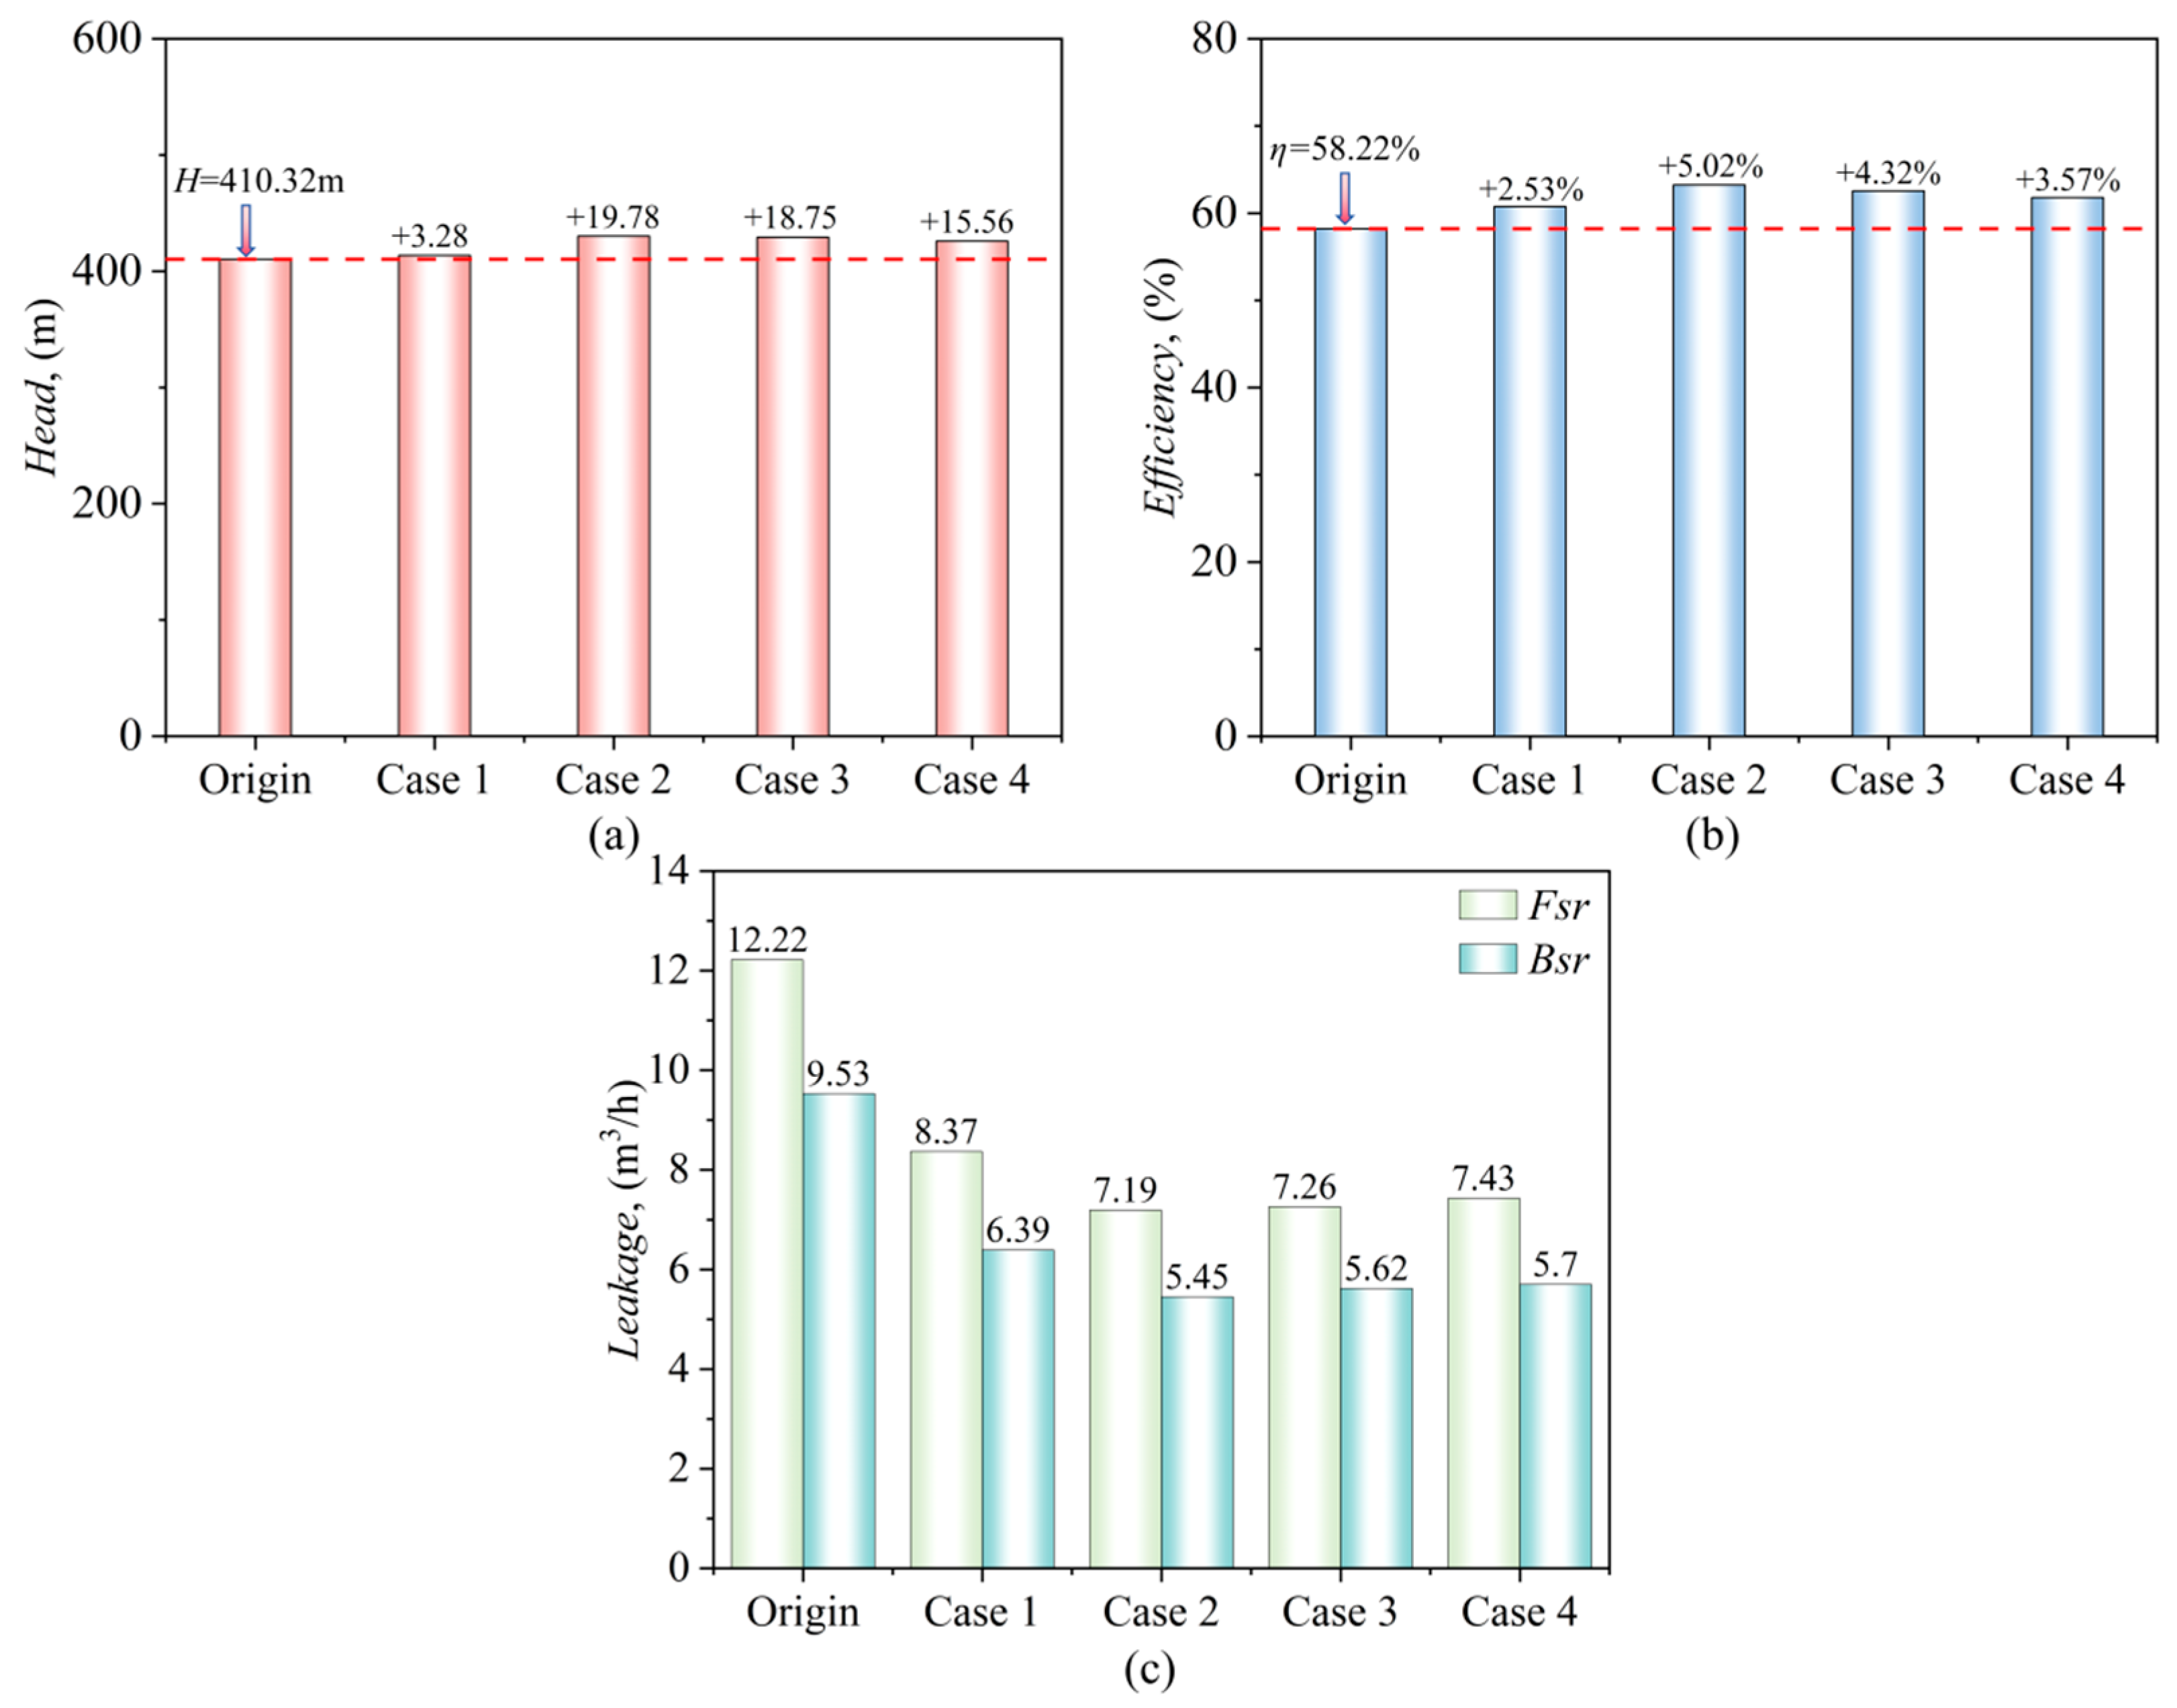
Under the design flow conditions, we employed numerical methods to analyze various seal ring structures in detail, determining the corresponding head and efficiency for each seal structure, as shown in Figure 8a,b. Figure 8c shows the simulated leakage rate for the front and back seal rings corresponding to different seal ring structures. The leakage rate data presented in this research paper was obtained by calculating the axial velocity at the centrifugal pump seal ring multiplied by the seal ring area. The simulation results indicate that for the baseline (Origin) configuration, front and back seal ring leakage rates were 12.22 m3/h and 9.53 m3/h, respectively. Significant reductions in leakage were achieved with the labyrinth seal designs. For instance, Case 2 exhibited a 41.1% reduction in front seal leakage and a 42.8% reduction in back seal leakage relative to the Origin. However, Case 4, featuring the largest tooth height, demonstrated a slight increase in leakage compared to Case 3.
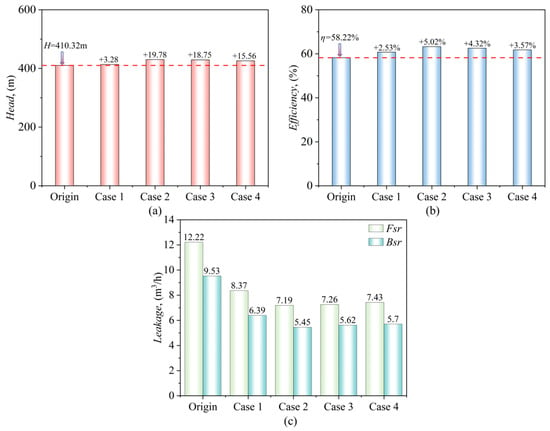
Figure 8.
The performance of pumps with different seal ring structures: (a) head, (b) efficiency, and (c) leakage rate of the seal ring.
5.3. Flow Characteristics of Seal Rings
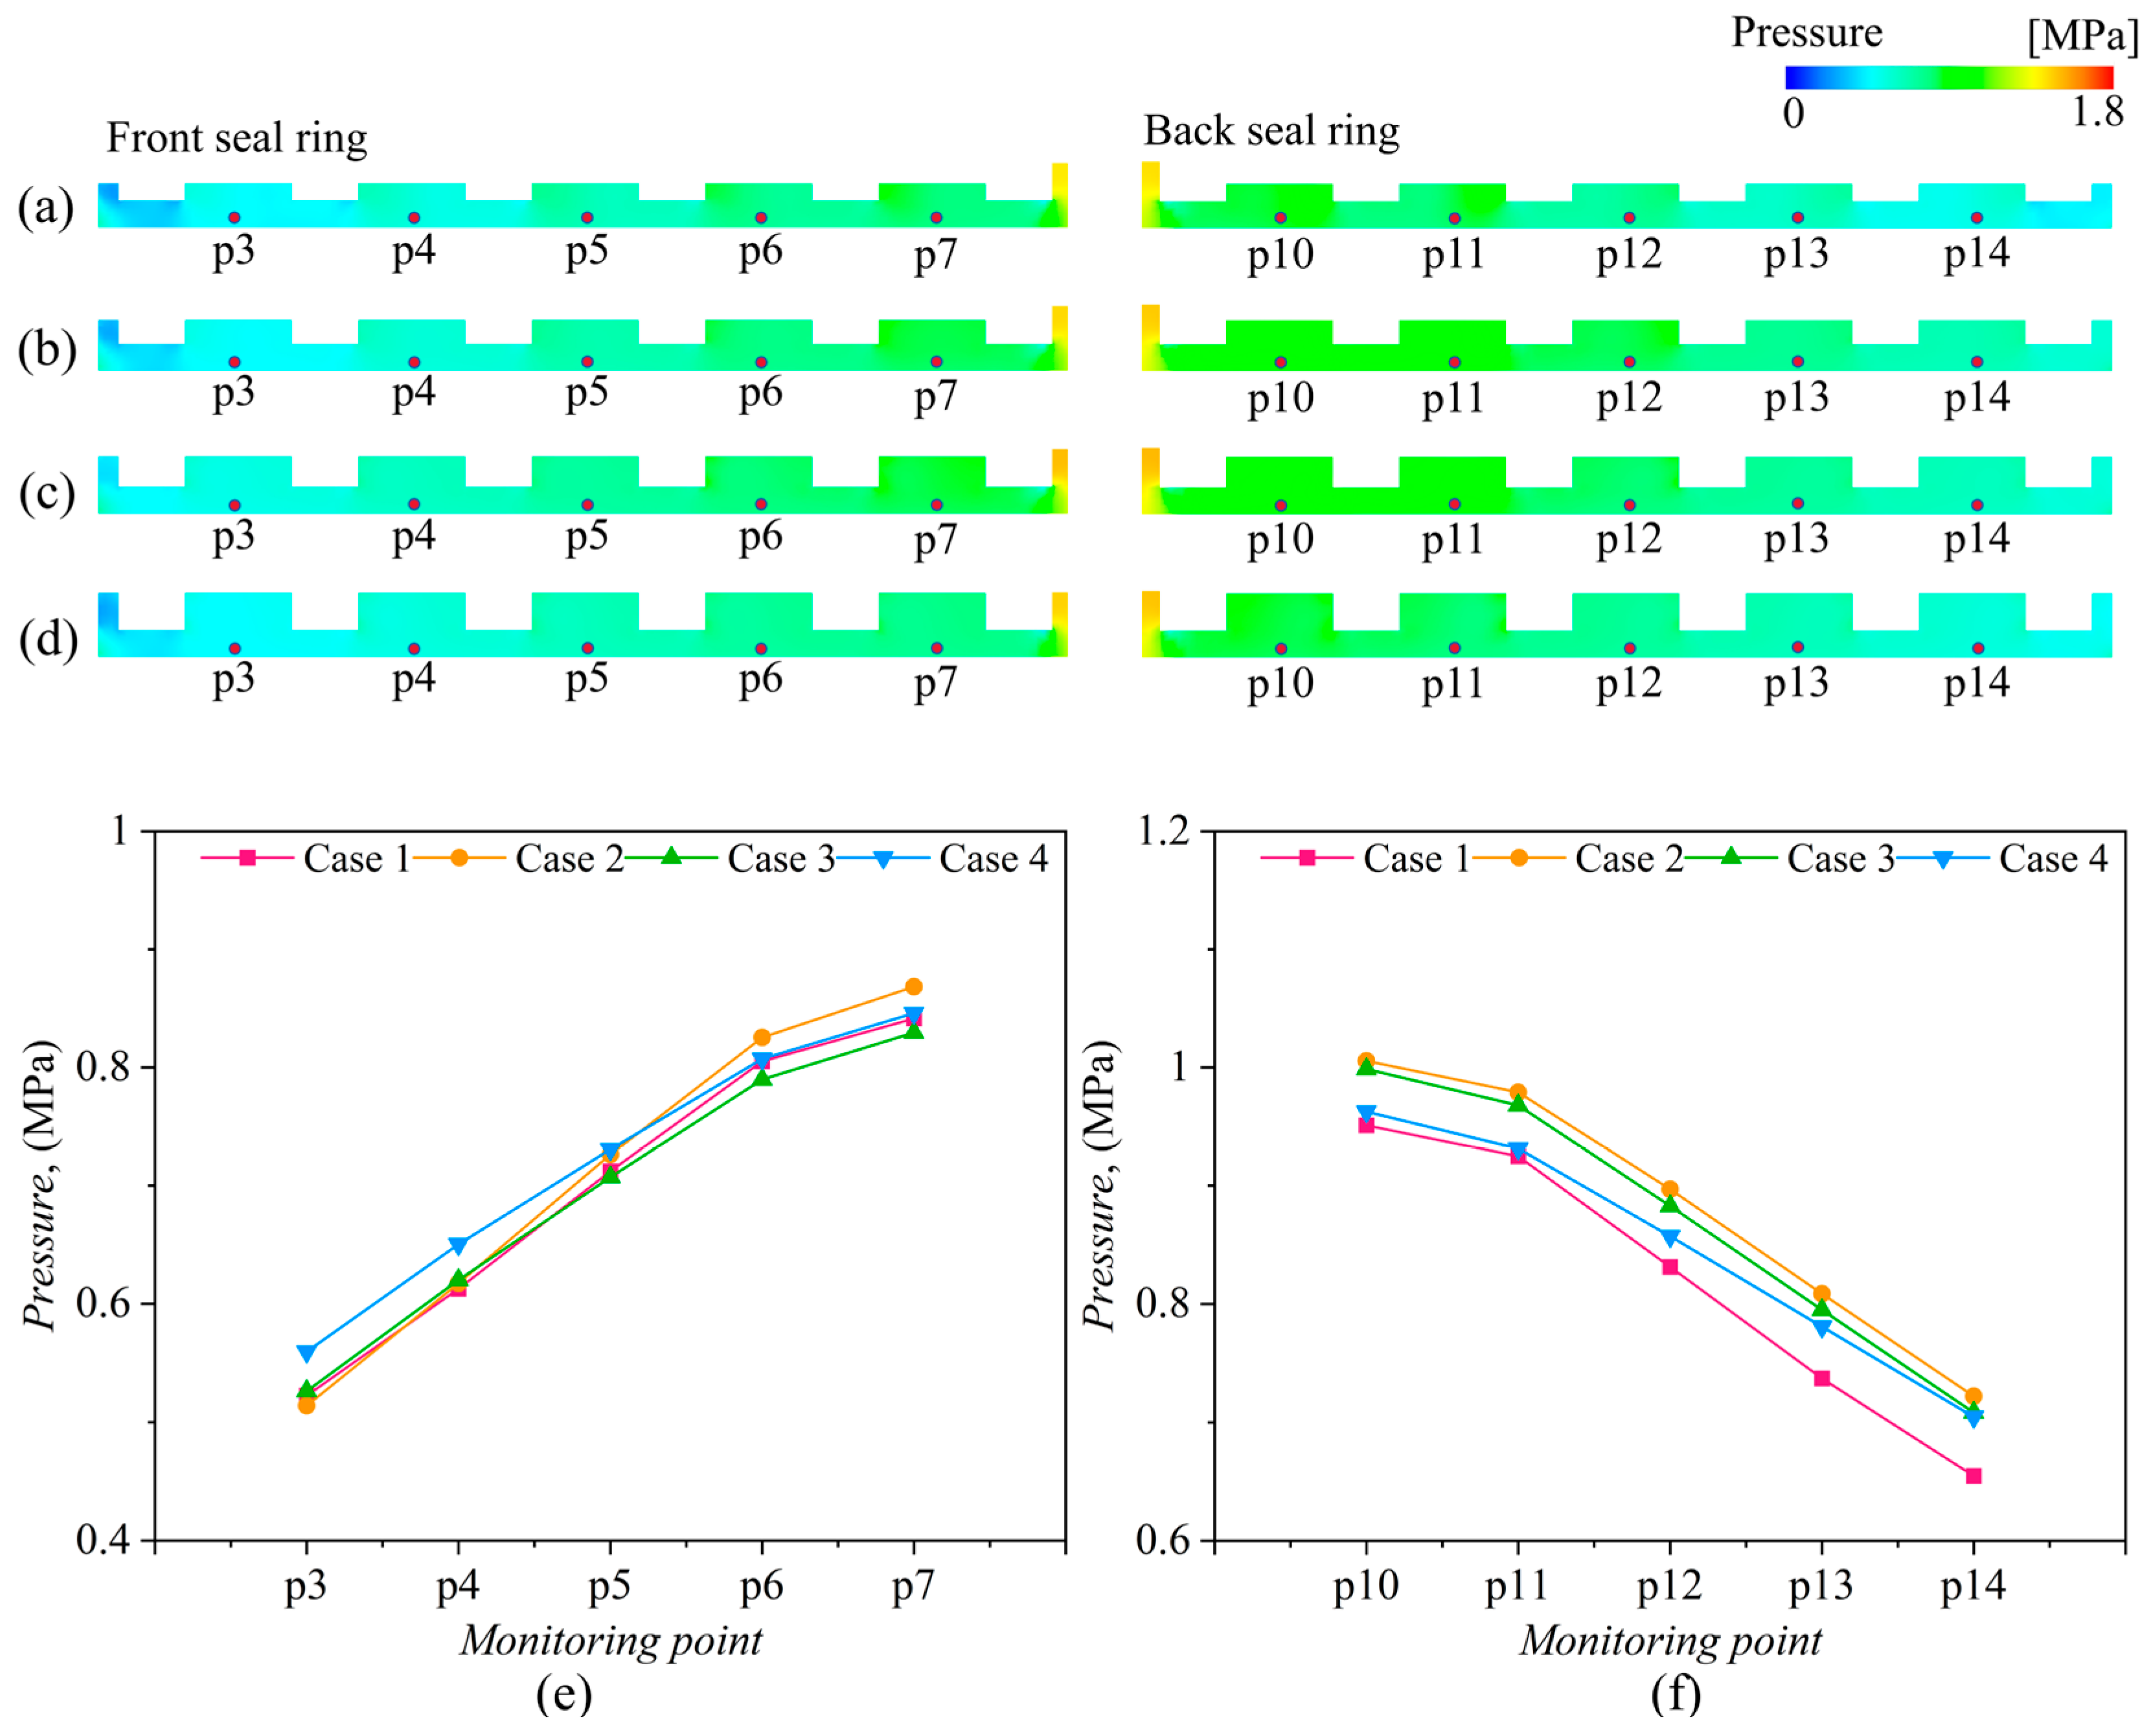
Figure 9 shows the pressure distribution of the front and back seal rings of the centrifugal pump. From observation of the figure, it can be seen that the internal pressure of the seal ring decreases gradually along the flow direction, a phenomenon mainly attributed to the consumption of pressure due to flow resistance. With increasing tooth height from Case 1 to Case 3, the pressure at the end of the front seal ring shows a rising trend. However, in Case 4, when the tooth height increases to 0.28 mm, the pressure at the end decreases slightly compared to Case 3. In the back seal ring, as the tooth height of Case 1 and Case 2 increases, the pressure at the front of the seal ring rises. In Case 4, as the tooth height continues to increase, the change in front-end pressure is similar to that of the front seal ring. It is worth noting that in Case 4, excessively high tooth heights have an adverse impact on the internal pressure of the seal ring. Compared to the back seal ring, the pressure variation in the front seal ring is very significant. The effect of tooth height changes on the internal pressure of the front seal ring is more obvious, while the pressure variation in the back seal ring is relatively small. This difference can be attributed to the varying impact of different tooth heights in the front seal ring on the collision intensity between the leakage flow and the main flow, which in turn affects the internal pressure changes. Further analysis shows that the front seal ring has a more significant impact on the flow field than the back seal ring. To elucidate the connection between seal cavity turbulence levels and pressure gradients, the subsequent investigation will focus on turbulence kinetic energy distributions.
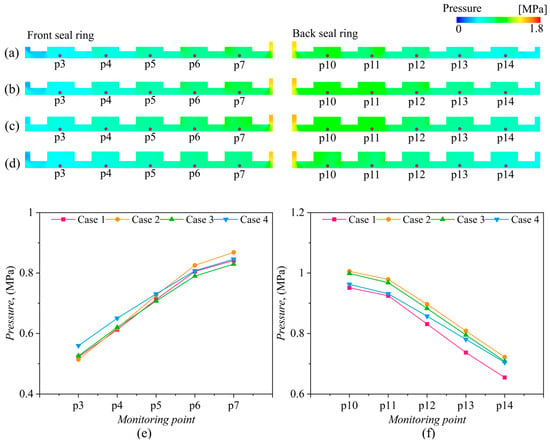
Figure 9.
Pressure distribution of seal rings: (a) Case 1, (b) Case 2, (c) Case 3, and (d) Case 4, (e) pressure graph of the front seal ring, and (f) pressure graph of the back seal ring.
Figure 10 shows the distribution of turbulence kinetic energy in the front and back seal rings of the centrifugal pump. In the front seal ring, we can observe that when the tooth heights of Case 1 and Case 2 are relatively low, the turbulence kinetic energy near the teeth reaches approximately 50 m2/s2 and extends into the chamber. This is because the fluid accelerates significantly as it passes over the tooth tips, and then strong turbulence is generated due to sudden expansion, creating a large velocity gradient. In the back seal ring, only Case 1 exhibits the highest turbulence kinetic energy, while Case 2 shows a significant decrease. In Case 3 and Case 4, the tooth heights are relatively high. As clearly shown by the trend in the figure, with the gradual increase in tooth height, the intensity of turbulence kinetic energy in the seal ring area gradually weakens, indicating that the fluid flow becomes more stable, which is conducive to improving the efficiency and performance of centrifugal pumps. This phenomenon aligns with structural optimization aimed at controlling turbulence characteristics. The momentum transport process of turbulence pulsations can be quantified by eddy viscosity, which represents the enhanced effect of turbulent vortices on molecular viscosity. In the seal ring, where strong shear flow occurs, the distribution of eddy viscosity directly determines the intensity of energy dissipation in the leakage flow. Therefore, analyzing eddy viscosity is also crucial.

Figure 10.
Turbulence kinetic energy distribution of seal rings: (a) Case 1, (b) Case 2, (c) Case 3, and (d) Case 4.
Figure 11 shows the eddy viscosity distribution of the front and back seal rings of the centrifugal pump. In Case 1 and Case 2, where the tooth height is relatively low, the high eddy viscosity regions have values close to 0.1 Pa·s, and their distribution range is quite large. The contour map indicates that turbulence in the fluid is strong in this region, with intense fluid vortex motion and significant energy dissipation. when the tooth height is low, the constraining and guiding capabilities of the tooth on the fluid are relatively weak, resulting in more vortices and easily triggering strong turbulence. In Case 3 and Case 4, where the tooth height is relatively high, it is clearly observed that compared to Case 1 and Case 2, the areas with high eddy viscosity are significantly reduced. This is because the higher tooth height alters the flow passage structure, enhances the guiding effect on the fluid, and suppresses the occurrence of large-scale flow separation, thus stabilizing the internal flow field of the tooth ring. Increasing the tooth height can also effectively prevent the formation and development of larger-scale vortices, reduce the transfer of turbulent fluctuation energy to smaller-scale vortices, and lower the eddy viscosity. At this point, the orderliness of fluid flow is improved, and energy dissipation is reduced. The above eddy viscosity analysis reveals the turbulence spatial characteristics of the flow field inside the seal ring. The distribution of eddy viscosity, as the medium transmitting turbulent stresses, directly influences the velocity distribution. Further analysis of the velocity field distribution allows for a quantifiable evaluation of the impact of turbulent transport on the leakage flow dynamics of the centrifugal pump.

Figure 11.
Eddy viscosity distribution of seal rings: (a) Case 1, (b) Case 2, (c) Case 3, and (d) Case 4.
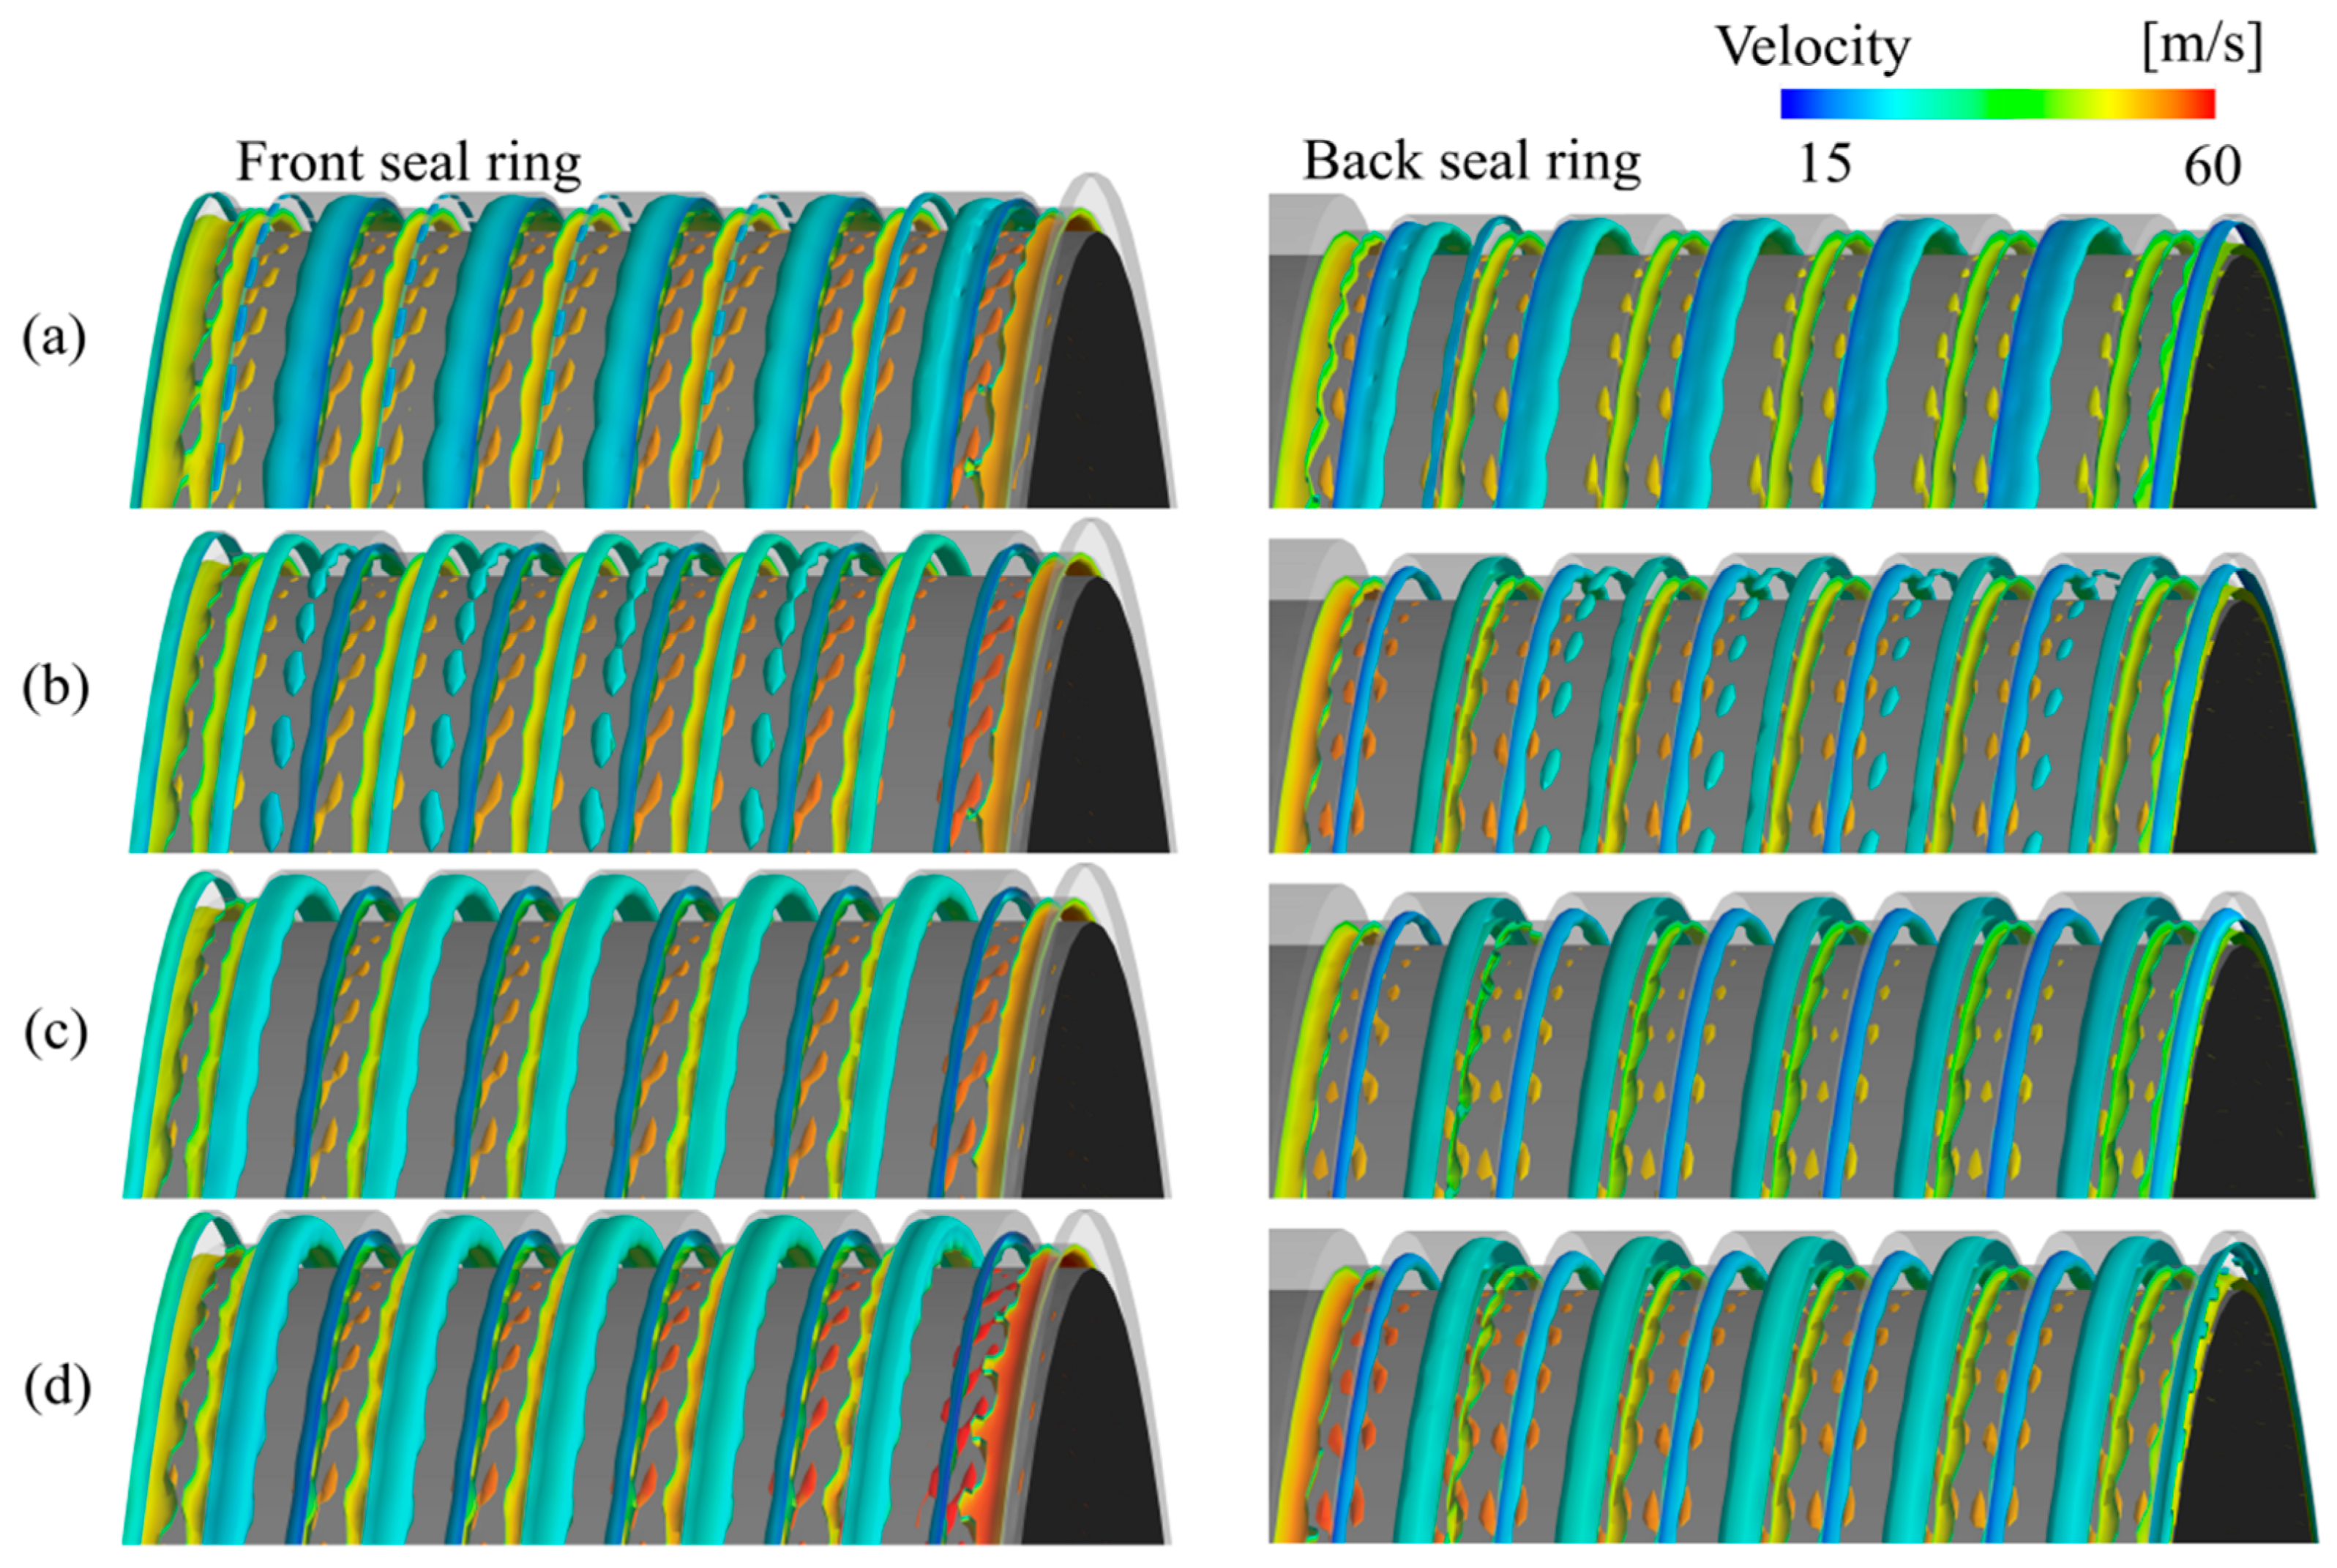
Figure 12 shows the velocity distribution and streamlines within the front and back seal rings of the centrifugal pump. The figure reveals that the internal flow field of the seal ring is separated into two regions by velocity. The yellow area signifies the primary flow region and the green area denotes the vortex region. With increasing tooth height, the velocity at the inlet of the main flow region also increases. Within the front seal ring, Case 1 exhibits the smallest tooth height, resulting in minimal flow resistance. The velocity distribution in the main flow region is uniform. In Case 2 and Case 3, as the tooth height gradually increases, the vortex effect on the main flow becomes more pronounced, which can suppress some of the leakage flow. In Case 4, most of the fluid flows between the teeth, dominated by secondary flow, leading to the greatest flow resistance, the smallest effective flow area, and a higher main flow velocity. Part of the static pressure is converted into dynamic pressure, which increases the leakage and affects the operational efficiency. The situation in the back seal ring is similar to that of the front seal ring.

Figure 12.
Streamline in seal rings: (a) Case 1, (b) Case 2, (c) Case 3, and (d) Case 4.
Figure 13 shows the vorticity distribution of the front and back seal rings. In Case 1, the vortex structure is relatively regular. In Case 2, with the increase in tooth height, independent small vortices begin to form. In Case 3 and Case 4, the vortex structure becomes more concentrated. In Case 4, it is evident that the velocity increases significantly, reflecting that the increase in tooth height leads to stronger leakage vortex intensity and higher local flow losses. The change in the inlet ring structure also has a certain impact on the chamber inside, and we need to further analyze the vortex structure inside the chamber.
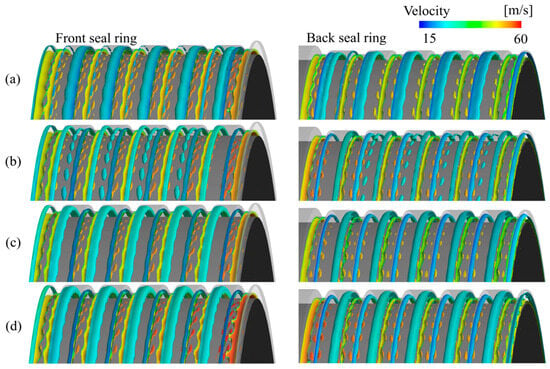
Figure 13.
Vorticity distribution in seal rings: (a) Case 1, (b) Case 2, (c) Case 3, and (d) Case 4.
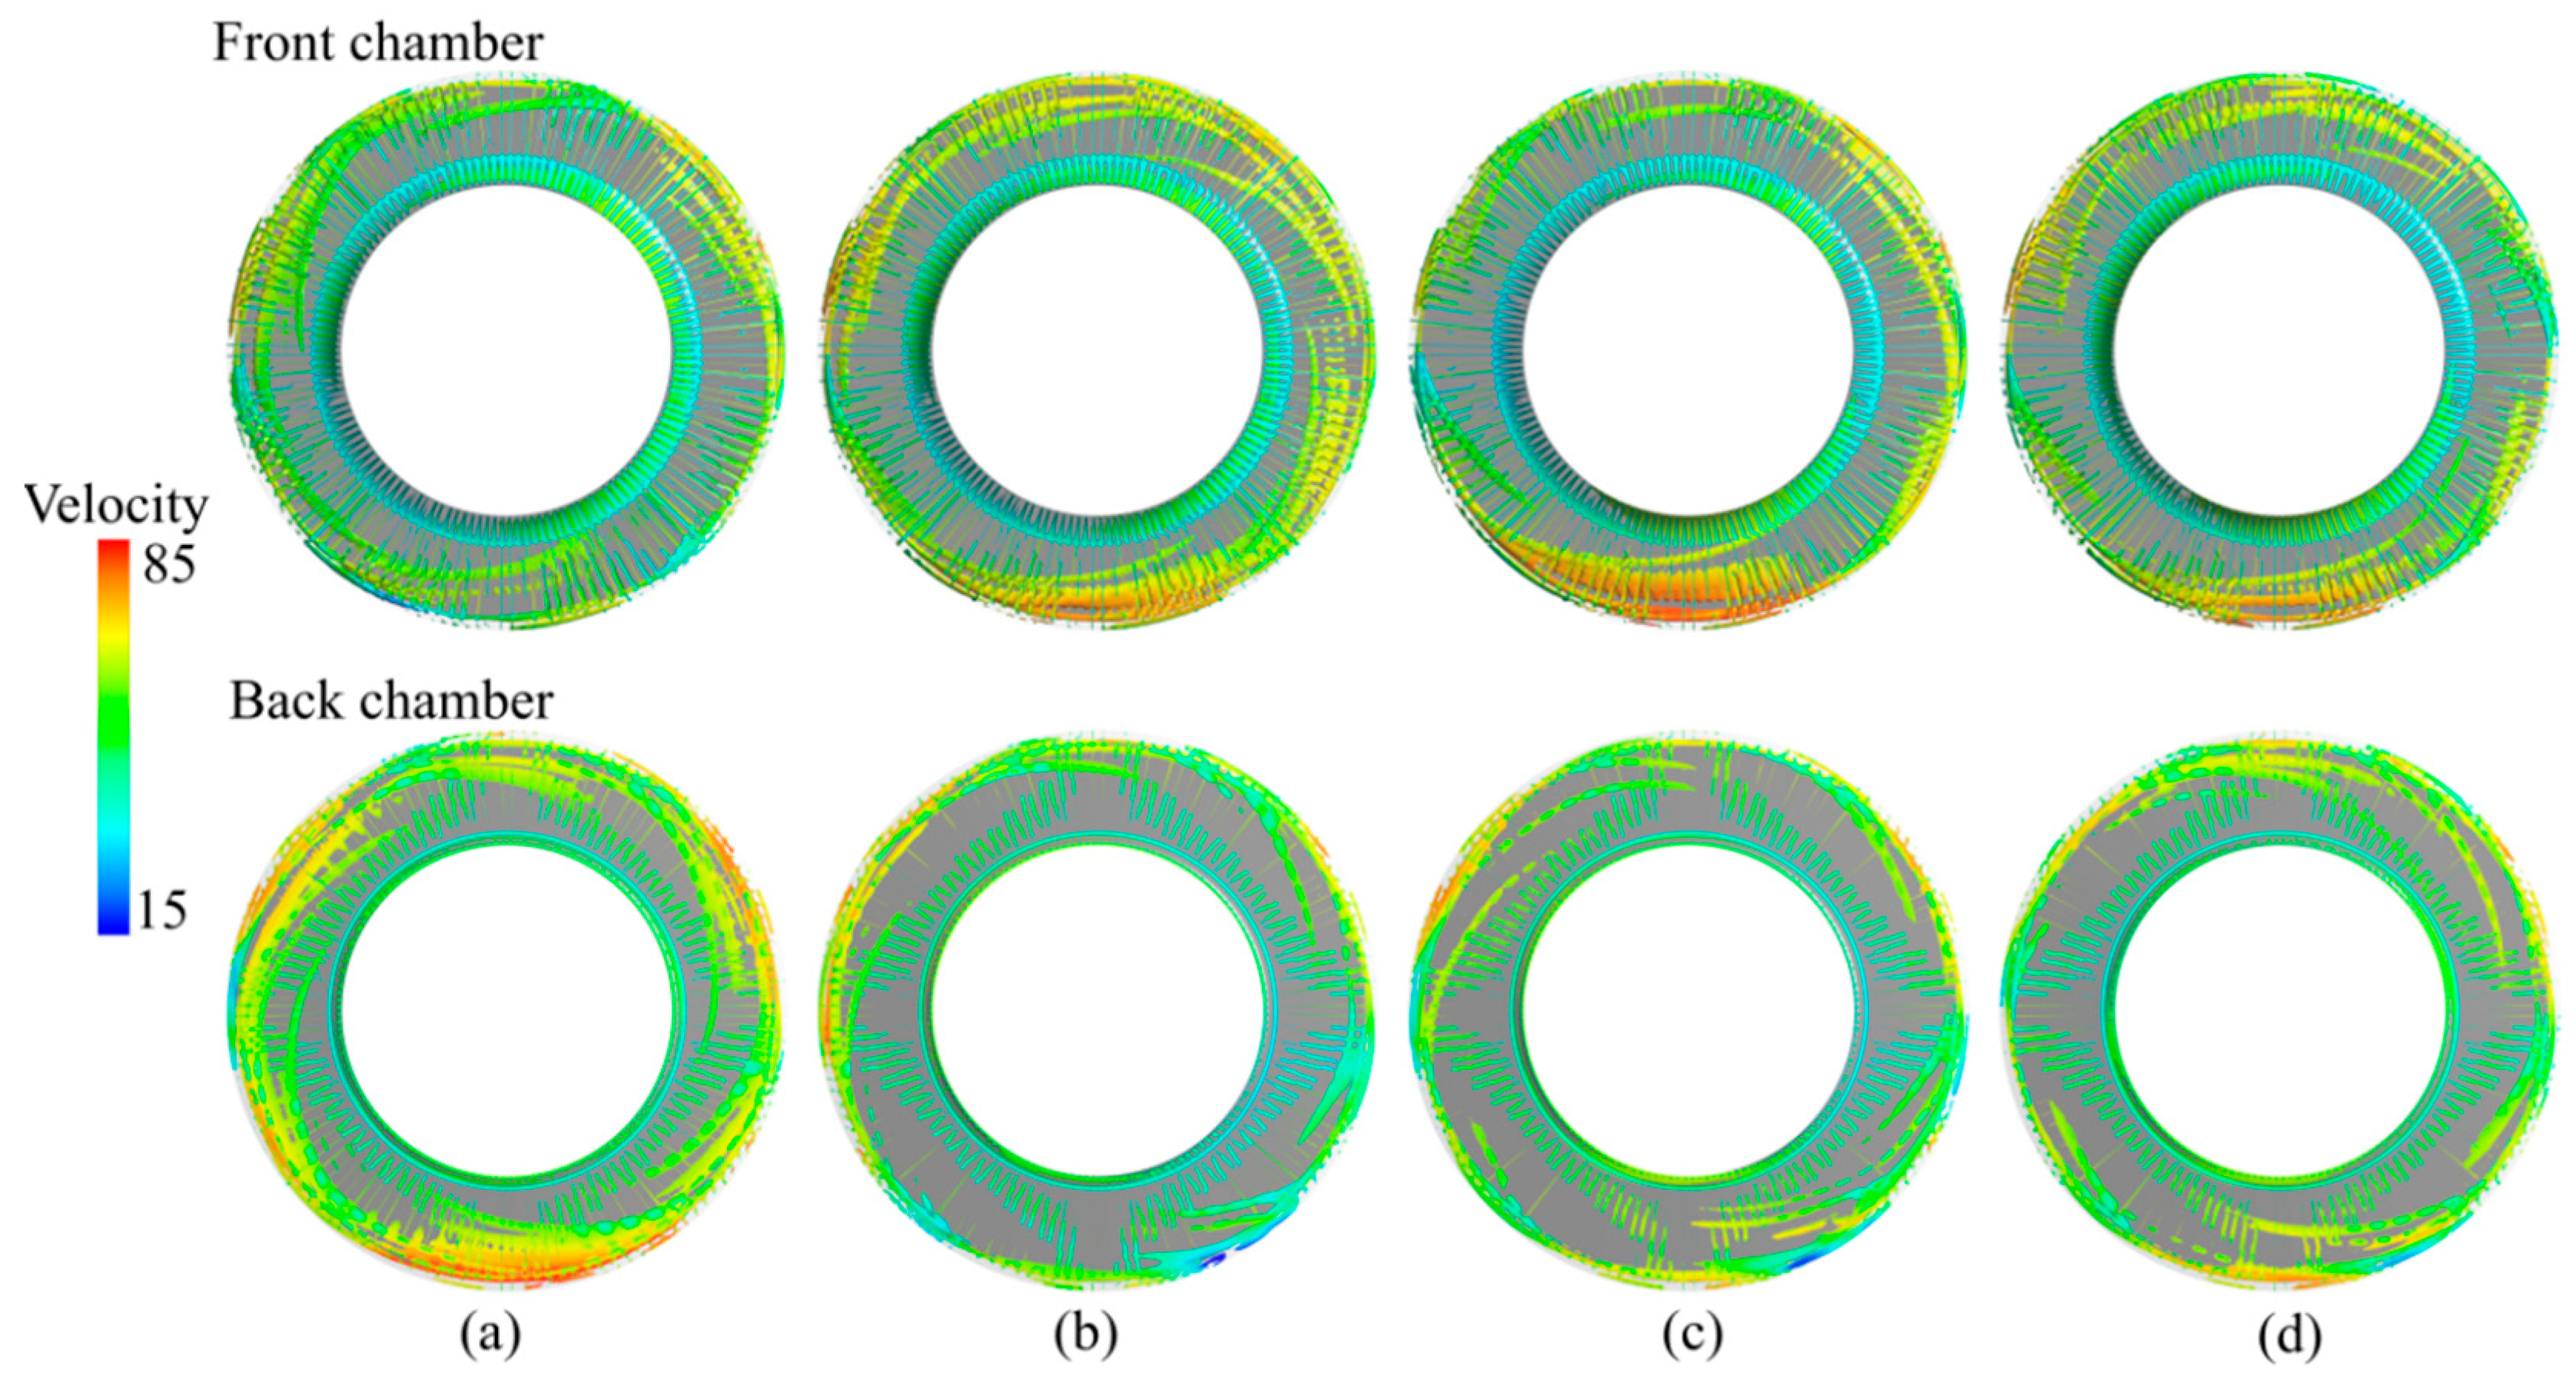
Figure 14 presents the vorticity distribution in the front and back chambers of the centrifugal pump, with the velocity field visualized through color mapping. In the front chamber, Case 1 manifests a homogenous velocity profile, lacking distinct high-velocity zones, and exhibits low vorticity values with a uniform spatial distribution. For Cases 2 and 3, as the tooth height of the seal structure incrementally increases, a corresponding rise in vorticity magnitude is observed, accompanied by the emergence of discrete high-velocity regions. This behavior indicates that the optimization of tooth height enhances the impeller shroud capacity to confine and direct the fluid flow, leading to the concentration of kinetic energy within the anterior chamber. Consequently, this promotes the formation of coherent vorticity structures, which in turn significantly improves the energy transfer efficiency between the impeller and the working fluid. Conversely, in Case 4, a notable reduction in both vorticity and velocity magnitudes is evident, suggesting that an overly elevated tooth height induces the dissipation of kinetic energy, thereby inhibiting the generation of effective vortices. In the back chamber, Case 1 exhibits substantially higher vorticity levels compared to the other Cases, a phenomenon directly attributable to the compromised seal performance associated with its relatively low tooth height. This results in significant fluid leakage into the posterior chamber, inducing substantial flow perturbations. In contrast, Cases 2 and 3 demonstrate minimal vorticity values, indicative of optimized flow patterns within the posterior chamber. However, in Case 4, vorticity levels increase once again, accompanied by the emergence of localized high-velocity flow regions. These results underscore the crucial role of tooth height in modulating flow dynamics and energy transfer processes within centrifugal pump chambers.
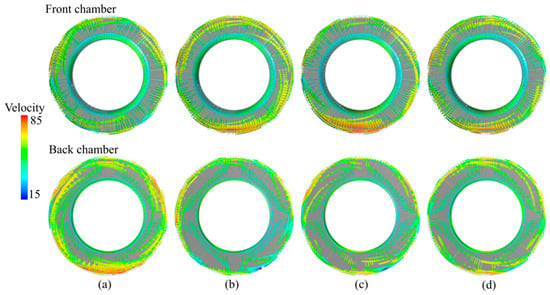
Figure 14.
Vorticity distribution in leakage chambers: (a) Case 1, (b) Case 2, (c) Case 3, and (d) Case 4.
5.4. Analysis of Pressure Pulsation
5.4.1. Pressure Pulsation in Seal Rings
To better analyze pressure pulsation, the pressure at the monitoring points is standardized and dimensionless processed, resulting in the pressure coefficient, represented by Cp, which can be calculated using Equation (16):
where p(ti) is the pressure value at ti moment, t0 is the start time of sampling, is the time-averaged pressure value at a sampling point, ρ is the density of the fluid medium, and u is the tangential velocity at the impeller outlet. The obtained pressure coefficient is then transformed into the frequency domain using FFT (Fast Fourier Transform), with the distribution of monitoring points depicted in Figure 1. The impeller speed is 9685 rpm, with the shaft frequency fr = 161.41667 Hz and the blade passing frequency fBPF = 968.5 Hz.
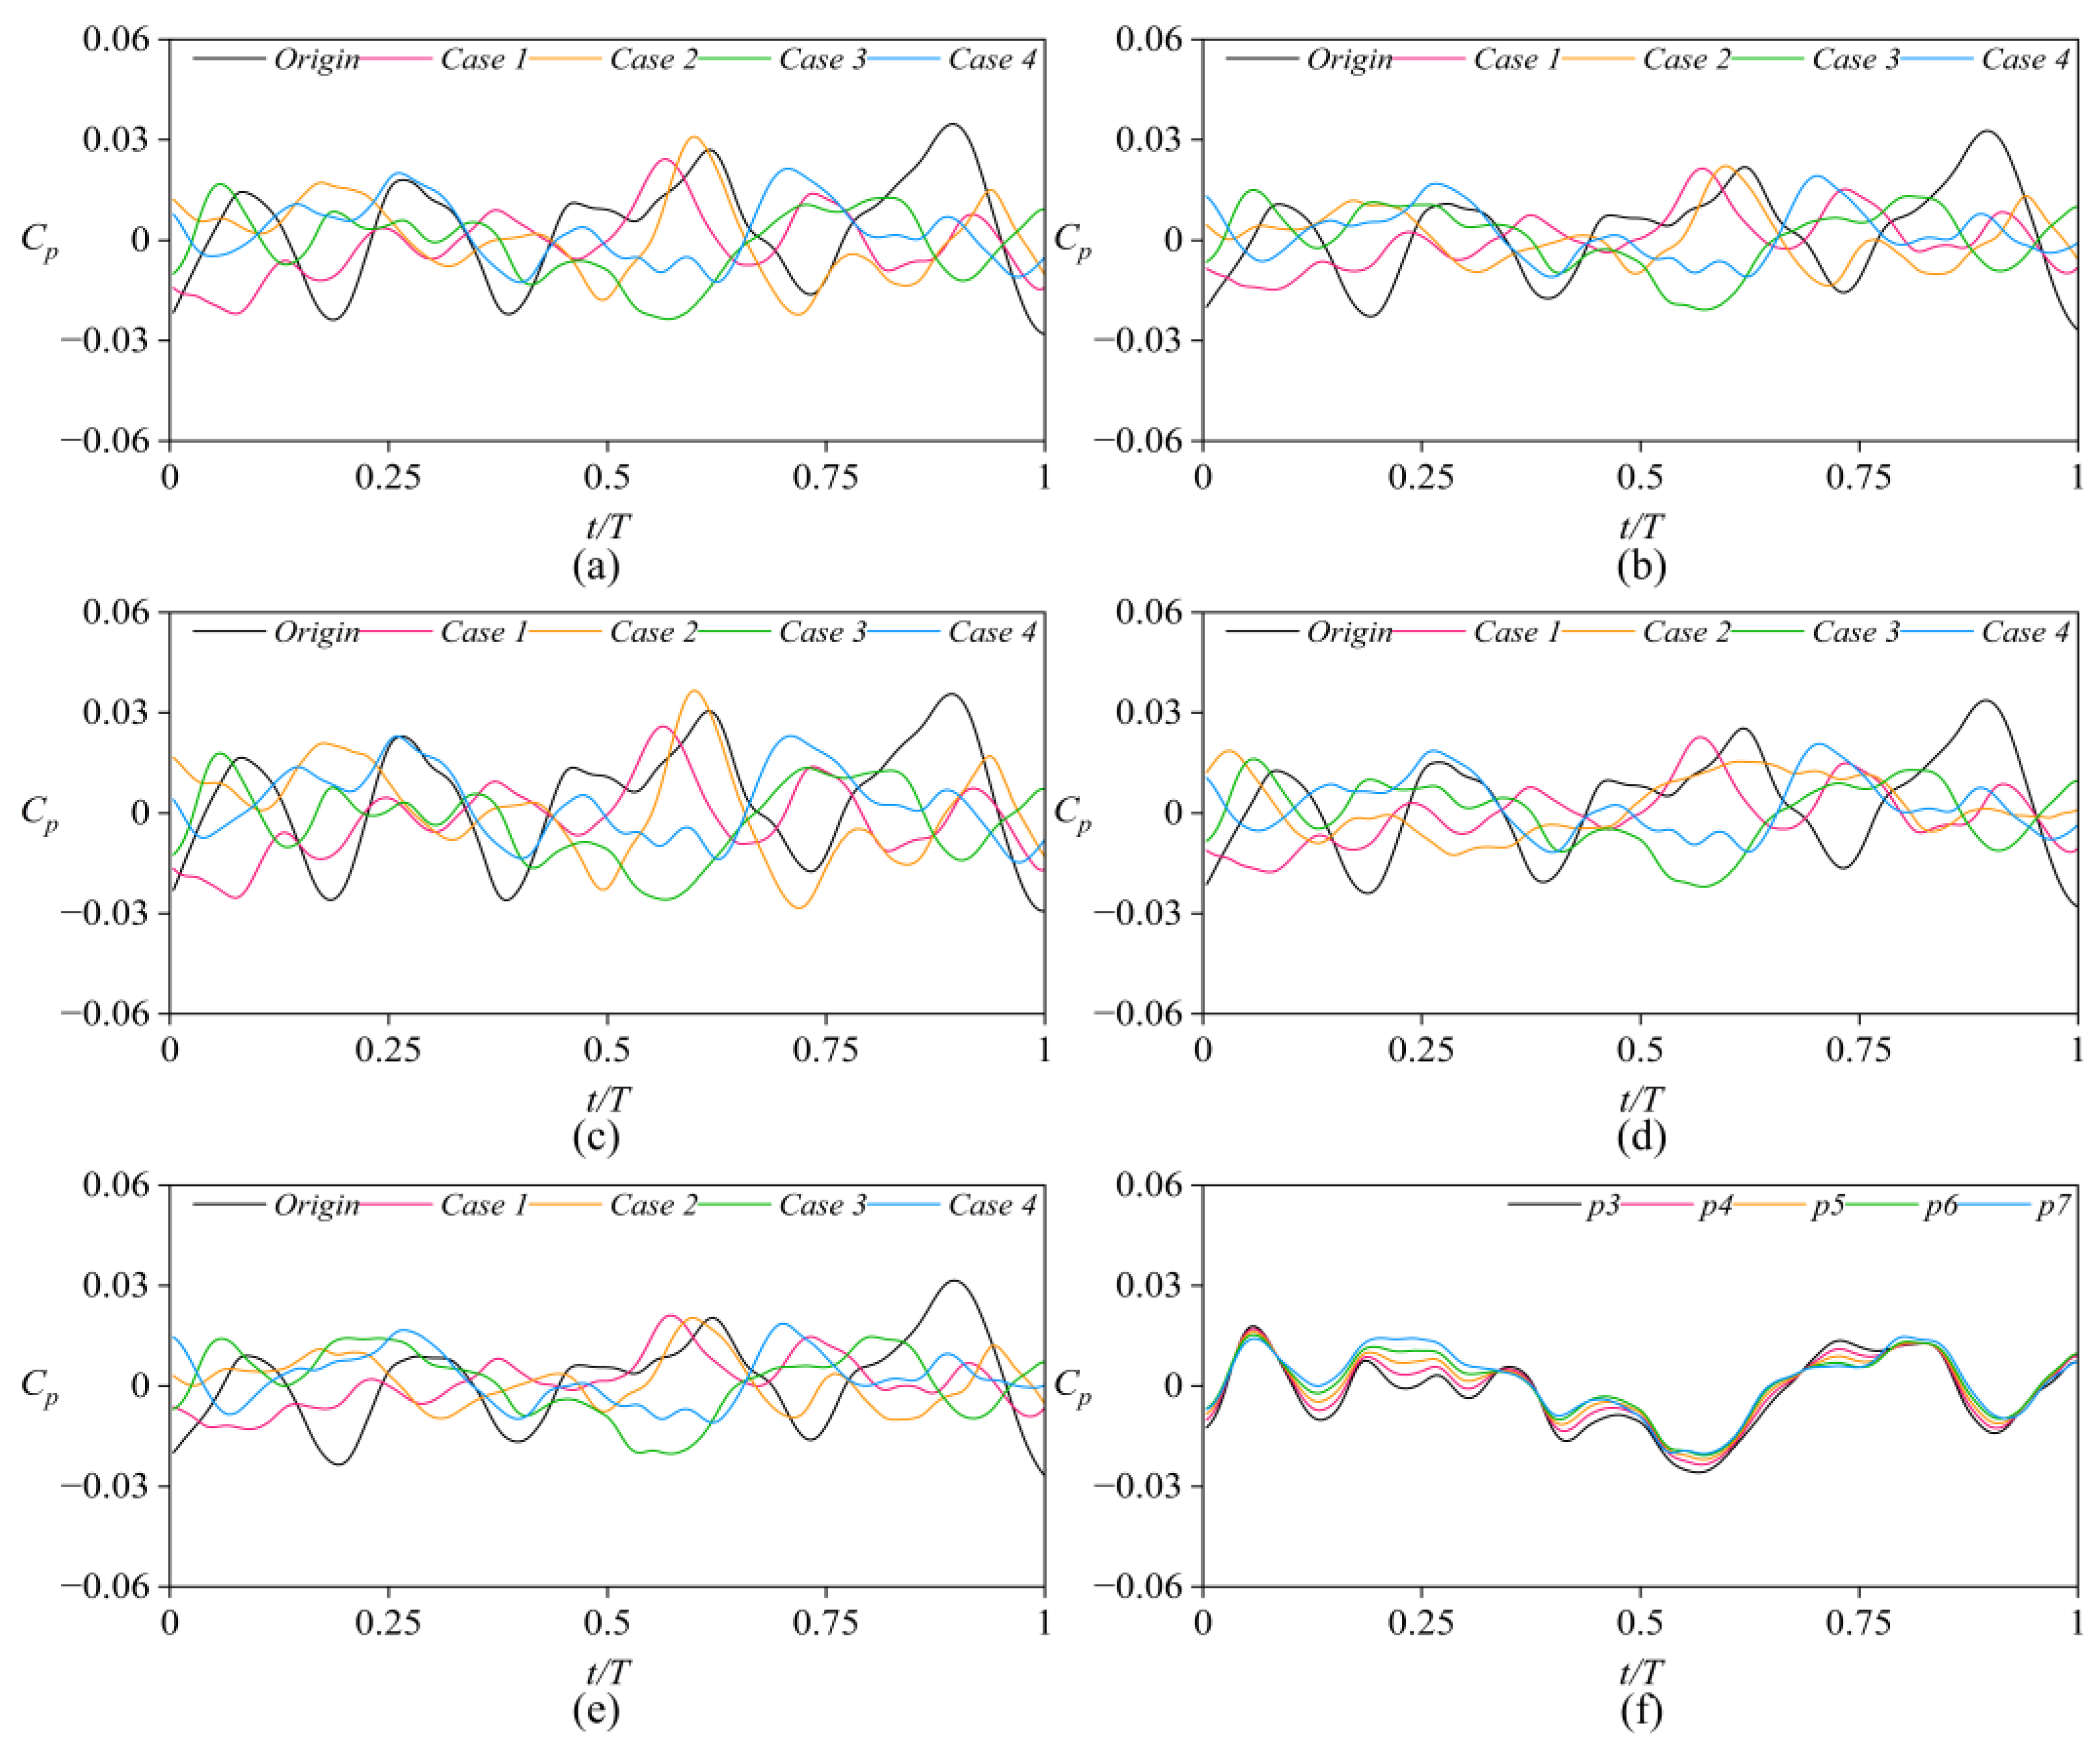
Figure 15 presents the time–domain plot of the pressure coefficient at the front seal monitoring points. We can see that the black line (Origin) fluctuates to a relatively large extent, while the fluctuations in other cases are somewhat reduced. Additionally, changes in the seal ring also influence the phase of these fluctuations. The pressure pulsation within the same case is very similar, as shown in Figure 15f.
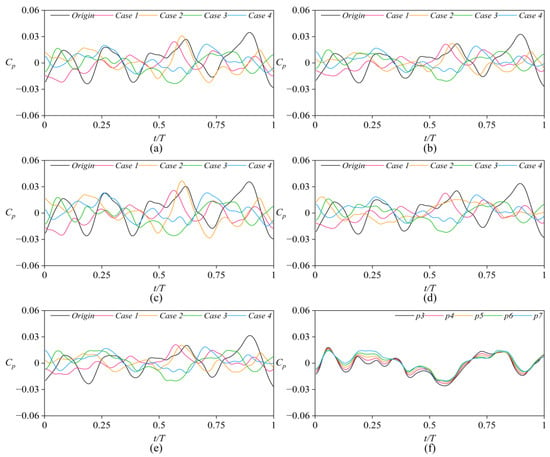
Figure 15.
Time–domain pressure coefficient of front seal ring for monitoring points (a) p1, (b) p2, (c) p3, (d) p5, (e) p7, and (f) monitoring points of Case 3.
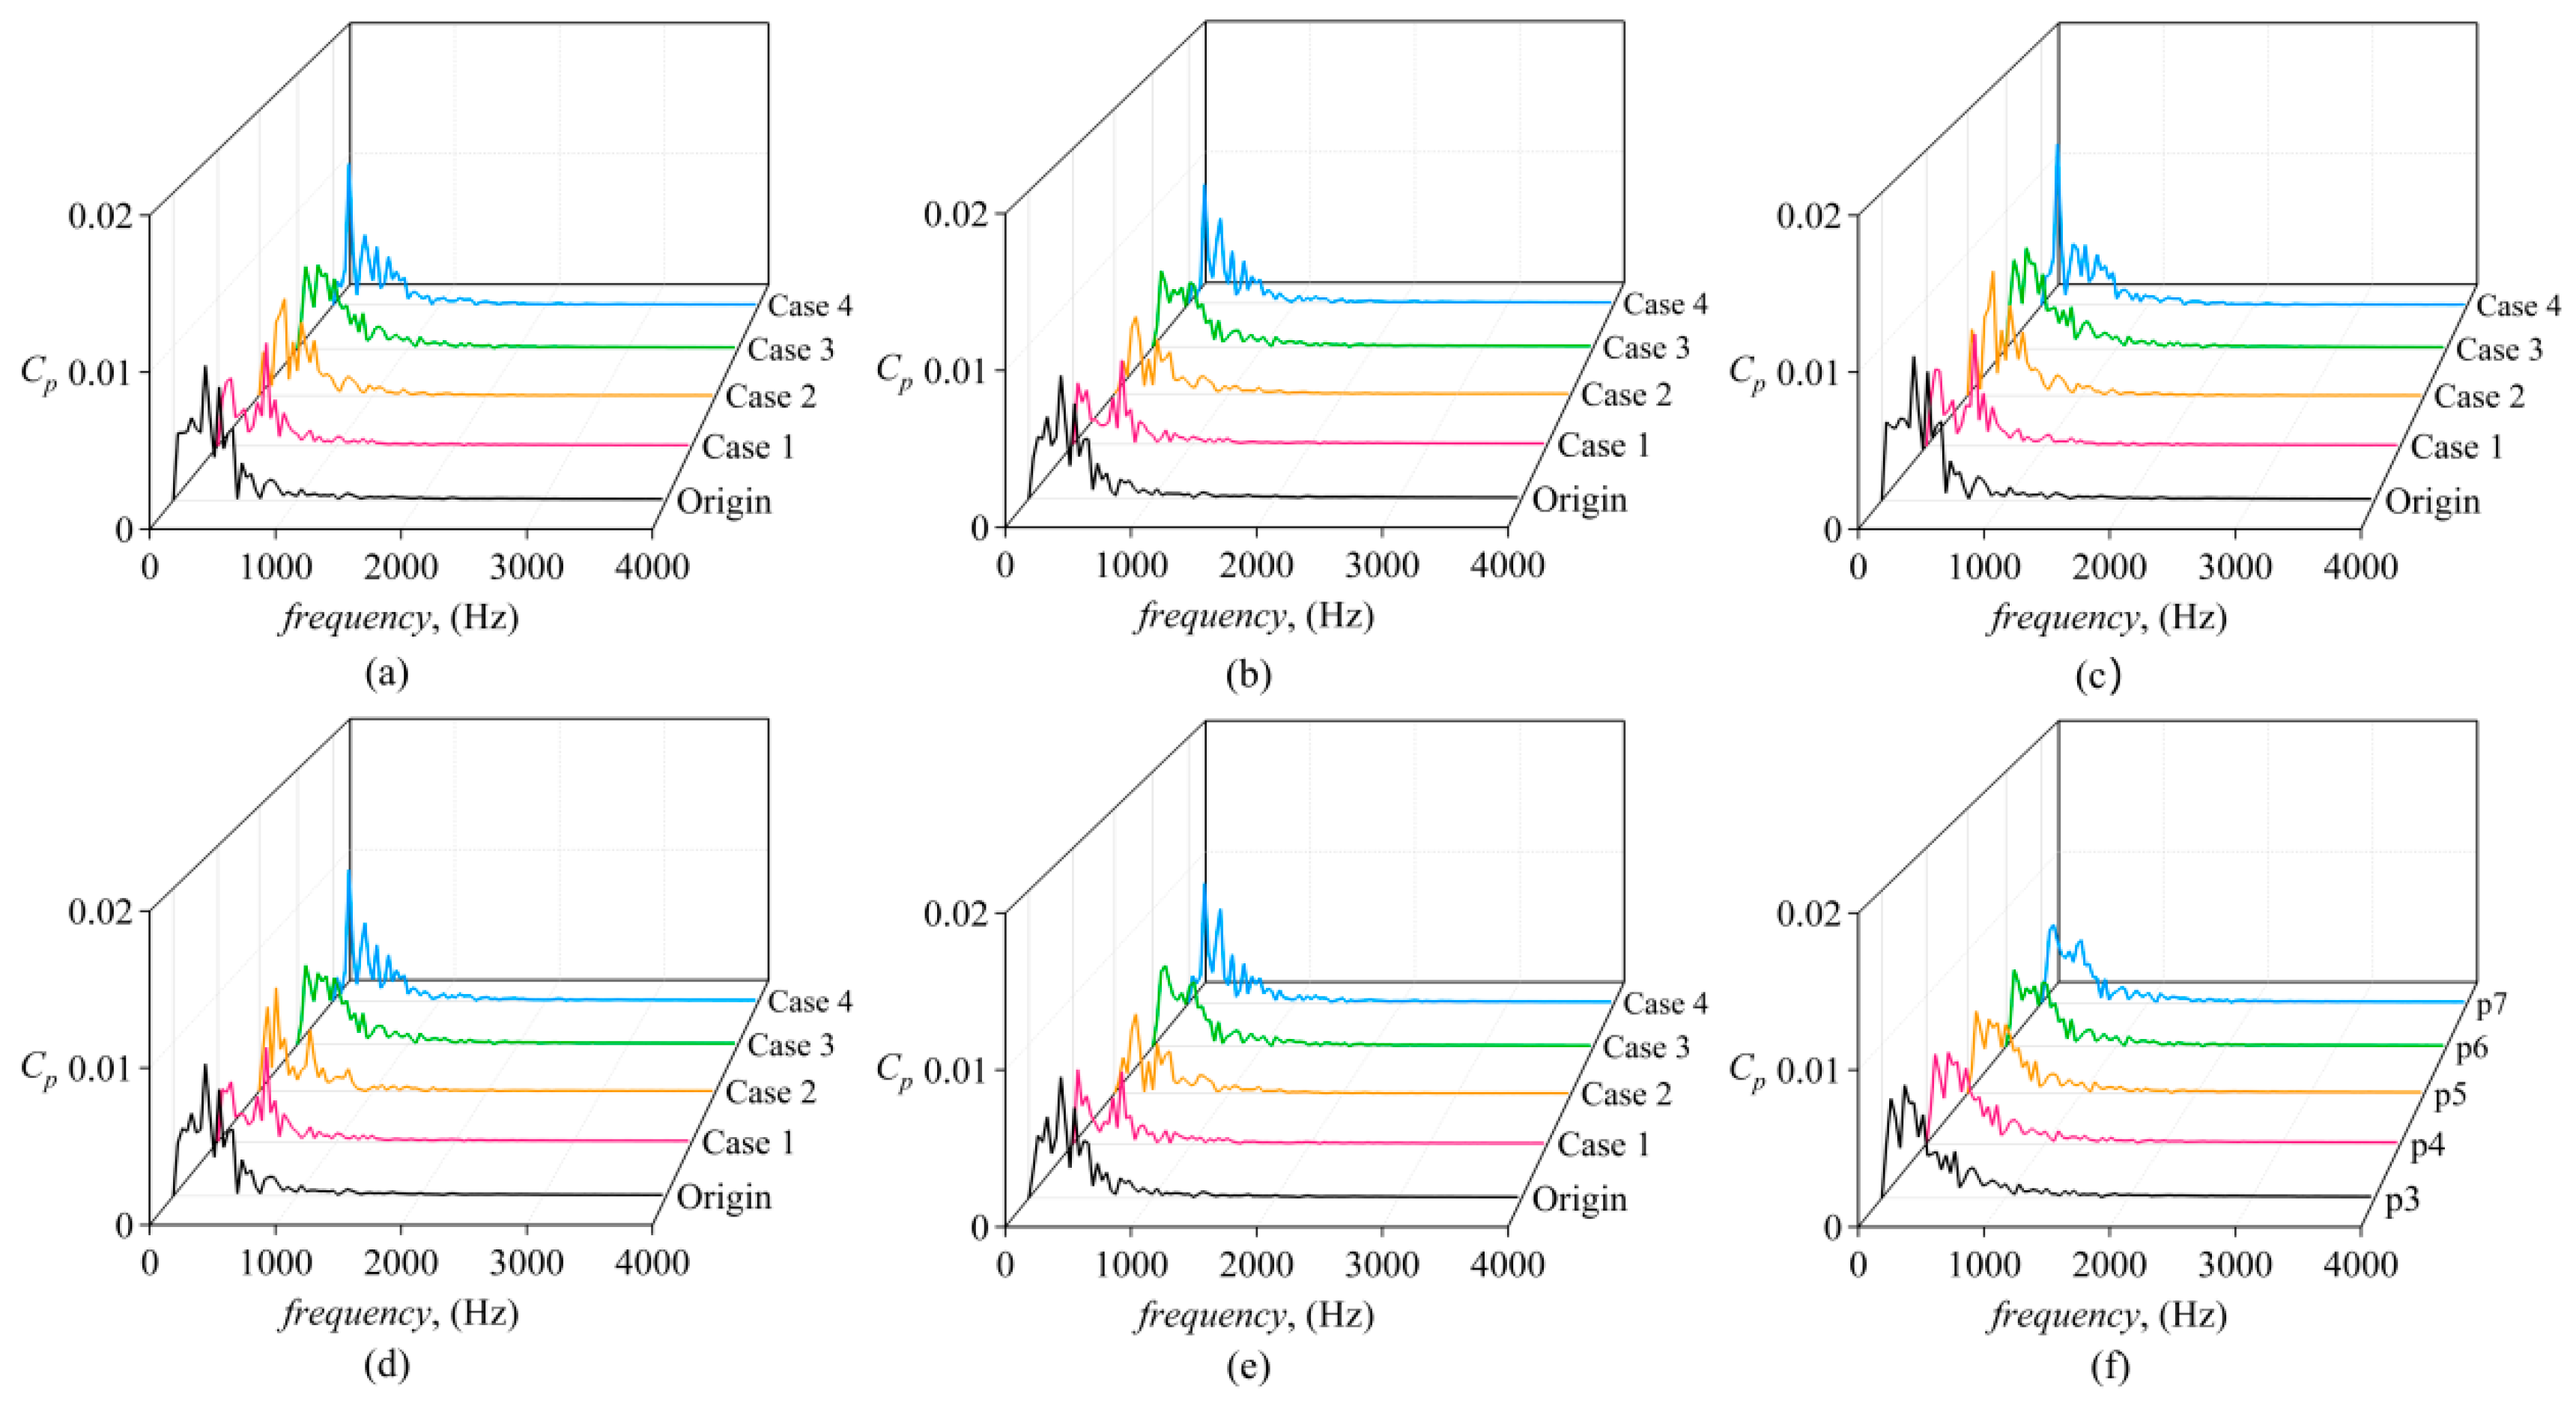
Figure 16 presents the frequency–domain plots for different monitoring points. In the low-frequency range, it can be observed that the amplitude of pressure pulsation in the Origin case is relatively high, with the maximum value reaching 0.00877. In Case 1, Case 2, and Case 3, where the tooth height gradually increases, the maximum amplitude of pressure pulsation in the low-frequency range is lower than in the Origin case. Combining this with the flow field analysis in the previous section, it can be concluded that optimizing the tooth shape can effectively reduce pressure pulsation. In Case 4, the highest amplitude occurs at 161.41667 Hz, with the amplitude reaching about 0.012. Figure 16f shows the frequency–domain plots for different monitoring points in Case 3. It can be observed that the pressure fluctuation trends at different monitoring points exhibit a certain degree of similarity. For p3–p7, the pressure pulsation shows a decreasing trend, and the maximum difference between adjacent monitoring points at the same frequency does not exceed 0.005.
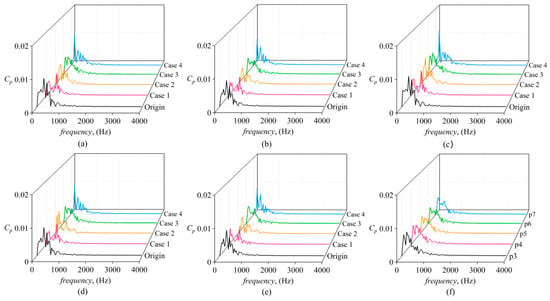
Figure 16.
Pressure spectra of the front seal ring for monitoring points (a) p1, (b) p2, (c) p3, (d) p5, (e) p7, and (f) monitoring points of Case 3.
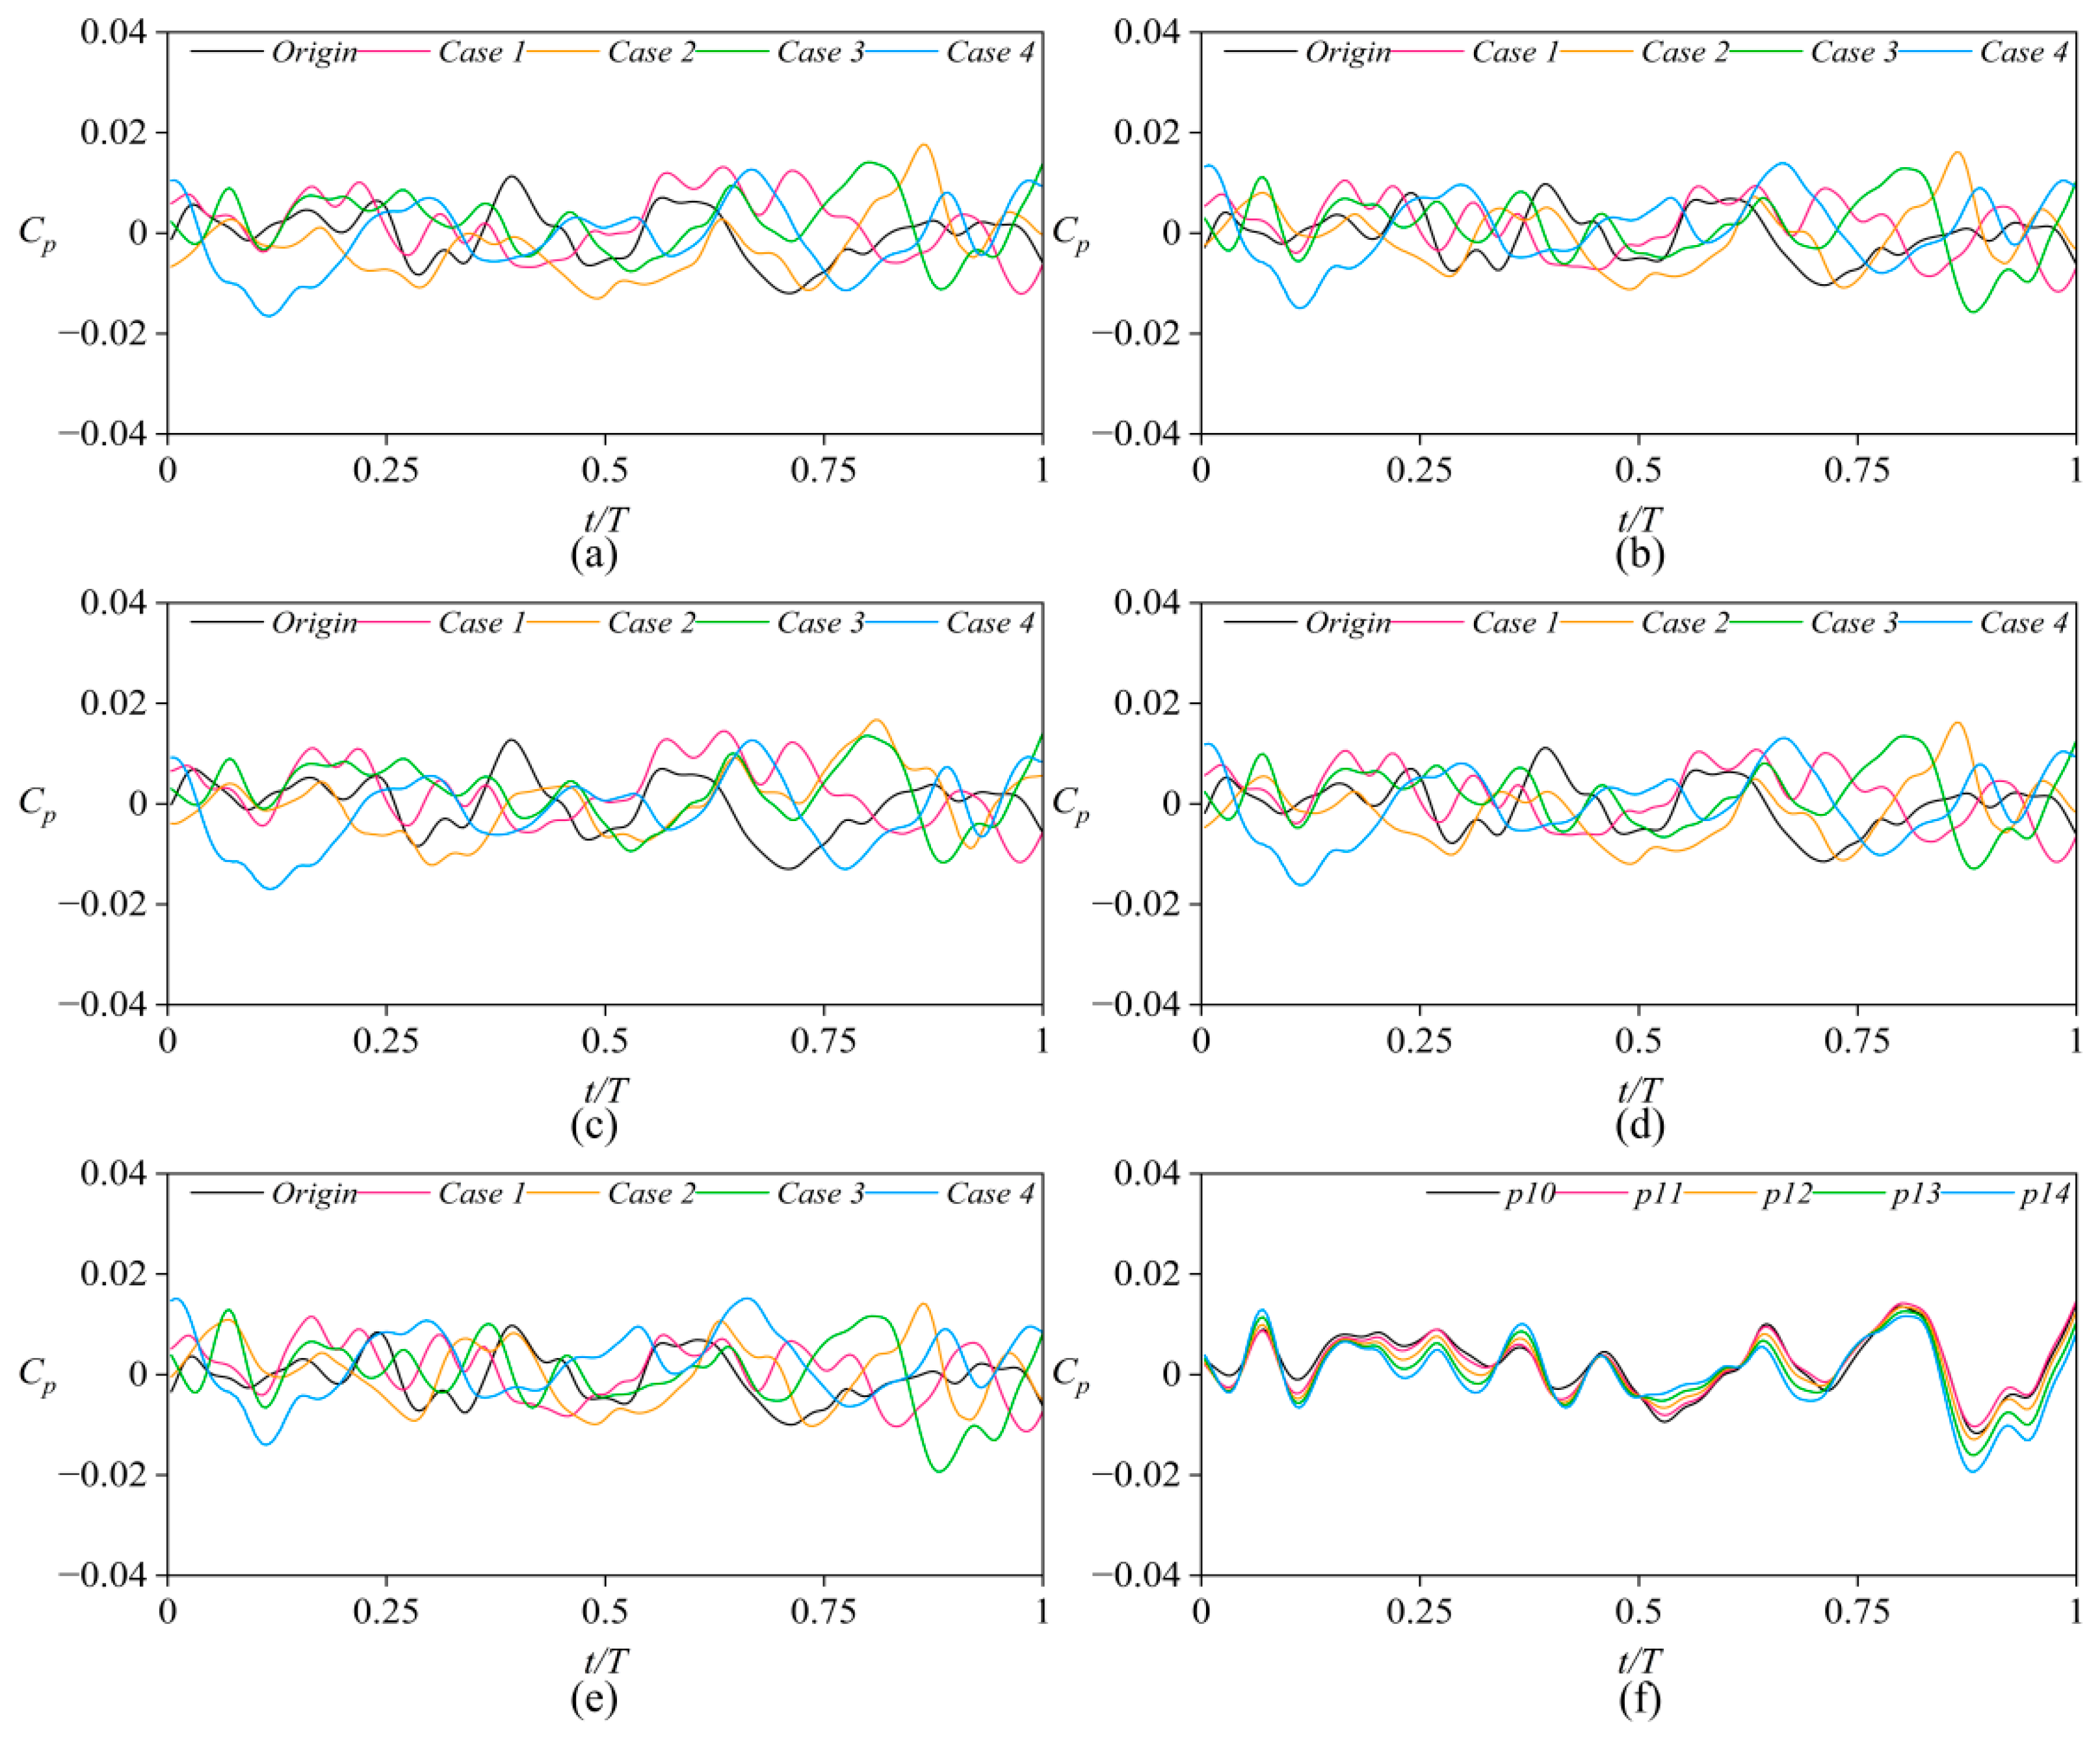
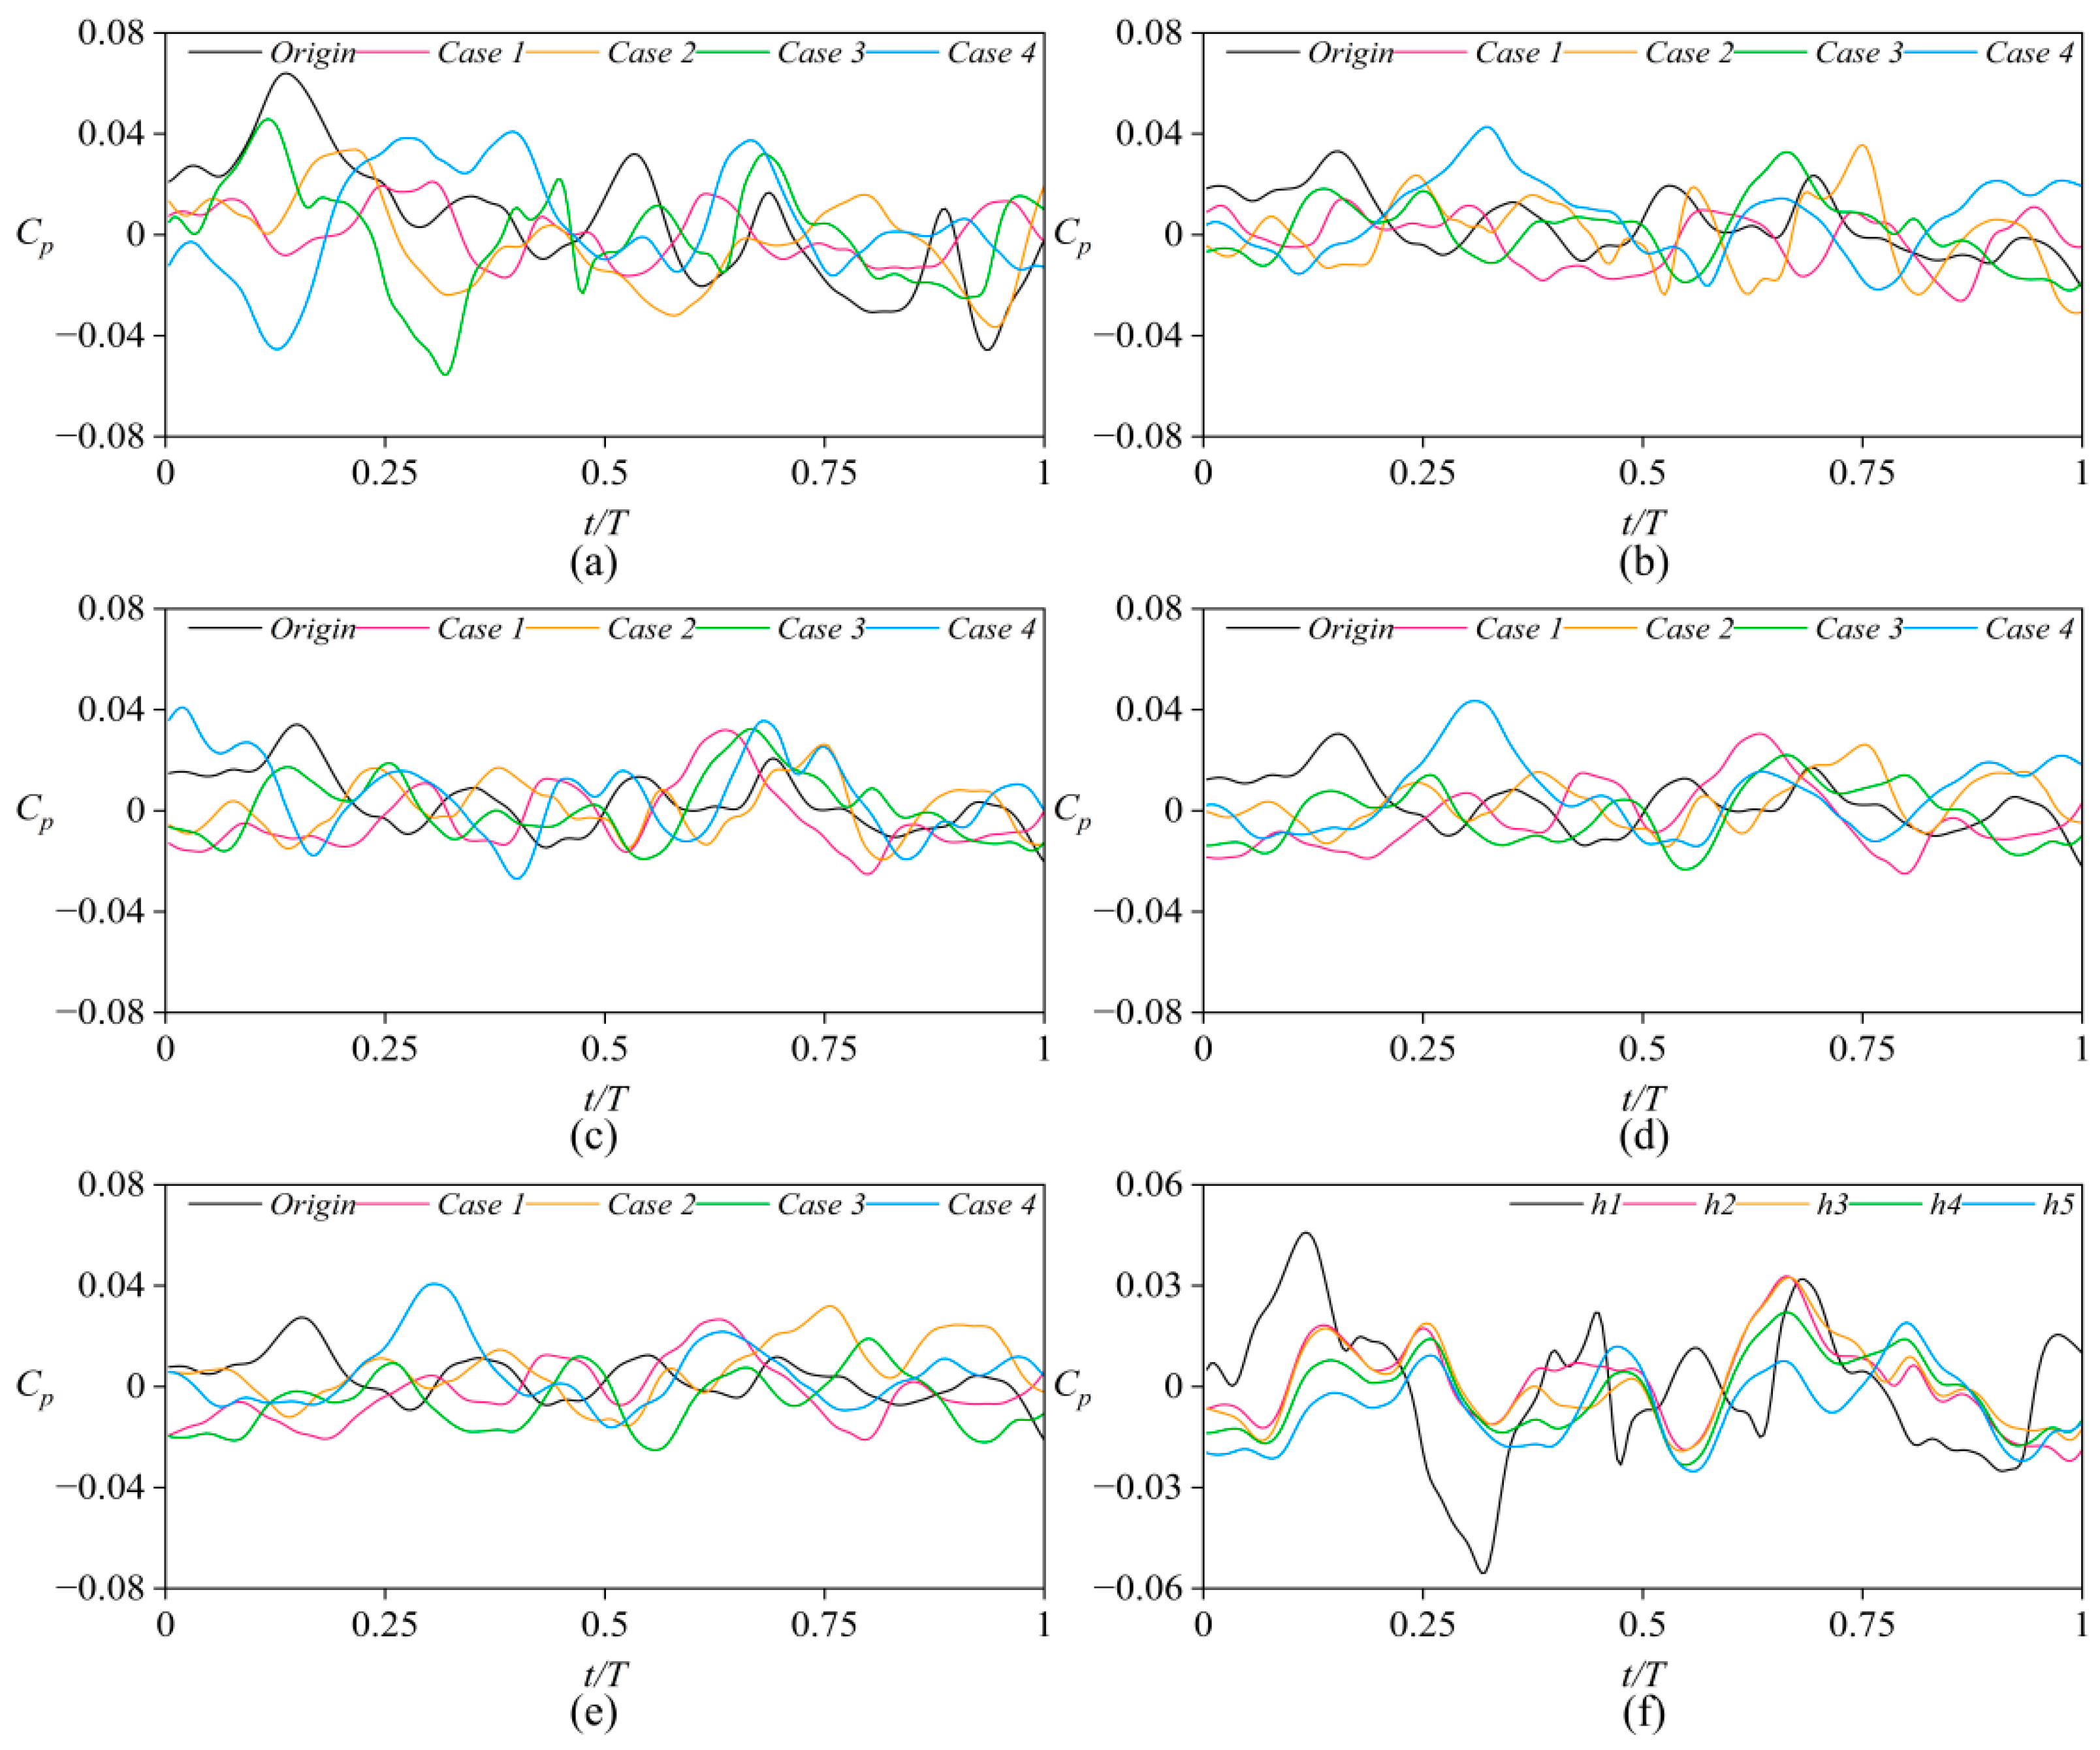
Figure 17 presents the time–domain plot of the pressure coefficient at the back seal ring. In Case 1, the curve shows some changes due to the increased turbulence intensity of the gap flow caused by the low tooth height. In Case 2, a high-frequency oscillation is clearly visible on the curve, reflecting the local turbulence intensity enhancement, which is consistent with the flow field analysis in the previous section. In Case 4, there is a certain delay in the waveform when the tooth height is at its maximum. Figure 17f shows the time–domain plots of different monitoring points in Case 3. The results are similar to those of the front seal ring, with the fluctuation trends of different monitoring points being the same.
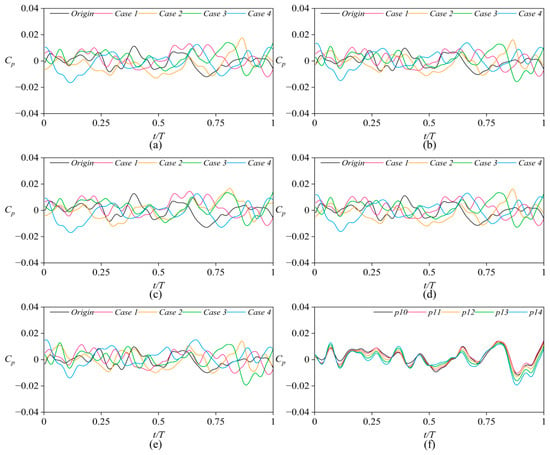
Figure 17.
Time-domain pressure coefficient of the back seal ring for monitoring points (a) p8, (b) p9, (c) p10, (d) p12, (e) p14, and (f) monitoring points of Case 3.
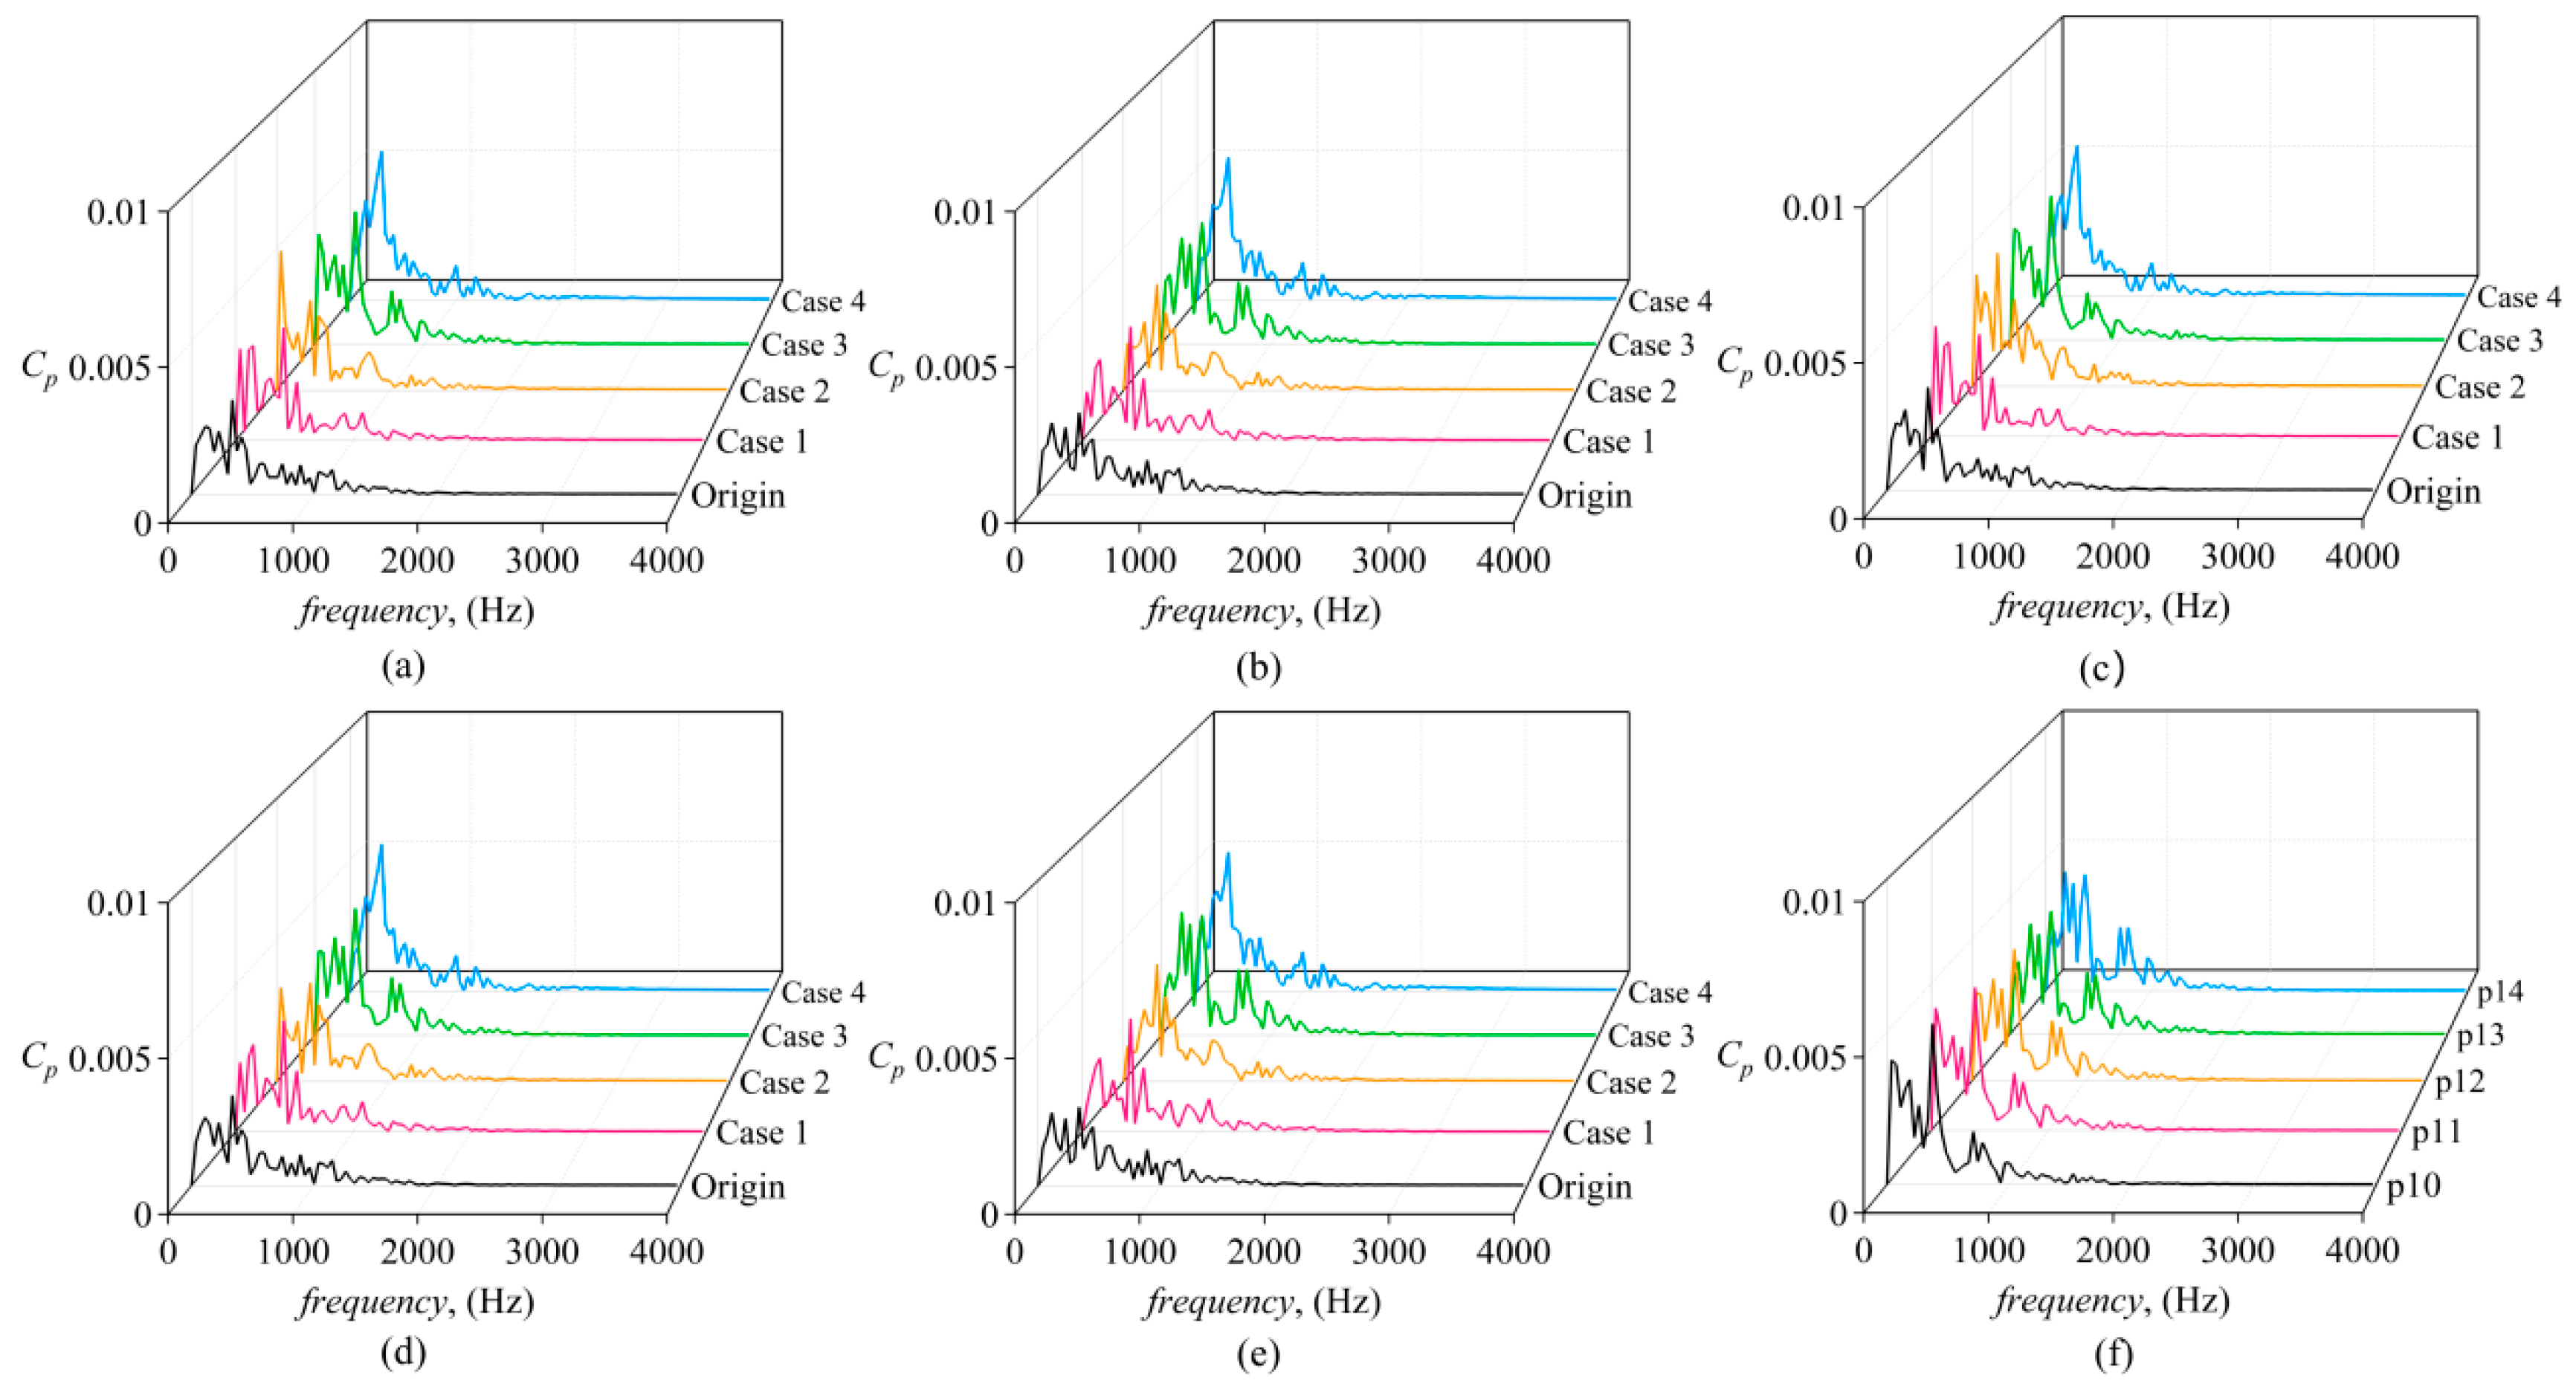
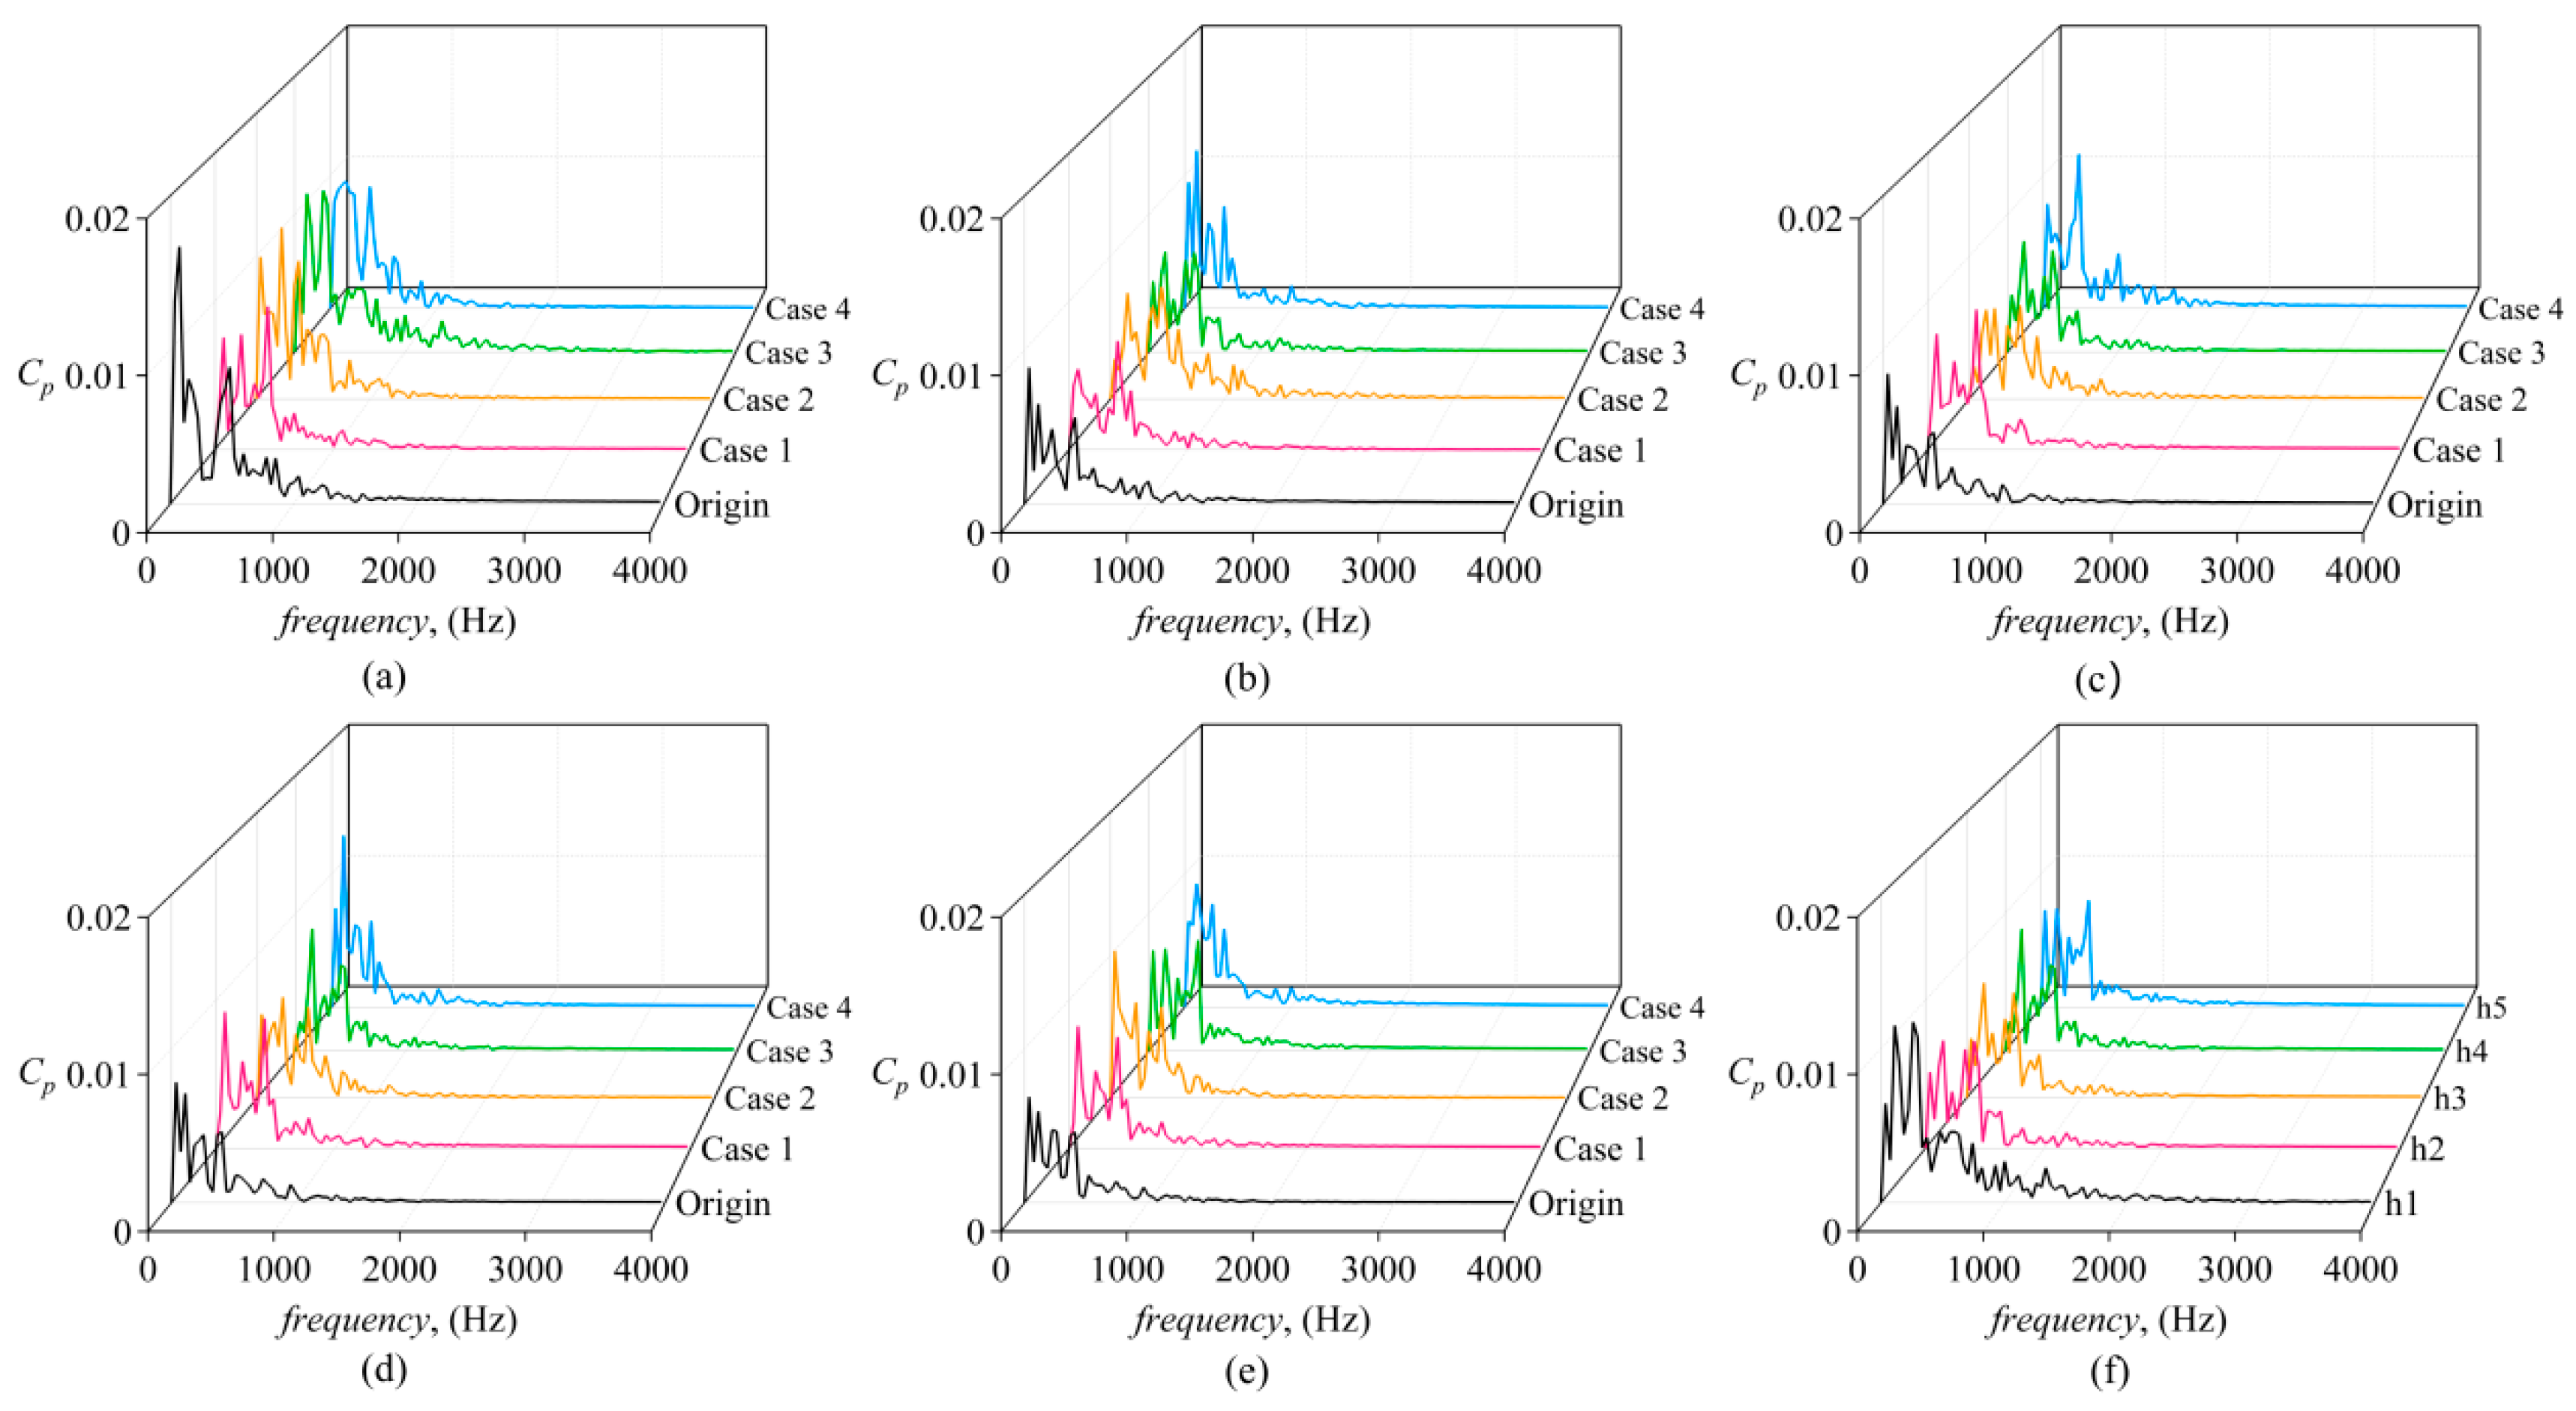
Figure 18 presents the frequency–domain plots of different monitoring points at the back seal ring. Overall, the pressure pulsation of the back seal ring is clearly lower than that of the front seal ring, with a slight increase in high-frequency fluctuations. Compared to the Origin case, Cases 1, 2, and 3 show slight increases in the pressure pulsation, while Case 4 exhibits a more significant increase, with the maximum amplitude reaching 0.0057. As the tooth height increases, the pressure fluctuation amplitudes at frequency fr are as follows: 0.00323, 0.00142, 0.00273, and 0.00382, with Case 2 having the smallest amplitude. Figure 18f compares the pressure pulsation at different monitoring points in Case 3. In the plot, a peak value is observed at 403.54 Hz at all monitoring points, with p10–p14 gradually decreasing. Two distinct and independent peaks are observed at 766.73 Hz and 847.44 Hz, with values gradually increasing from p10–p14.
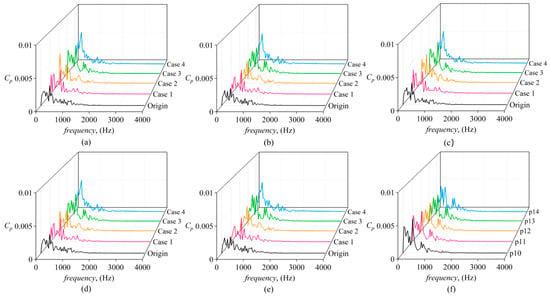
Figure 18.
Pressure spectra of back seal ring for monitoring points (a) p8, (b) p9, (c) p10, (d) p12, (e) p14, and (f) monitoring points of Case 3.
5.4.2. Pressure Pulsation in Leakage Chambers
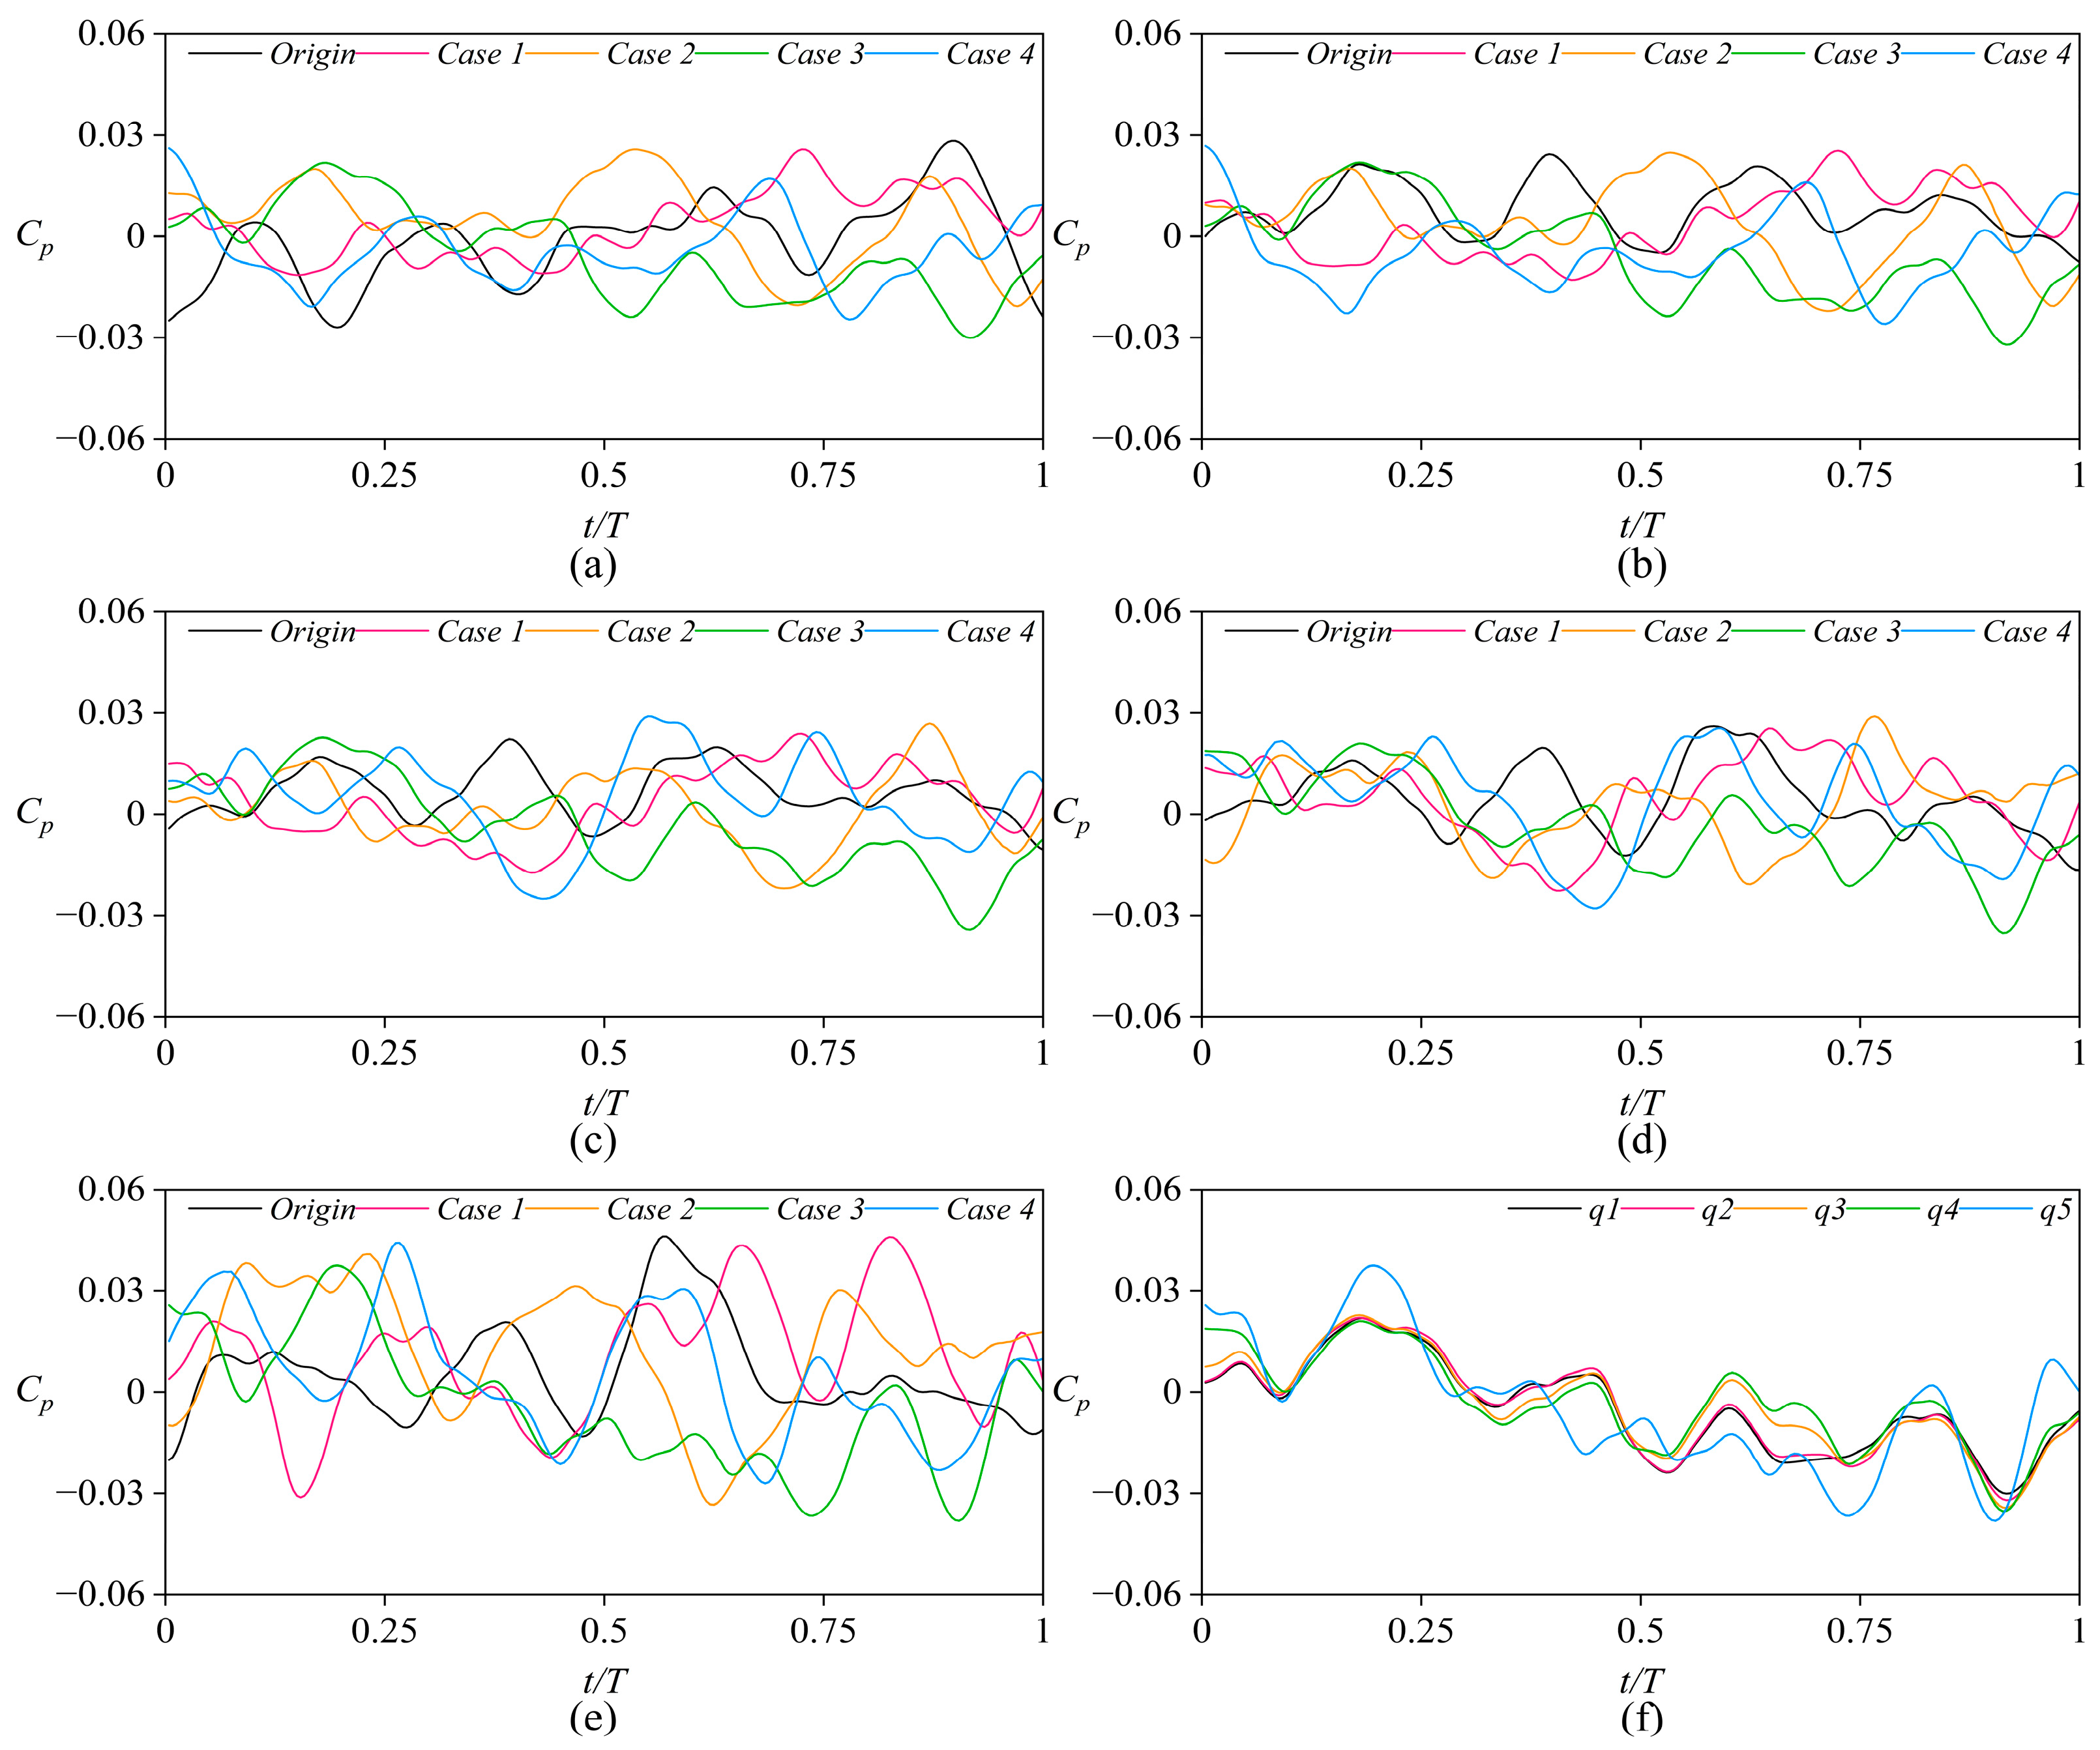
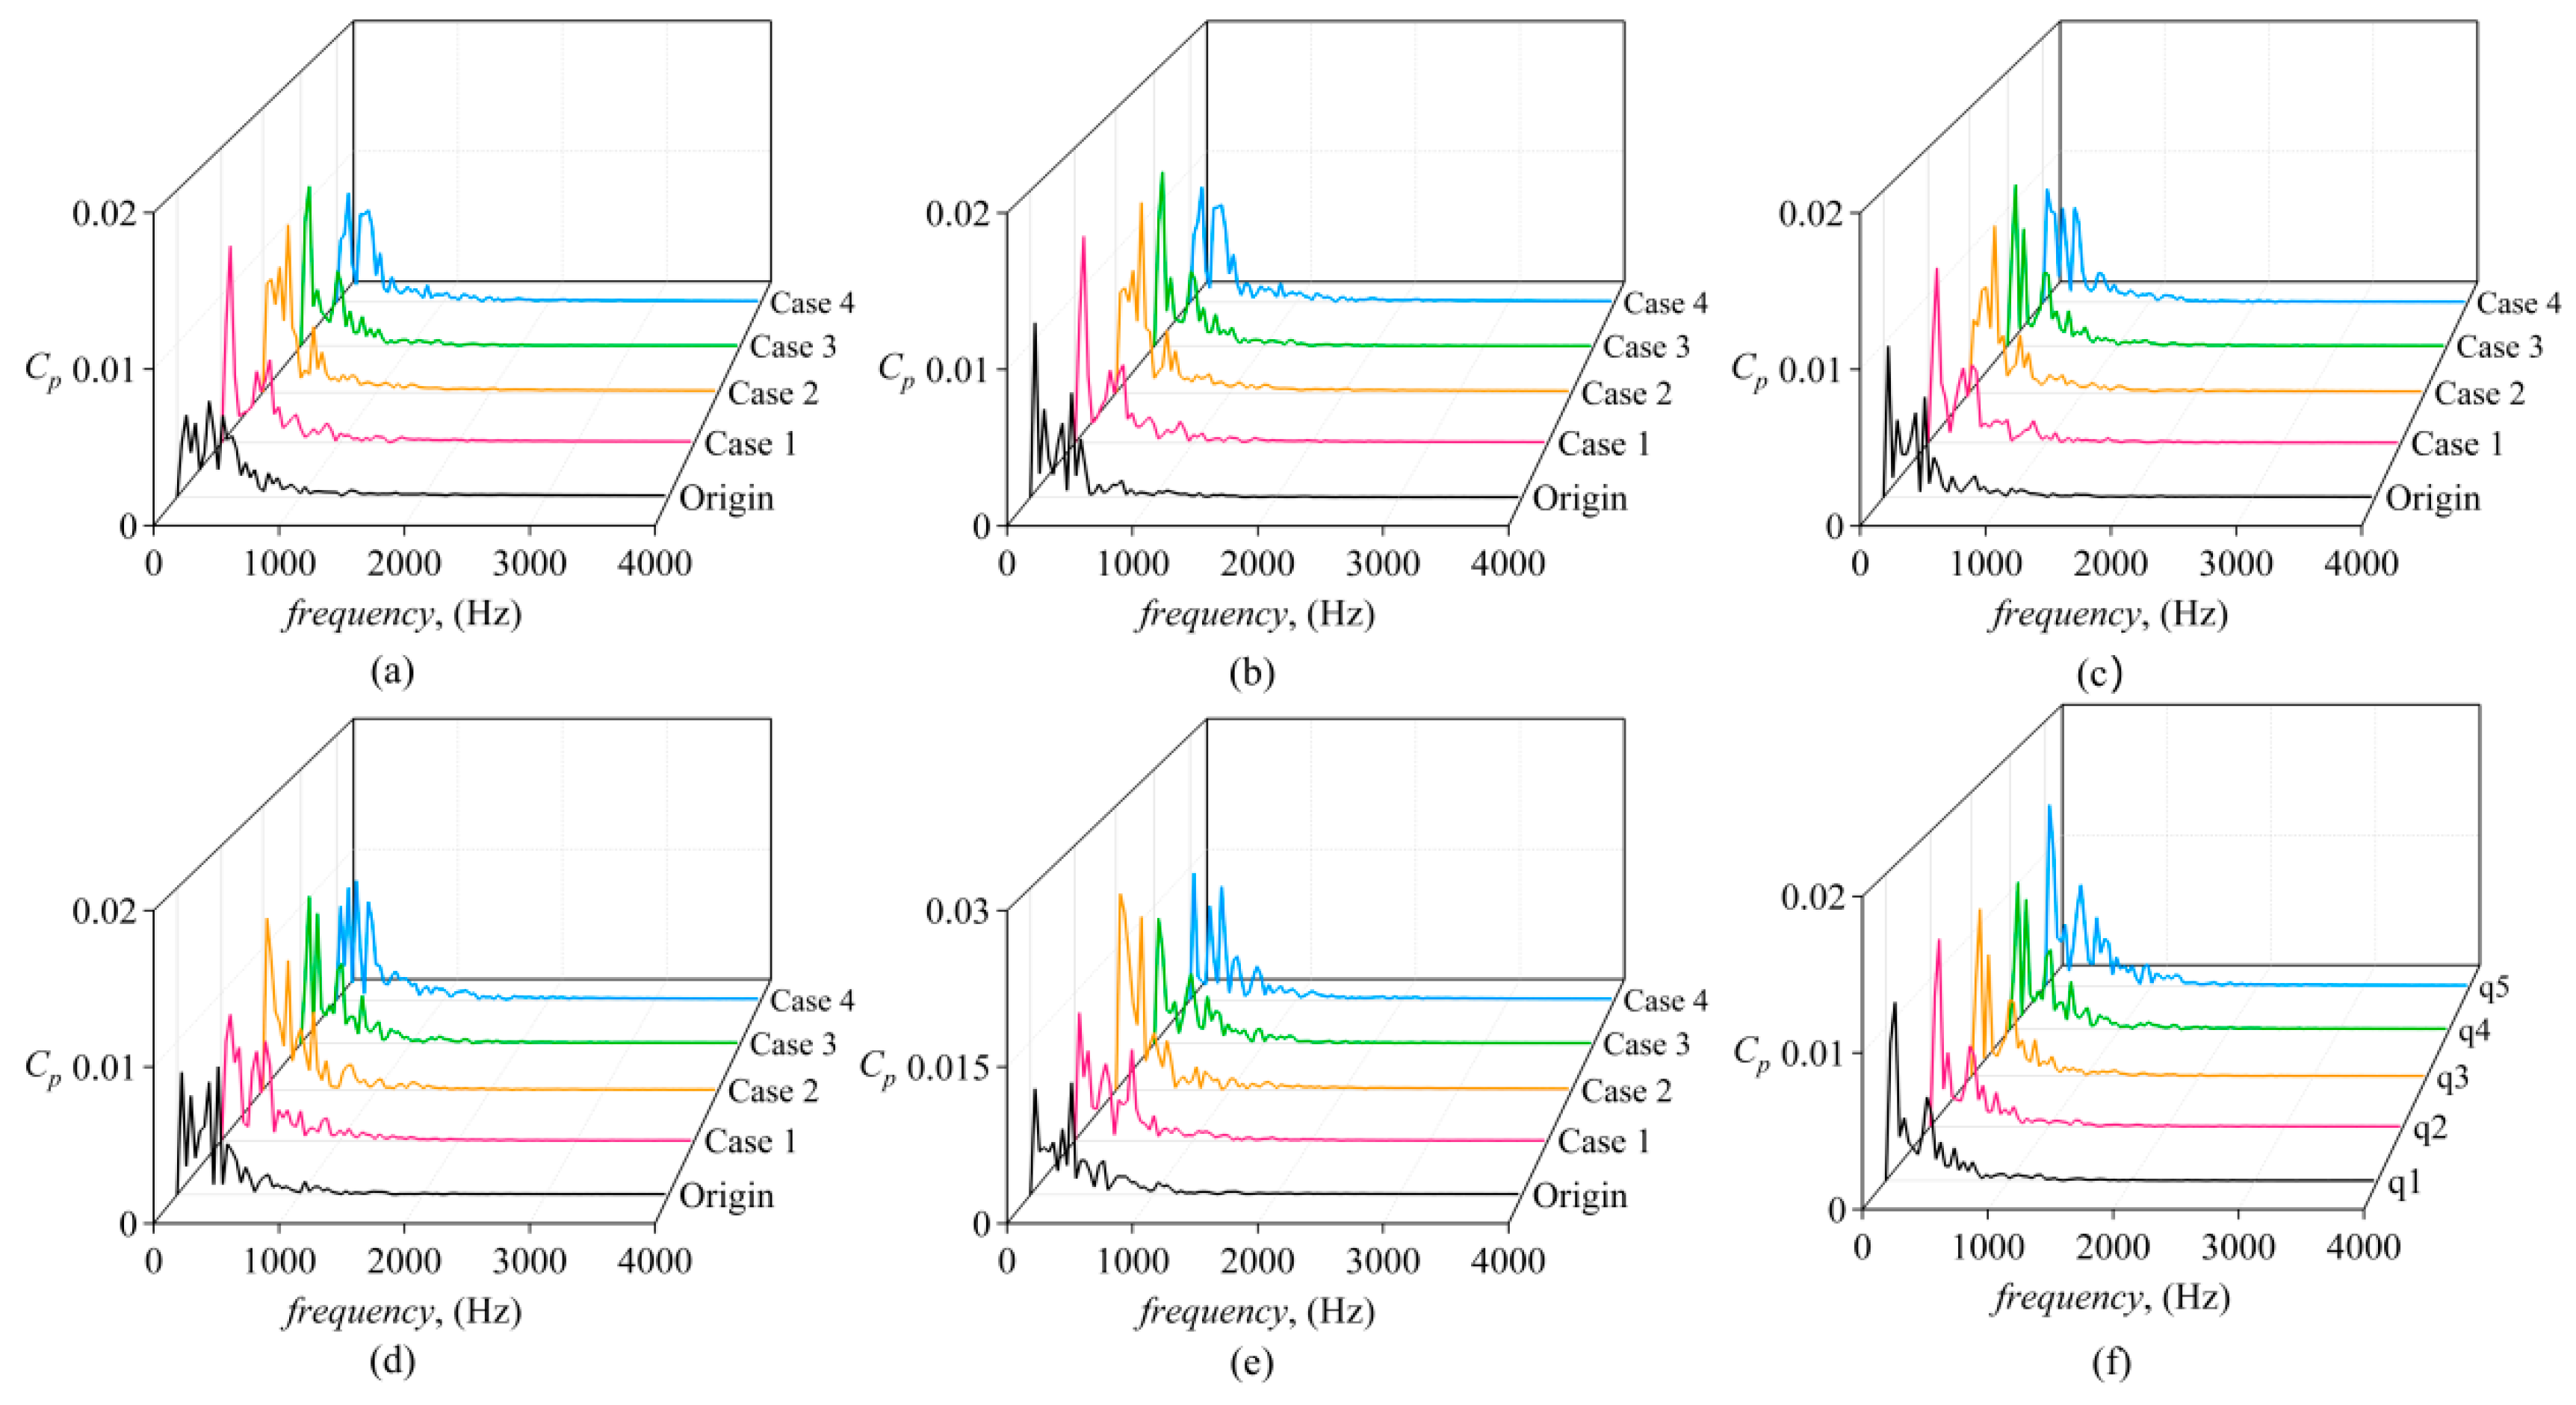
Figure 19 presents the time domain plot of the pressure coefficient at the front chamber monitoring points. The q5 curve in (f) shows a slight deviation from the pressure pulsations at other monitoring points, as the q5 point is located closer to the guide vane and is more affected by it than the other points. Figure 20 shows the pressure pulsation frequency–domain plot of the five monitoring points in the centrifugal pump front chamber. It can be observed from the diagram that there is no obvious regularity in the pressure pulsations inside the Origin structure, with the curve fluctuating chaotically, which also reflects the more turbulent flow field in the front chamber without the seal teeth, indicating stronger flow disturbances. Compared to the Origin, other cases show higher pressure pulsation amplitudes in the 0–500 Hz range, but after 500 Hz, the amplitude of the pressure pulsation improves.
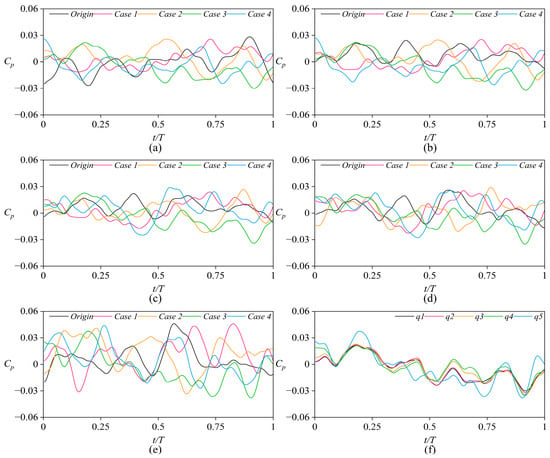
Figure 19.
Time–domain pressure coefficient of the front chamber for monitoring points (a) q1, (b) q2, (c) q3, (d) q4, (e) q5, and (f) monitoring points of Case 3.
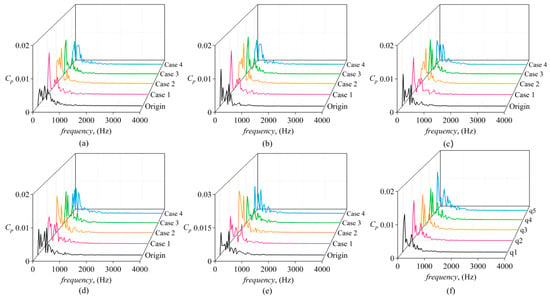
Figure 20.
Pressure spectra of the front chamber for monitoring points (a) q1, (b) q2, (c) q3, (d) q4, (e) q5, and (f) monitoring points of Case 3.
In Figure 20, the variation in pressure pulsation at different monitoring points can be clearly observed. In Case 1 and Case 3, the maximum amplitude of pressure pulsation occurs at 80.71 Hz (0.5fr), with its value exceeding 0.01. In Origin, the maximum amplitude occurs at 40.35 Hz (0.25fr). The values at monitoring points q2, q3, and q5 exceed 0.01, while the values at q1 and q4 are approximately 0.009. In Case 4, the increased height further reduces the pressure pulsation at low frequencies. The q5 monitoring point, being closer to the guide vane, is more prone to vortex formation, and the pressure pulsation here may be related to vortex formation and shedding. Figure 20f presents the pressure pulsation situation at different monitoring points in the front chamber using Case 3 as an example. From the figure, it can be seen that the largest amplitude exceeds 0.01 at 80.71 Hz, and at 363.187 Hz, the amplitude is 0.0054, showing a decreasing trend from q1 to q5. These results indicate that the significant amplitude at 80.71 Hz, along with the half-period rotation of the impeller, has a universal impact on the front chamber and is the main component of the front chamber pressure pulsation. However, the gradual reduction of pressure pulsation at 363.187 Hz suggests the special effect of leakage flow near the seal ring on pressure pulsations. In a word, these results represent the pressure pulsation characteristics of the front chamber.
In Figure 21, it can be seen that the pressure coefficient variation at the h1 monitoring point is more pronounced compared to other monitoring points. The pressure coefficient variation at each monitoring point changes distinctly with time, reflecting that the flow state and pressure pulsation characteristics at different locations are not spatially uniform and also demonstrating the complexity of the fluid flow structure within the chamber.
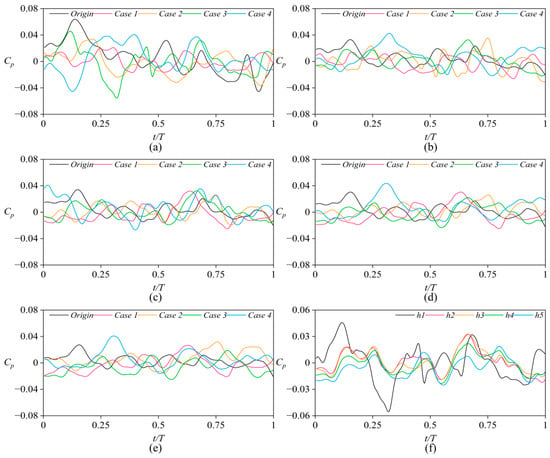
Figure 21.
Time–domain pressure coefficient of the back chamber for monitoring points (a) h1, (b) h2, (c) h3, (d) h4, (e) h5, and (f) monitoring points at Case 3.
Figure 22 shows the pressure pulsation frequency–domain plot for five monitoring points in the centrifugal pump back chamber. Overall, as the tooth height increases gradually in Case 1, Case 2, and Case 3, the pressure pulsation amplitude in the frequency–domain shows little variation. When the frequency is between 1000 Hz and 2000 Hz, the pressure pulsation amplitude in the back chamber is higher than in the front chamber. Therefore, when optimizing the back seal ring structure, it is necessary to consider not only suppressing low-frequency amplitudes but also addressing the high-frequency region. Figure 22a shows the frequency–domain plot of pressure pulsation at monitoring point h1. In Origin, the highest amplitude of 0.0167 occurs at 80.71 Hz, while the amplitudes under other working conditions are relatively low, indicating that the structural changes of the sealing ring have affected the flow characteristics of the leakage stream. In Figure 22b, Case 4 exhibits a prominent peak at 121.062 Hz with an amplitude reaching 0.01186. In Figure 22c, the pulsation amplitudes of Case 2 and Case 3 are relatively low, while Case 4 exhibits a peak amplitude of 0.0116 at 363.19 Hz. In Figure 22f, by comparing the monitoring points in working condition 3, it can be observed that monitoring point h1 exhibits two relatively high peaks. This may be attributed to the fact that the h1 location is closer to the guide vanes and thus more susceptible to the influence of high-energy fluid pressure fluctuations. The amplitudes at other monitoring points are around 0.006, and the pressure pulsation behavior is similar.
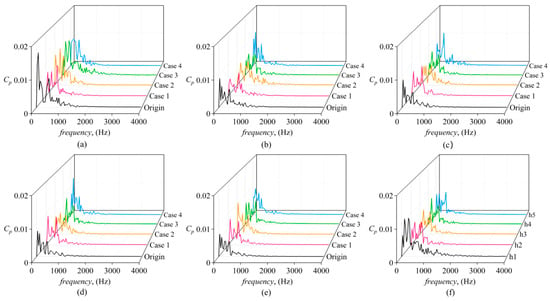
Figure 22.
Pressure spectra of the back chamber for monitoring points (a) h1, (b) h2, (c) h3, (d) h4, (e) h5, and (f) monitoring points at Case 3.
5.5. Pressure Pulsation Intensity in Leakage Chambers
With the change of tooth profile, the fluid flow within the leakage chambers also changes, which in turn affects the stability of the impeller operation. The pressure pulsation intensity coefficient is defined as follows:
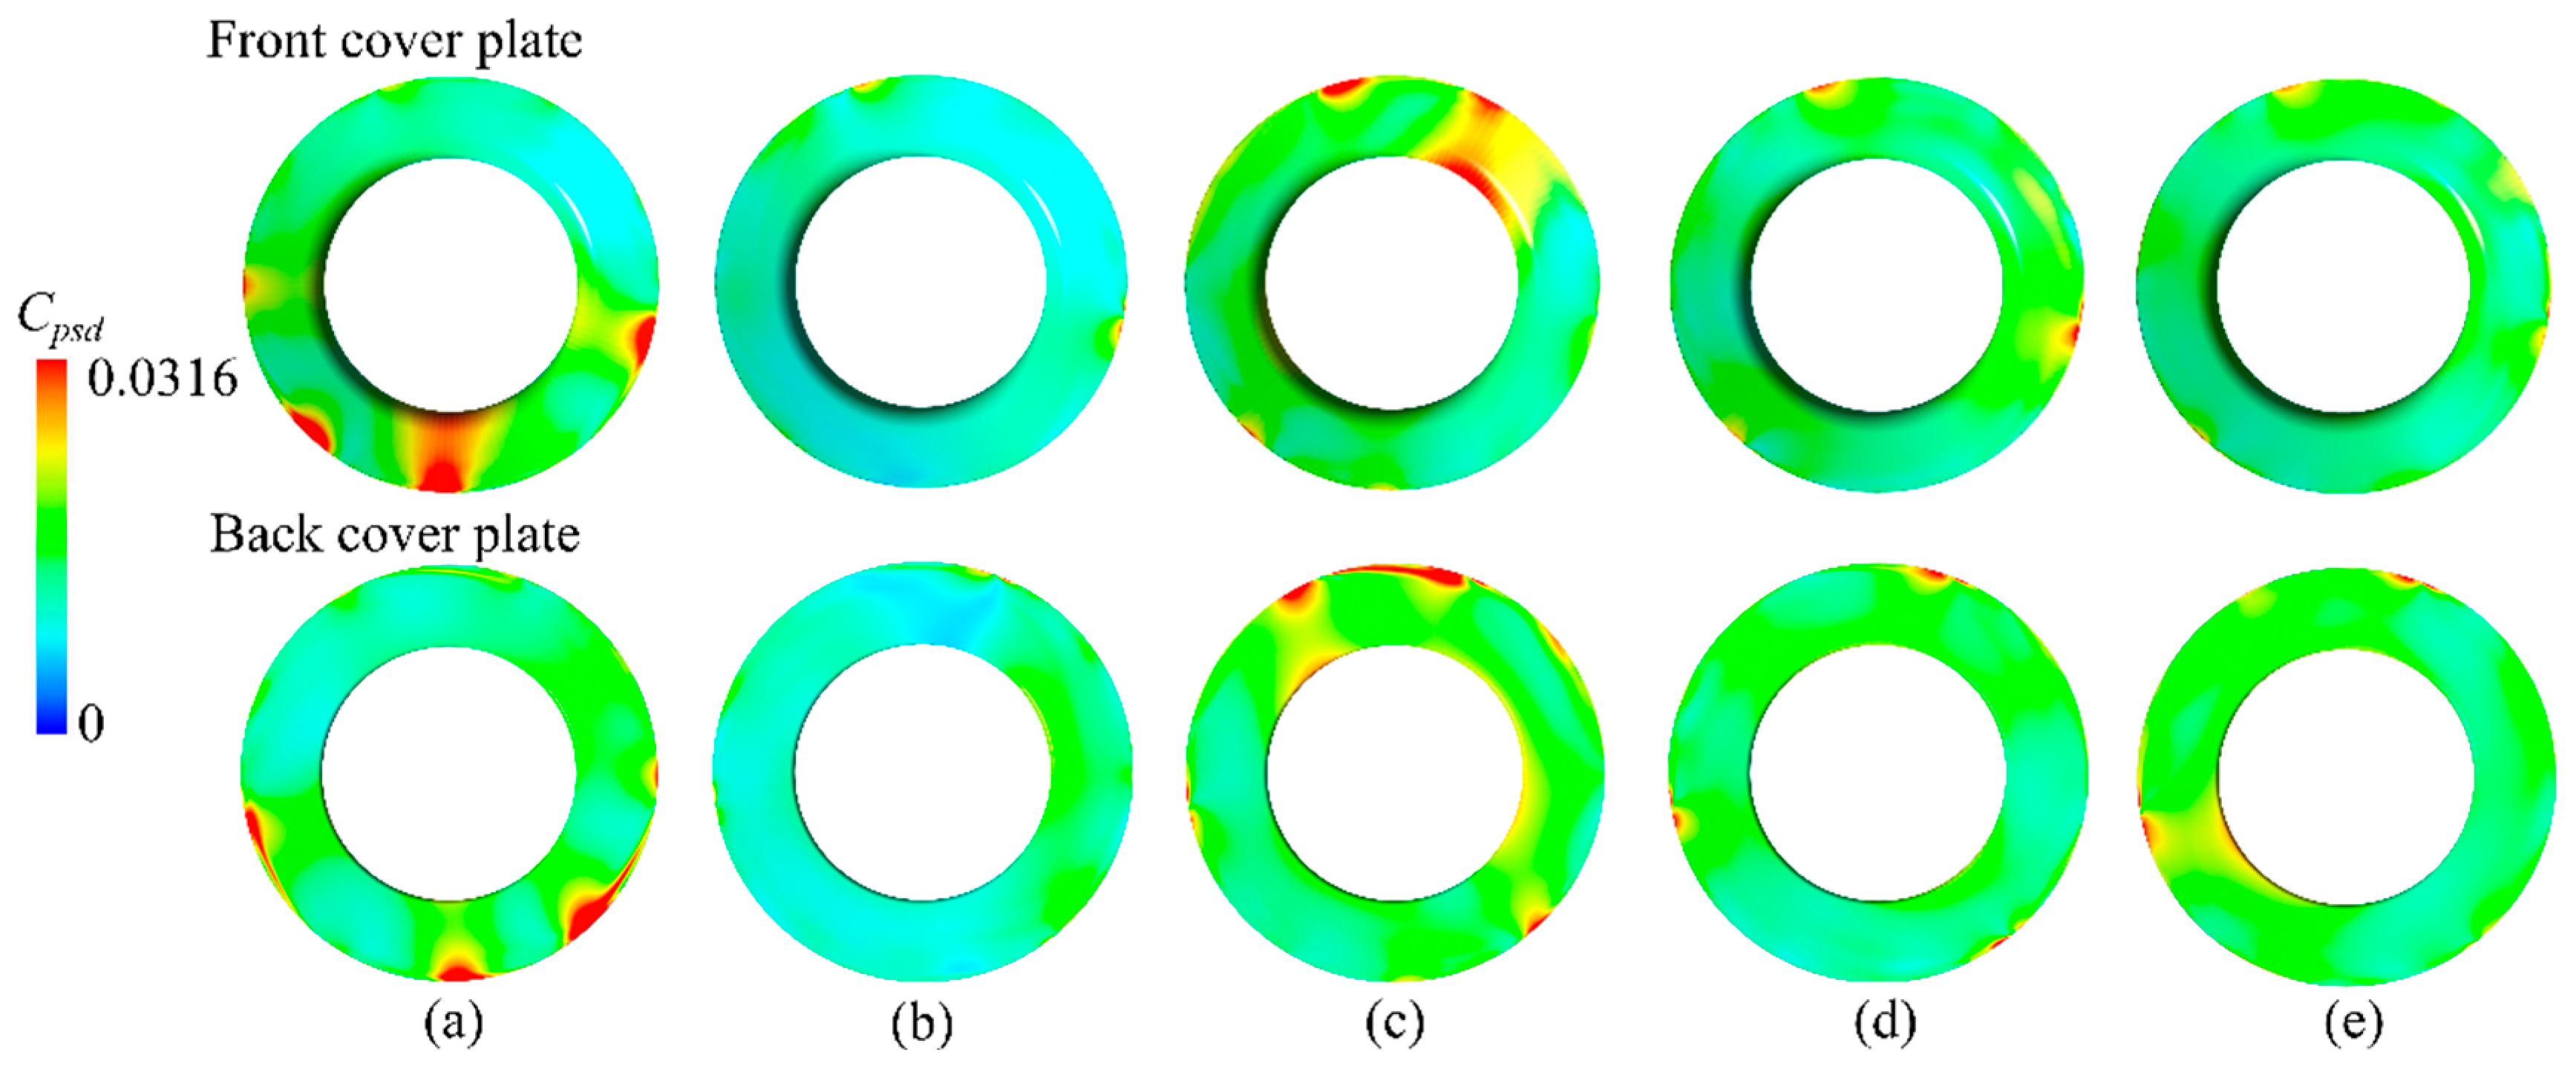
As shown in Figure 23, the pressure pulsation intensity coefficient distribution on the front and back covers of the impeller at different seal tooth heights is presented. For the Origin structure, it can be seen that the front and back covers have a large amount of red distribution, indicating that the pressure pulsation intensity is higher. This is because the original structure lacks the obstruction and throttling effects of teeth. As a result, the leakage flow collides intensely with the main flow, leading to more turbulent flow. In Case 1, the minimum tooth height provides a certain throttling effect on the leakage flow. Notably, the pressure pulsation intensity coefficient decreases significantly. However, the color distribution is still not very uniform, meaning it still has a considerable impact on impeller stability. In Case 2, the optimization of the pressure pulsation intensity is not very obvious. In comparison with the original, the red area is more concentrated. In Case 3 and Case 4, where the tooth height is relatively higher, the areas with strong pressure pulsation intensity are significantly reduced, and the color distribution is more uniform. This is because higher teeth increase the flow resistance. The teeth dissipate energy from the high-velocity leakage flow, significantly diminishing their interaction with the main flow. Consequently, the internal flow field stabilizes. Research indicates that strategically designing the seal ring tooth profile effectively lowers pressure pulsation. This also improves the operational stability of the impeller.
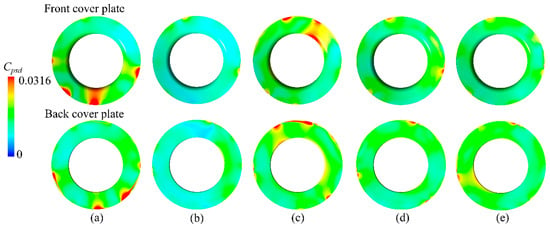
Figure 23.
Pressure pulsation intensity distribution of front and back cover plates: (a) Origin, (b) Case 1, (c) Case 2, (d) Case 3, and (e) Case 4.
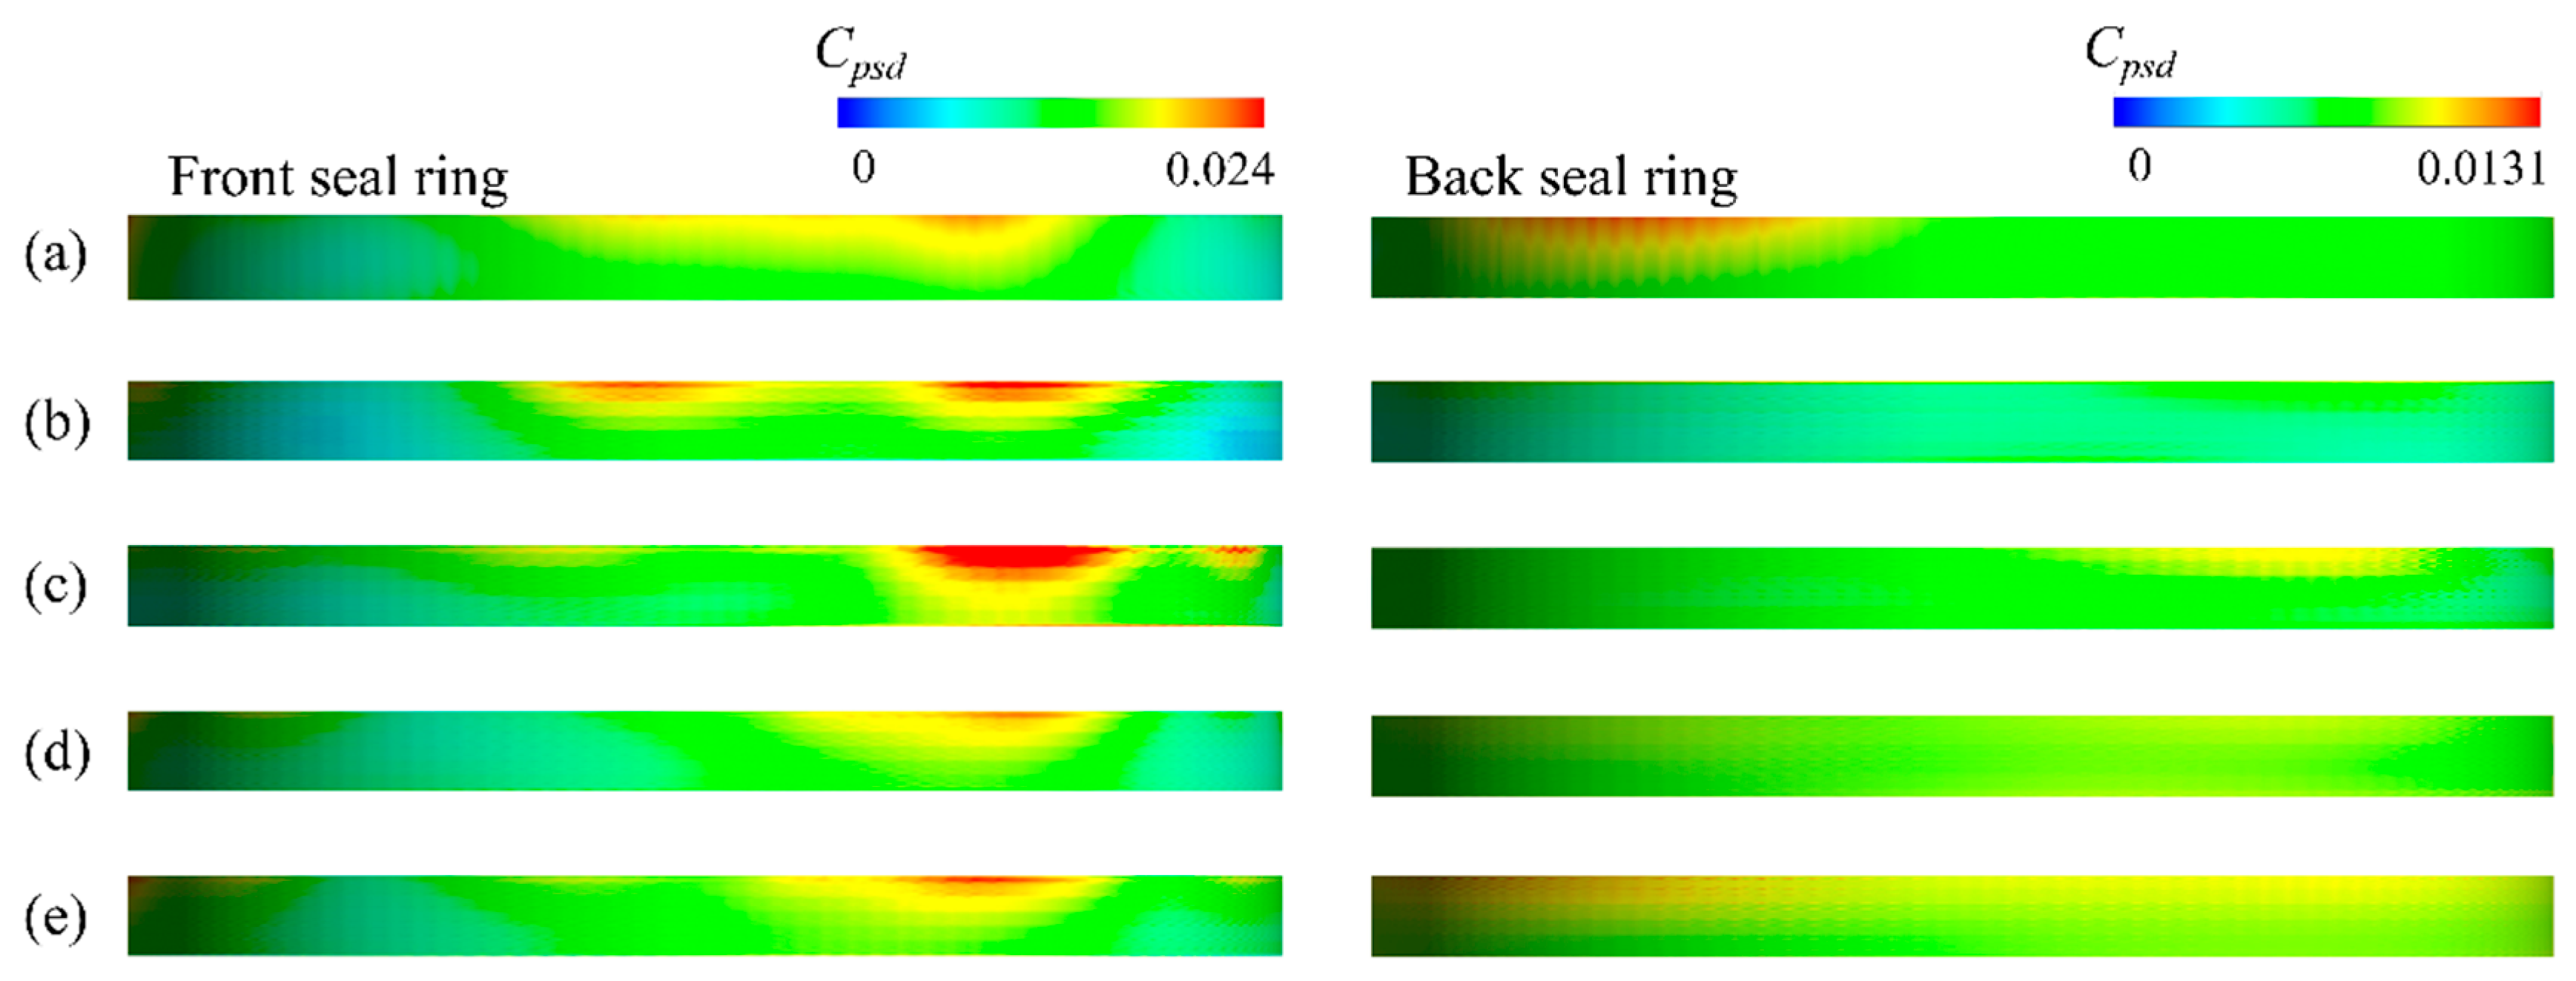
Figure 24 shows the distribution of the pressure pulsation intensity coefficient for the front and back seal rings. Overall, the pressure pulsation intensity in the front seal ring is significantly higher than that in the back seal ring, indicating poorer flow stability within the front seal ring. This is due to the interaction between the leakage flow and the main flow at the front seal ring. In the front seal ring, Case 1 exhibits a more pronounced high pulsation area compared to the Origin, while in Case 2, the high pulsation intensity is more concentrated. Cases 3 and 4 demonstrate a reduction in areas characterized by high-pressure pulsation intensity, implying that structural optimization of the seal ring contributes to lowering pulsation levels and enhancing centrifugal pump operational stability. In the back seal ring, the change in the seal ring structure has a less dramatic effect on the pressure pulsation intensity, and the overall distribution is more uniform.
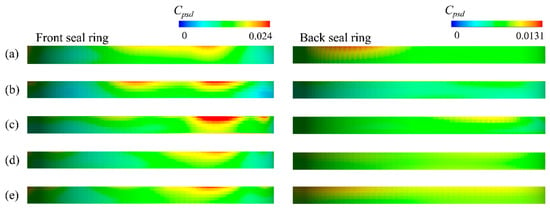
Figure 24.
Pressure pulsation intensity distribution of the front and back seal rings: (a) Origin, (b) Case 1, (c) Case 2, (d) Case 3, and (e) Case 4.
6. Conclusions
In this study, the effect of seal ring tooth profile on the leakage flow of a pump chamber is studied. The leakage rate and performance of the pump are discussed with different seal ring parameters. The main conclusions are as follows.
- (1)
- The pressure pulsation in the leakage chambers of high-speed centrifugal pumps will increase first and then decrease with the increase in the tooth height of the labyrinth seal ring. For the Case 3 structure with a labyrinth tooth height of 0.23 mm, the pressure pulsation in the leakage chambers can reach a maximum reduction of 30.3%.
- (2)
- The use of labyrinth seal rings can also reduce the leakage rate of pump chambers. For the Case 2 structure, the leakage rate can be reduced by 41.1%, while for the Case 3 structure, the value is 40.6%.
- (3)
- The use of labyrinth seal rings significantly reduces the pressure pulsation intensity of the impeller surfaces, which improves the force stability of the high-speed centrifugal pump impeller.
Author Contributions
Writing—original draft, G.Z.; Editing & supervision, J.X.; Data curation, J.L.; Review & editing, Y.L.; Supervision Z.Z. All authors have read and agreed to the published version of the manuscript.
Funding
This work was supported by the National Natural Science Foundation of China (Grant No. 52406059), the Natural Science Foundation of Zhejiang Province (Grant No. LQN25E060005), the Zhejiang Province Key R&D Program Project (Grant No. 2023C01155), and the Research Initiation Foundation of Zhejiang Sci-tech University (Grant No. 23242166-Y).
Data Availability Statement
The data are available from the corresponding author on reasonable request.
Conflicts of Interest
The authors declare that they have no known competing financial interests or personal relationships that could have appeared to influence the work reported in this paper.
Nomenclatures
| n | nominal rotating speed (9685 r/min) |
| Qd | nominal flow rate (130 m3/h) |
| H | designed head (400 m) |
| D1 | impeller inlet diameter (98 mm) |
| D2 | impeller outlet diameter (172 mm) |
| W | impeller outlet width (10 mm) |
| Z1 | impeller blade number (6) |
| Z2 | inducer blade number (3) |
| p | static pressure at inlet (101,325 Pa) |
| β2 | blade outlet angle (37°) |
| h | tooth height |
| b | cavity width |
| a | tooth width |
| N | number of teeth |
| m | gap width |
| Pout | outlet pressure |
| Pin | inlet pressure |
| T | time of one impeller revolution period (s) |
| ρ | density (998.2 kg/m3) |
| Δz | height difference |
| η | efficiency |
| μ | viscosity (0.895 × 10⁻³ Pa·s) |
| k | turbulence kinetic energy (m2·s−2) |
| Cp | pressure pulsation coefficient (=) |
| fr | shaft frequency |
| fBPF | blade passing frequency |
| Cpsd | pressure pulsation intensity coefficient |
References
- Yang, H.; Hao, J.; Zuchao, Z.; Xianghui, S.; Wenqi, L.; Gruszczynski, M.; Qiangmin, D.; Panlong, G. Review of the Hydraulic and Structural Design of High-Speed Centrifugal Pumps. Front. Energy Res. 2022, 10, 899093. [Google Scholar] [CrossRef]
- Algieri, A.; Zema, D.A.; Nicotra, A.; Zimbone, S.M. Potential Energy Exploitation in Collective Irrigation Systems Using Pumps as Turbines: A Case Study in Calabria (Southern Italy). J. Clean. Prod. 2020, 257, 120538. [Google Scholar] [CrossRef]
- Zhang, S.; Chen, H.; Ma, Z.; Li, Y. Unsteady Flow and Pressure Pulsation Characteristics in Centrifugal Pump Based on Dynamic Mode Decomposition Method. Phys. Fluids 2022, 34, 117107. [Google Scholar] [CrossRef]
- Gülich, J.F. Centrifugal Pumps, 4th ed.; Springer Nature: Cham, Switzerland, 2020. [Google Scholar] [CrossRef]
- Gülich, J.F.; Bolleter, U. Pressure Pulsations in Centrifugal Pumps. J. Fluids Eng. 1992, 114, 459–465. [Google Scholar] [CrossRef]
- Barzdaitis, V.; Mažeika, P.; Vasylius, M.; Kartašovas, V.; Tadžijevas, A. Investigation of Pressure Pulsations in Centrifugal Pump System. J. Vibroengineering 2016, 18, 1849–1860. [Google Scholar] [CrossRef][Green Version]
- Jia, X.Q.; Chu, Q.; Zhang, L.; Zhu, Z.C. Experimental Study on Operational Stability of Centrifugal Pumps of Varying Impeller Types Based on External Characteristic, Pressure Pulsation and Vibration Characteristic Tests. Front. Energy Res. 2022, 10, 866037. [Google Scholar] [CrossRef]
- Kim, T.S.; Cha, K.S. Comparative Analysis of the Influence of Labyrinth Seal Configuration on Leakage Behavior. J. Mech. Sci. Technol. 2009, 23, 2830–2838. [Google Scholar] [CrossRef]
- Yan, J.R.; Zuo, Z.T.; Guo, W.B.; Hou, H.C.; Zhou, X.; Chen, H.S. Influences of wear-ring clearance leakage on performance of a small-scale pump-turbine. Proc. Inst. Mech. Eng. Part A J. Power Energy 2020, 234, 454–469. [Google Scholar] [CrossRef]
- Zhao, W.G.; Li, Y.B.; Wang, X.Y.; Sun, J.P.; Wu, G.X. Research on the Effect of Wear-Ring Clearances to the Performance of Centrifugal Pump. In IOP Conference Series: Earth and Environmental Science; IOP Publishing: Bristol, UK, 2012; Volume 15, p. 072018. [Google Scholar] [CrossRef]
- Wang, W.Z.; Liu, Y.Z.; Jiang, P.N.; Chen, H.P. Numerical Analysis of Leakage Flow Through Two Labyrinth Seals. J. Hydrodyn. 2007, 19, 107–112. [Google Scholar] [CrossRef]
- Matros, M.; Ziegler, A.; Nordmann, R. Fluid Structure Interactions in Annular Seals of Centrifugal Pumps. Tribol. Trans. 1995, 38, 353–363. [Google Scholar] [CrossRef]
- DaqiqShirazi, M.; Torabi, R.; Riasi, A.; Nourbakhsh, S.A. The Effect of Wear Ring Clearance on Flow Field in the Impeller Sidewall Gap and Efficiency of a Low Specific Speed Centrifugal Pump. Proc. Inst. Mech. Eng. Part C J. Mech. Eng. Sci. 2018, 232, 3062–3073. [Google Scholar] [CrossRef]
- Chen, S.X.; Pan, Z.Y.; Wu, Y.L.; Zhang, D.Q. Simulation and Experiment of the Effect of Clearance of Impeller Wear-Rings on the Performance of Centrifugal Pump. IOP Conf. Ser. Earth Environ. Sci. 2012, 15, 072017. [Google Scholar] [CrossRef]
- Zhang, X.; Jiang, J.-B.; Peng, X.-D.; Ni, Z.-G. Experimental and Numerical Simulation Study on the Influence of Structural Factors on the Leakage Characteristics of Clearance Seals. Flow Meas. Instrum. 2023, 94, 102465. [Google Scholar] [CrossRef]
- Zhou, W.J.; Yang, Y.C.; Xing, G.K.; Wang, L.Q. Numerical Investigation of Nonlinear Vibration for Rotor-Seal System of Centrifugal Pump. IOP Conf. Ser. Mater. Sci. Eng. 2013, 52, 032006. [Google Scholar] [CrossRef]
- Dong, W.; Chu, W.L. Numerical Investigation of Fluid Flow Mechanism in the Back Shroud Cavity of a Centrifugal Pump. J. Appl. Fluid Mech. 2018, 11, 709–719. [Google Scholar] [CrossRef]
- Cui, B.; Zhang, Y.; Huang, Y. Analysis of the Pressure Pulsation and Vibration in a Low-Specific-Speed Centrifugal Pump. J. Fluids Eng. 2021, 143, 021201. [Google Scholar] [CrossRef]
- Zhang, N.; Yang, M.; Gao, B.; Li, Z.; Ni, D. Investigation of Rotor-Stator Interaction and Flow Unsteadiness in a Low Specific Speed Centrifugal Pump. Stroj. Vestn. J. Mech. Eng. 2016, 62, 21–31. [Google Scholar] [CrossRef]
- Zheng, L.; Chen, X.; Qu, J.; Ma, X. A Review of Pressure Fluctuations in Centrifugal Pumps Without or With Clearance Flow. Processes 2023, 11, 856. [Google Scholar] [CrossRef]
- Liu, H.; Ding, J.; Dai, H.; Tan, M. Investigation into Transient Flow in a Centrifugal Pump with Wear Ring Clearance Variation. Adv. Mech. Eng. 2014, 6, 693097. [Google Scholar] [CrossRef]
- Gao, B.; Wang, Z.; Yang, L.; Du, W.Q. Analysis and Test of Performance and Hydraulic Excitation Characteristics of Centrifugal Pump with Different Seal Ring Clearances. Trans. Chin. Soc. Agric. Eng. 2016, 32, 79–85. [Google Scholar] [CrossRef]
- Tang, Y.; Wang, F.; Wang, C.; Ye, C.; Qu, Q.; Xu, J. Investigation on the Influence of Seal Clearance Leakage on the Rotating Stall Characteristics for a Centrifugal Pump. Phys. Fluids 2024, 36, 025176. [Google Scholar] [CrossRef]
- Lu, J.; Chen, Q.; Liu, X.; Zhu, B.; Yuan, S. Investigation on Pressure Fluctuations Induced by Flow Instabilities in a Centrifugal Pump. Ocean Eng. 2022, 258, 111805. [Google Scholar] [CrossRef]
- Zheng, L.; Chen, X.; Dou, H.S.; Zhang, W.; Zhu, Z.C.; Cheng, X. Effects of Clearance Flow on the Characteristics of Centrifugal Pump Under Low Flow Rate. J. Mech. Sci. Technol. 2020, 34, 189–200. [Google Scholar] [CrossRef]
- Chalghoum, I.; Elaoud, S. Transient Analysis of the Dynamic Flow Characteristics of the Centrifugal Pump at Different Operating Points. Nav. Eng. J. 2019, 131, 113–122. [Google Scholar]
- Babayigit, O.; Ozgoren, M.; Aksoy, M.H.; Kocaaslan, O. Experimental and CFD investigation of a multistage centrifugal pump including leakages and balance holes. Desalination Water Treat. 2018, 67, 28–40. [Google Scholar] [CrossRef]
- Si, Q.; Yuan, J.; Yuan, S.; Wang, W.; Zhu, L. Numerical Investigation of Pressure Fluctuation in Centrifugal Pump Volute Based on SAS Model and Experimental Validation. Adv. Mech. Eng. 2014, 6, 972081. [Google Scholar] [CrossRef]
- Yakhot, V.; Orszag, S.A. Renormalization Group Analysis of Turbulence. I. Basic Theory. J. Sci. Comput. 1986, 1, 3–51. [Google Scholar] [CrossRef] [PubMed]
Disclaimer/Publisher’s Note: The statements, opinions and data contained in all publications are solely those of the individual author(s) and contributor(s) and not of MDPI and/or the editor(s). MDPI and/or the editor(s) disclaim responsibility for any injury to people or property resulting from any ideas, methods, instructions or products referred to in the content. |
© 2025 by the authors. Licensee MDPI, Basel, Switzerland. This article is an open access article distributed under the terms and conditions of the Creative Commons Attribution (CC BY) license (https://creativecommons.org/licenses/by/4.0/).

