Abstract
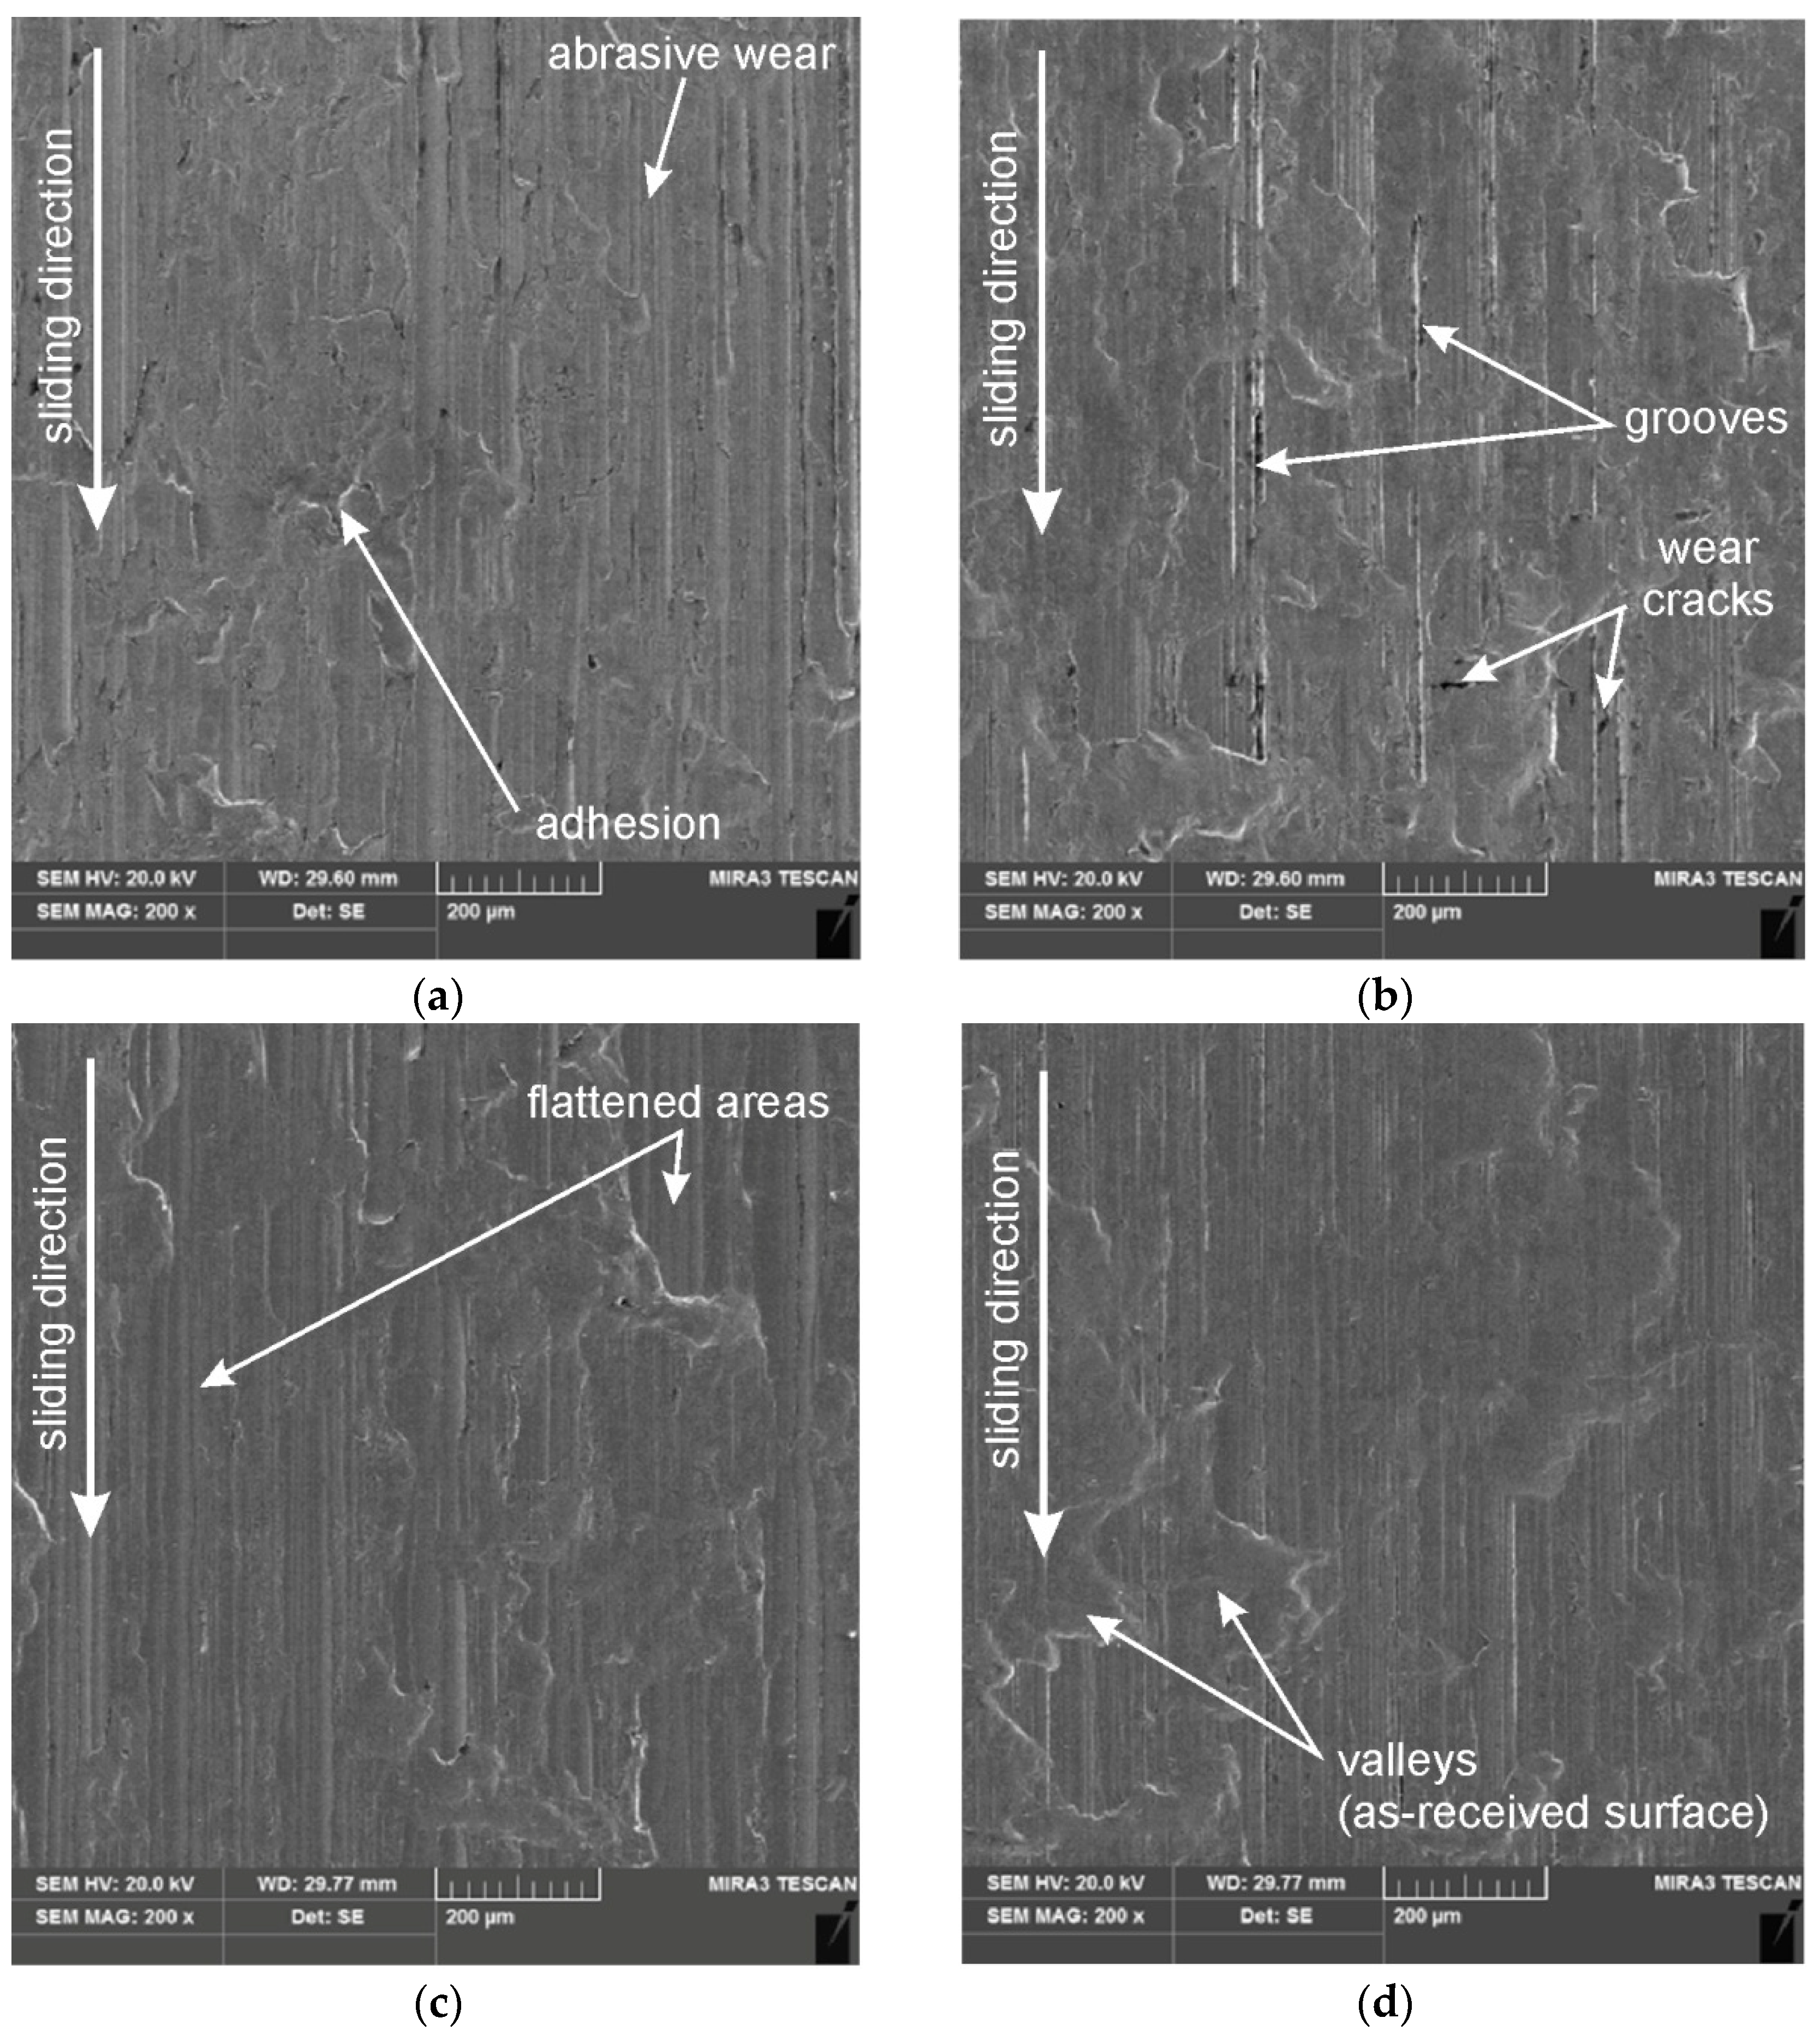
This article presents the results of experimental studies aimed at determining the values of residual stresses and coefficient of friction (CoF) in bending under tension friction test, which simulates friction conditions in sheet metal forming. The influence of surface modification of the countersample and CoFs between the countersample and DC01 steel sheet on the residual stress were analysed. This study also focused on the influence of surface modification of countersamples on the change of the main parameters of DC01 steel sheets. The hole-drilling method was used to determine residual stresses. Electron beam melting, lead-ion implantation and a combination of these two techniques were used to modify the surface layer of 145Cr6 steel countersamples. The maximum value of the CoF, about 0.31, was found for the electron beam melted countersample. As a result of the surface modification process, this countersample was characterised by the lowest value of average roughness, which directly influenced the increase in the real contact area. The occurrence of residual tensile stresses was observed near the surface layer of the sheet strip in contact with the countersample. With the increase of the considered depth of residual stress measurement, the residual tensile stresses were transformed into compressive residual stresses with a value between −75 and −50 MPa, depending on the type of friction pair. SEM analyses allowed us to identify two main friction mechanisms for all friction pairs: adhesion and abrasive wear.
1. Introduction
Sheet metal forming (SMF) processes are used in many industries to manufacture sheet metal components. In these processes, a flat sheet metal is formed into a drawpiece under the influence of a stamping tool (die, punch, and blankholder). One of the phenomena that limit the formability of the sheet metal during SMF is friction [1]. This phenomenon is difficult to analyse in SMF because it requires the use of a tribological test with appropriate kinematics corresponding to real forming conditions [2]. A quantitative indicator of the friction value is the coefficient of friction (CoF). This coefficient depends on many parameters such as lubrication conditions [3,4], surface roughness of the sheet metal and tool [5,6], contact pressure [7], mechanical properties of the sheet metal and tool [8], sliding speed [9], forming temperature [10], and tool coating [11]. Friction causes an increase in the force parameters of the SMF process and a deterioration in the surface quality of the drawpieces [12]. The friction process in SMF is accompanied by a change in the surface topography of the sheet metal under the influence of contact pressure and relative displacement of the friction pair elements. The profile height of sheet metal decreases as a result of the flattening process [13,14]. With a relatively high roughness of the tool surface, the scratching of the sheet metal surface may occur as a result of ploughing [15]. During friction of dissimilar metals, for example, aluminium/steel or titanium/steel, particles of the sheet material may adhere to the tool surface [16]. This worsens the friction conditions and affects the deterioration of the surface finish of the drawpieces and the reduction of the tool life [17].
The bending under tension (BUT) test is used to simulate the friction conditions on the rounded edges of tools in SMF [18]. It involves applying a tensile force to a specimen while simultaneously bending it, allowing for the measurement of front-tension (FT) and back-tension (BT) forces. The coefficient of friction for a given contact angle in the BUT test can be determined based on FT and BT forces [19]. The BUT test is commonly used to evaluate the effects of material properties, lubrication and processing parameters on friction in SMF. On rounded edges of an SMF tool, severe tribological conditions prevail due to the large strain-induced change in the surface topography of the workpiece and high contact pressures. Strain-induced change in the surface topography explains the deterioration of the friction behaviour [20]. Strain-induced and friction-induced tribological phenomena in the contact zone of the sheet metal with tools generate residual stresses in the deformed material [21]. These stresses mainly determine the springback phenomenon, and they influence the final shape of the drawpieces [22]. In light of current knowledge, it can be generally stated that lower surface roughness contributes to an increase in fatigue strength. On the other hand, residual stresses and the microstructure of the material have a greater influence on fatigue strength [23].
Tribological studies using the BUT test are not widespread in the literature. The basic reason is that there is a lack of commercial tribotesters for performing this test. Research groups use self-developed friction testers, which makes it difficult to compare results. The first studies using the concept of the BUT test were reported by Littlewood and Wallace [24] in the analysis of friction and wear. Wilson et al. [25] developed the concept of a BUT simulator with a variable contact angle and a rotatable countersample (CS). Saha and Wilson [26] used a BUT simulator to analyse the boundary lubrication at various strain rates and sliding speeds. He concluded that the increase in CoF in the BUT test is associated with asperity flattening and a decrease in surface profile height. Nanayakkara et al. [27] studied the influence of the countersample radius and contact pressure in the BUT test on the CoF. It was found that the tool radius has a significant influence on the contact pressure and, consequently, on the CoF. Fratini et al. [28] studied the influence of lubrication conditions and countersample radius on the CoF during friction testing of different sheet metal grades. The influence of lubricant on reducing the CoF was rather small at high contact pressures. However, the application of lubricant reduced the stick-slip phenomenon. Berglund et al. [29] analysed the relation between the friction and texture of sheets in the BUT test. They concluded that none of the height and spatial parameters correlate well with friction. Trzepieciński et al. [30] analysed the effect of countersample anti-wear coating and lubrication conditions on the CoF of DC01 steel sheets. The uncoated countersample showed the most favourable lubricated conditions in the DC01/145Cr6 tool steel friction pair. Folle and Schaeffer [31] compared the results of the BUT test with the results of the industrial sheet metal forming of a test component. They proposed a simple equation to determine CoF. Nielsen et al. [32] concluded that the BUT test should be used only as a relative comparison of CoFs or in the assessment of the quality of different lubricants or other parameters in tribo-systems.
In this paper, for the first time, the results of strain-induced and friction-induced residual stress analyses in bending under tension friction test of low-carbon deep-drawing DC01 steel sheets are presented. Different surface morphologies of 145Cr6 tool steel countersamples were considered. Electron beam melting, lead-ion implantation (LI), and a combination of these two techniques were used to modify the surface layer of countersamples. Furthermore, the influence of BUT test conditions on the resulting surface topography of the sheets and CoFs was also investigated. The results provide a broader knowledge of the stress conditions occurring during sheet deformation at the rounded edges of tools in SMF.
The exploration of EBM, Pb implantation, and combined surface modifications and their influence on the forming behaviour is a new aspect of the work, making a significant contribution to the field. To the authors’ knowledge, similar studies on friction and residual stresses in sheet metal punch edge forming have not been performed so far. Residual stress causes a delayed material fracture, and an accurate evaluation of residual stress reduces failure risks. Nevertheless, the residual stress in the vicinity of the scratch marks, induced by galling in the stamping process, remains unclear. The presented studies make a significant contribution to the development of modern sheet metal forming technologies and indicate a large practical potential for the use of ion implantation and electron beam technology in industry. By increasing the control over friction and deformation processes, it is possible not only to increase the precision and repeatability of stamping operations but also to reduce operating costs resulting from tool wear.
2. Materials and Methods
2.1. Material
The cold-rolled 0.8-mm-thick DC01 steel sheet was used as test material. This low-carbon steel sheet, commonly used in the automotive industry, is characterised by good formability in operations such as deep drawing or bending. The chemical composition of the test material based on the technical guidelines specified in EN 10130:2009 [33] standard is specified in Table 1.

Table 1.
Content of chemical elements in DC01 steel (wt.%).
The basic mechanical properties of DC01 steel sheets were determined based on uniaxial tensile tests according to the EN ISO 6892-1:2020 [34] standard. The average parameter values determined for samples cut along the rolling direction (RD) and across the RD with three repetitions were yield stress 160.5 ± 2.76 MPa, ultimate tensile strength 284.5 ± 1.05 MPa, and elongation 36.7 ± 0.23%. The methodology for determining basic mechanical parameters of test material is described in [30].
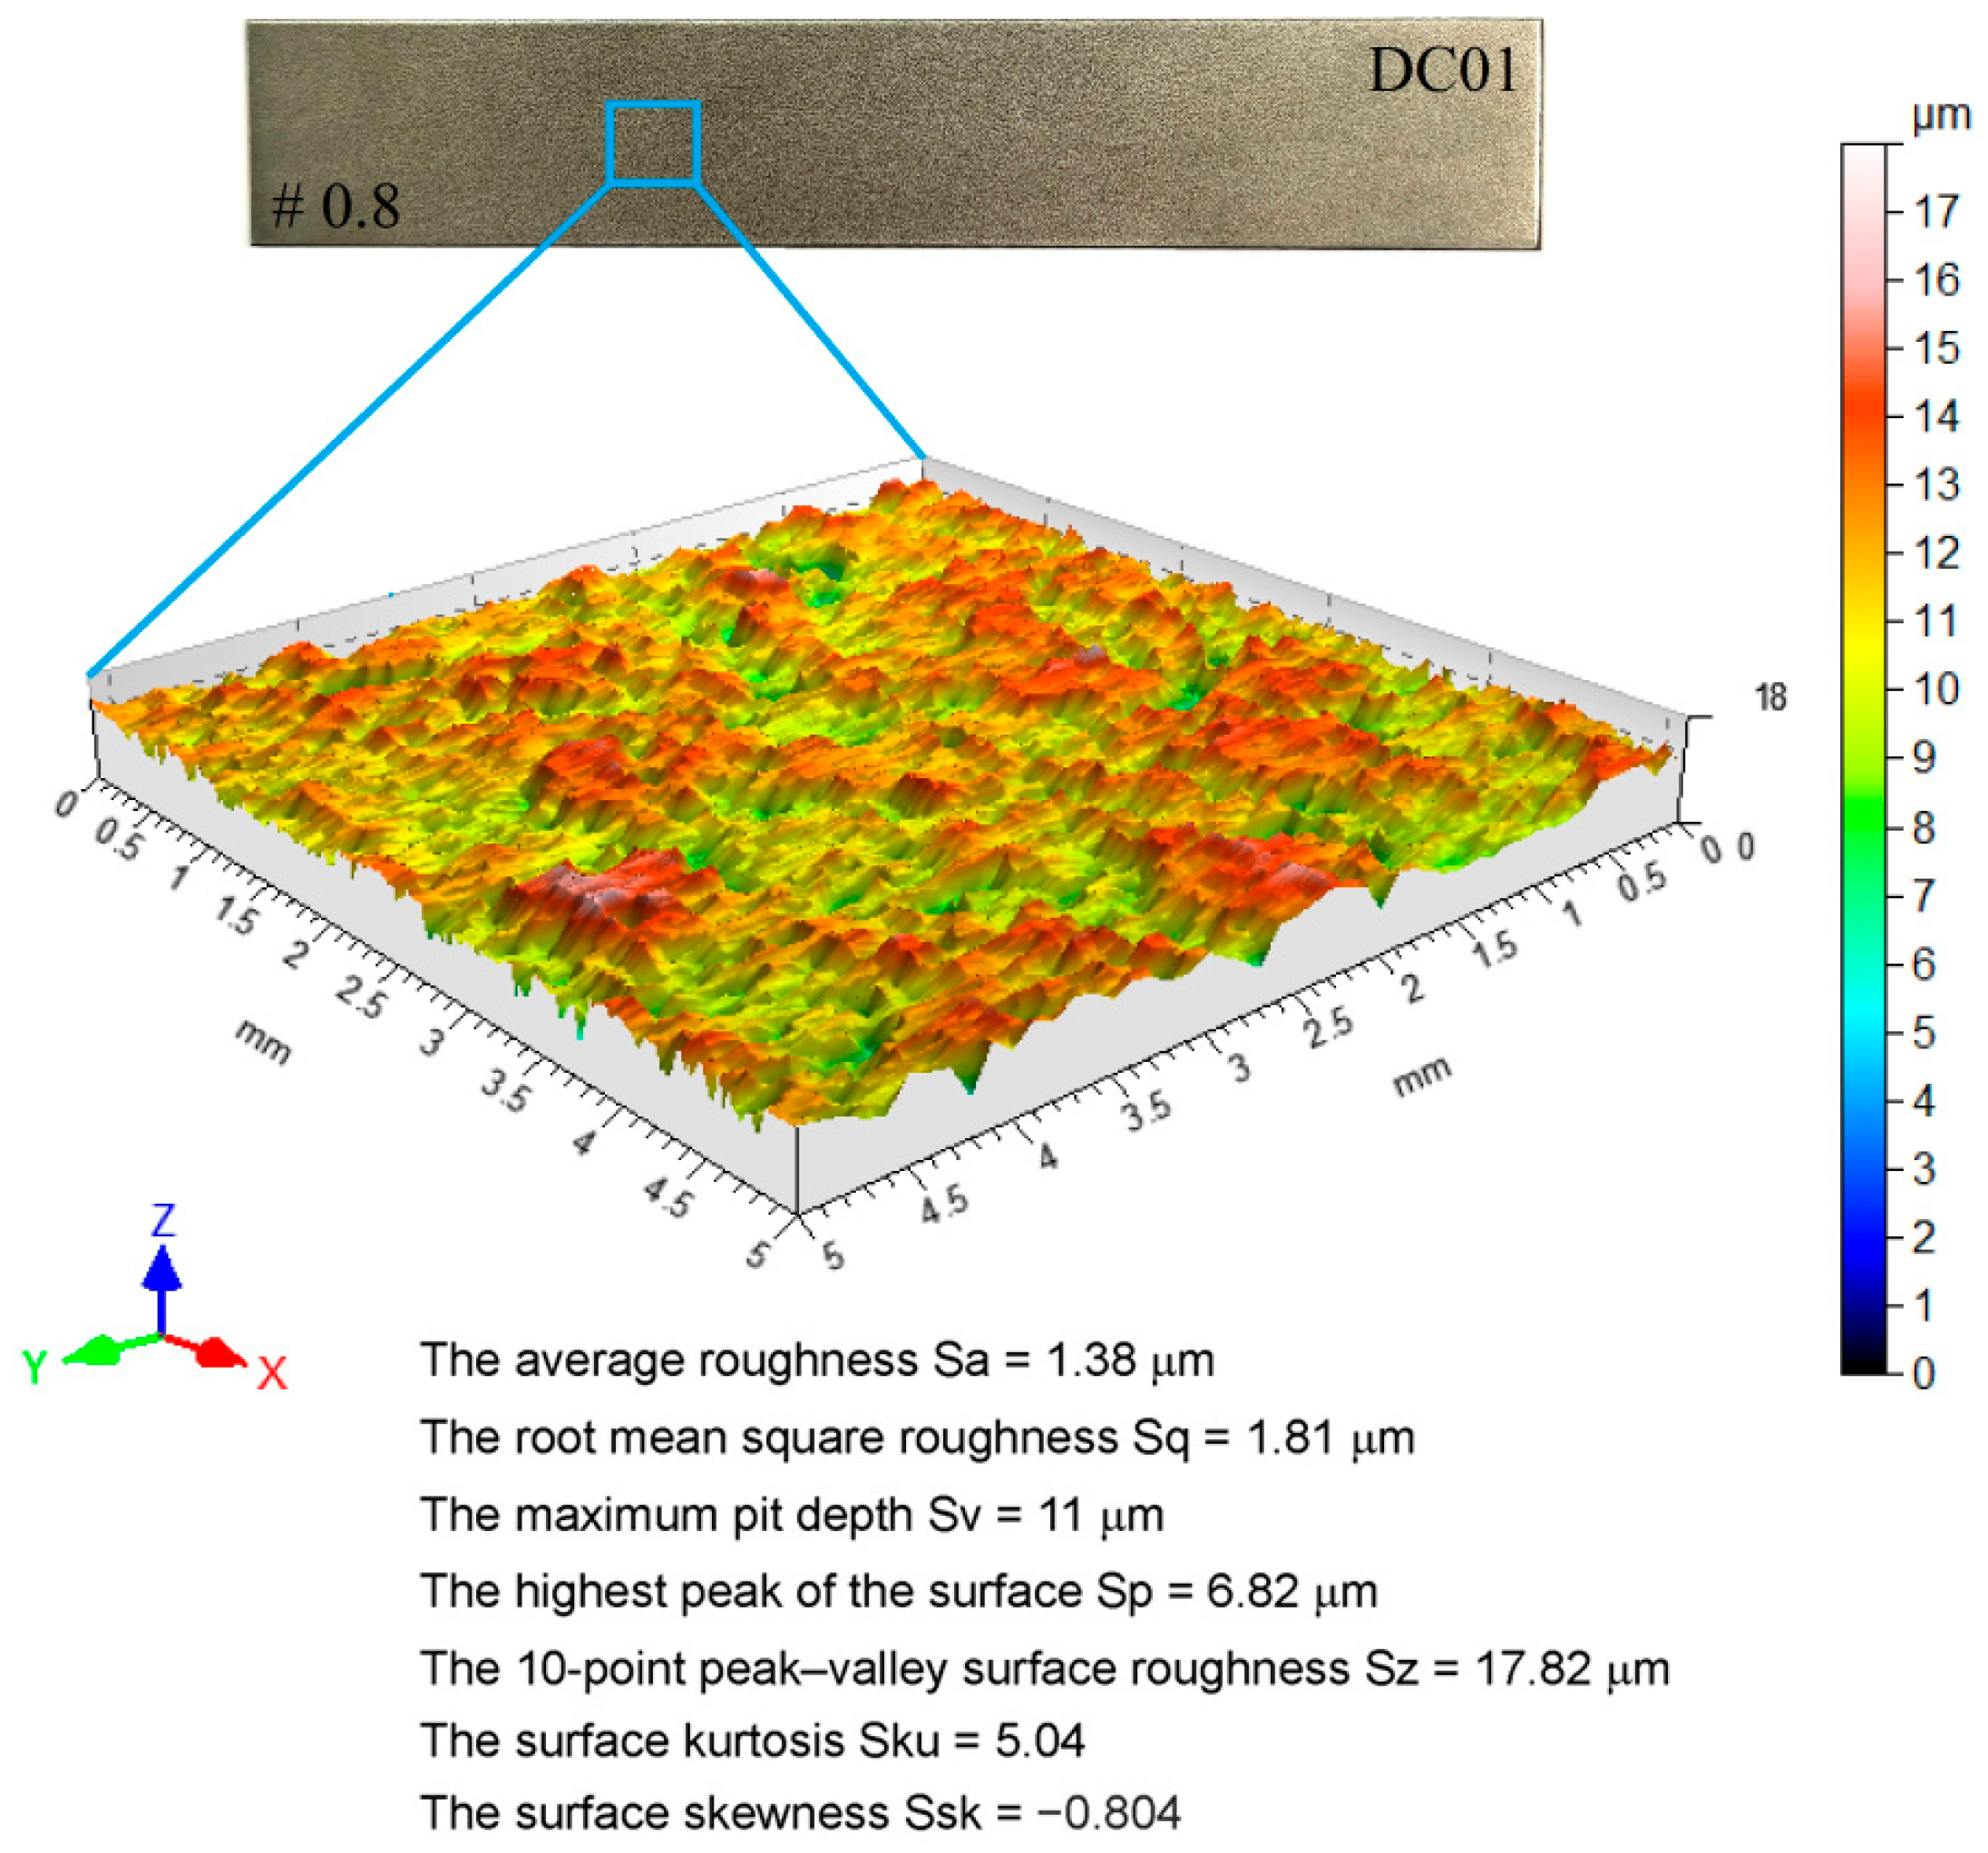
The surface topography analysis of the test material was performed using a stationary profilometer T8000RC manufactured by Jenoptik AG (Jena, Germany). Table 2 lists the basic parameters of the surface roughness measurement methodology. The measurements allowed for determining the surface topography of the sheet metal (Figure 1), and the basic values of 3D surface roughness parameters were determined. The basic parameters of 3D surface roughness were determined according to the EN ISO 25178-2:2022 [35] standard. A Sku value > 3 (5.04 μm) indicates that the bearing area curve is characterised by less flatness than the normal distribution and has relatively many high peaks and shallow valleys. A negative skewness value characterises a surface with shallow, deep valleys.

Table 2.
Surface roughness measurement conditions.
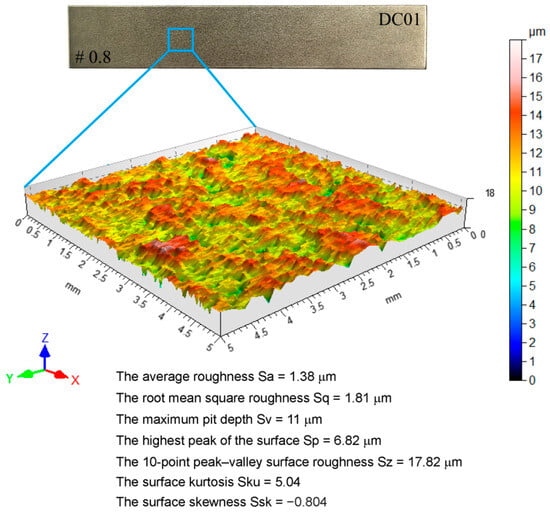
Figure 1.
Topography of the sheet metal and selected roughness parameters of the DC01 sheet metal.
The methods of surface morphology observation and hardness measurement are provided in [30].
2.2. Determination of the CoF
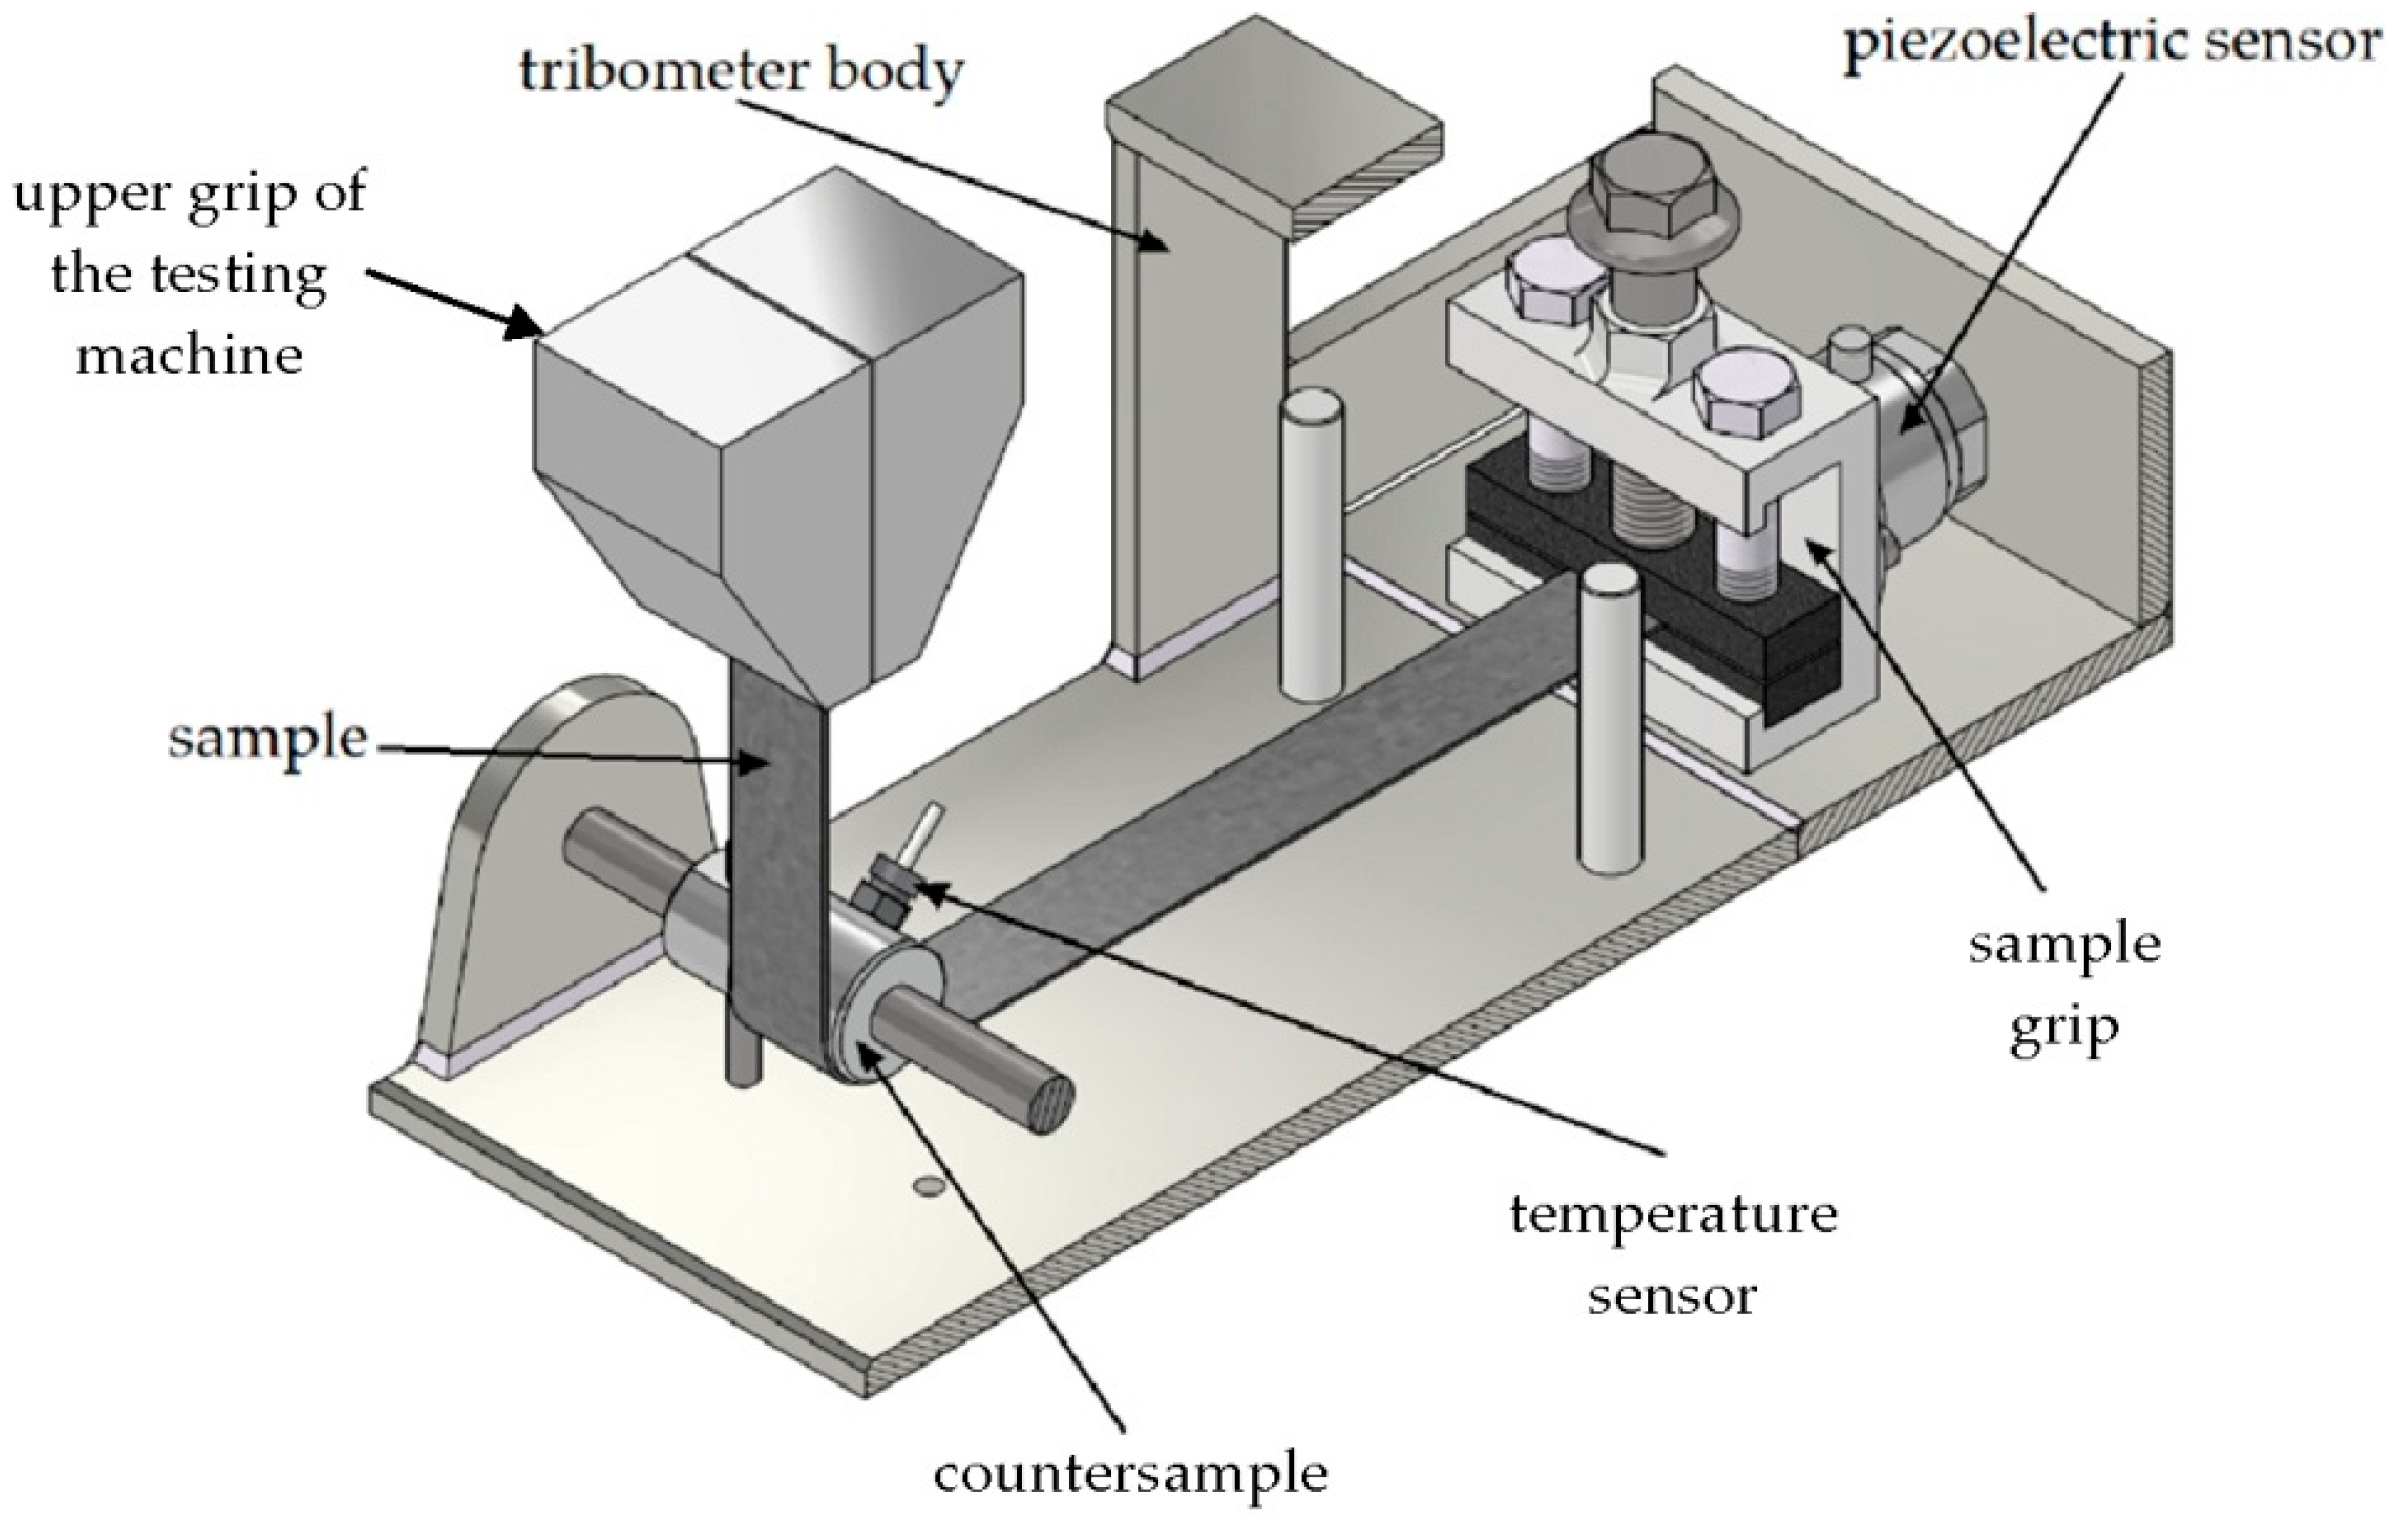
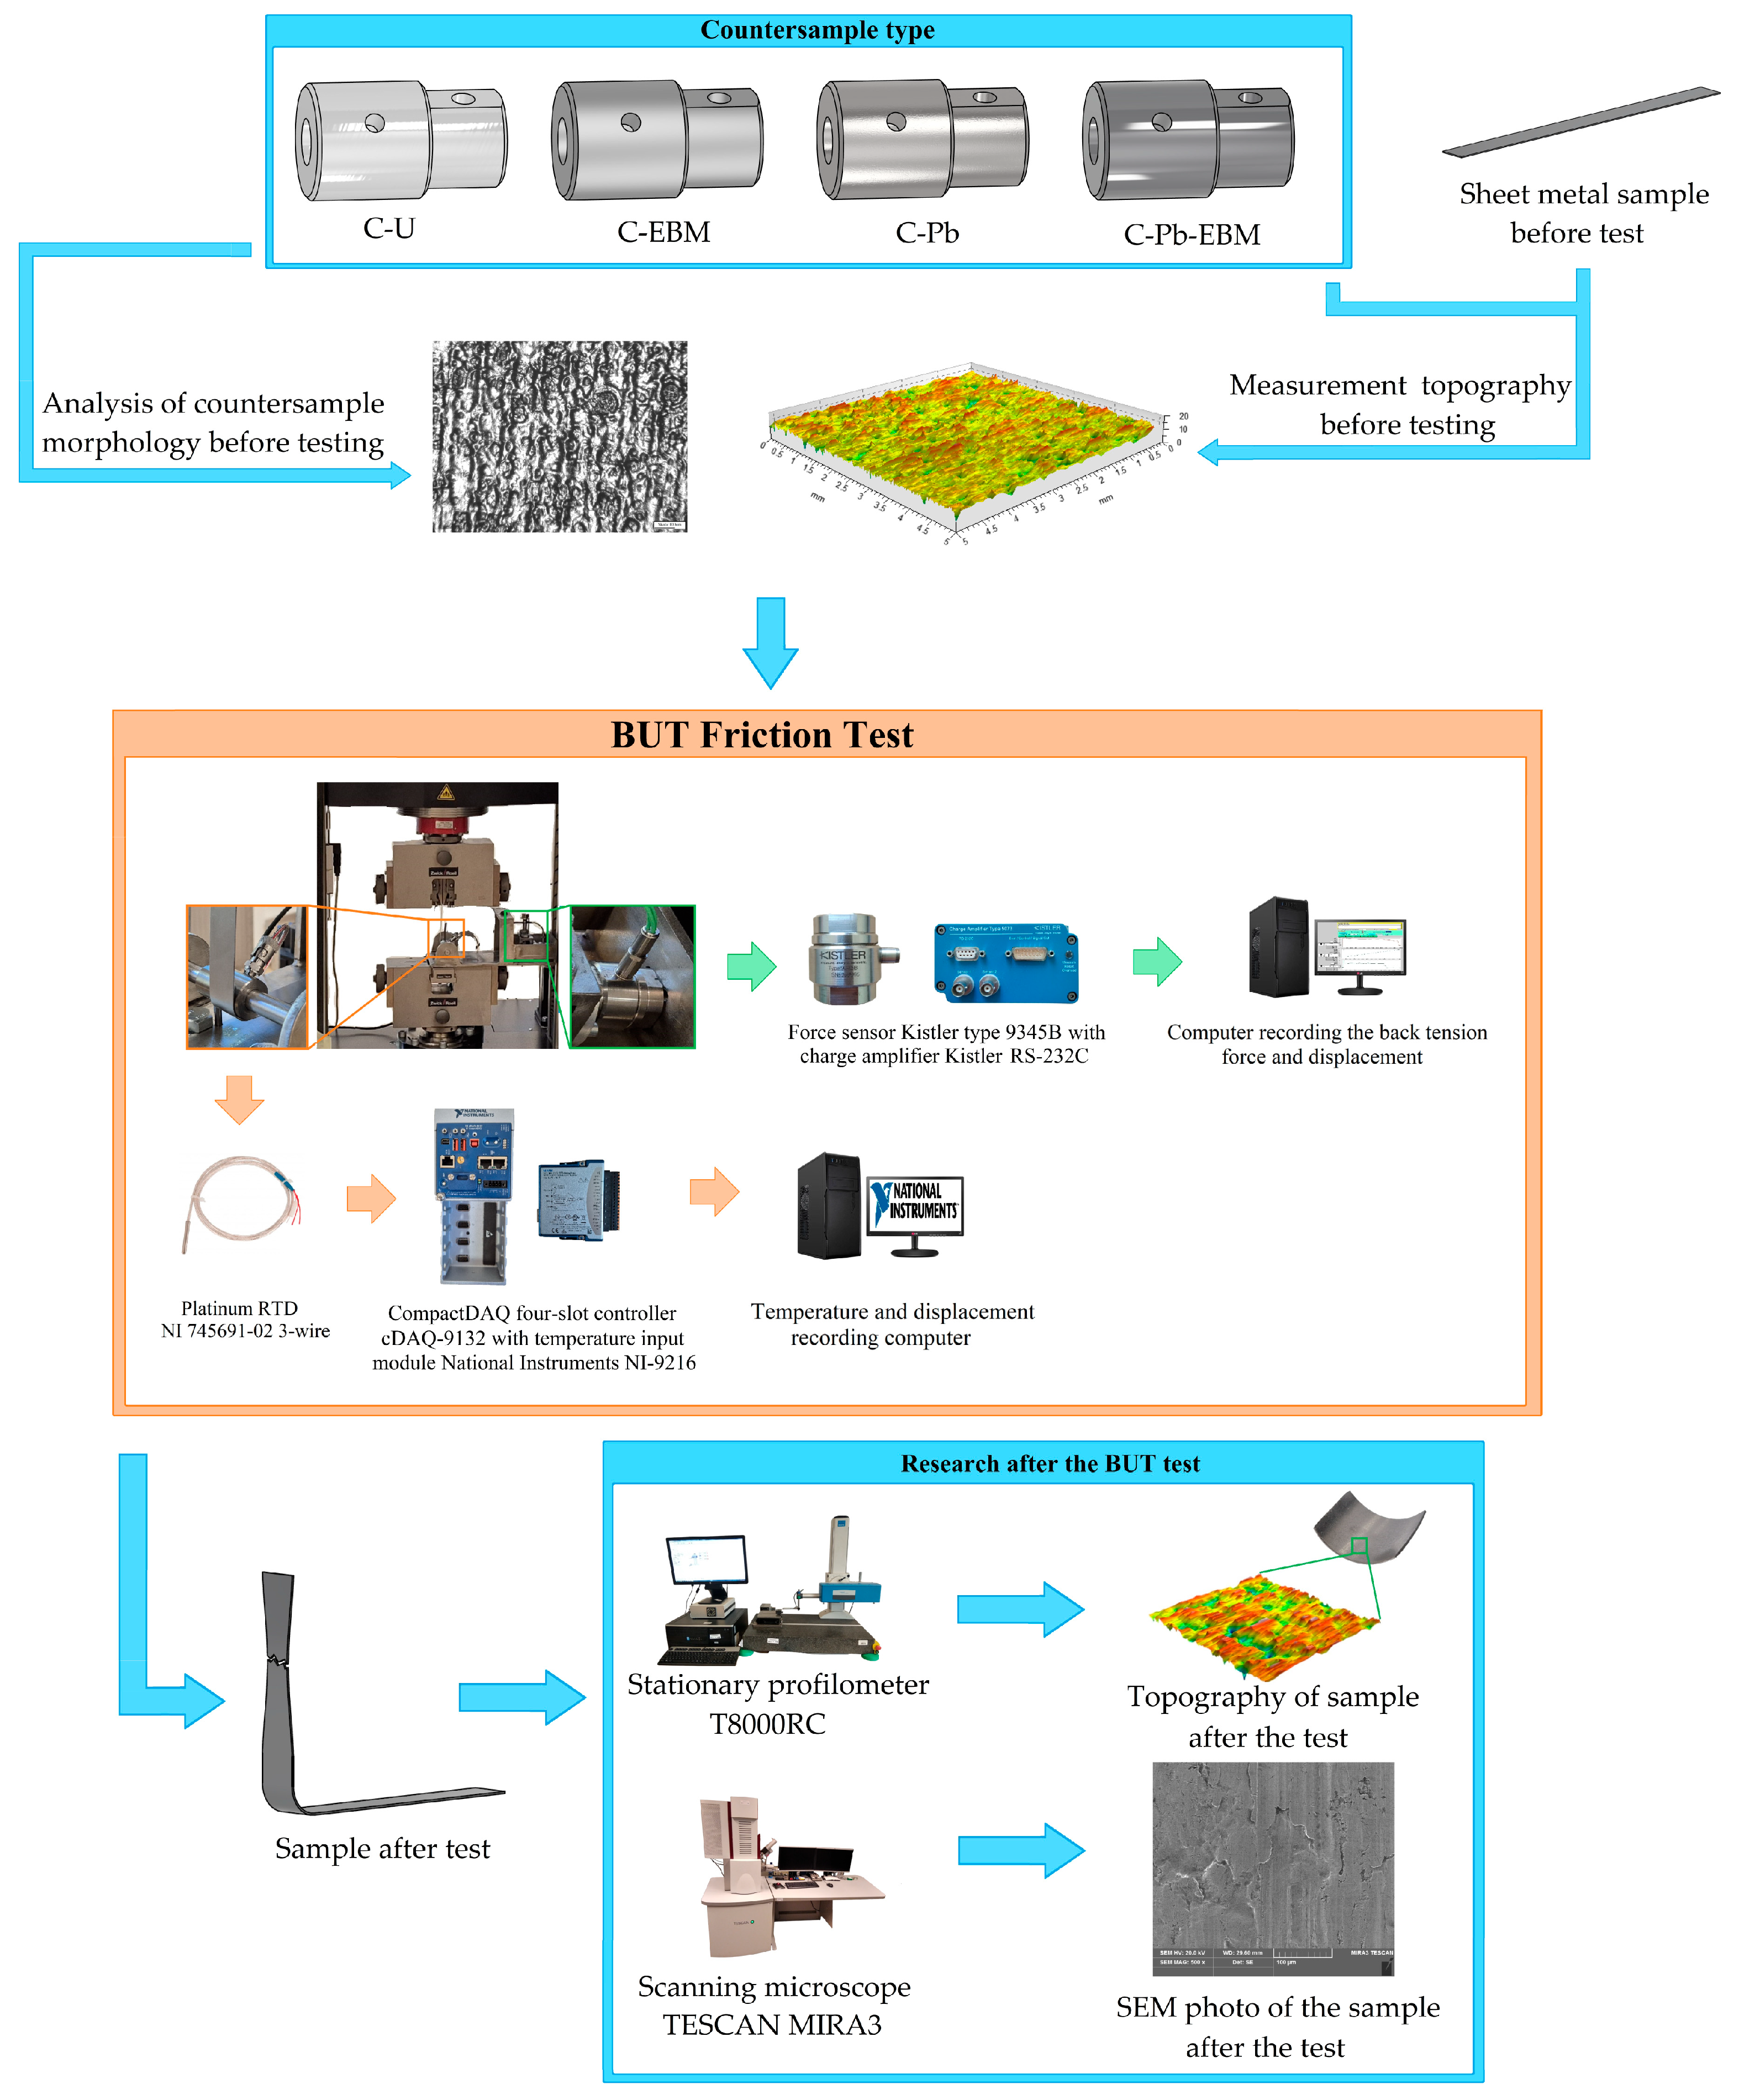
A self-developed friction tribometer (Figure 2) was used in the BUT friction tests. Its detailed design is presented in the paper [30]. In the BUT friction test, one of the ends of the strip sample is fixed, and a displacement is applied to the other end of the sample. The tribometer was mounted in the lower grip of the Zwick/Roell Z100 (Zwick/Roell, Ulm, Germany) testing machine, which is responsible for stretching the sample and recording the front-tension force. The back-tension force was measured using a Kistler type 9345B piezoelectric sensor (Kistler, Winterthur, Switzerland) (Figure 3). NI 745691-02 (National Instruments, Austin, TX, USA) temperature detector (Figure 2) was used to measure temperature.
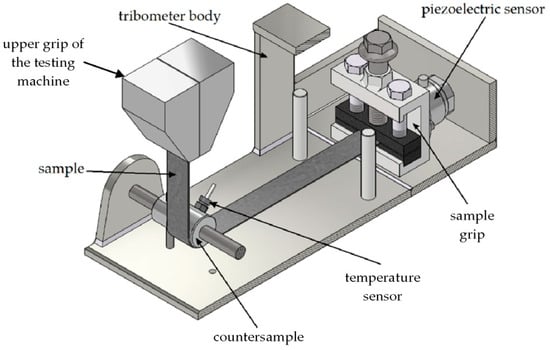
Figure 2.
Model of BUT friction tribometer (broken-out section).
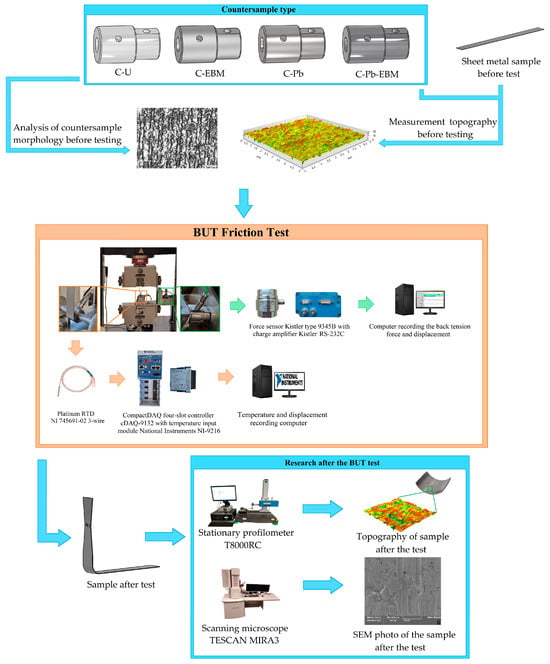
Figure 3.
Flow chart for experimental investigations.
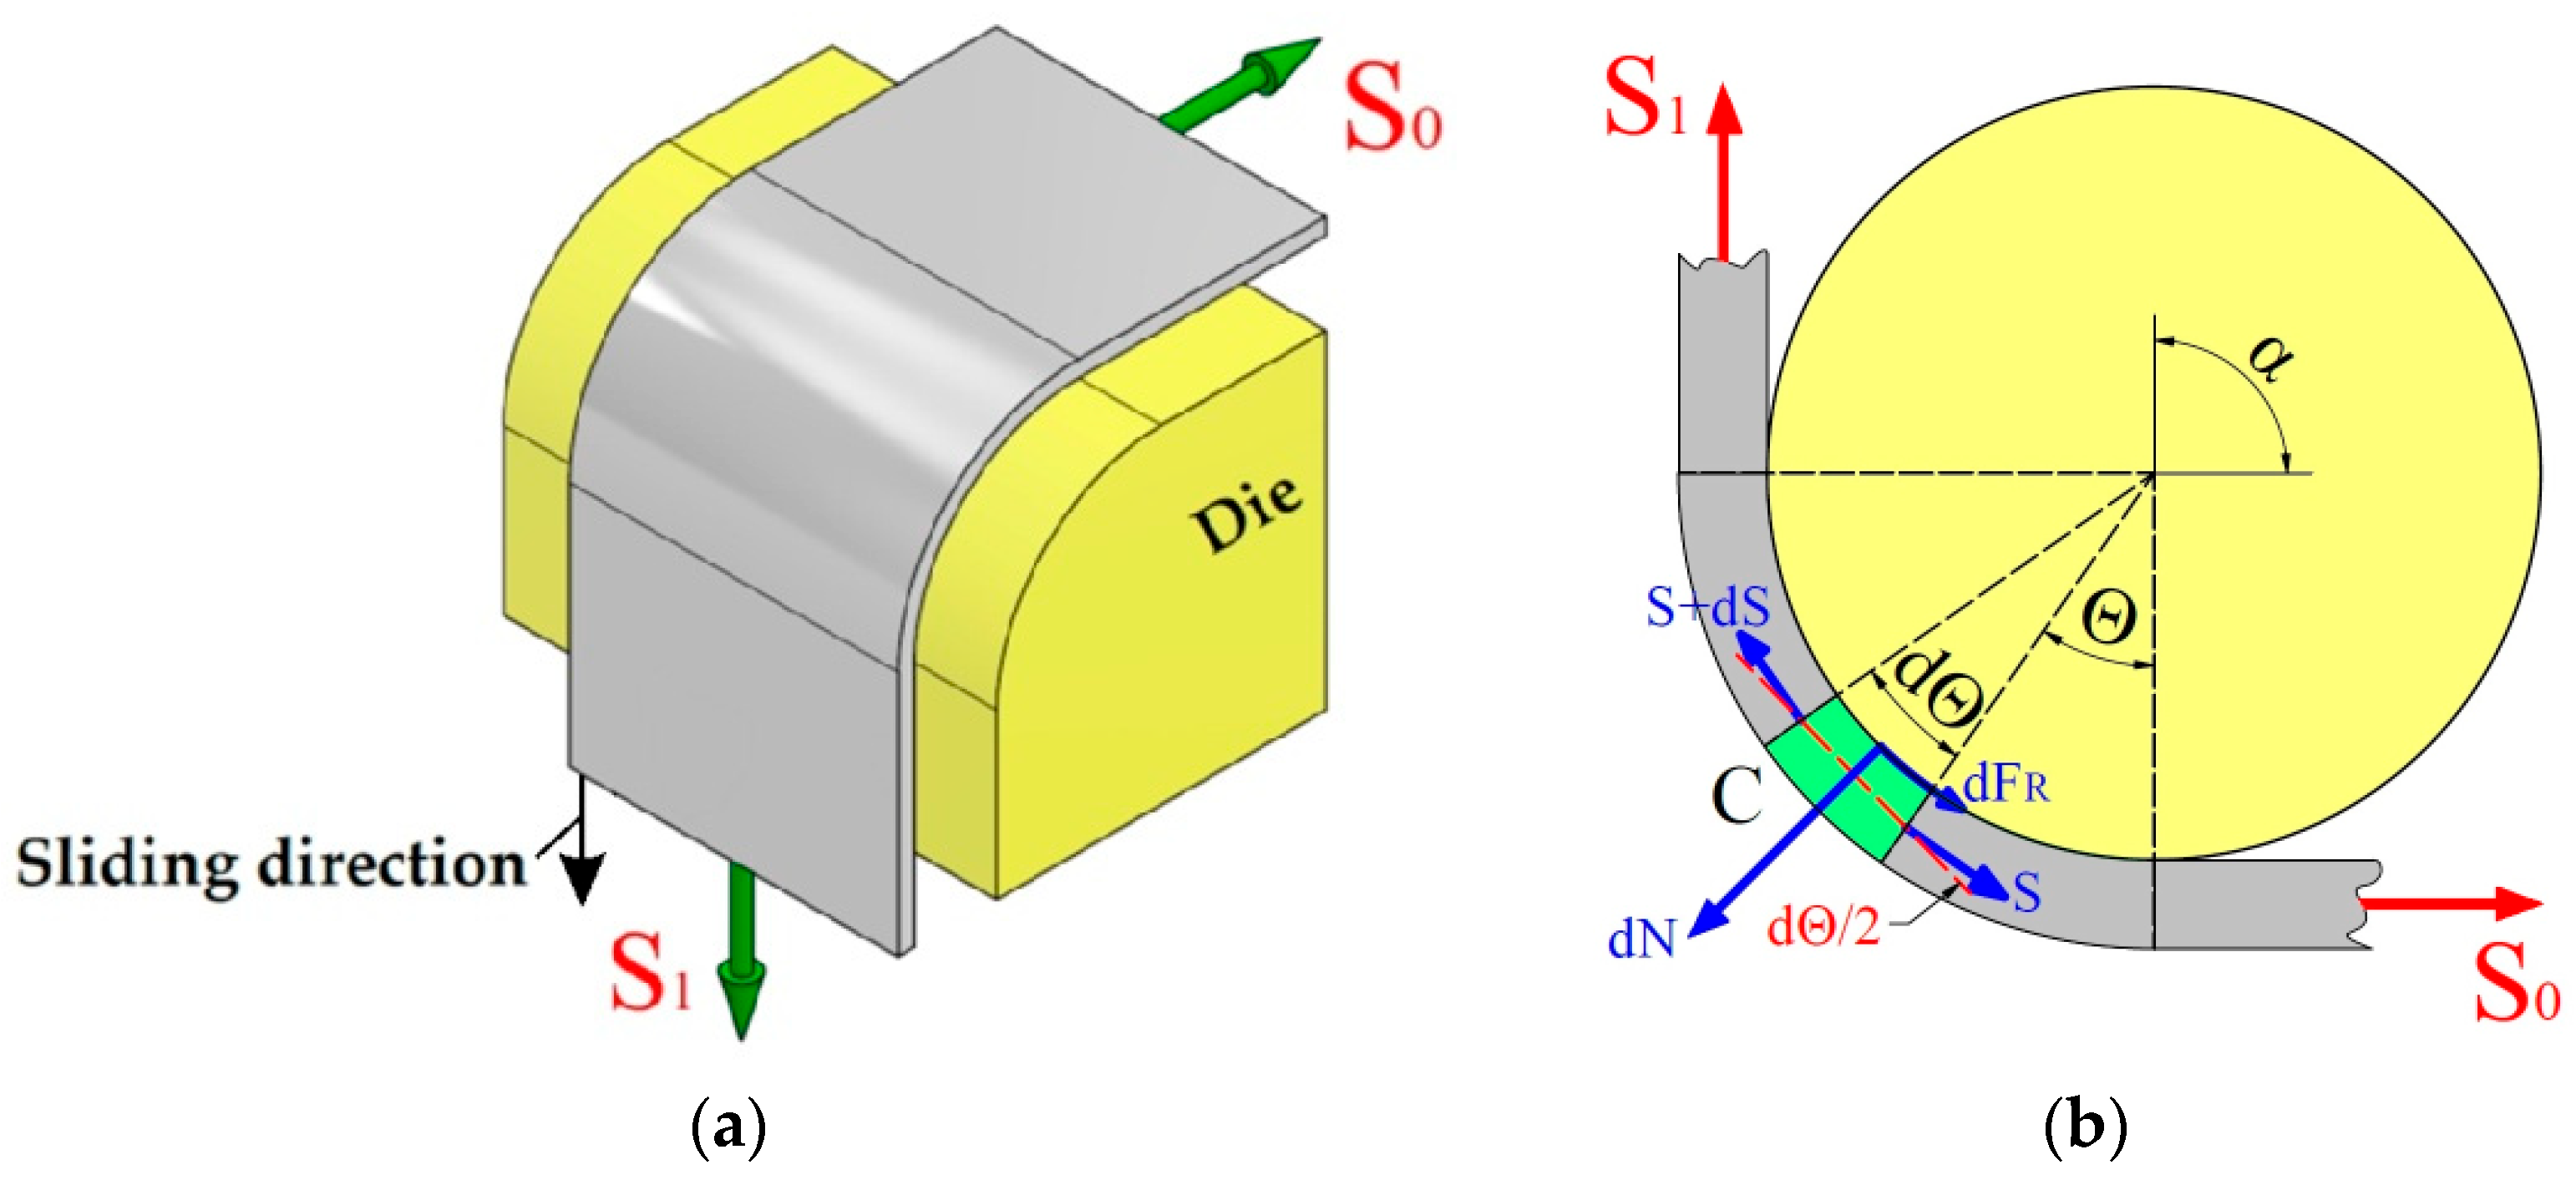
The tests were performed using strip samples (400 mm long and 25 mm wide). All samples were cut at an angle of 0° to the RD to maintain consistency of the obtained results and to avoid differences resulting from the orientation of the samples. The sample was wrapped around the cylindrical countersample with a contact angle of 90° (Figure 4). The sample was stretched until fracture, which enabled the assessment of the friction characteristics in the contact zone. The value of the CoF for the contact angle of 90° was determined from the Equation (1):
where S1 is the front-tension force recorded by the measuring system of the testing machine, and S0 is the back-tension force recorded by the Kistler type 9345B sensor.
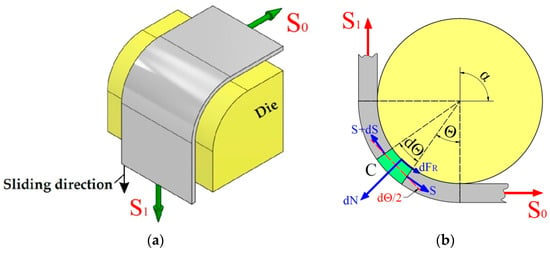
Figure 4.
(a) A strip of sheet metal wrapped around a cylindrical countersample and (b) the distribution of forces acting on an elementary section of the sheet metal.
2.3. Preparation and Characterisation of Countersamples
The countersamples used in the tests were cylinders made of cold-work tool steel 145Cr6. The working surfaces of three countersamples were modified with anti-wear coatings. The methods of modifying the surface of the countersamples are presented in detail in Table 3. The unmodified countersample was used as a reference. The surface of the countersamples, before the lead ion implantation process and before the electron beam modification, was obtained by turning. This operation was carried out on a Yamazaki Mazak 420H II CNC turning and milling centre (Yamazaki Mazak Corporation, Ōguchi, Aichi Prefecture, Japan). The machining speed was 140 m/min, and the feed rate was 0.15 mm/rev. The cutting depth was 0.8 mm. The cutting tool was DNMG 110404-M3M IC830 insert. This enabled the evaluation of the effectiveness of the surface modifications in relation to the original, unmodified surface of the countersample.

Table 3.
Method of preparing the surface of countersamples (parameters).
2.3.1. Modification of the Surface Layer of Countersamples
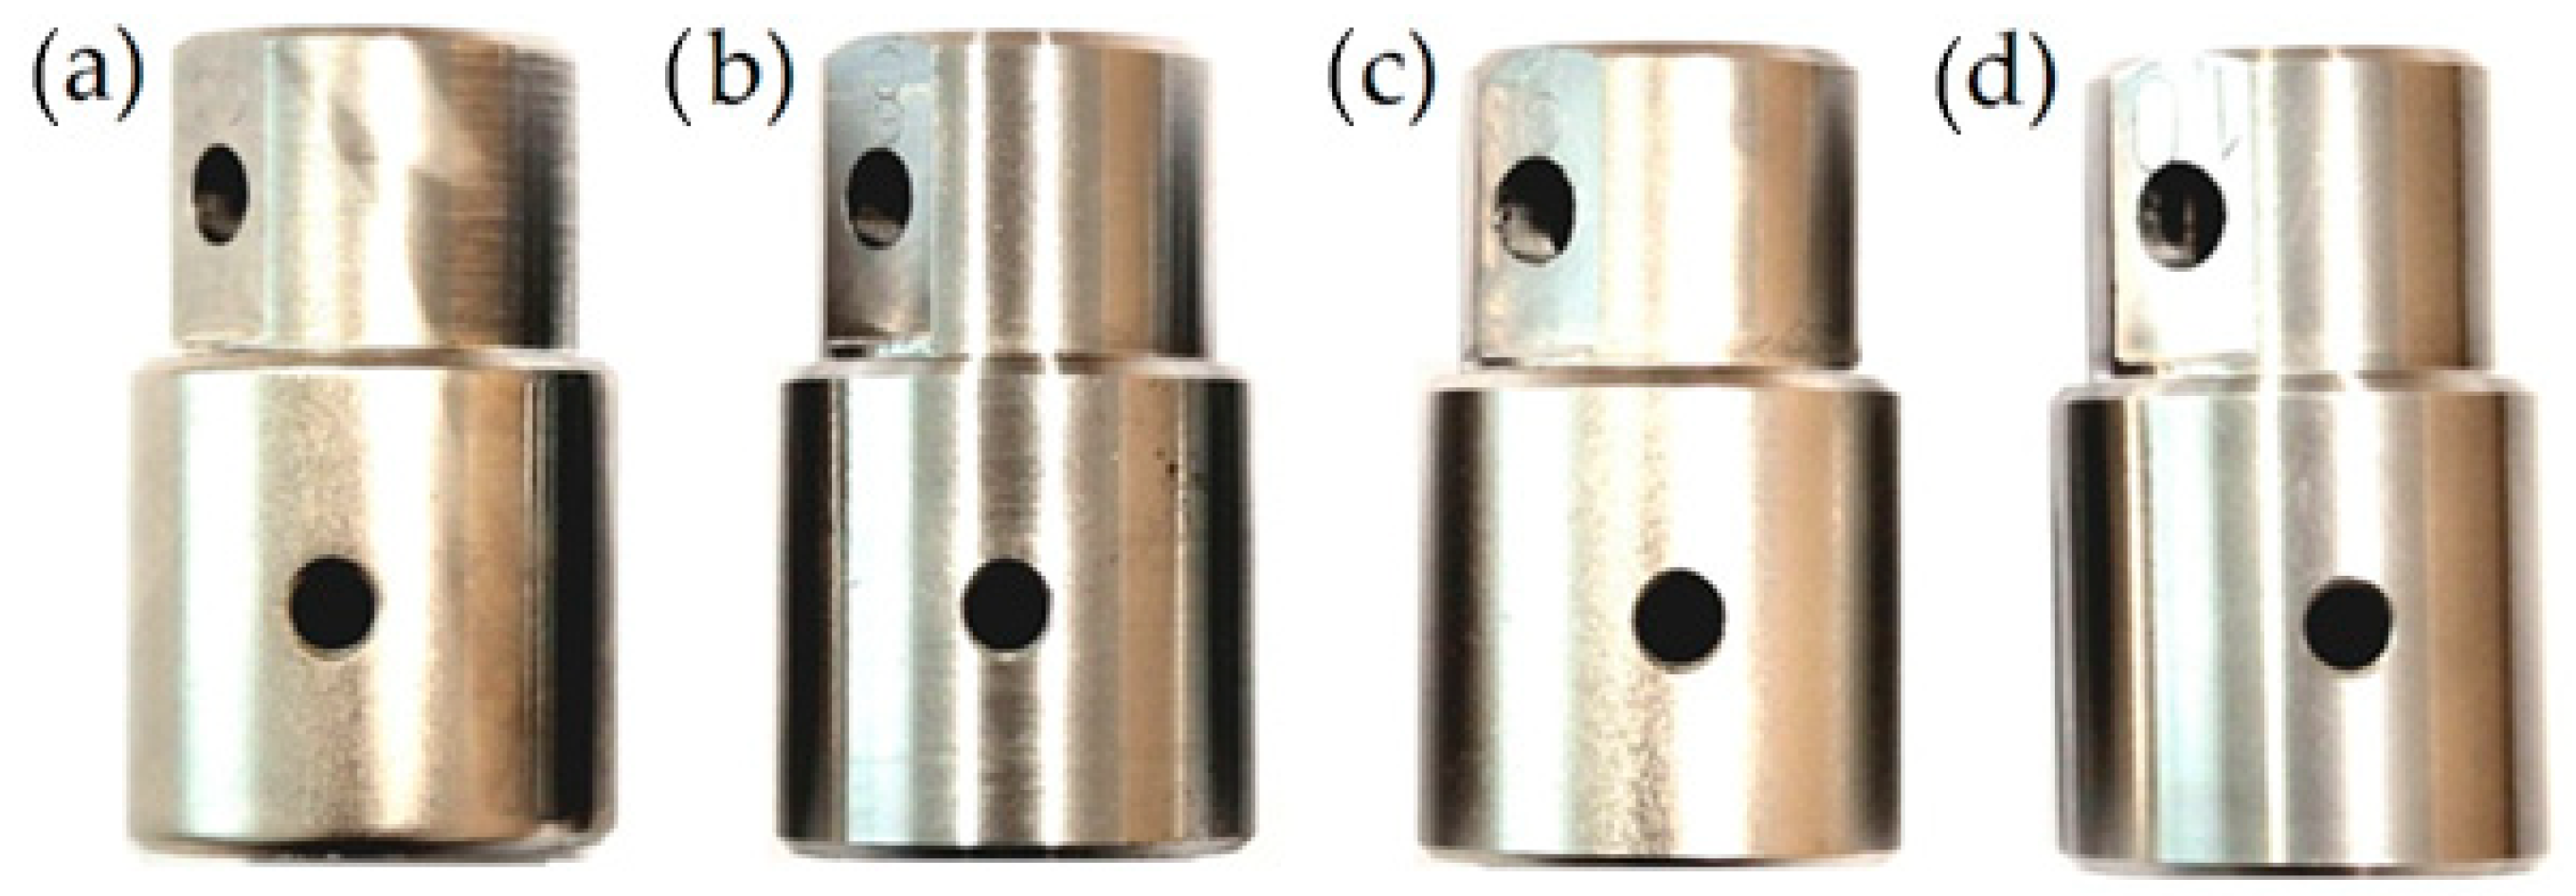
Four 145Cr6 steel countersamples are shown in Figure 5, three of which were modified/annealed/irradiated/processed in 2–3 steps. The modification in the second and third steps was carried out after rotating the countersamples by about 90°.
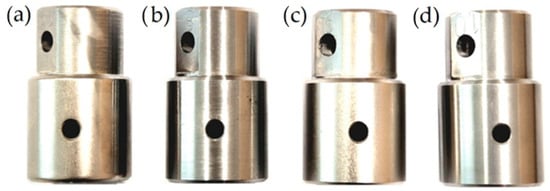
Figure 5.
Countersamples made of 145Cr6 steel: (a) C-EBM, (b) C-U, (c) C-Pb-EBM and (d) C-Pb.
The following methods were used for the surface modification:
- (1)
- The ion implantation of lead;
- (2)
- The ion implantation of lead and pulse electron annealing;
- (3)
- The pulse electron annealing.
Before the processing, the implanted and electron-annealed countersamples were washed in high-purity acetone under ultrasonic agitation.
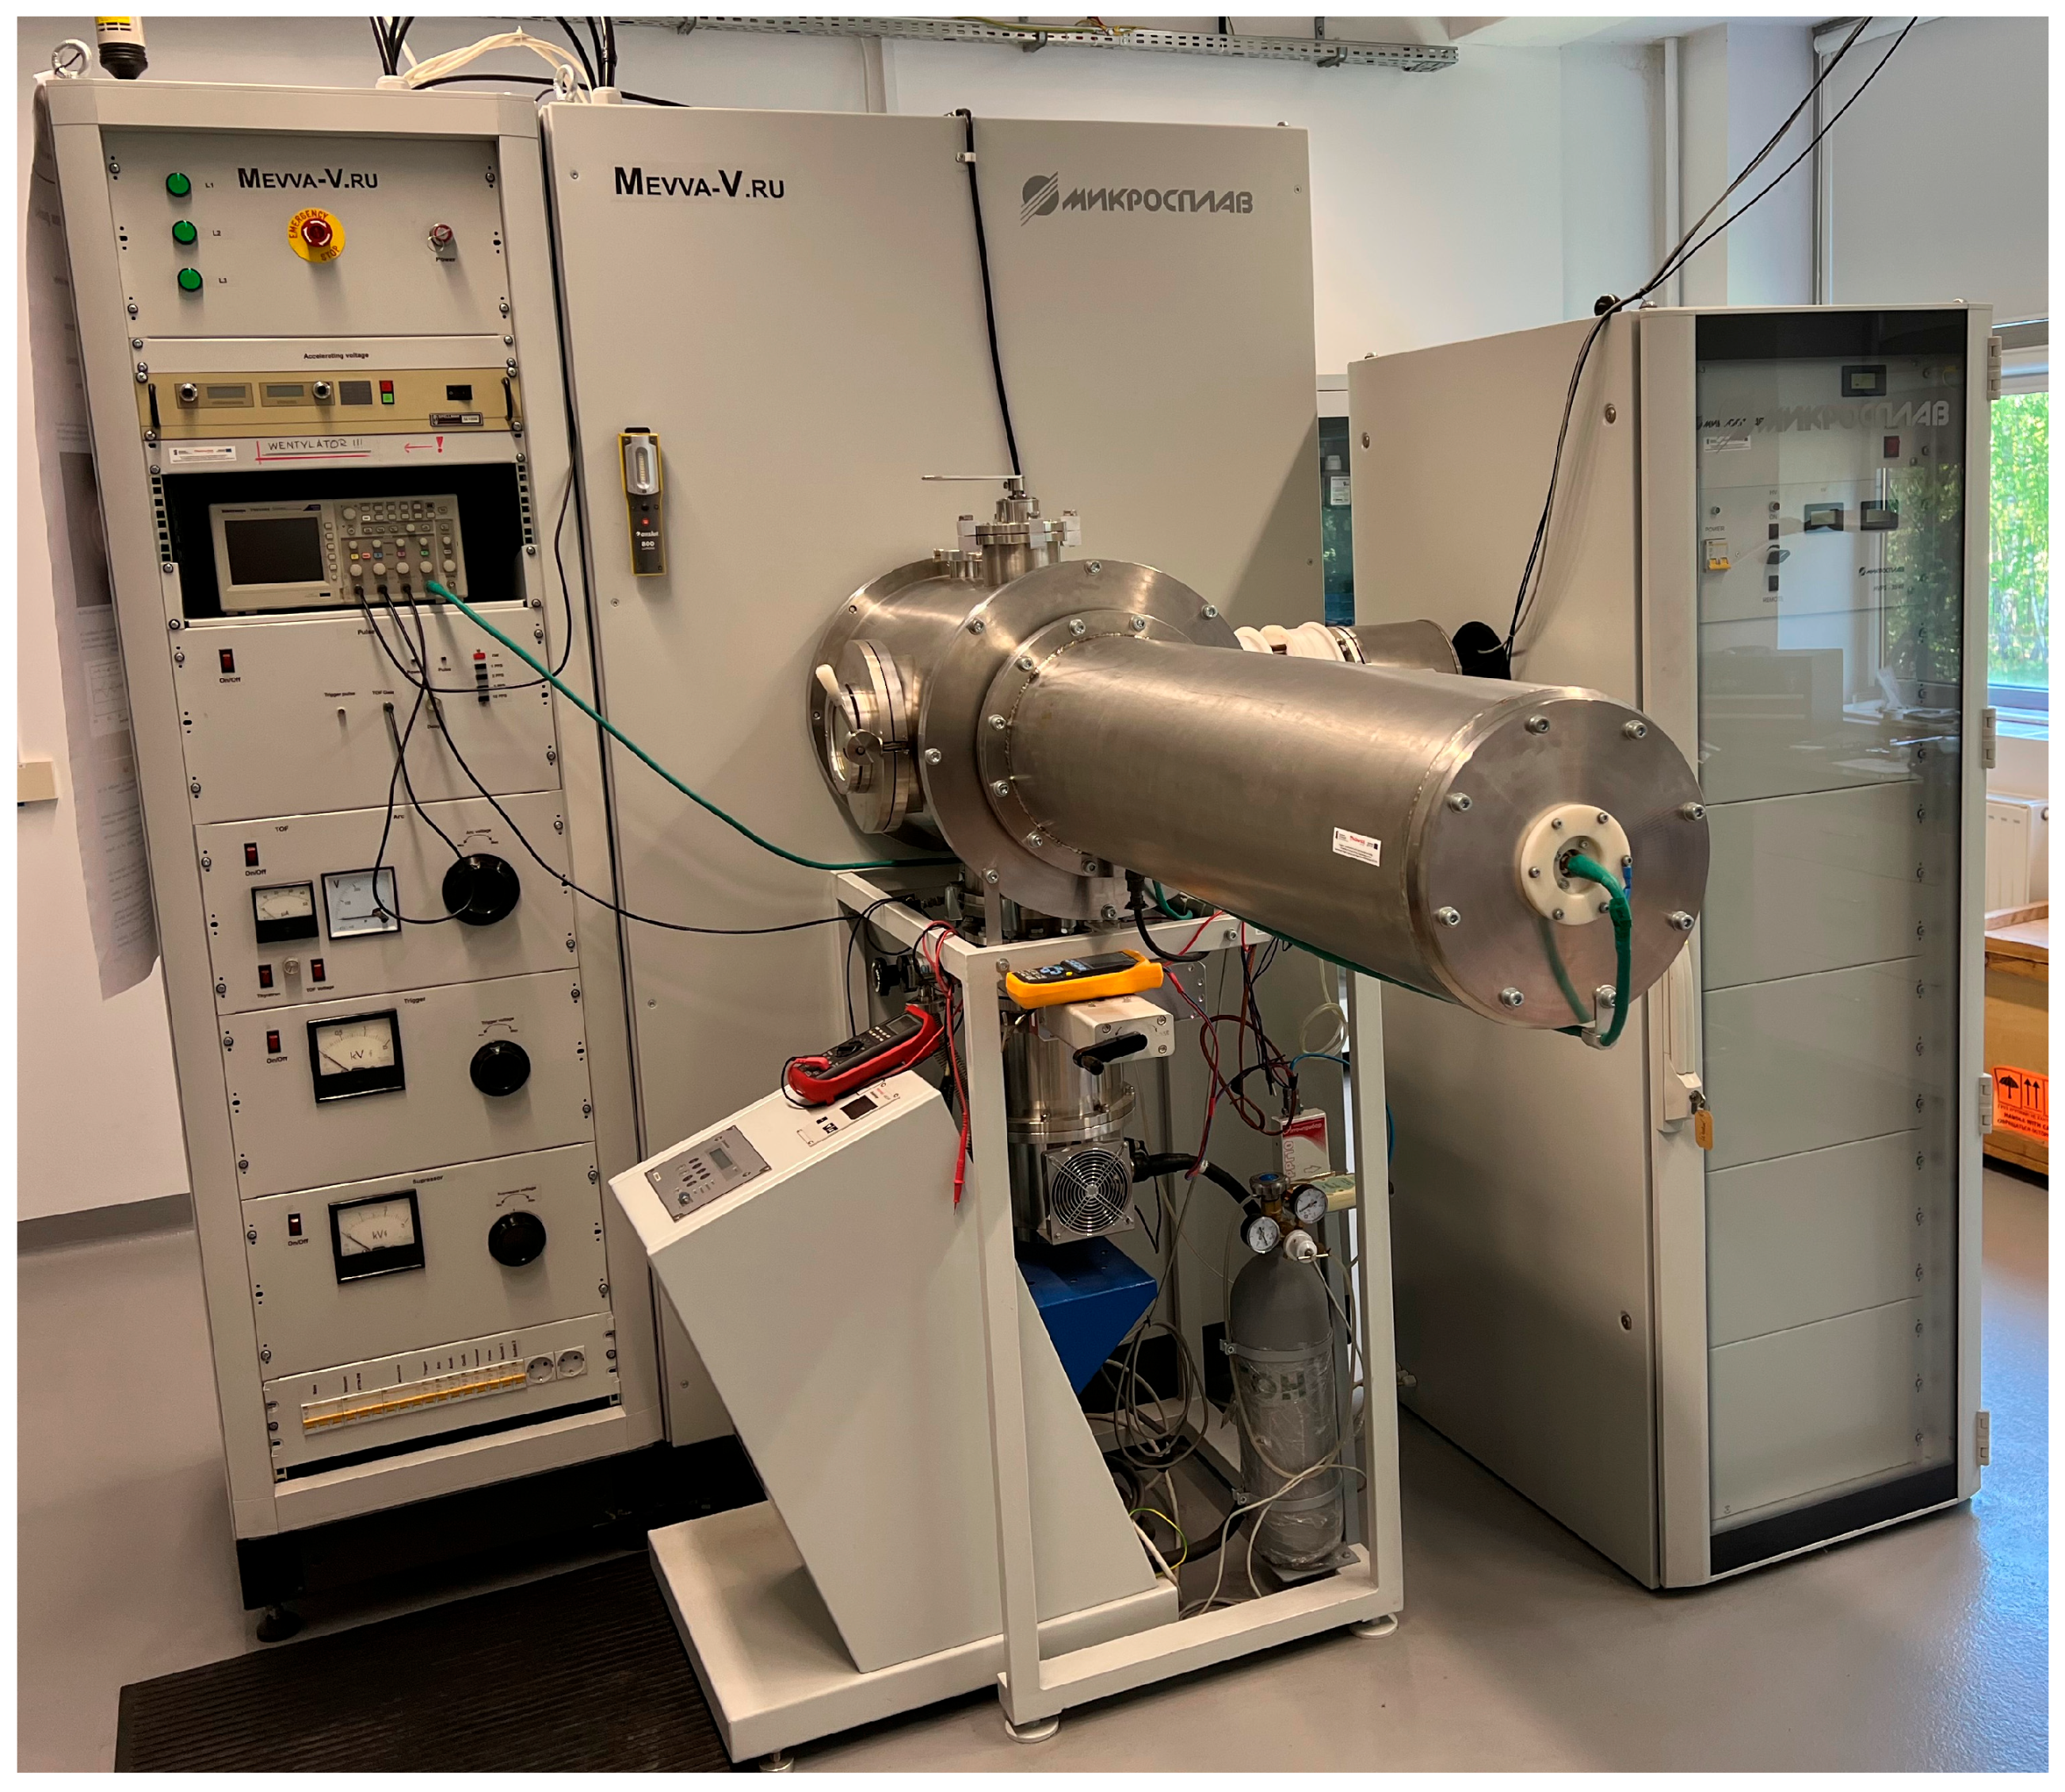
The modification processes were provided at National Centre for Nuclear Studies Świerk in Otwock, Poland, using the MEVVA_V-Ru equipment (Figure 6), manufactured by High Current Electronics Institute/The MICROSPLAV company in Tomsk (Russia), consisting of the Metal Vapor Vacuum Arc (MEVVA) type ion implanter [38] with the pulsed ion beam and without mass separation as well as RITM-2M electron beam gun (RITM), joined by a common vacuum chamber.
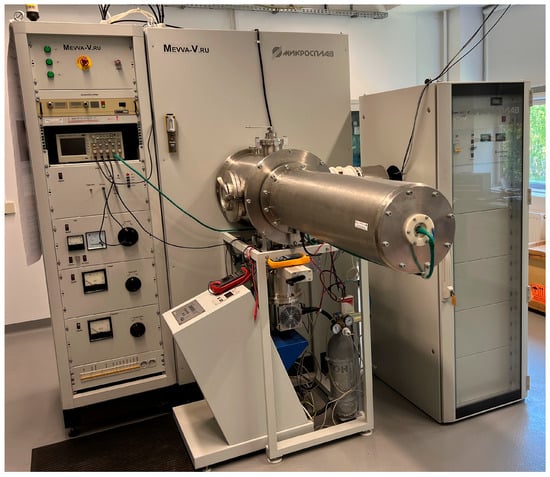
Figure 6.
The general view of MEVVA_V-Ru equipment.
The process conditions of the ion implantations were as follows:
- -
- The implanted fluence/dose of Pb ions: 6.3·1017 cm−2 for each implanted side;
- -
- The current of the ion beam: 100 mA;
- -
- The acceleration voltage: 60 kV;
- -
- The pulse duration (FWHM): 400 µs;
- -
- The pulse frequency: 10 Hz;
- -
- The maximum measured temperature: below 120 °C.
The main parameters of the described processes were the following:
- -
- Working gas: Ar of 99.999% purity;
- -
- Number of pulses: 1 for each annealed side;
- -
- Pulse duration: 2 µs;
- -
- Acceleration voltage in peak/electron energy: 25 kV/25 keV;
- -
- Pulse energy density: in the range from 2.27 to 3.34 J/cm2.
2.3.2. Modelling of Ion Implantation and Electron Introduction
The modification processes were supported by the modelling/simulations and calculations of the main parameters of the modelled profiles, like the peak volume dopant concentrations (Nmax, cm−2), the projected range (Rp, nm) and the range straggling (ΔRp, nm). Sometimes, two additional parameters, i.e., the kurtosis and the skewness, are used to describe the divergence in relation to normal distribution (measures of shape). The modelling also allows for determining the theoretical value of the sputtering yield. However, this phenomenon in substrate sputtering by the implanted ions does not account for this phenomenon, which is similar to the substrate damage and the chemical reactions between the implanted ions and/or the substrate components [39].
The term “profile” has a symbolic meaning in the case of electrons because electrons are not particles that remain in the material after losing energy but move in energy bands. “Profile” should be understood as the probability of introducing an electron to a specific depth in the material.
Two freeware type codes were used, i.e., SRIM-2013.00 (SRIM) for the ion implantation modelling and SUSPRE—for the modelling of electron range (SUSPRE).
The modelling processes, using SRIM code, were performed in the “Monolayer Collision Steps/Surface Sputtering” mode for 100,000 ions implanted perpendicular to the implanted substrate (the ion incidence angle was defined as 0°) due to the best conditions for the ion implantation. The simulations were performed at absolute zero for all the cases. Iron—the main component of the steel, with a density of 7.866 g/cm3, was adopted as a substrate material in all modelling cases. Non-mass separated beams of ions, i.e., Pb+ + Pb2+ in the per cent ratio of 40:60, were applied. The modelling adopted acceleration voltage was 60 kV, i.e., ion energy values were 60 keV and 120 keV for Pb+ and Pb2+, respectively.
The calculations of electron range, using the SUSPRE code, were performed for electrons introduced perpendicular to the treated substrate. Also, in this case, iron, with a density of 7.866 g/cm3, i.e., the main component of the steel, was adopted as the substrate material. Electron energy was 25 keV. The adopted, calculated value of electron fluence was 5.68·1014 cm−2 for an electron pulse energy density of 2.27 J/cm2 and 8.35·1014 cm−2 for 3.34 J/cm2.
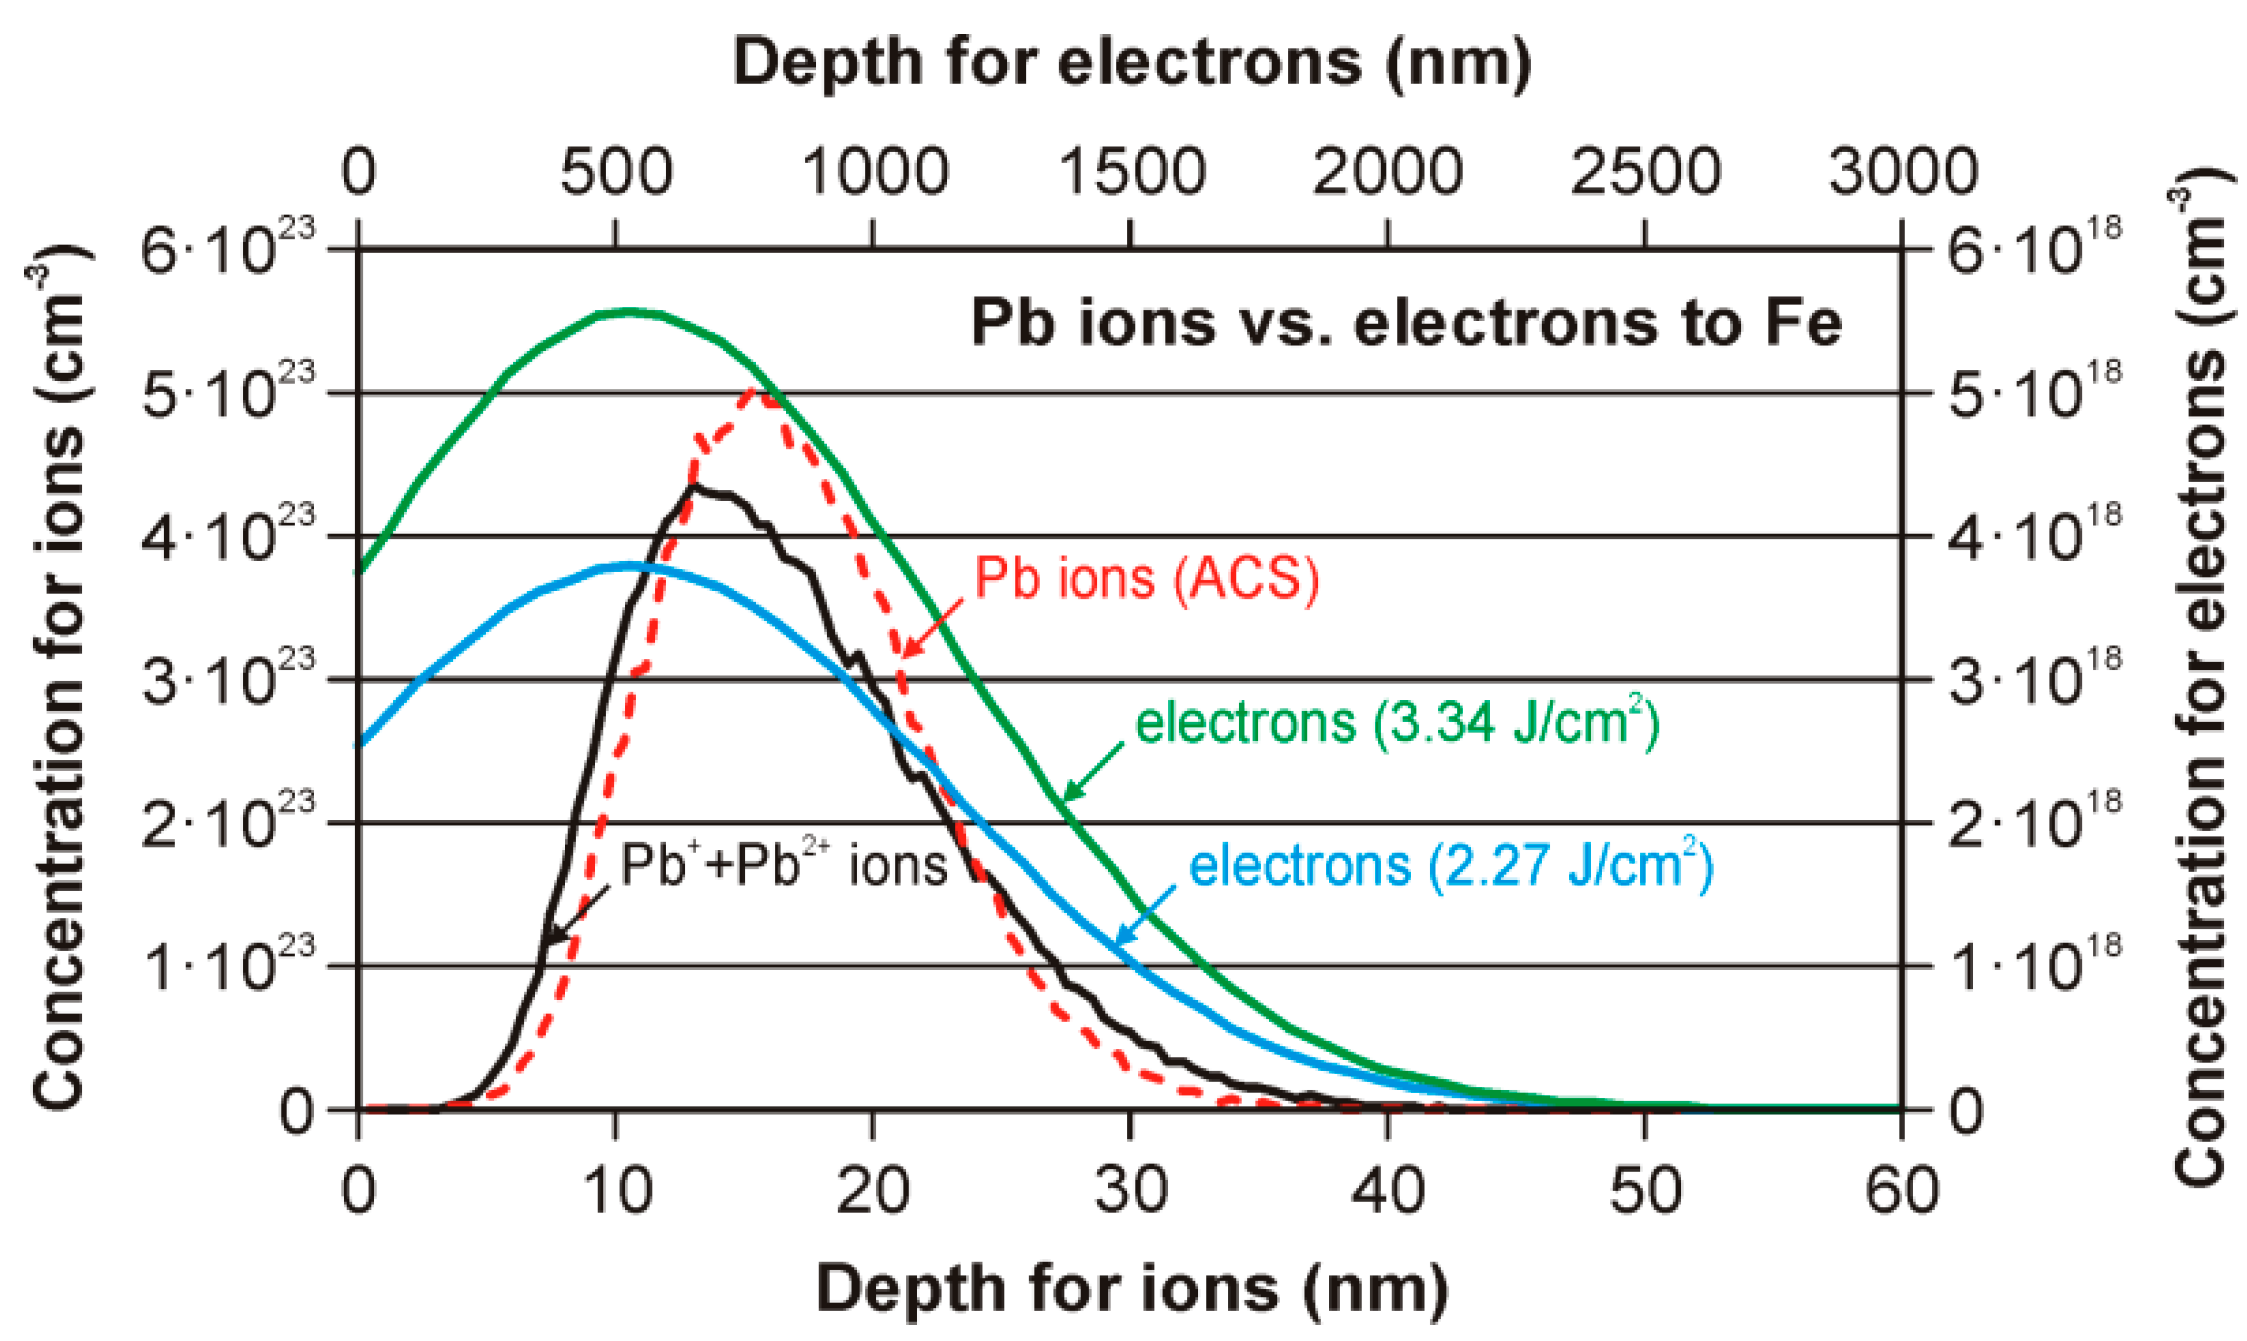
Figure 7 and Table 4 present the results of the modelling of the depth profiles for implanted ions and the introduced electrons to the iron substrate without taking into account the sputtering phenomenon. All presented profiles have a shape close to a Gaussian curve, also known as the normal distribution or bell curve, and can be simply defined with three main parameters, i.e., the peak volume dopant/electron concentration, the projected range, and the range straggling. The values of the skewness and the kurtosis were calculated for the ion profiles. Additionally, the theoretical values of the sputtering yield were shown. In the case of Pb ions, the values for the ACS profile were presented in round brackets.
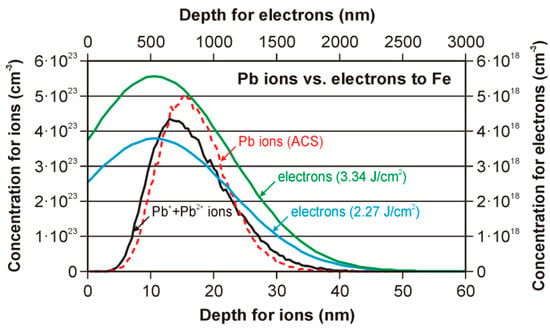
Figure 7.
The modelled depth profiles of the implanted ions of lead and the introduced electrons in iron.

Table 4.
The main peak parameters of the modelling of the implanted ions and the introduced electrons to the iron substrate.
The differences between Pb+ + Pb2+ and ACS profiles are visible without the calculation, especially for the peak volume dopant concentration and the projected range. Therefore, using ACS instead of the real spectrum in the considerations can generate errors of several per cent.
The high differences between ions and electron profiles were found. The peak volume concentration is higher by about five orders of magnitude for the ions, while the value of the projected range is higher for electrons by more than 30-fold and the range straggling—about 100-fold.
2.3.3. Surface Topography of Countersamples
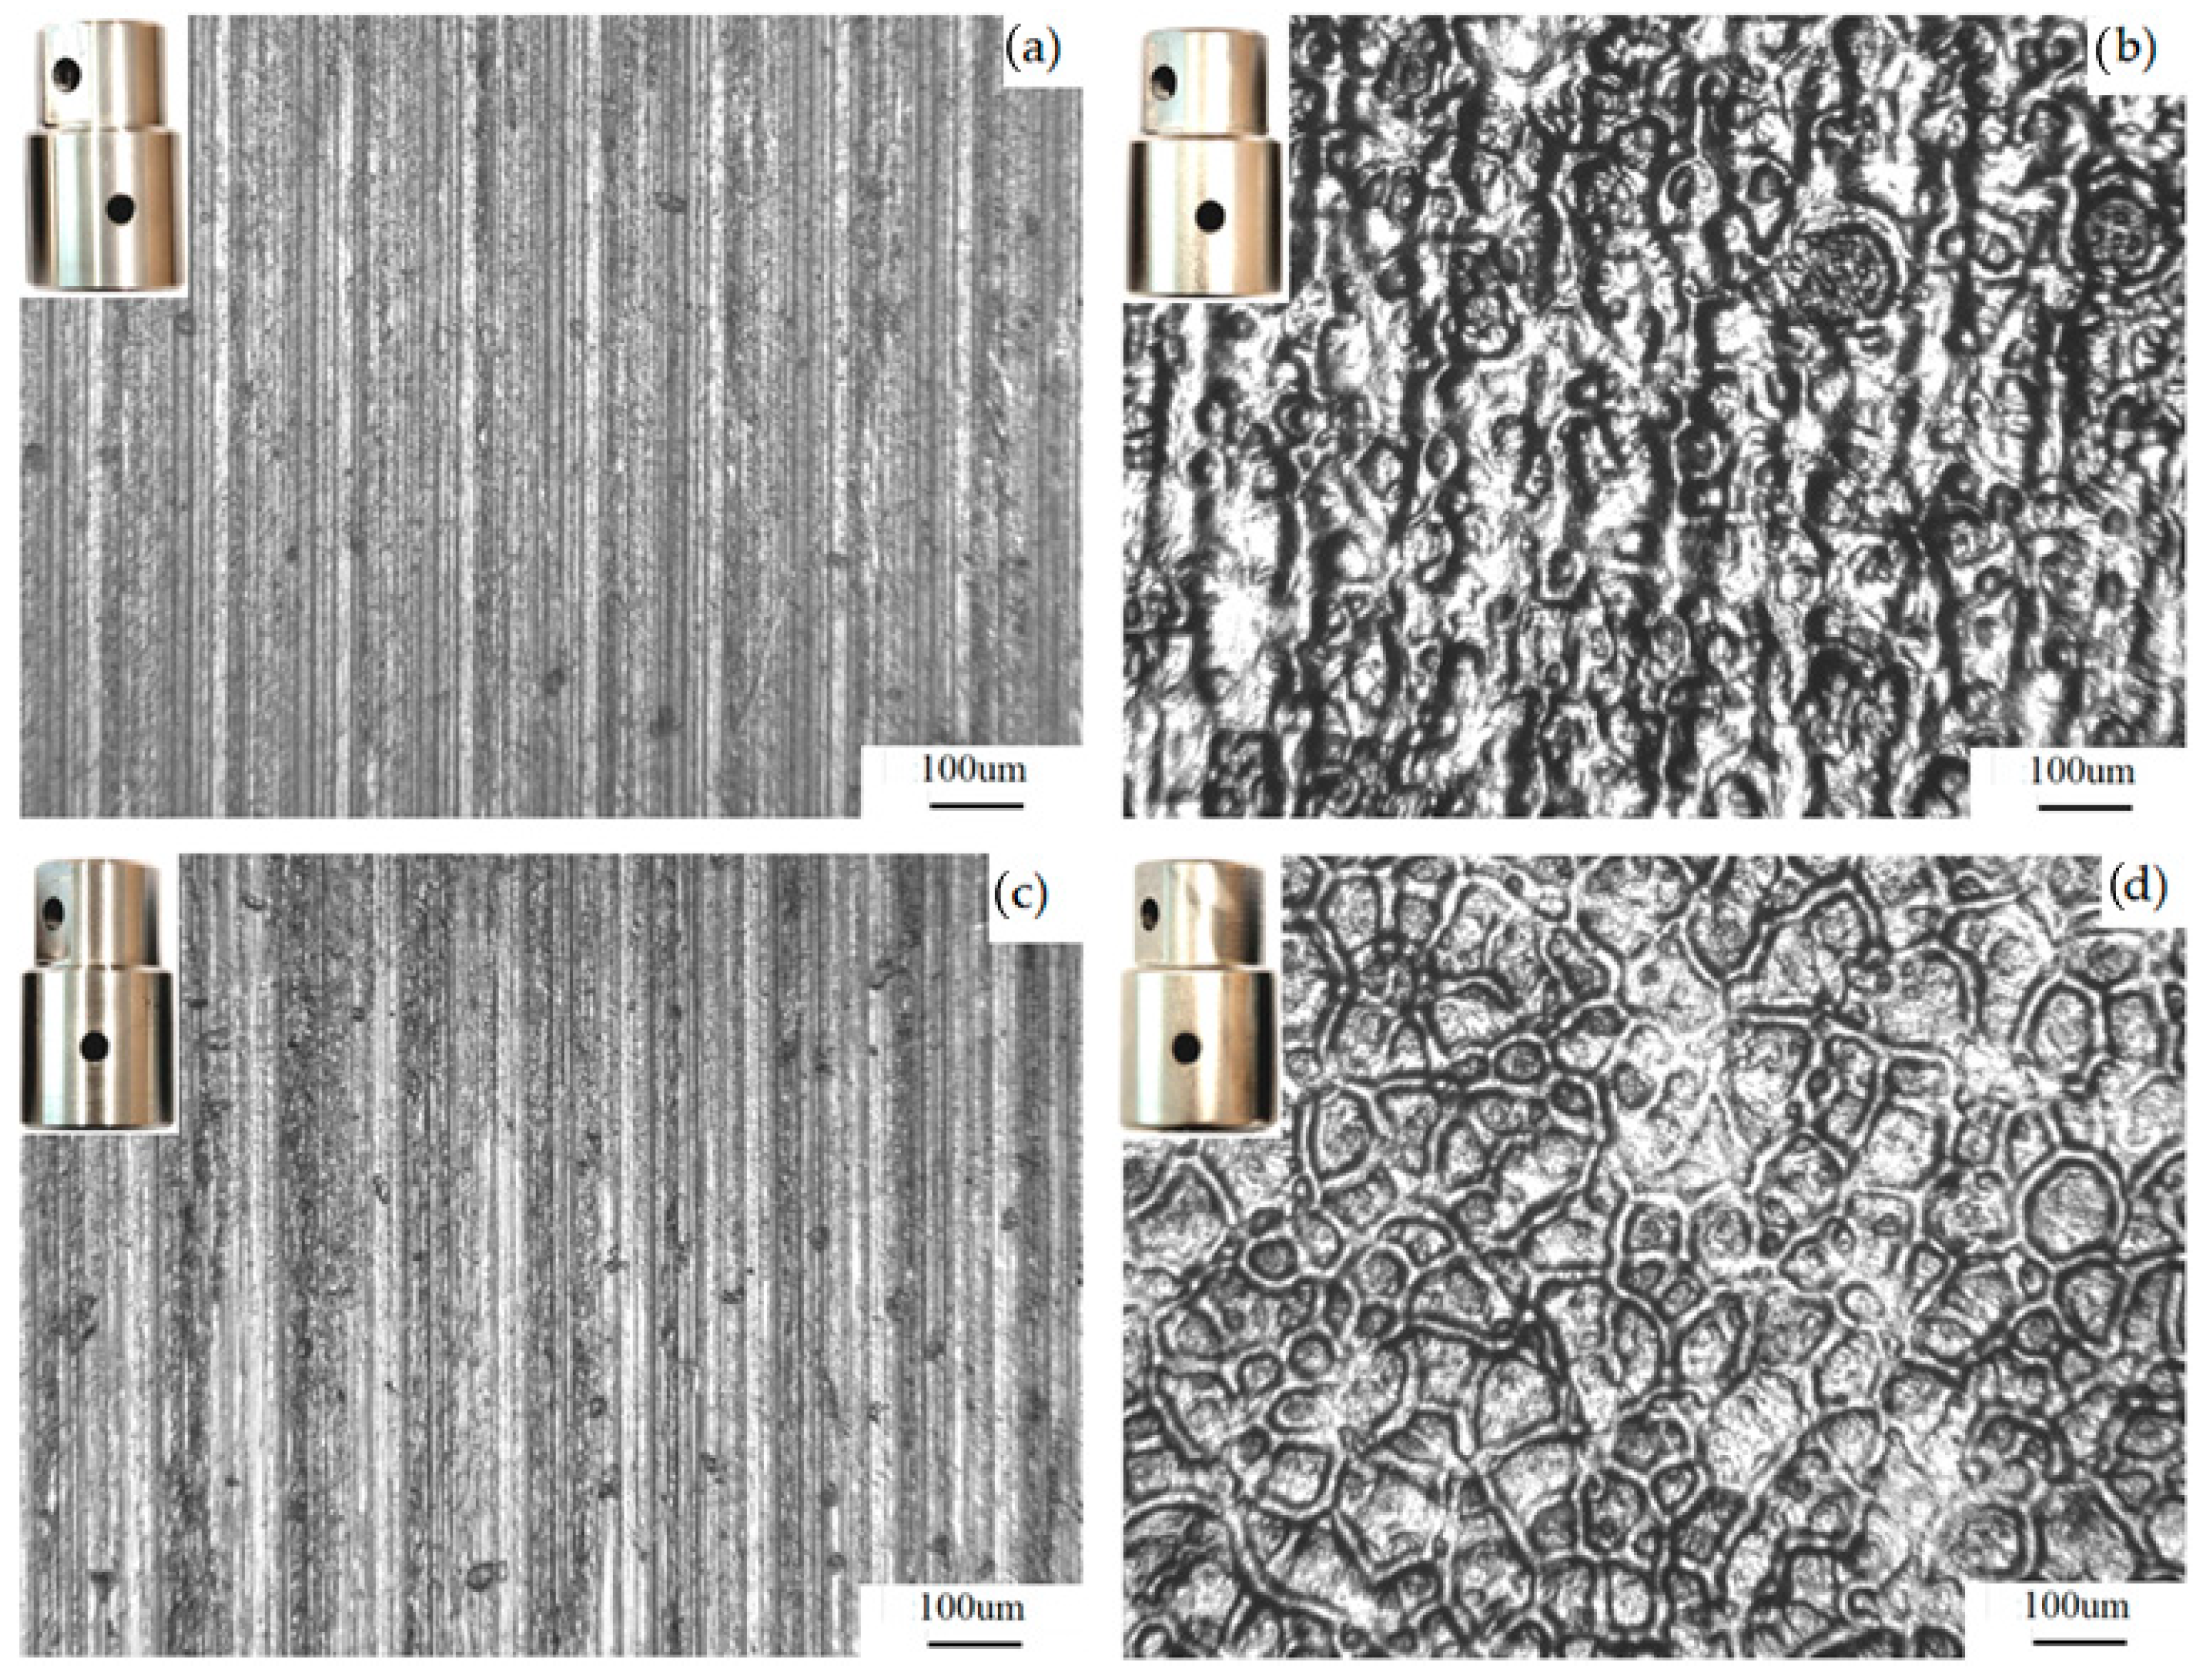
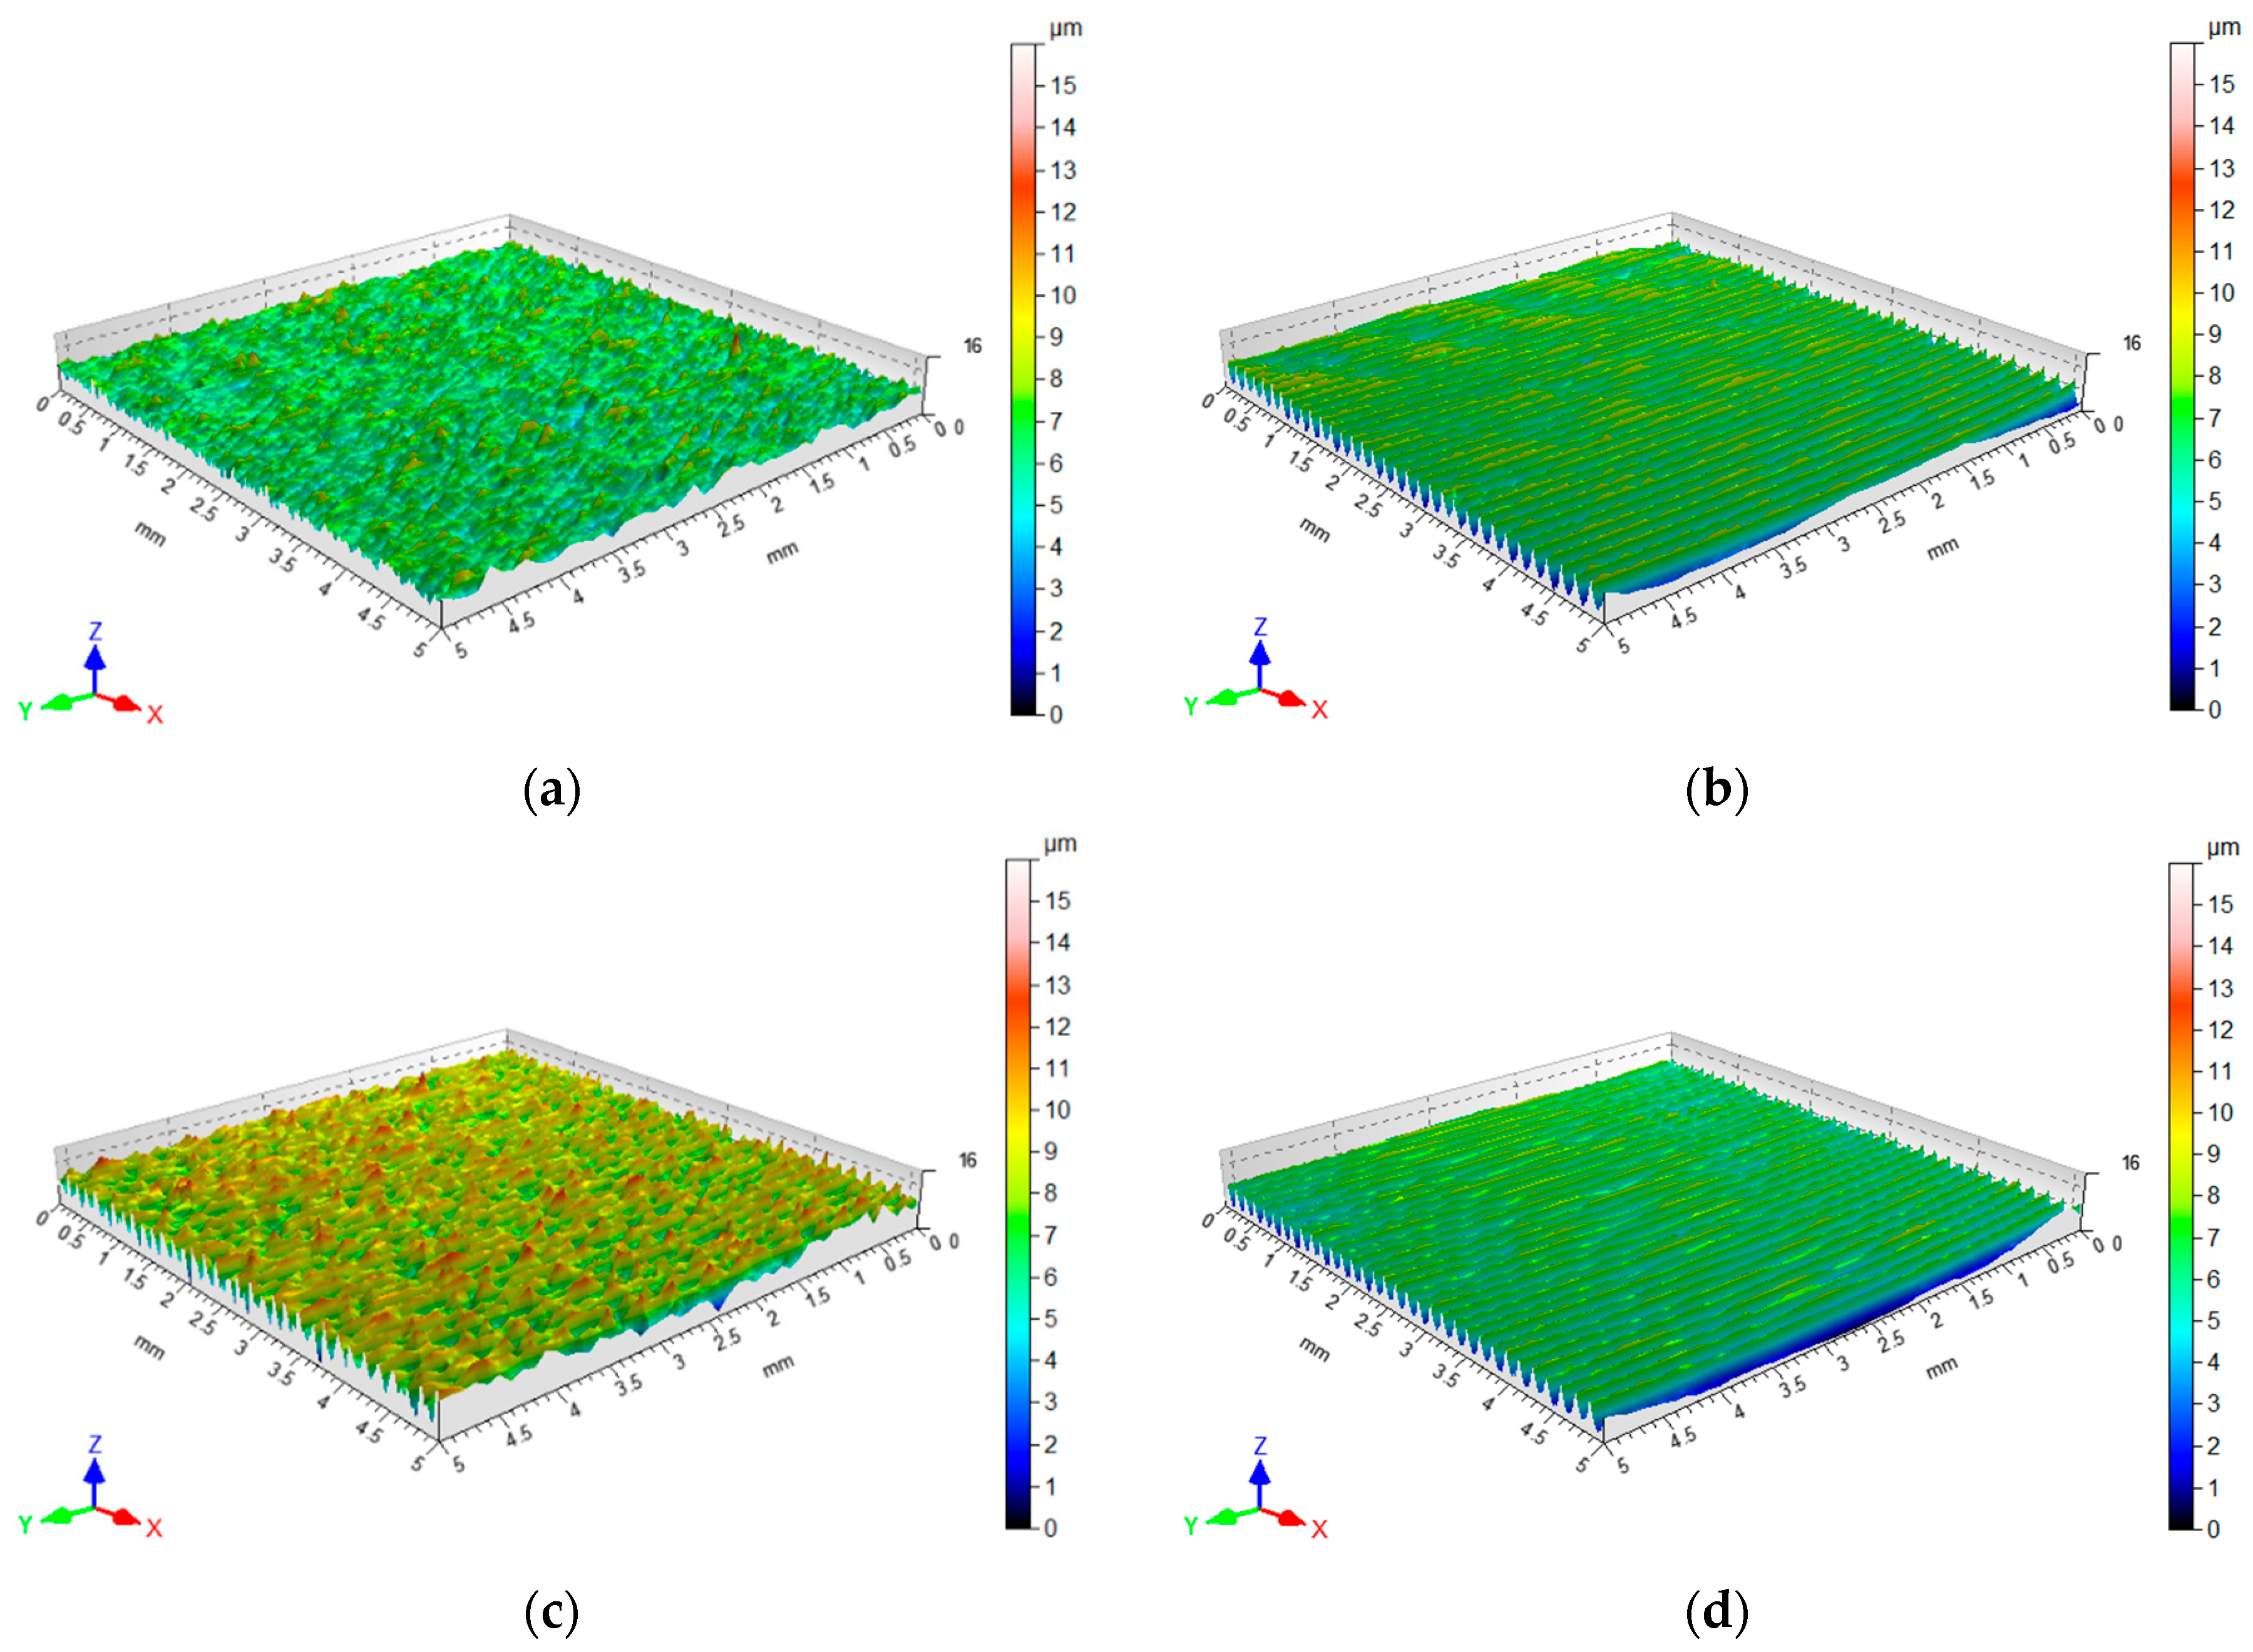
The surfaces of the C-Pb and C-U CSs are characterised by a smooth, directional structure (Figure 8a,c) resulting from the manufacturing process (turning). Due to the modification method, the surface of the EBMed countersamples (Figure 8b,d) is characterised by an uneven structure resulting from the solidification of the melted material. In contrast to other types of countersamples, the surface of the C-EBM and C-Pb-EBM countersamples contains many deep valleys, which in lubricated conditions can be considered as “oil pockets” [40]. The small real contact area is associated with the large number of valleys. The surface morphologies of the CSs are presented in Figure 9.
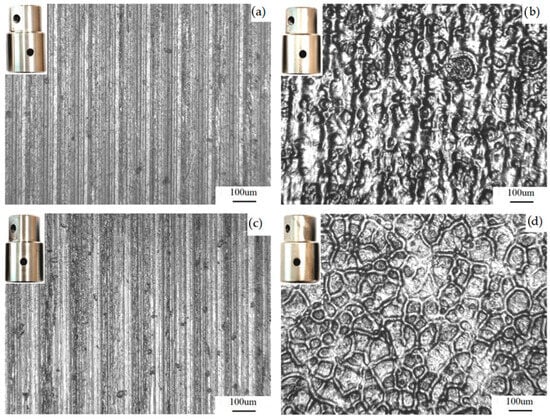
Figure 8.
Optical photographs of CS surfaces: (a) C-Pb, (b) C-Pb-EBM, (c) C-U and (d) C-EBM.
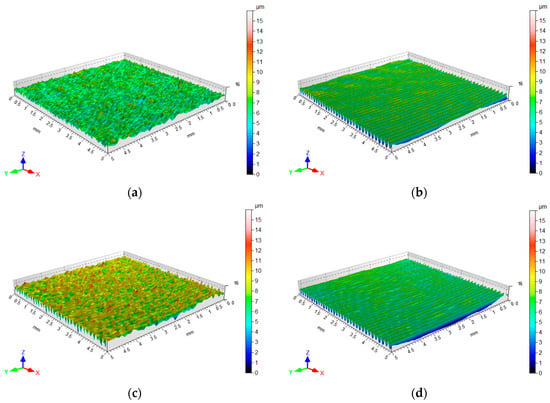
Figure 9.
Surface topography of countersamples: (a) C-EBM, (b) C-U, (c) C-Pb-EBM and (d) C-Pb.
Table 5 lists the values of basic surface roughness parameters describing the tribological properties of the countersample surfaces. Analysis of these parameters allows for the assessment of the surface topography of countersamples after surface modification processes. Three-dimensional roughness parameters are important from the tribological point of view because they determine the real contact area and the way the countersample will interact with the sample surface under friction conditions. Differences in the values of these parameters between modified and unmodified surfaces of countersamples may indicate the effectiveness of the applied modification processes in terms of reducing CoF and surface wear. Skewness and kurtosis have practical engineering significance in tribological analyses. A negative value of skewness increases the CoF compared with the Gaussian distribution. Meanwhile, a positive value of skewness decreases the friction coefficient [41]. When Sku > 3 (sharp height distribution), the influence of kurtosis is reversed.

Table 5.
Basic surface roughness parameters of CSs.
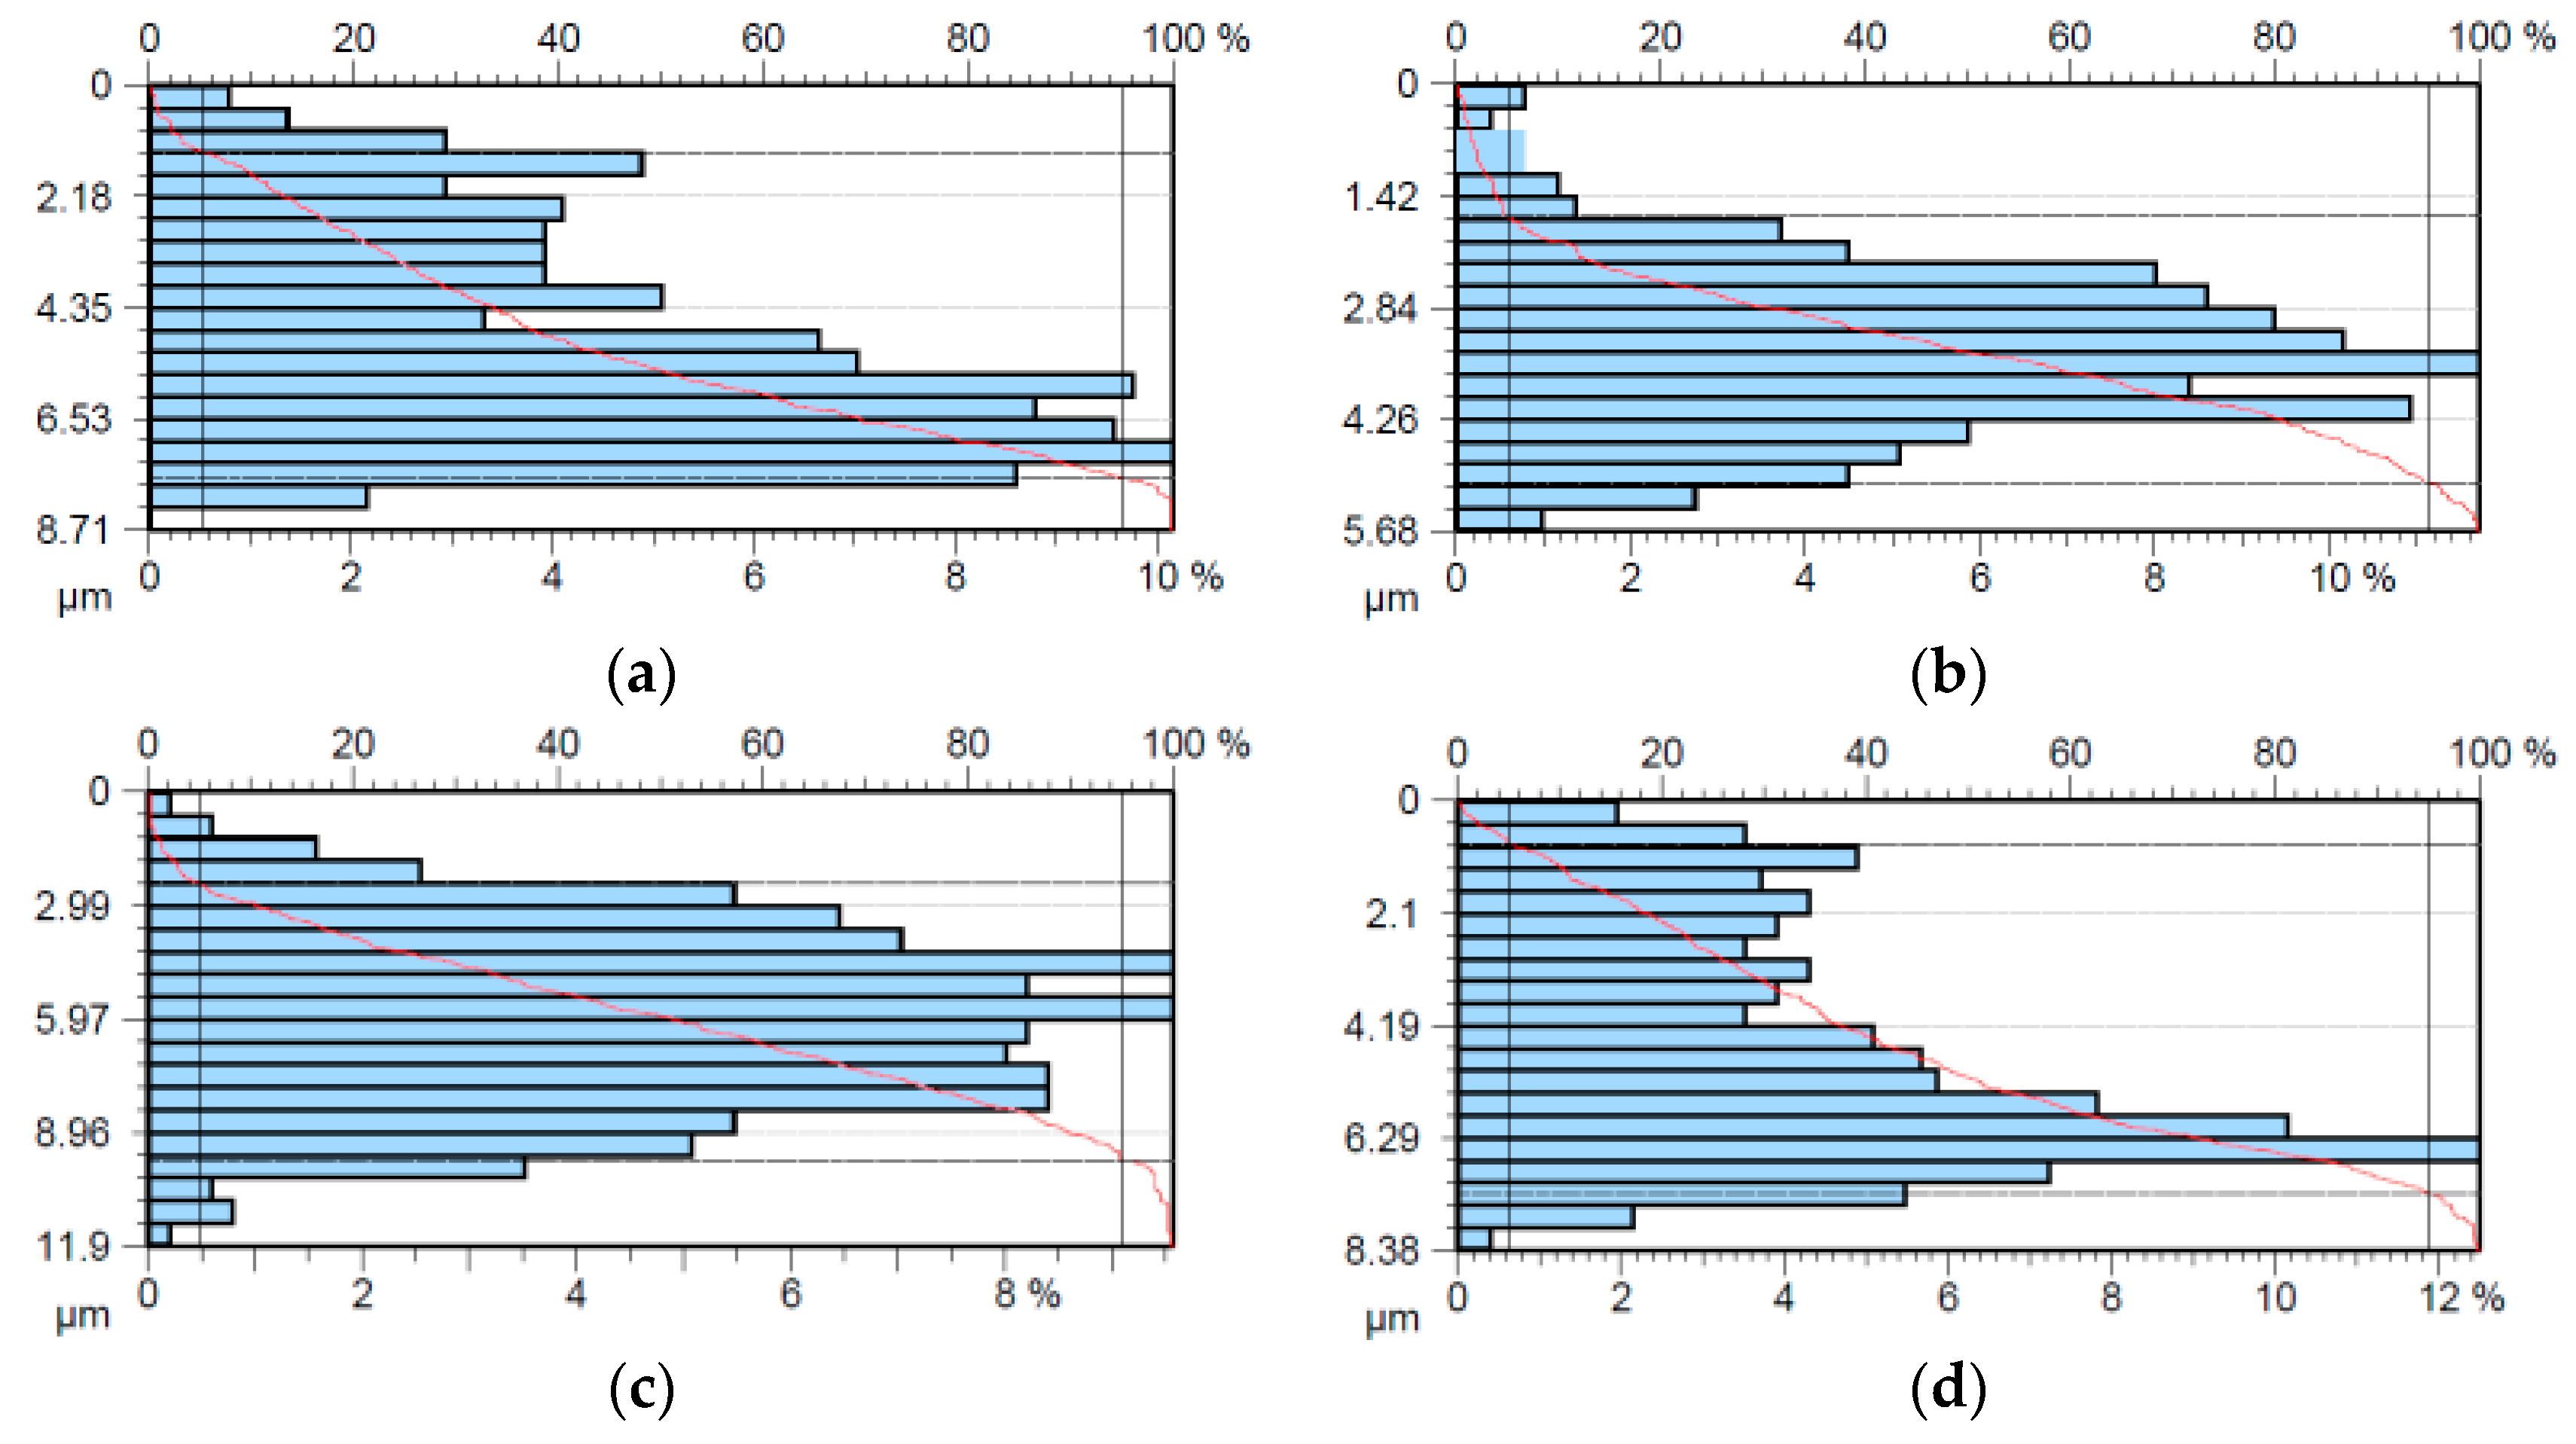
Figure 10 shows the bearing area curves (BACs) obtained after the surface modification process of the countersamples. BAC, also known as the Abbott–Firestone curve, is a method of describing the variation of the profile properties that change with its depth. The BAC indicates the percentage of a surface’s area that is in contact with a given depth. The horizontal axis represents the load-bearing coefficient in percentage terms, while the vertical axis represents the depth determined in measurement units (Figure 10). Based on BACs, reduced height of peaks Rpk and valleys Rvk, core peak-to-valley height Rk, and the smallest (Mr1) and the highest (Mr2) ratios of the roughness core profile were calculated (Table 6).
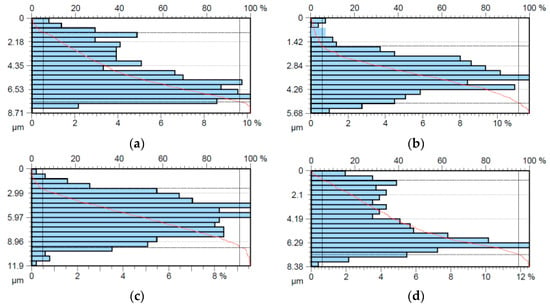
Figure 10.
Abbott–Firestone curves for the following countersamples: (a) C-U, (b) C-EBM, (c) C-Pb-EBM, and (d) C-Pb.

Table 6.
Basic parameters of surface roughness of countersamples.
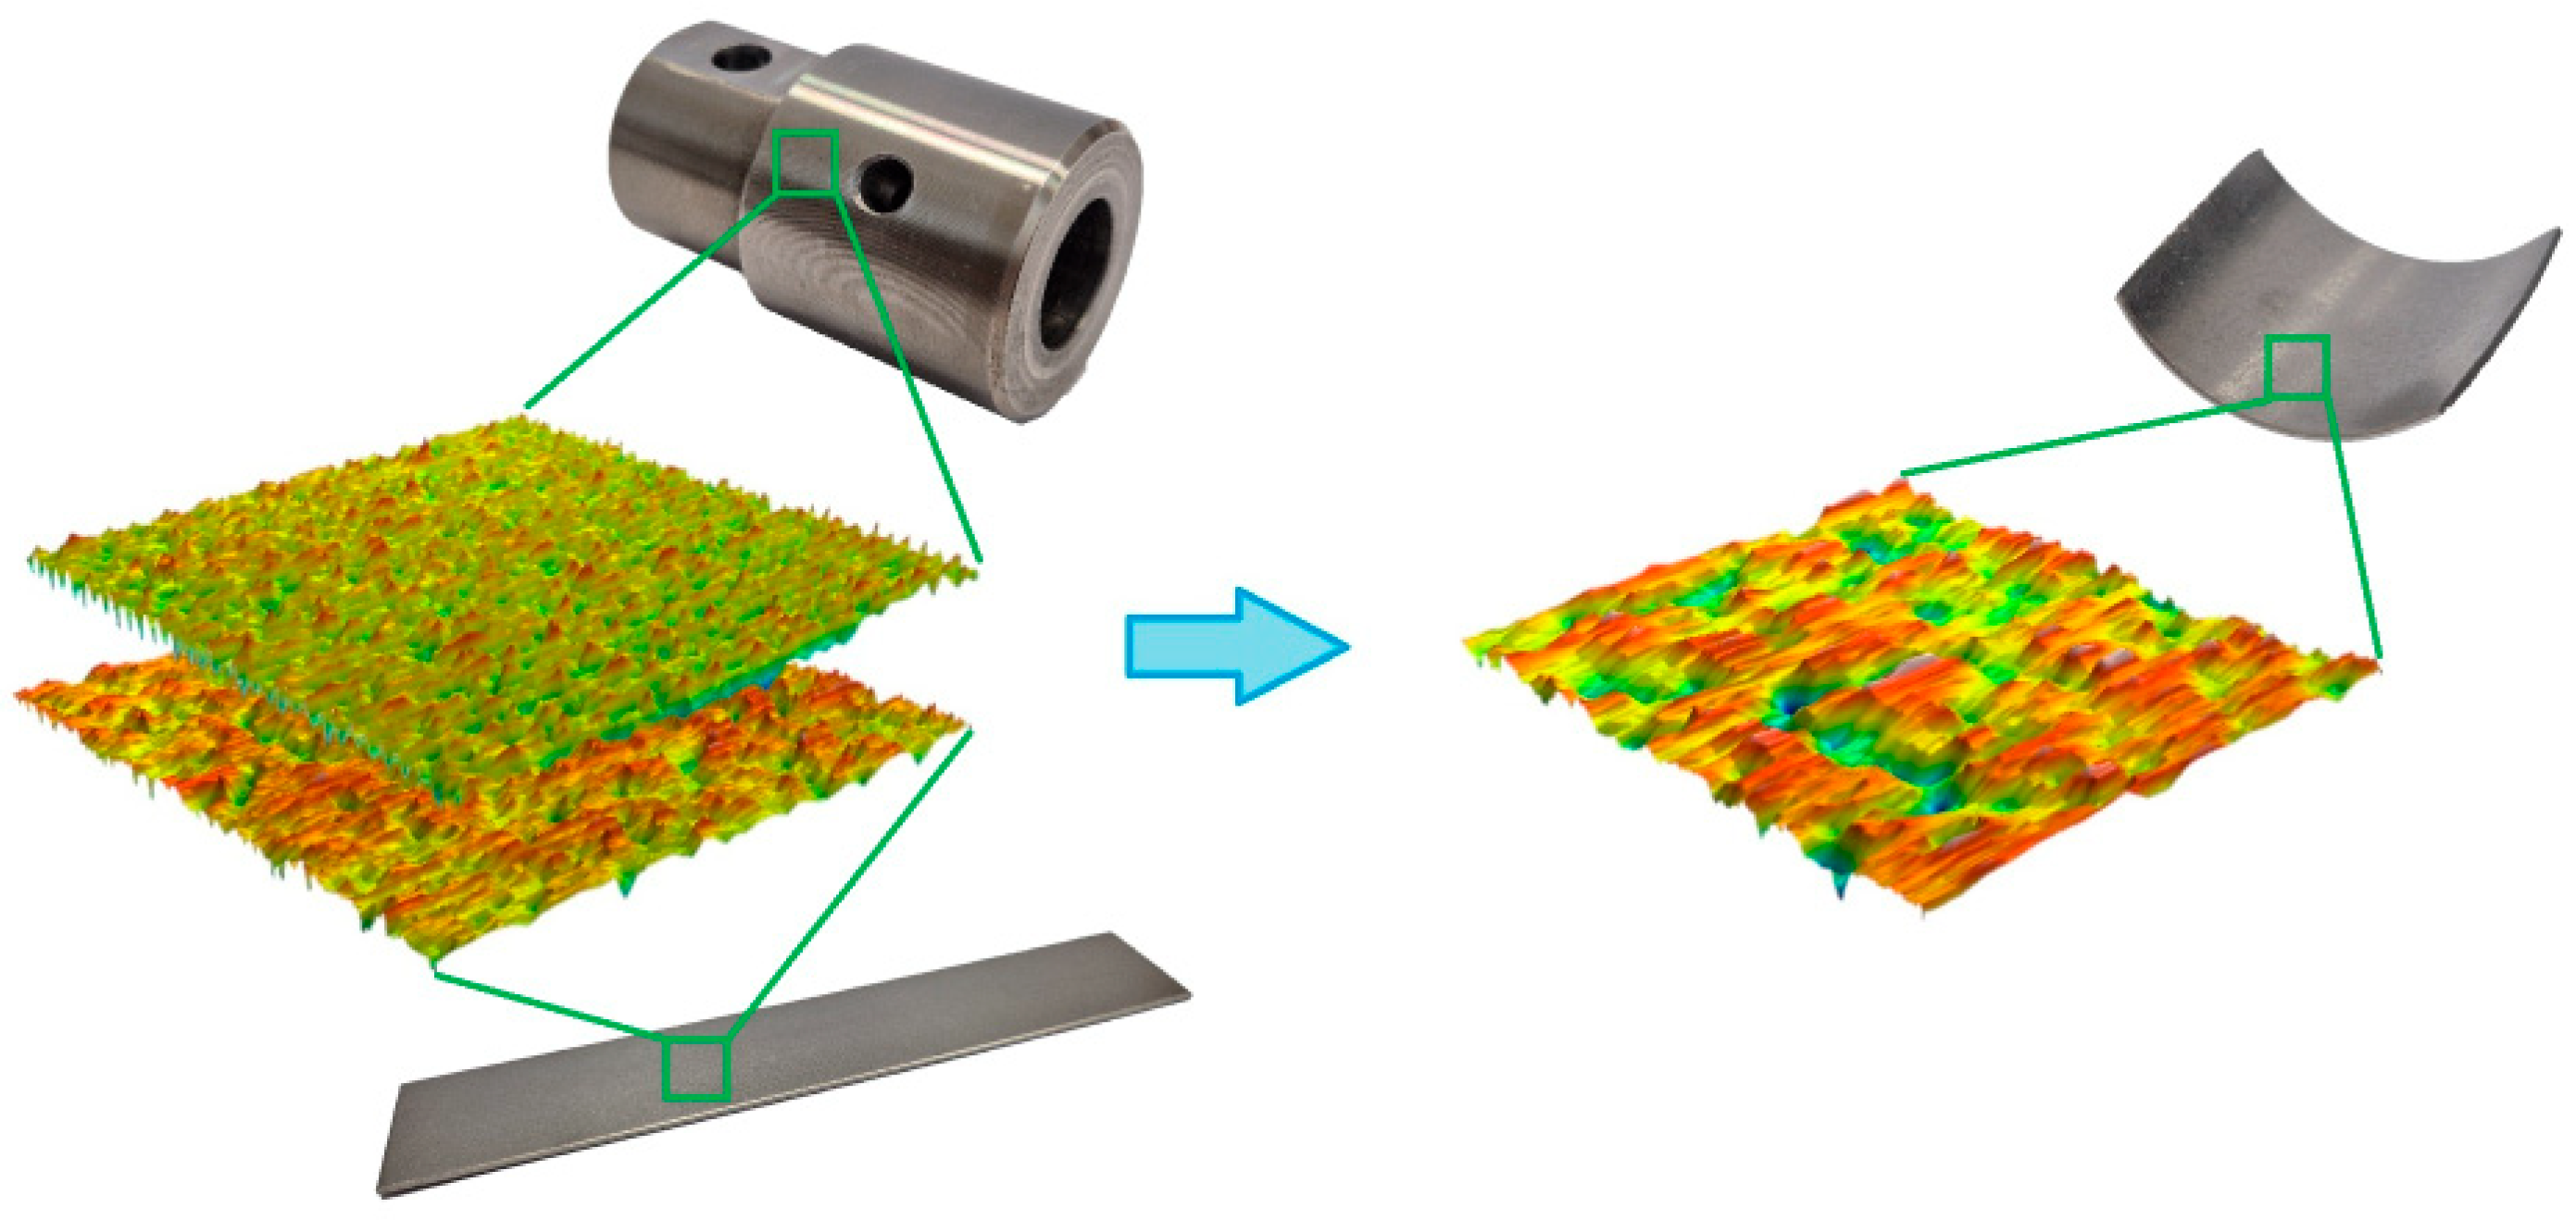
Reduced peak height, Rpk characterises the part of the surface that is abraded during the running-in period. Therefore, this parameter can be treated as a measure of resistance to abrasive wear [42]. The lowest value of reduced peak height Rpk calculated for the surface of the C-Pb countersample (Table 6) indicates its increased resistance to abrasive wear in comparison to the other materials. Core peak-to-valley height Rk can be considered as a parameter informing about the height of surface asperities after the running-in period. Based on the core peak-to-valley height Rk values for the tested countersamples, it can be concluded that the load-bearing capacity of the C-EBM surface after the running-in period is higher than that of the C-Pb-EBM surface. Reduced valley depth Rvk is a measure of the surface ability to retain lubricant in the surface valleys. For the analysed surfaces, the value of this parameter reached the highest value for C-Pb-EBM. Figure 11 schematically presents the process of evolution of the surface topography of the sheet metal strip in the BUT test. Under the influence of contact pressure, the summits of asperities are flattened. At the same time, as a result of large plastic deformations, the strength of the sheet material increases through the work hardening phenomenon, and the topography of the sheet surface is subject to strain-induced continuous evolution.
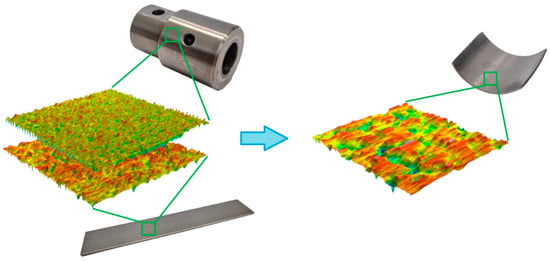
Figure 11.
Evolution of sheet metal surface topography in the BUT test.
3. Results
3.1. CoF
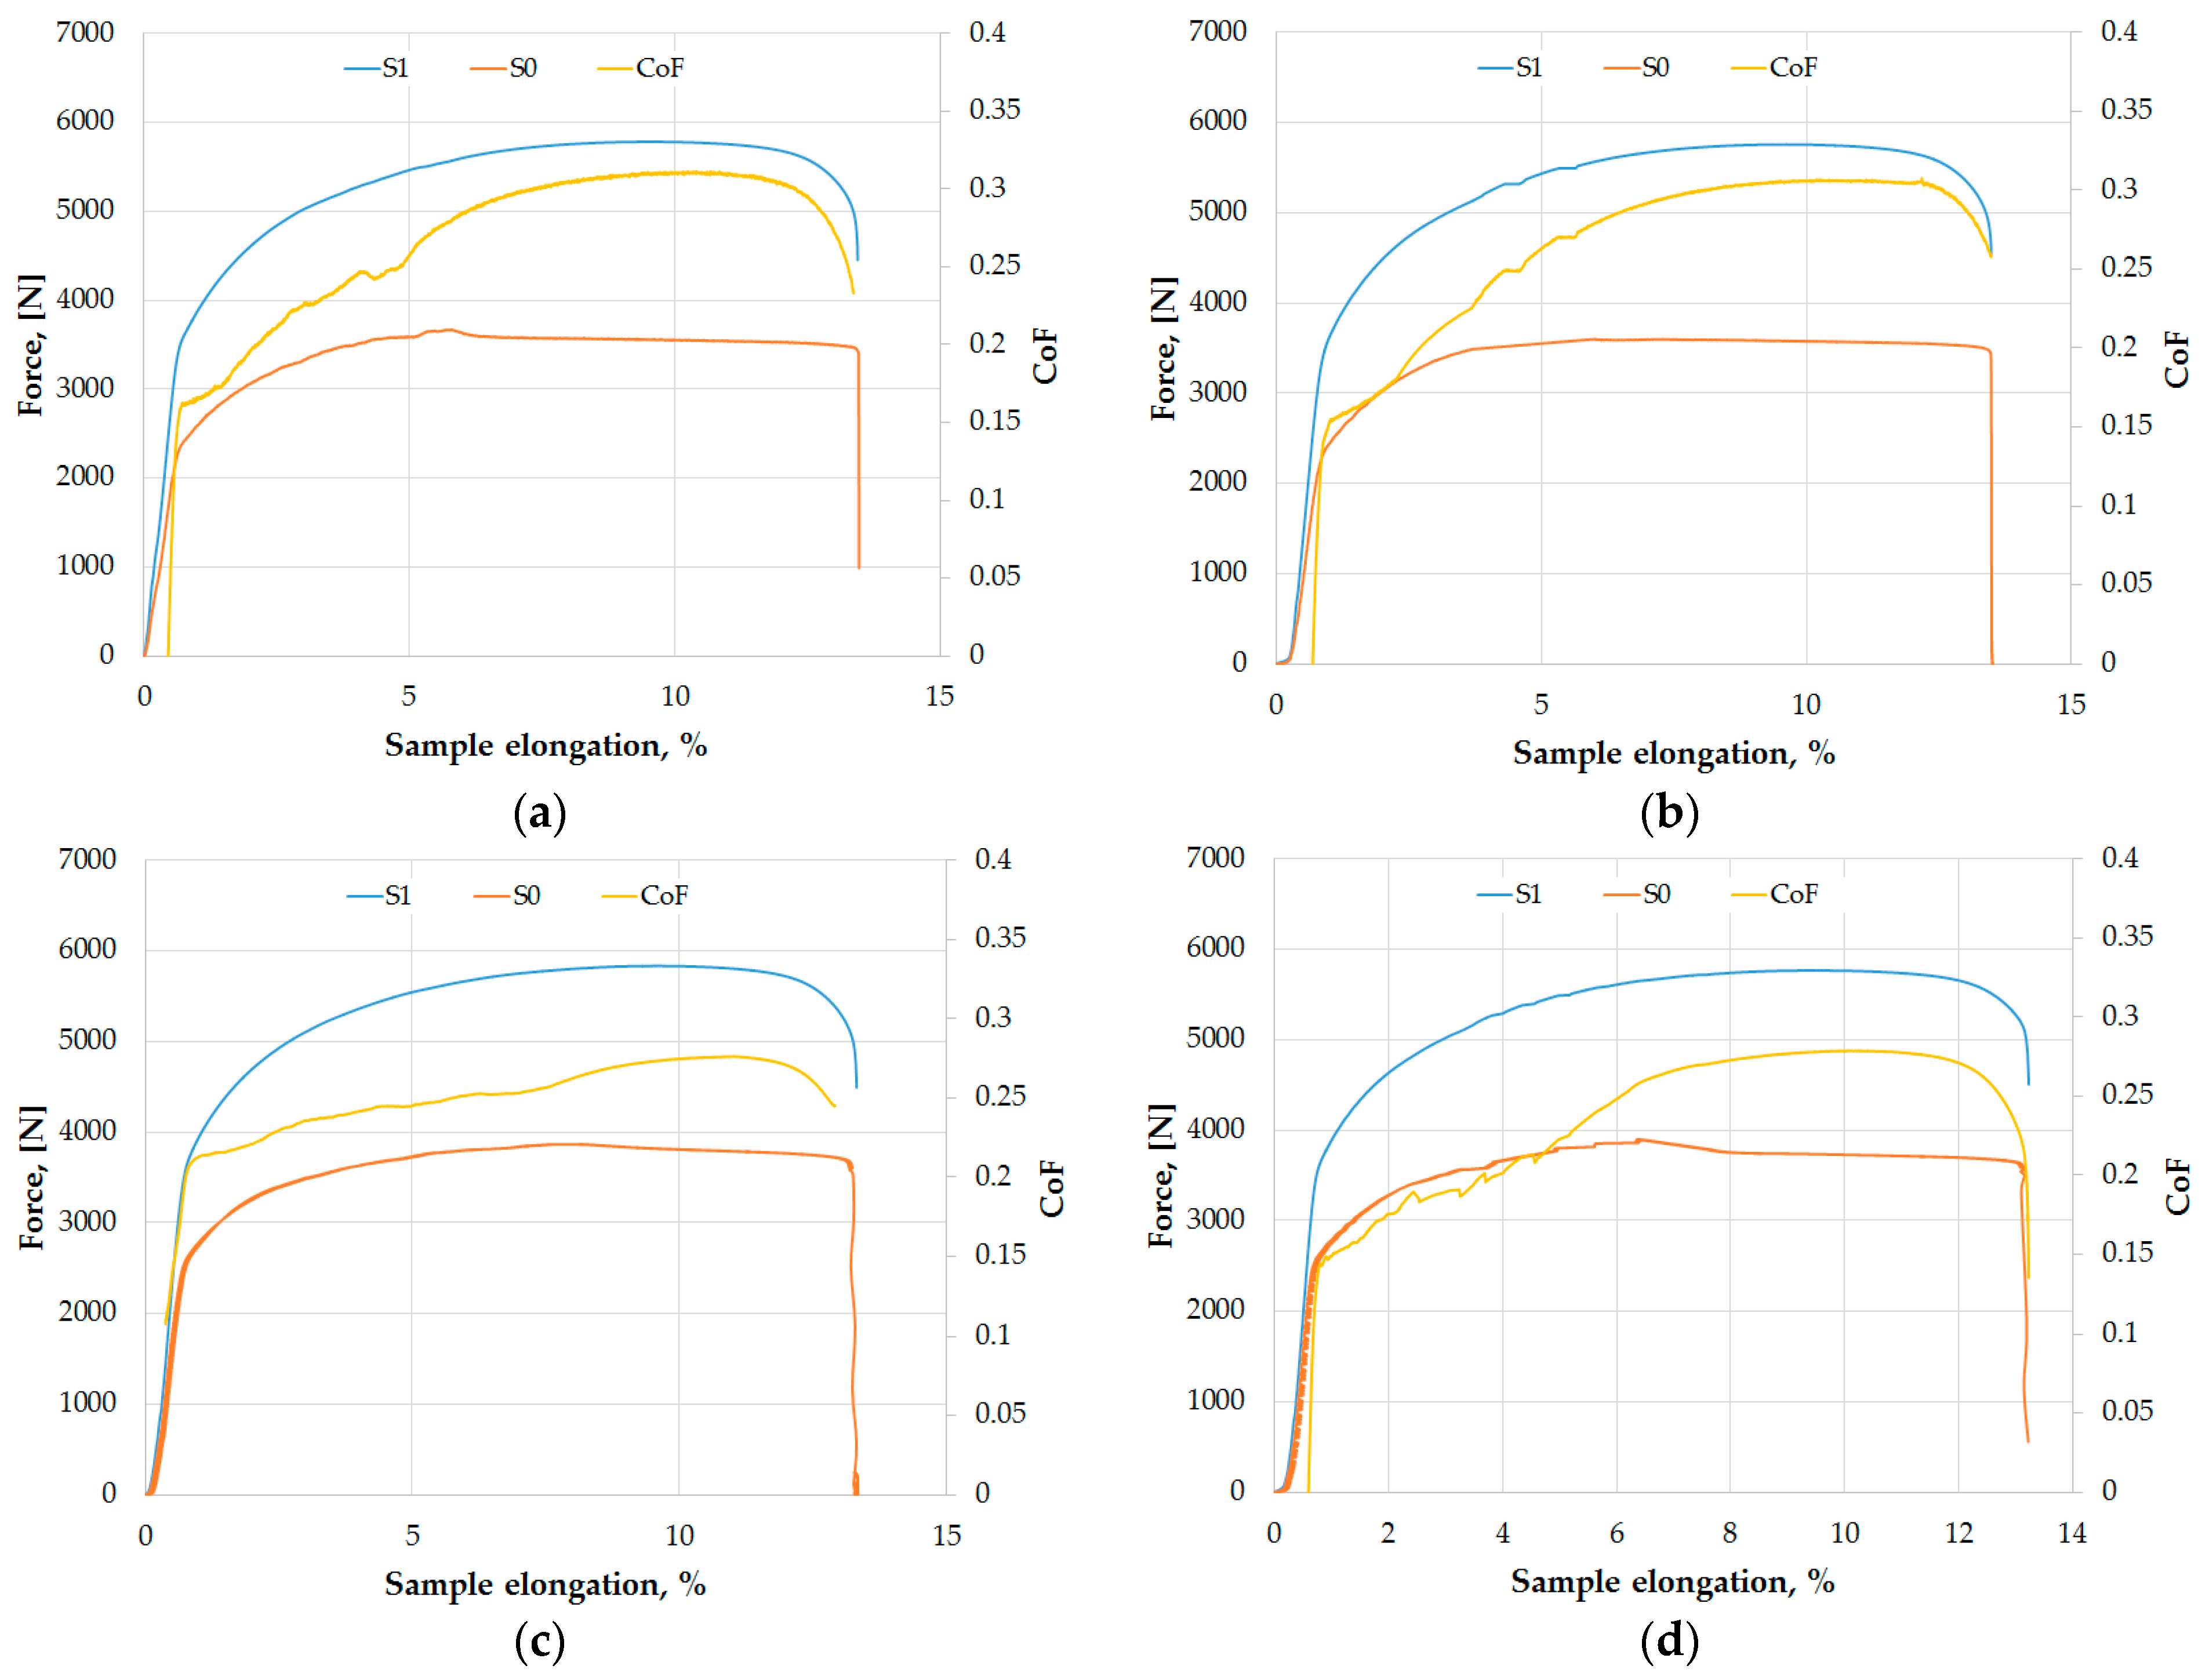
Figure 12 shows the change in the CoF value with the increase in sample elongation. The elongation of the samples caused an increase in the coefficient of friction. In dry friction conditions, there was a more intensive sliding resistance of the friction pair materials compared with dry friction conditions. Increased friction in the contact zone of the sheet metal with the countersample limits the elongation of the material, and the higher the friction, the lower the final elongation of the samples until fracture [30]. The coefficient of friction determined for unmodified C-U countersamples and C-EBM countersamples under dry friction conditions is similar, and its maximum value is about 0.31 (Figure 12a,b). A similar trend of CoF changes can be observed for the C-Pb-EBM countersamples, for which the maximum CoF was about 0.27 (Figure 12c). The lower CoF value can be directly related to the significantly higher average roughness of this countersample in comparison with the other countersamples (Table 5). The hardness of materials of all countersamples (293–294 ± 1 HV) was higher than the hardness of the DC01 sheet material (107 HV). Consequently, the surface roughness of the countersample has a significant impact on the topography change of the sheet metal due to the asperity flattening and ploughing mechanism [43,44].
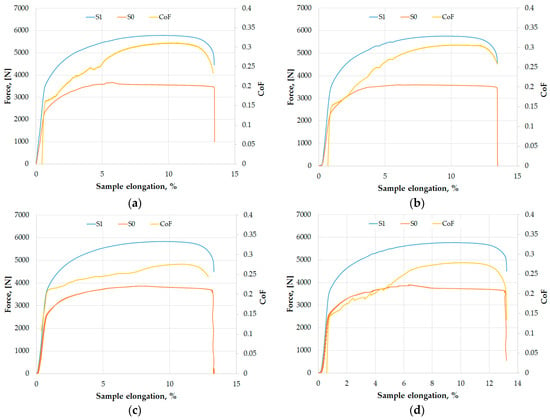
Figure 12.
Influence of the type of countersamples on the back-tension force (S0), front-tension force (S1) and CoF for (a) C-EBM, (b) C-U, (c) C-Pb-EBM and (d) C-Pb.
The difference in the effect of surface modification on the change of the CoF value is the most visible in the case of tests involving unmodified C-U (Figure 12b) and C-EBM (Figure 12a) countersamples. For the remaining countersamples (C-Pb-EBN and C-Pb), the variation of the CoF was comparable. The C-Pb-EBM countersample in dry friction conditions provided the most stable CoF value over the entire range of sample elongation (Figure 12c). In the case of C-U, C-EBM, and C-Pb countersamples, clear fluctuations of the CoF are visible (Figure 12). Fluctuations in the CoF may also be related to the formation and intensification of friction mechanisms related to abrasive wear and adhesion (Figure 13a). Due to the high contact forces and plastic deformation of the sheet around the countersample, these phenomena cause flattening of surface asperities (Figure 13a–d). Most of the summits of asperities have been flattened, although there are a few areas containing valleys resulting from the manufacturing process of sheet metal.
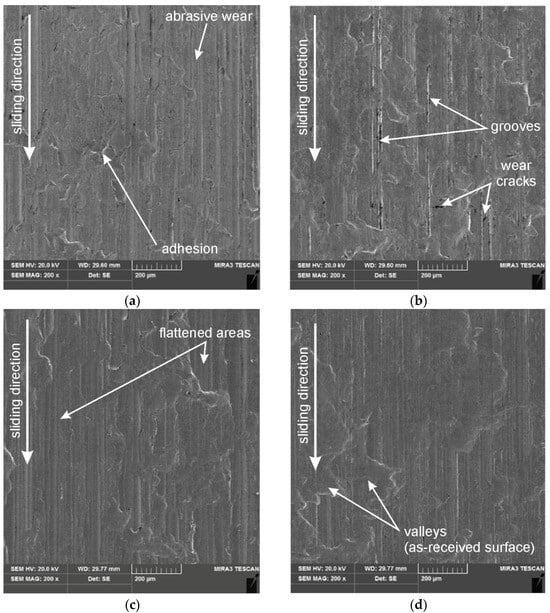
Figure 13.
SEM micrographs of sheet strip after friction process involving the following countersamples: (a) C-EBM, (b) C-U, (c) C-Pb-EBM, and (d) C-Pb.
3.2. Temperature in Contact Zone
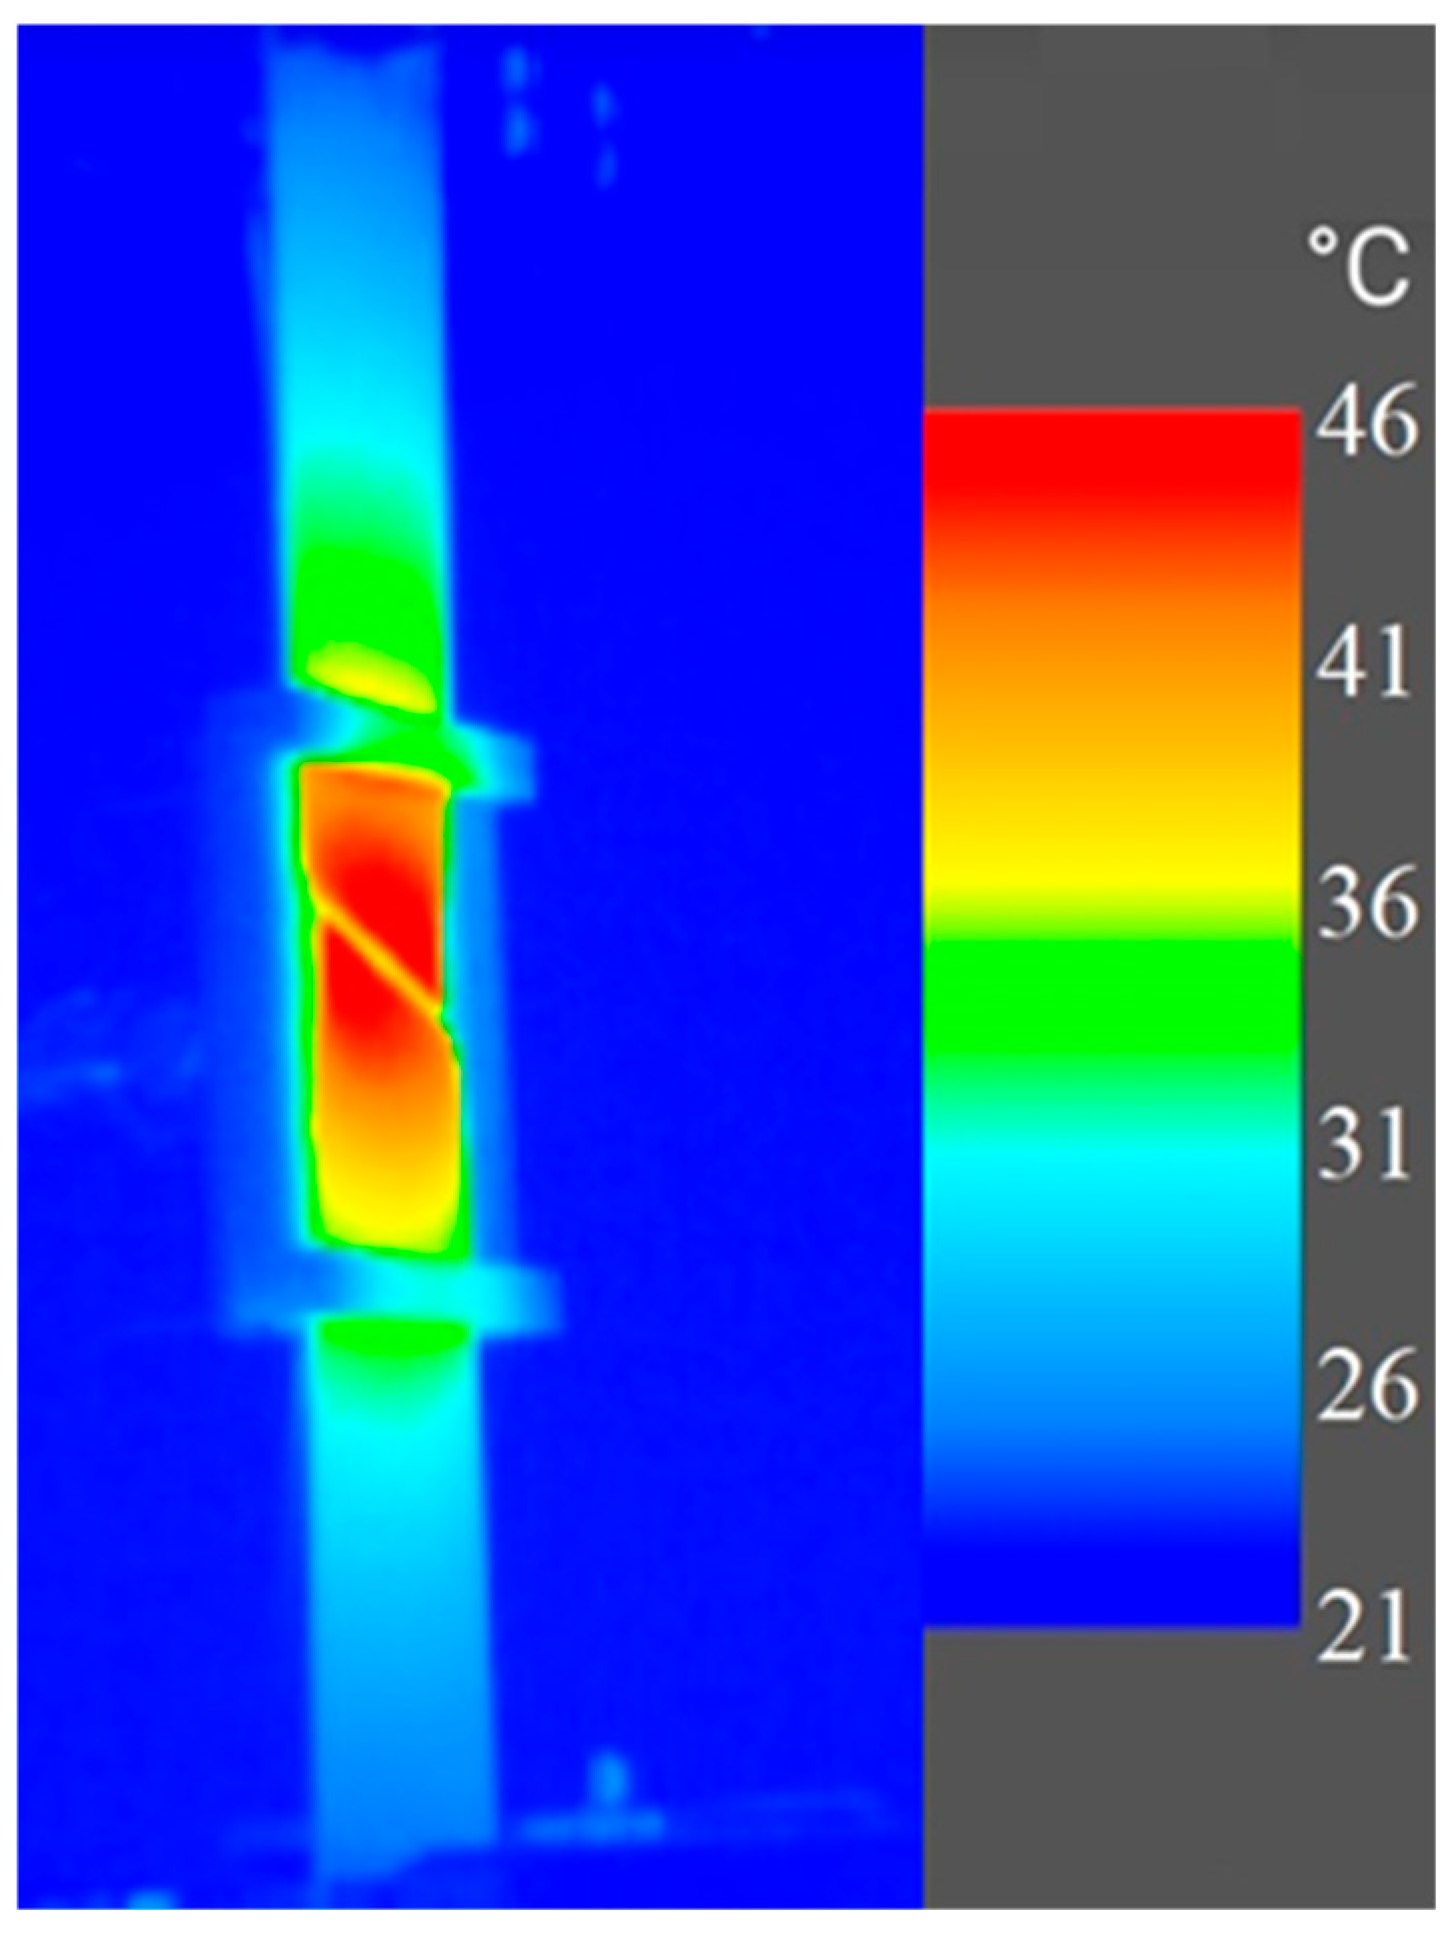
The process of stretching metal sheets is accompanied by an increase in temperature due to internal friction. As a result of the heat conduction process, heat is transferred from the sheet strip to the countersample. Table 7 shows the temperature change in the contact zone. The values presented correspond to the average temperature increase recorded during BUT friction tests. The temperature increase in the contact zone is related to the internal friction of the sample material while it undergoes deformation and work hardening and external friction as a result of frictional contact between two bodies.

Table 7.
Basic parameters of the obtained Abbott–Firestone curves for the countersamples.
The lowest temperature increase value (0.34 ± 0.02 °C) in the contact zone, in all friction conditions, was observed for the C-Pb countersample. This countersample was characterised by the highest average surface roughness value Sa (Table 5), which causes a limitation of the direct contact of the countersample with the sheet metal surface. For the C-EBM countersample, the highest temperature increase was noted in the contact zone (0.58 ± 0.02 °C). This countersample was characterised by more than twice the lower average roughness Sa in comparison to the other countersamples (Table 5). The reduction in surface roughness is directly related to the increase in the metallic contact area, which determines the intensity of heat transfer from the sample to the countersample.
In scientific research, the influence of tool temperature on the CoF value is usually analysed. The coefficient of friction increases with the increase of the temperature in the contact zone [45]. In the BUT test, the temperature increase resulting from the internal friction is much higher than in the strip drawing test (Figure 14).
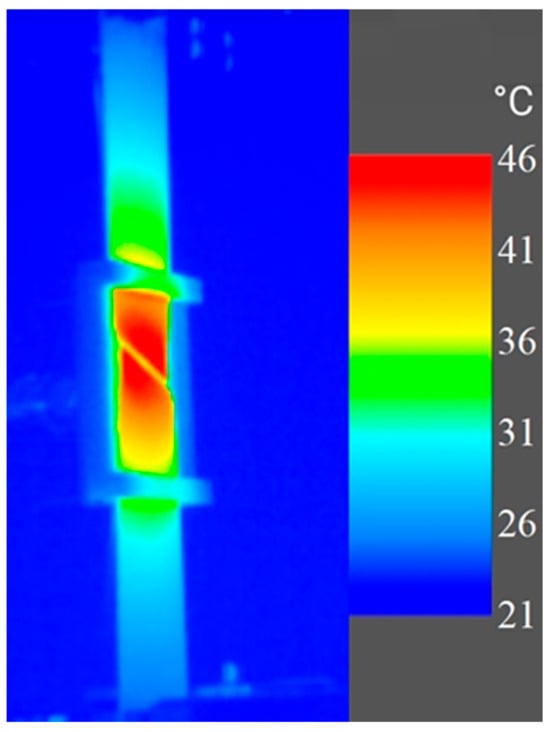
Figure 14.
Temperature change resulting from internal friction of the DC01 steel sample under uniaxial tensile test.
3.3. Residual Stress
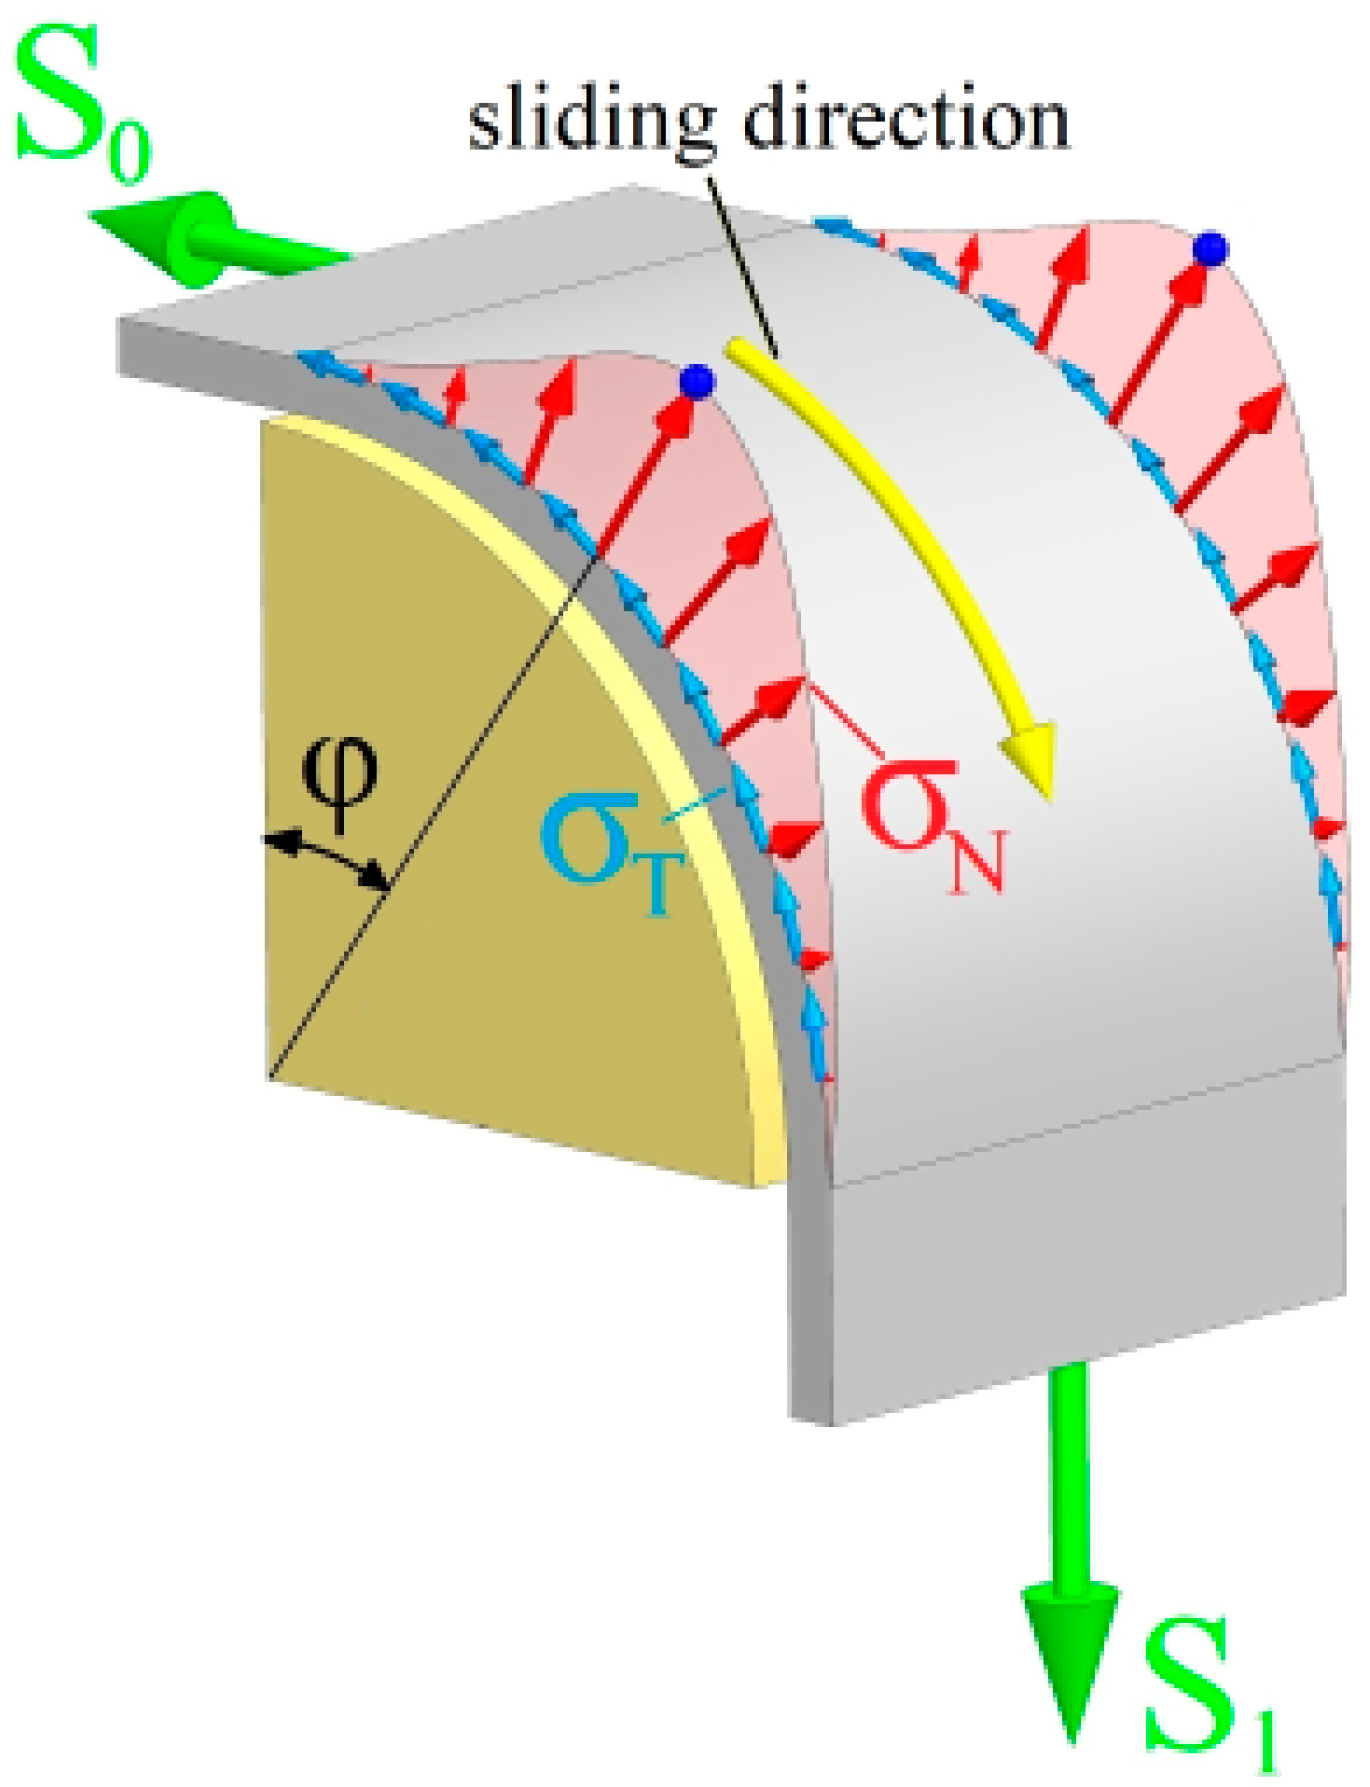
In the residual stress analysis, several basic assumptions were used. The friction force between the sheet metal strip and the countersample surface follows Coulomb’s law, and the CoF is assumed to be a constant value throughout the contact area (along the contact angle α, as shown in Figure 4b). In fact, according to the generalised Stribeck curve, the CoF is a function of the lubricant viscosity, the sliding speed and the contact pressure [46]. In this study, all the tests were performed at a constant temperature and constant sliding speed, and therefore, the contact pressure was the only factor influencing the CoF. However, according to Popov [47] and Wu et al. [48], the CoF remains constant when the contact pressure is changed by a factor of 106, and the range of contact pressure variation along the contact angle in the tests was much smaller than 106. Therefore, a constant value of CoF along the contact angle is suitable for this study. The stress distribution along the contact angle is non-uniform and, according to Groche et al. [49], can be approximately sinusoidal. As shown in Figure 15, σN and σT denote the normal stress and the shear (friction) stress, respectively.
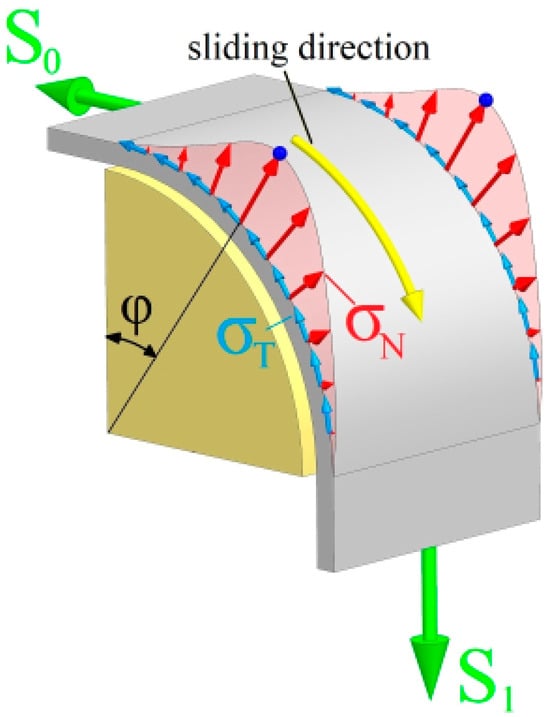
Figure 15.
Non-uniform contact stress distribution in the BUT test.
The elementary friction force dFR between the sheet metal strip and the countersample (Figure 4b) can be expressed using Equation (2):
The elementary surface area dA on which normal stresses σN occur can be described using Equation (3):
Substituting Equation (3) into Equation (2), we obtained the following:
Integrating both sides of Equation (4), we obtained the following:
After taking into account the relationship for the normal force N(θ), we obtained the following:
Taking into account the range of the contact angle (α) of the countersamples, we obtained the following:
Finally, taking into account the relation for the normal force as a resultant depending on the contact angle, back-tension force S0 and the Euler’s formula (Equation (1)), we obtained the following:
Taking into account Equations (8) and (9), the friction force depending on the contact angle can be obtained.
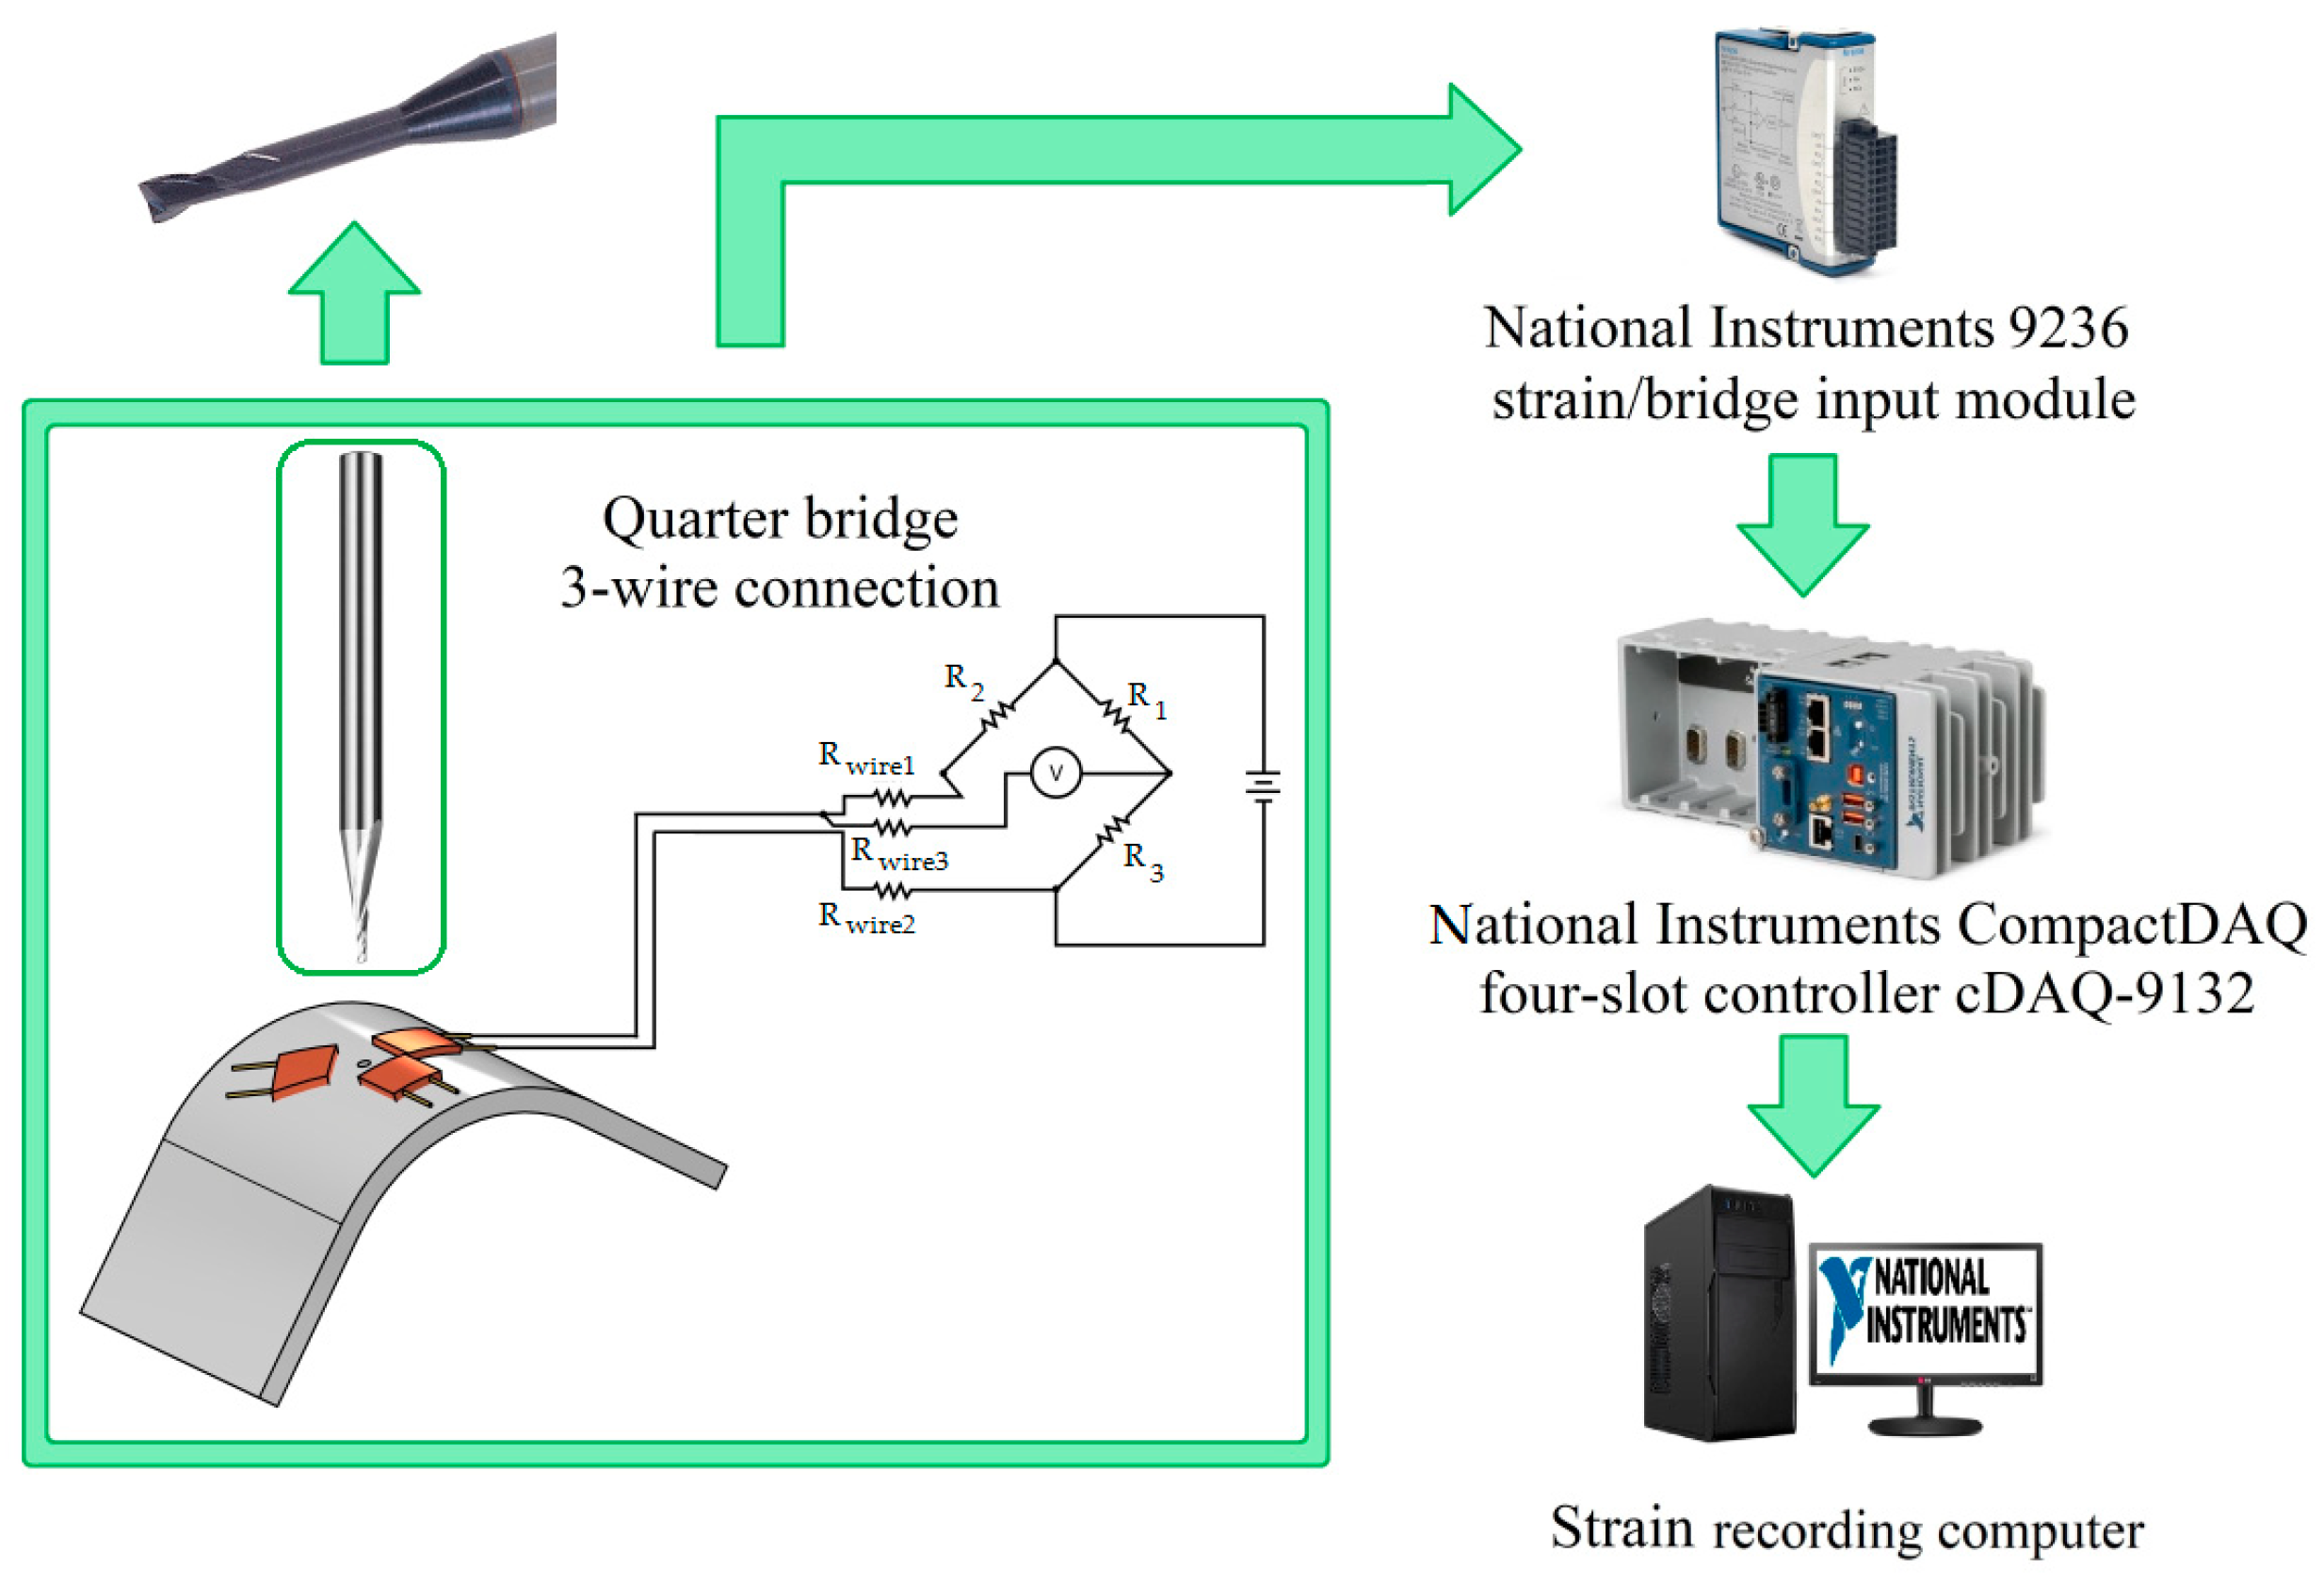
One of the commonly used methods for determining residual stresses is the Mathar method, also known as the hole-drilling method [50]. The sheet strips after the BUT friction tests were used to measure residual stresses. Since the initial thickness of the sheets was 0.8 mm, the hole drilling method described in the ASTM E 837-99 [51] standard is the most effective method for measuring residual stresses [52]. In this method, the strains are released and measured at the positions where the strain gauges are attached. Using the procedure specified in the ASTM E 837-99 [51] standard, the residual stresses were calculated. As shown in Figure 14, a strain gauge rosette with three strain gauges is attached to the sheet strip in the area under consideration. A hole with a diameter of 0.8 mm was drilled in the geometric centre of the strain gauge rosette using an EC-A2 008-012/04C4M45 milling cutter from Iscar Ltd. (Tefen, Israel). After the drilling process, the residual stresses in the area of the hole were released. Using a suitable data logger and a three-wire, quarter-bridge strain gauge circuit (Figure 16), the relaxed stresses were measured.
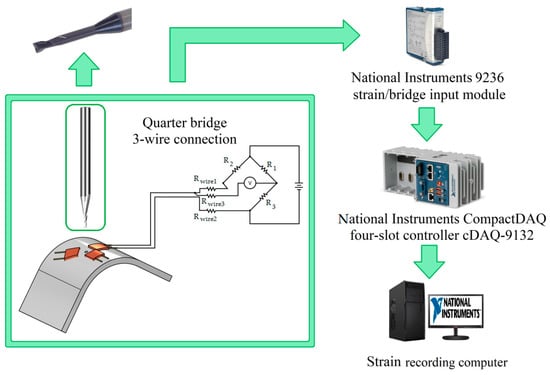
Figure 16.
Strategy of residual stress measurement.
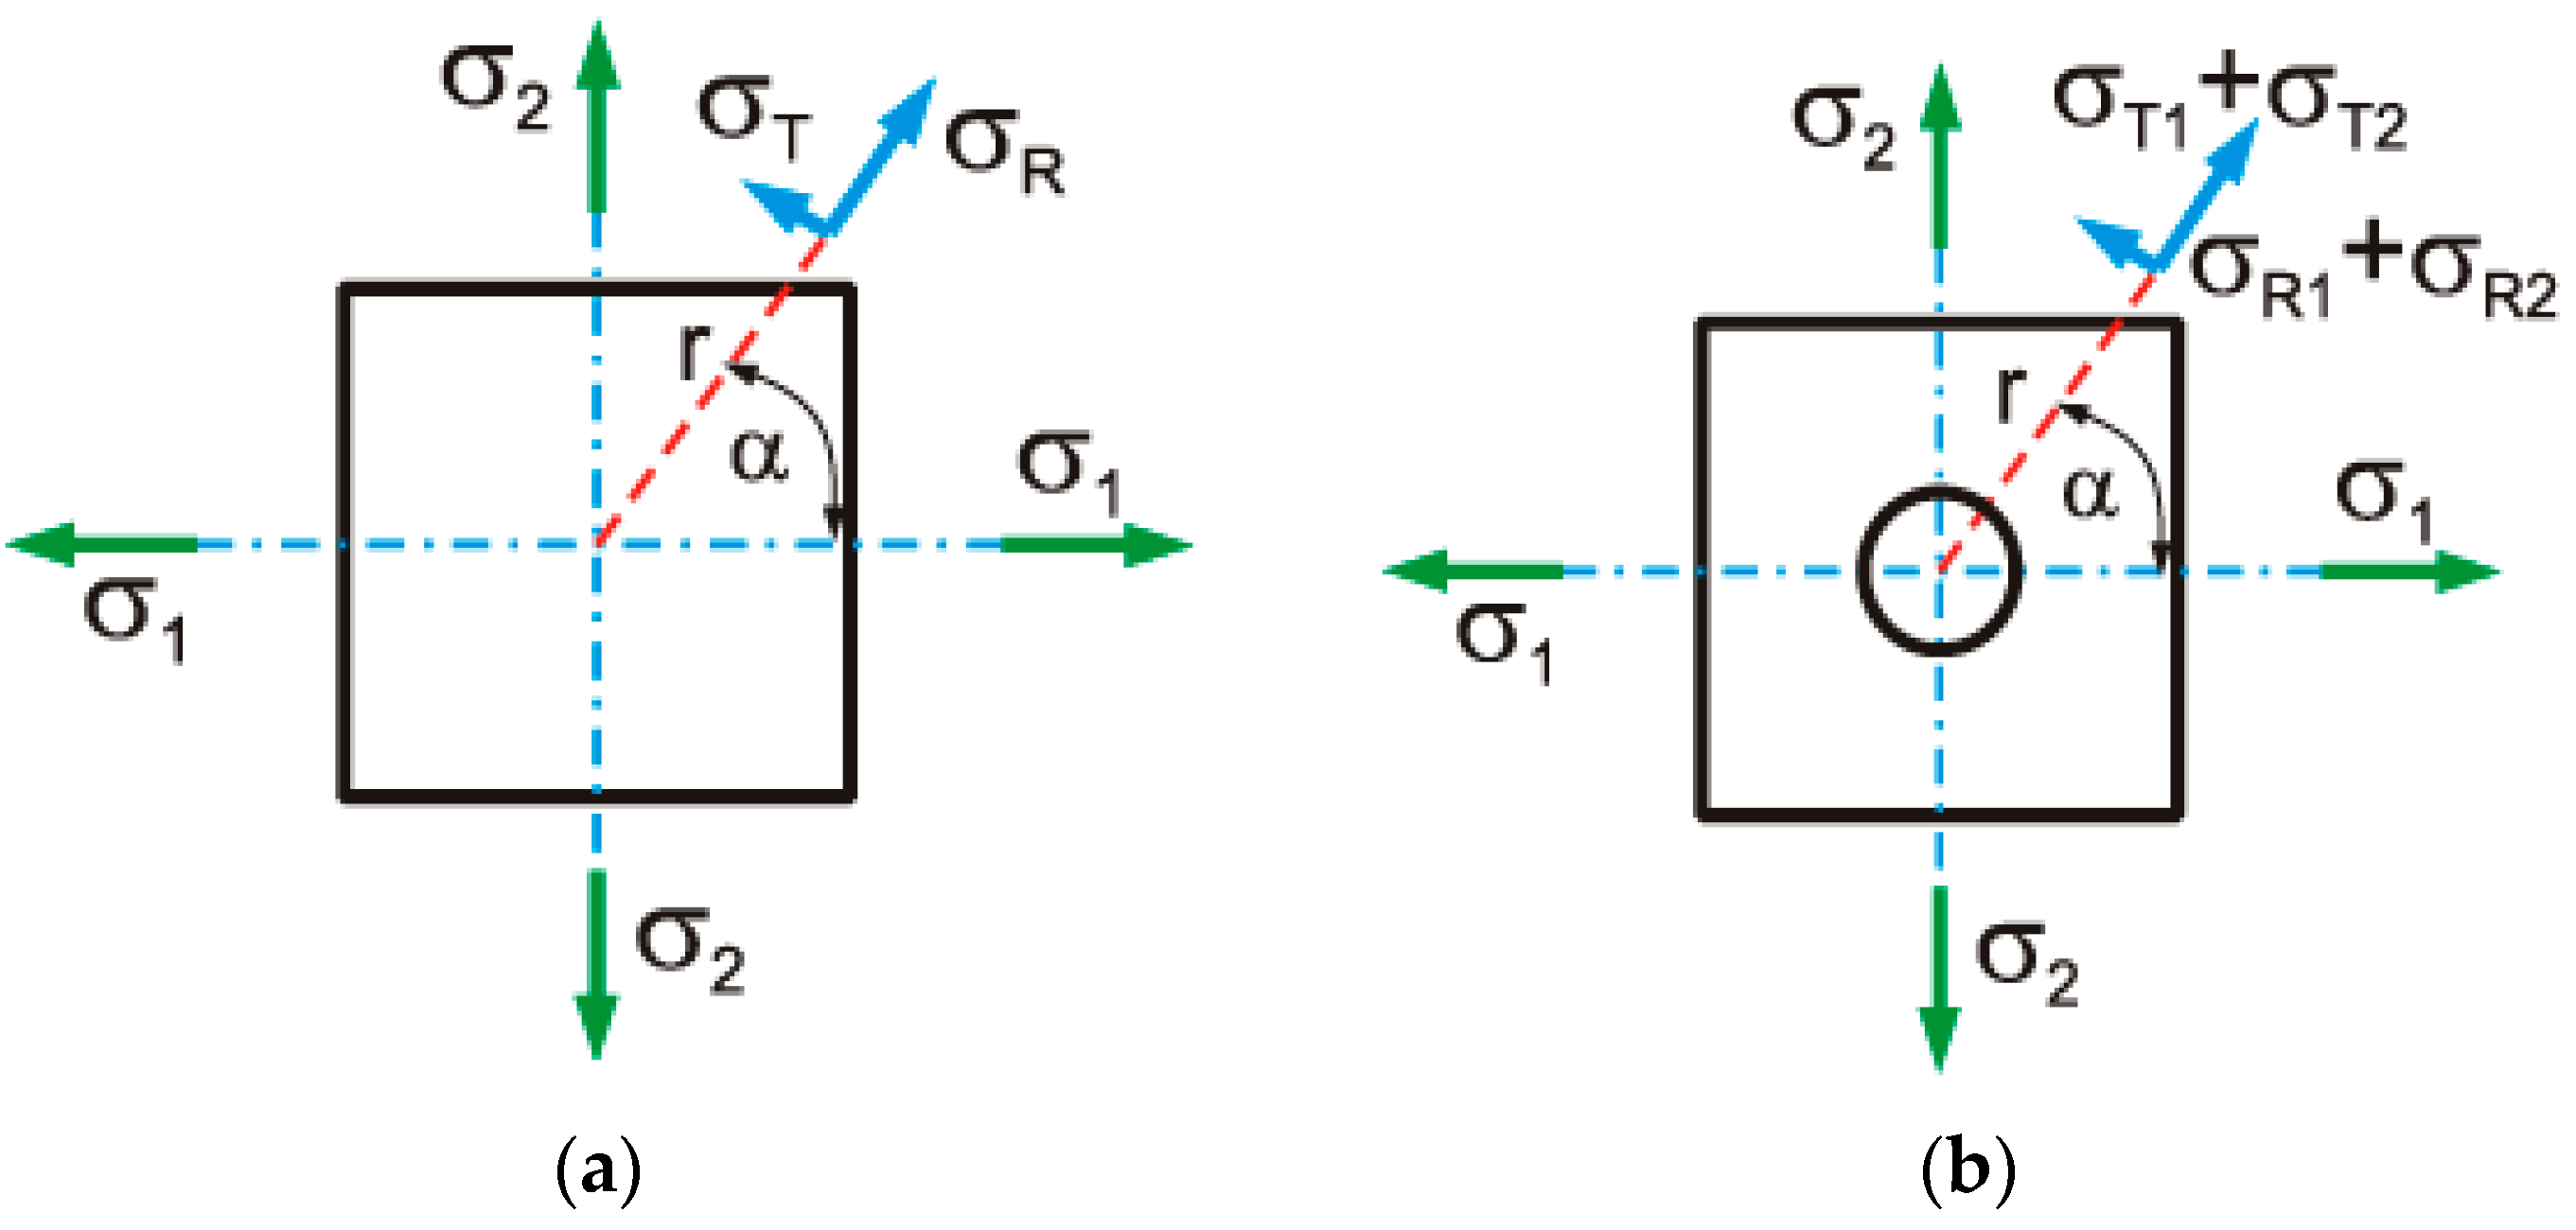
Stress release occurs as a result of removing a certain volume of material. The measurement of deformations was performed using the resistance strain gauge method, using three-element strain gauge rosettes. Assuming that the side walls of the element shown in Figure 17 are subject to the principal stresses σ1 and σ2, at the point defined by angle α and radius r, act mutually perpendicular stresses: σR (radial) and σT (circumferential).
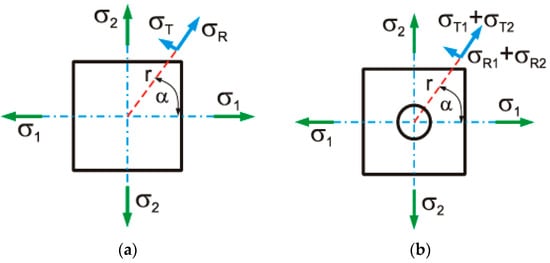
Figure 17.
(a) Stress state in the surface layer of the material and (b) change in the radial (σR) and circumferential (σT) stress due to drilling a hole in the material subjected to a plane state of stress.
Drilling a hole causes stress increases in the circumferential and radial directions at that location (Figure 17b). The increments of these stress ΔσR and ΔσT can be found from the following relations:
ΔσR = σR1 + σR2 − σR
ΔσT = σT1 + σT2 − σT
The stresses σR1 and σR2 and σT1 and σT2 as a function of the stress components σ1 and σ2 are defined using the Kirsch equation derived for the elastic stresses around the central hole in an infinitely large disc. The unit strains caused by changes in the stress components within the limits of Hooke’s law are defined from the following relations:
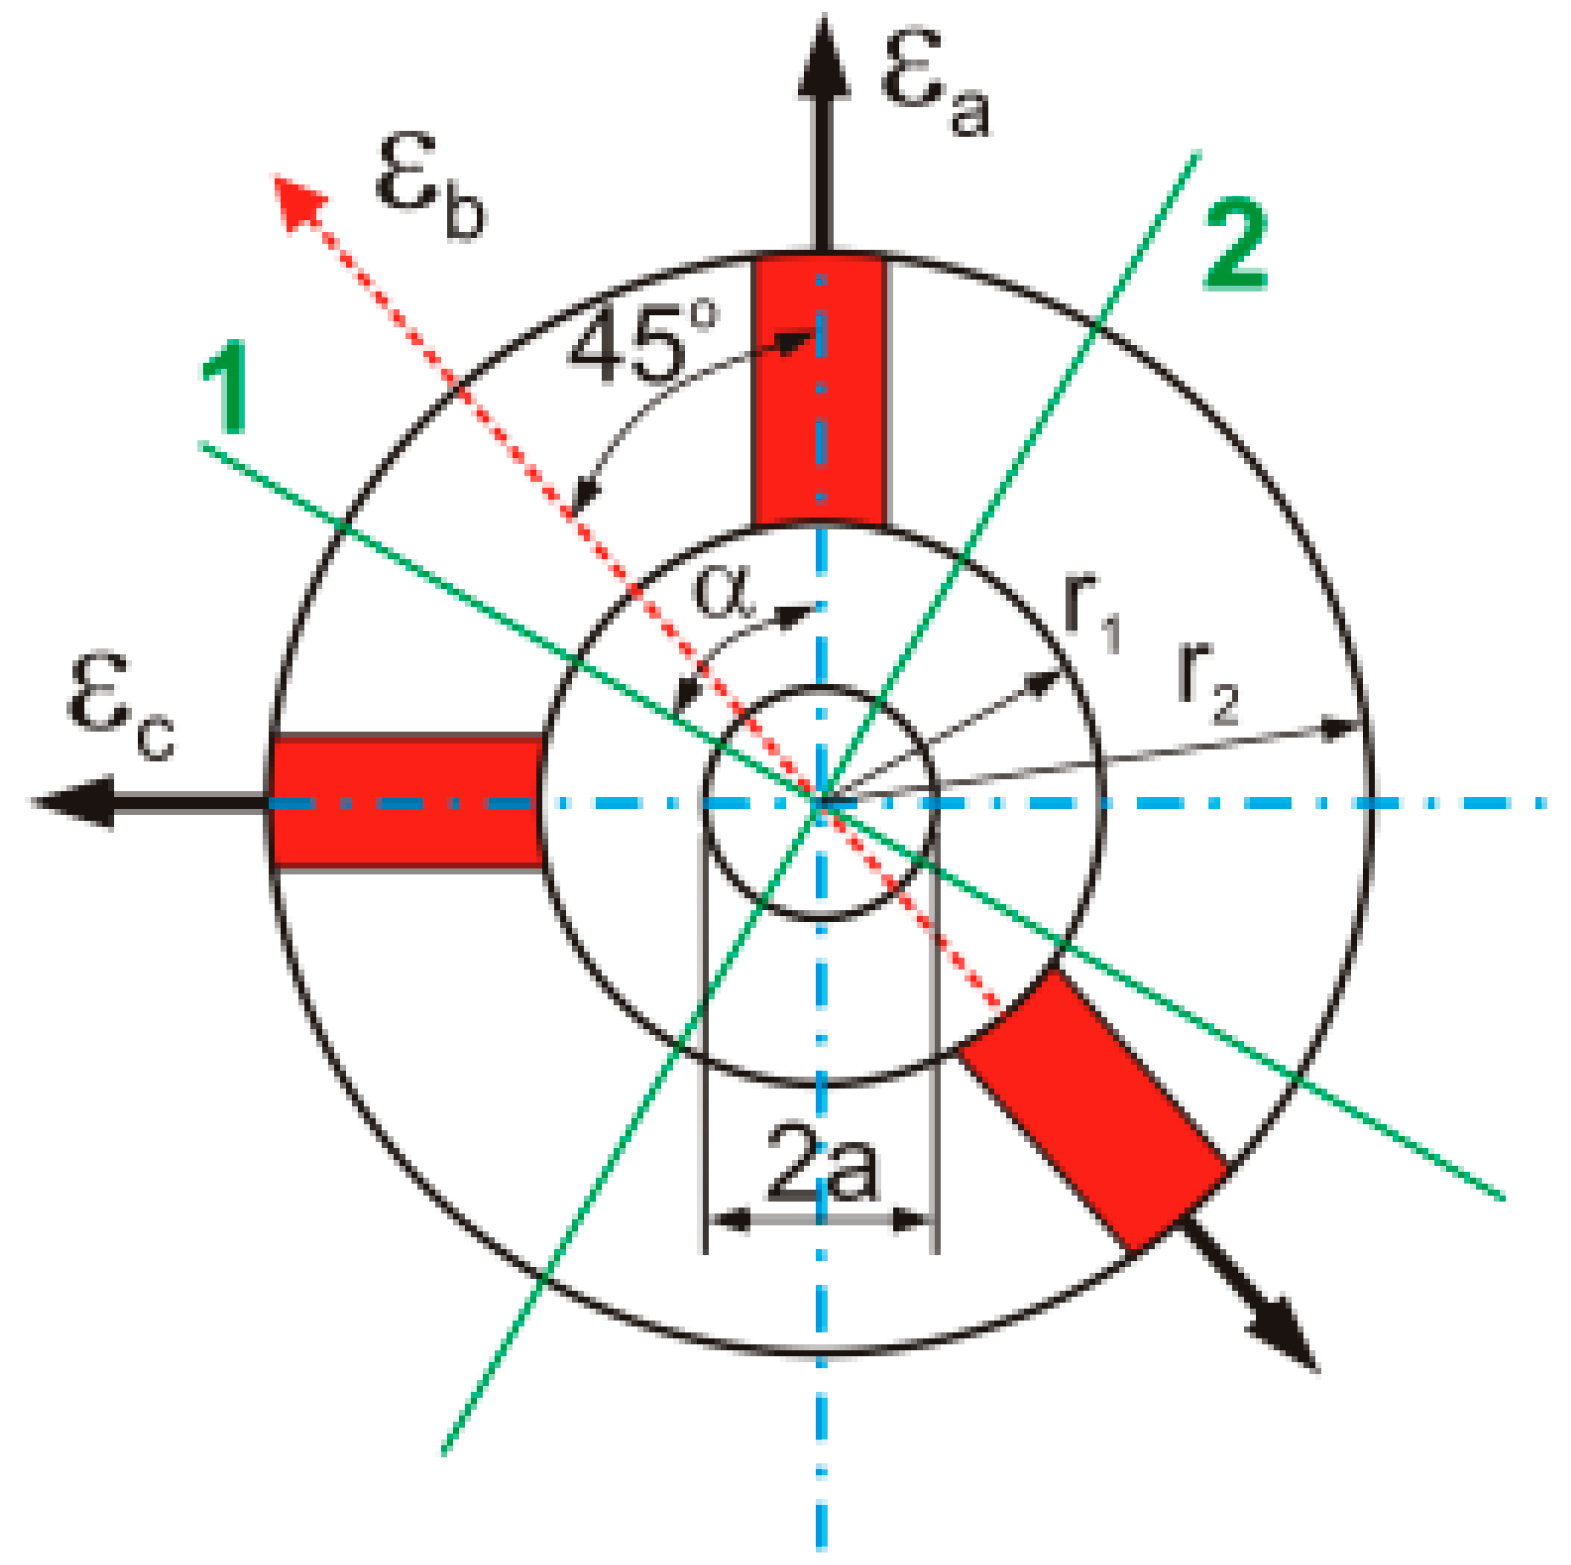
The strain εR is determined based on the readings of a radially positioned strain gauge with a radial length of lo = r2 − r1. The average strain value (for the measuring length lo) in the direction defined by the angle α can be calculated using the following relation:
After substituting the appropriate relations and performing simplifying operations, the following relation was obtained:
where the following is true:
In Equation (14), there are three unknowns: σ1, σ2, and α. In order to determine them, a system of three equations should be created. They are solved based on the results of strain measurements in three radial directions (Figure 18). Using a three-element rectangular rosette with measurement directions ωa = 0, ωb = +45°, ωc = 90° (α is the reference measurement direction), the solution of the Equation (14) provides the following:
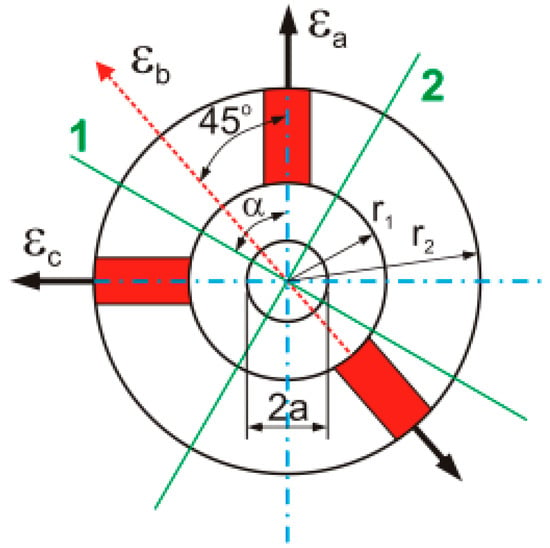
Figure 18.
Schematic diagram of a three-element rectangular strain gauge rosette with the indication of measurement directions and active lengths.
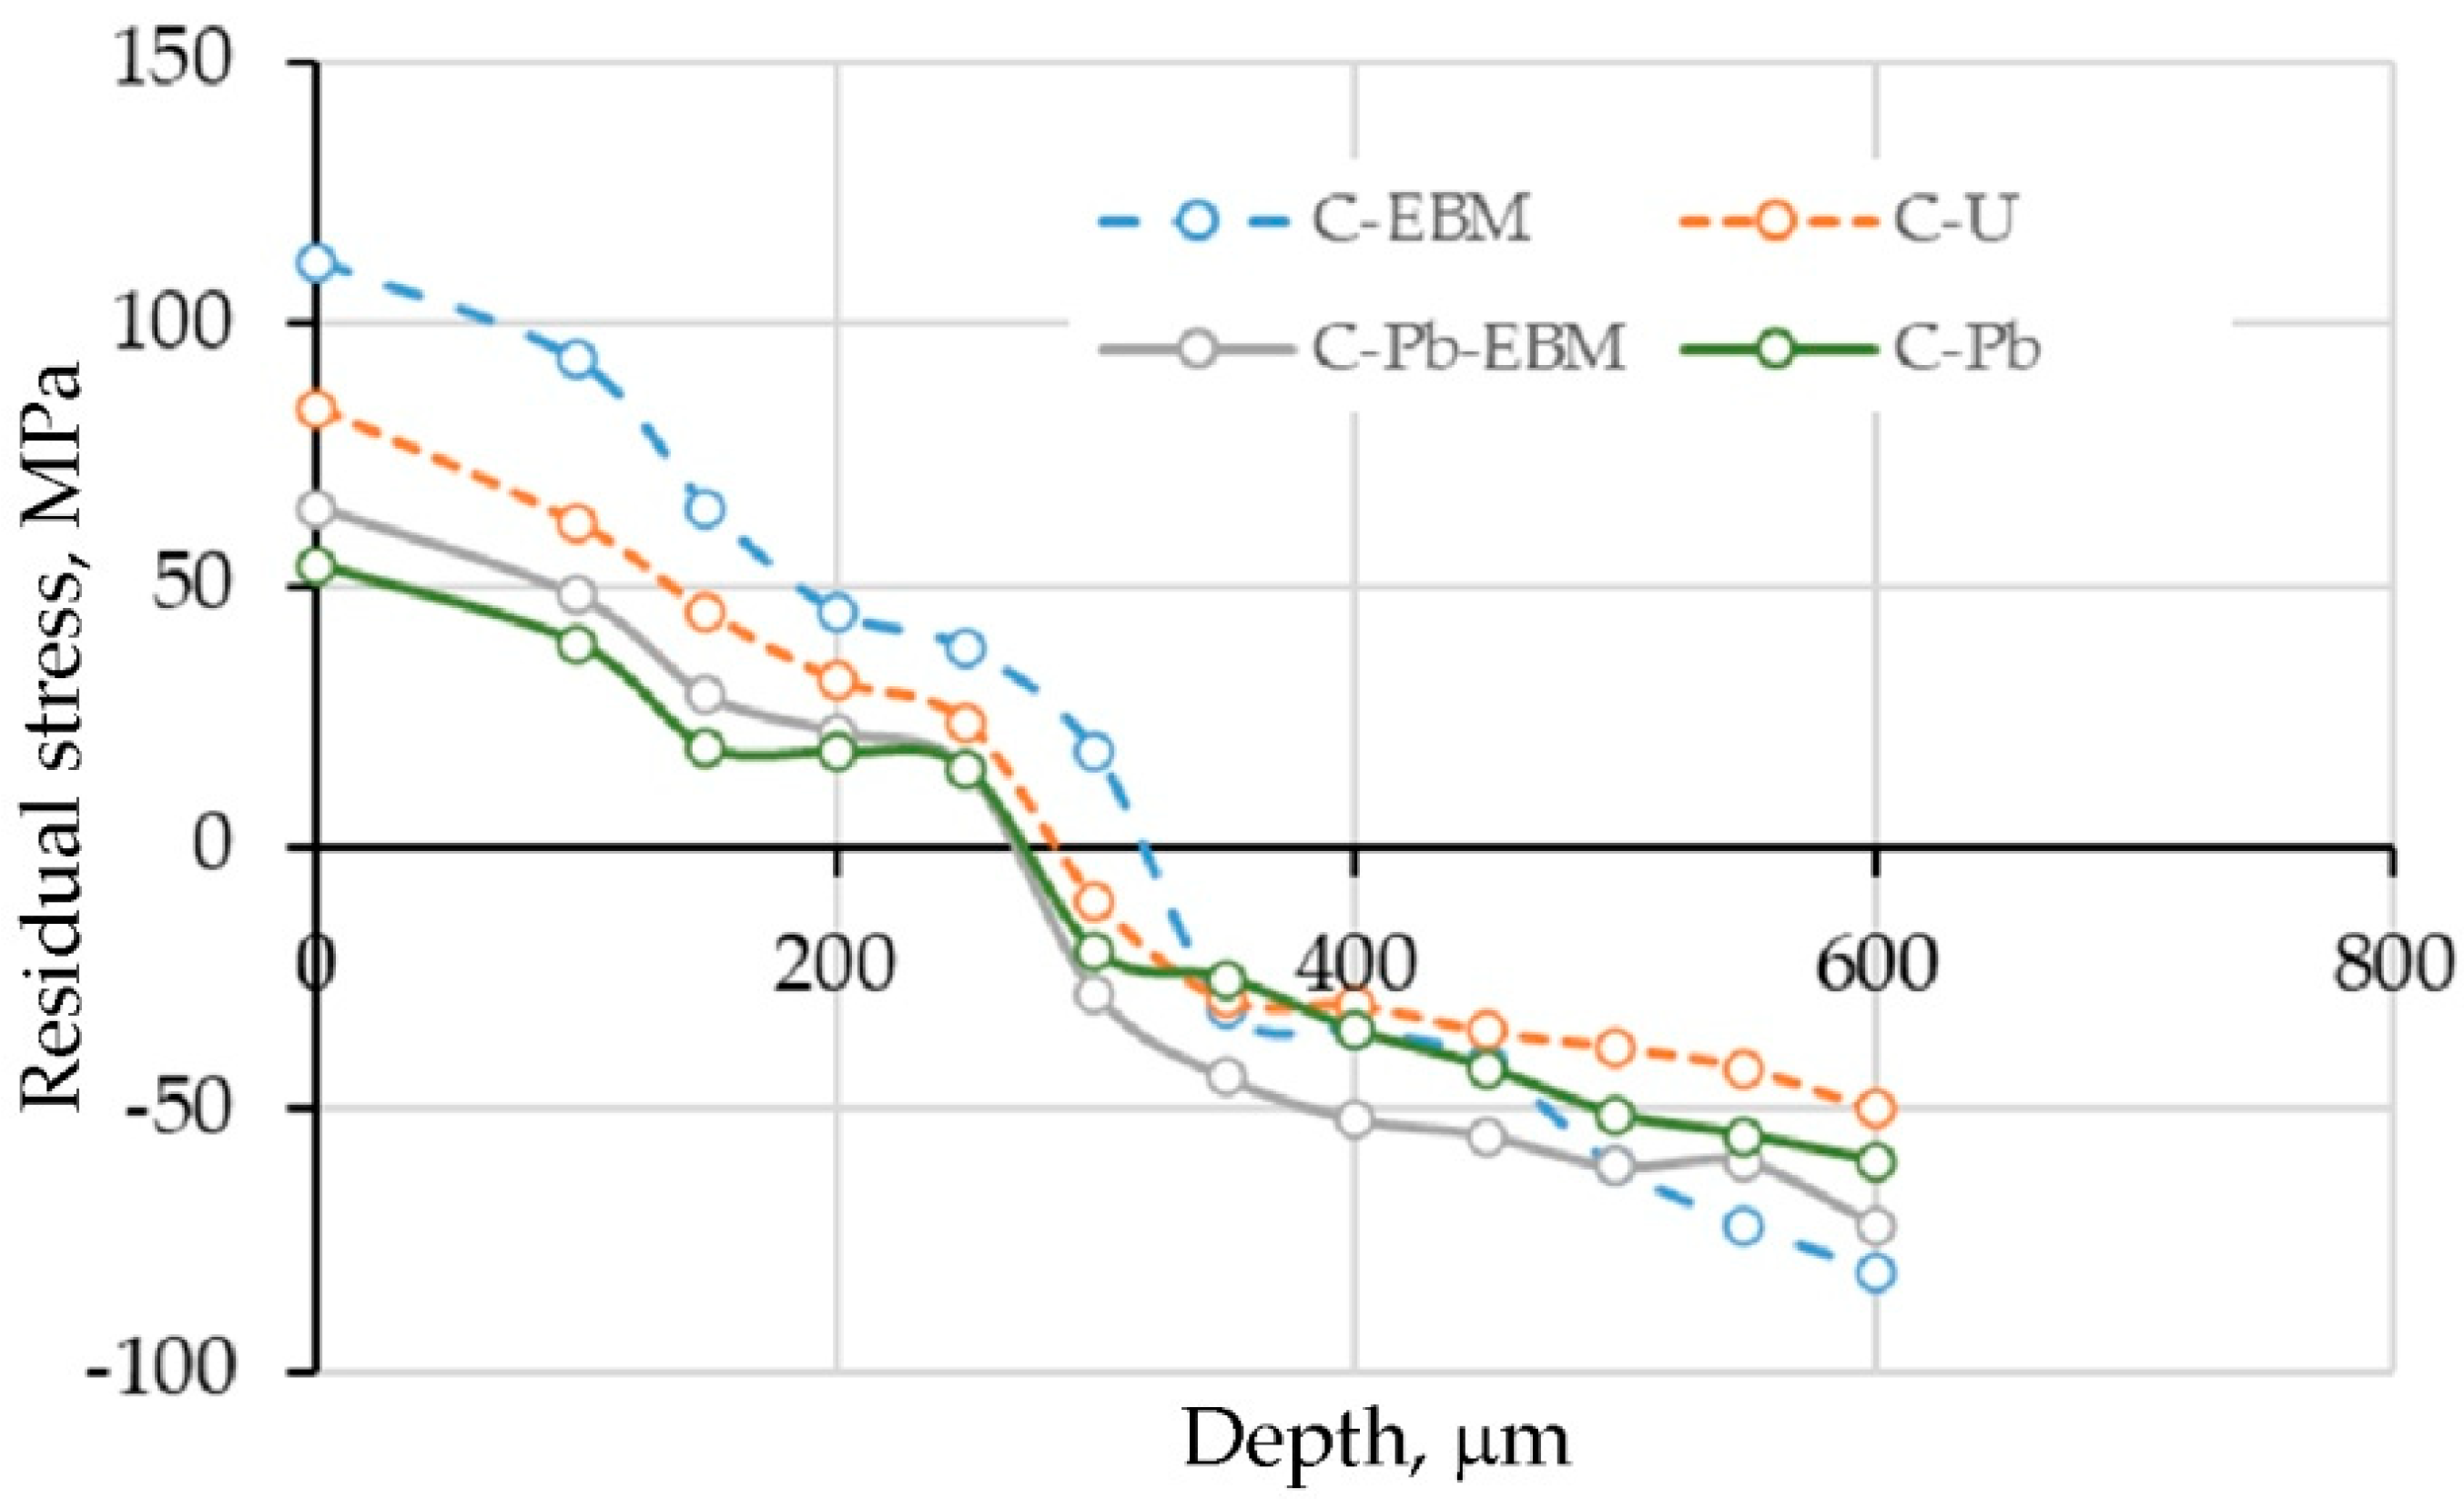
Figure 19 shows the residual stresses inside the sheet strip obtained using strain gauge measurements at the location shown in Figure 16. The residual stress values were determined for a depth range of 0 to 0.6 mm with an increment of 50–100 µm.
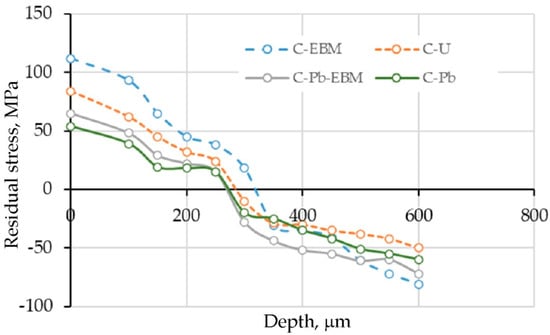
Figure 19.
Influence of the type of countersample surface modification on the value of residual stresses.
For all analysed surface modifications of countersamples, similar trends were observed regarding the distribution of residual stresses in the considered depth range (0–600 μm). Tensile residual stresses occur in the vicinity of the sheet surface. These stresses decrease with the change of depth and transform into compressive stresses at a depth of around 300 μm. The highest tensile stress was recorded for the C-EBM countersample, the value of which is about 112 MPa (Figure 19). The highest compressive residual stresses of about 80 MPa were also observed for the C-EBM countersample. On the other hand, the lowest values of both compressive and tensile residual stresses were found for the C-Pb countersample. It was observed that CoF has a significant effect on the distribution of residual stresses in the analysed process.
Residual stresses are the result of plastic deformation of the sheet strip and friction. Friction occurring at the contact between the countersample and the sheet strip generates heat (Table 6) and resistance to mutual movement of the surfaces. A higher CoF can lead to higher subsurface stresses resulting from the friction phenomenon. It is worth noting that the effect of the CoF on residual stresses is complex and depends on many other factors, such as material properties, countersample geometry, and technological process parameters. A higher CoF value causes higher tangential forces between the countersample and the sheet strip. After the load is removed, these deformations result in residual stresses. Both compressive and tensile residual stresses depend on the friction (tangential) force, although this relationship can be more complex and not always directly proportional.
During the deep-drawing process, the sheet metal is subjected to significant plastic deformations as it moves over the rounded edges of the tools in order to give it the desired shape. On the side of the sheet metal in contact with the tool, the material layers are compressed. On the outside, tensile stresses caused by bending the sheet metal dominate. Friction can disturb the stress state on the side of the sheet metal in direct contact with the tool surface.
3.4. Friction-Induced Change in Surface Topography of Samples
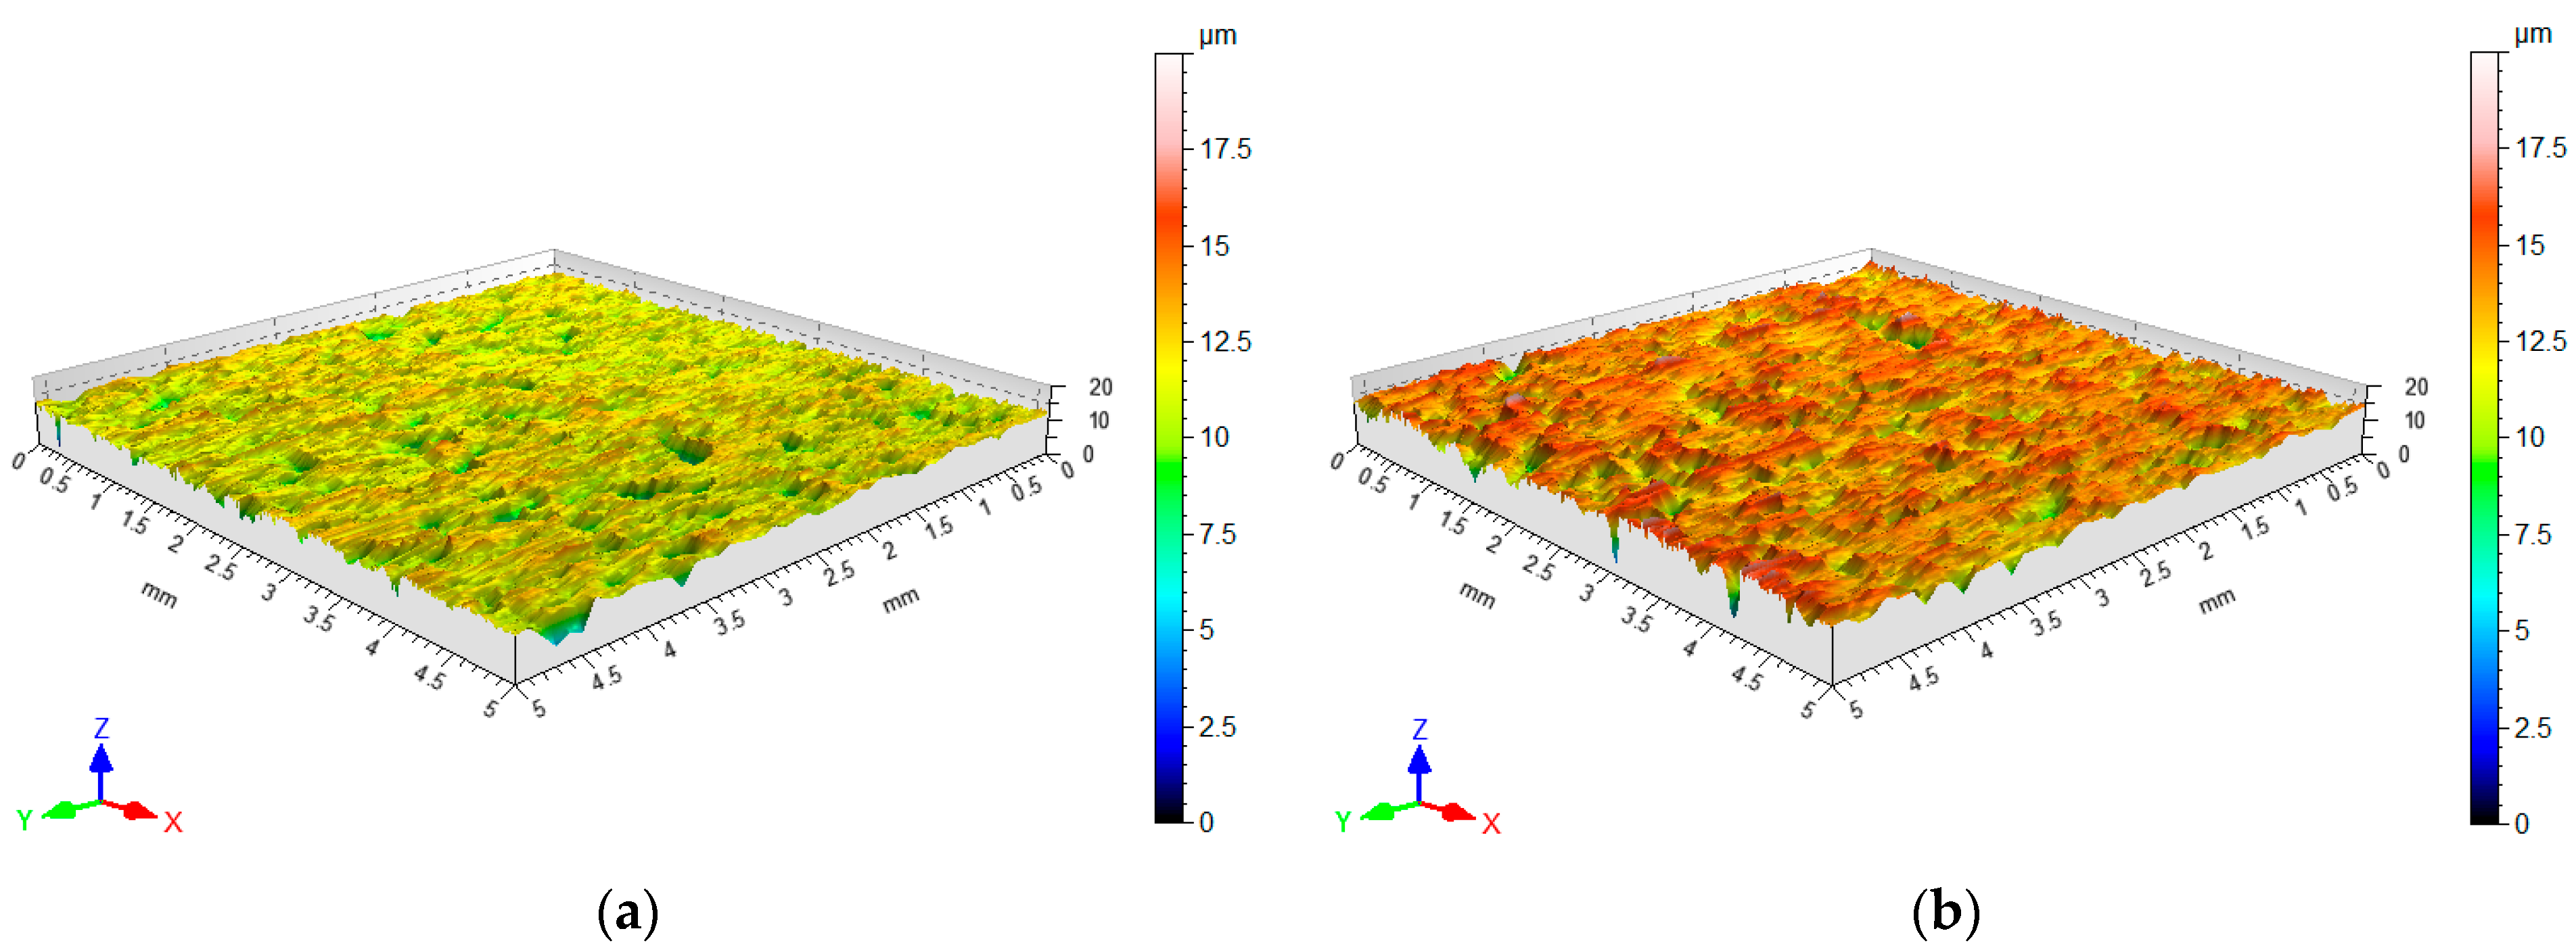
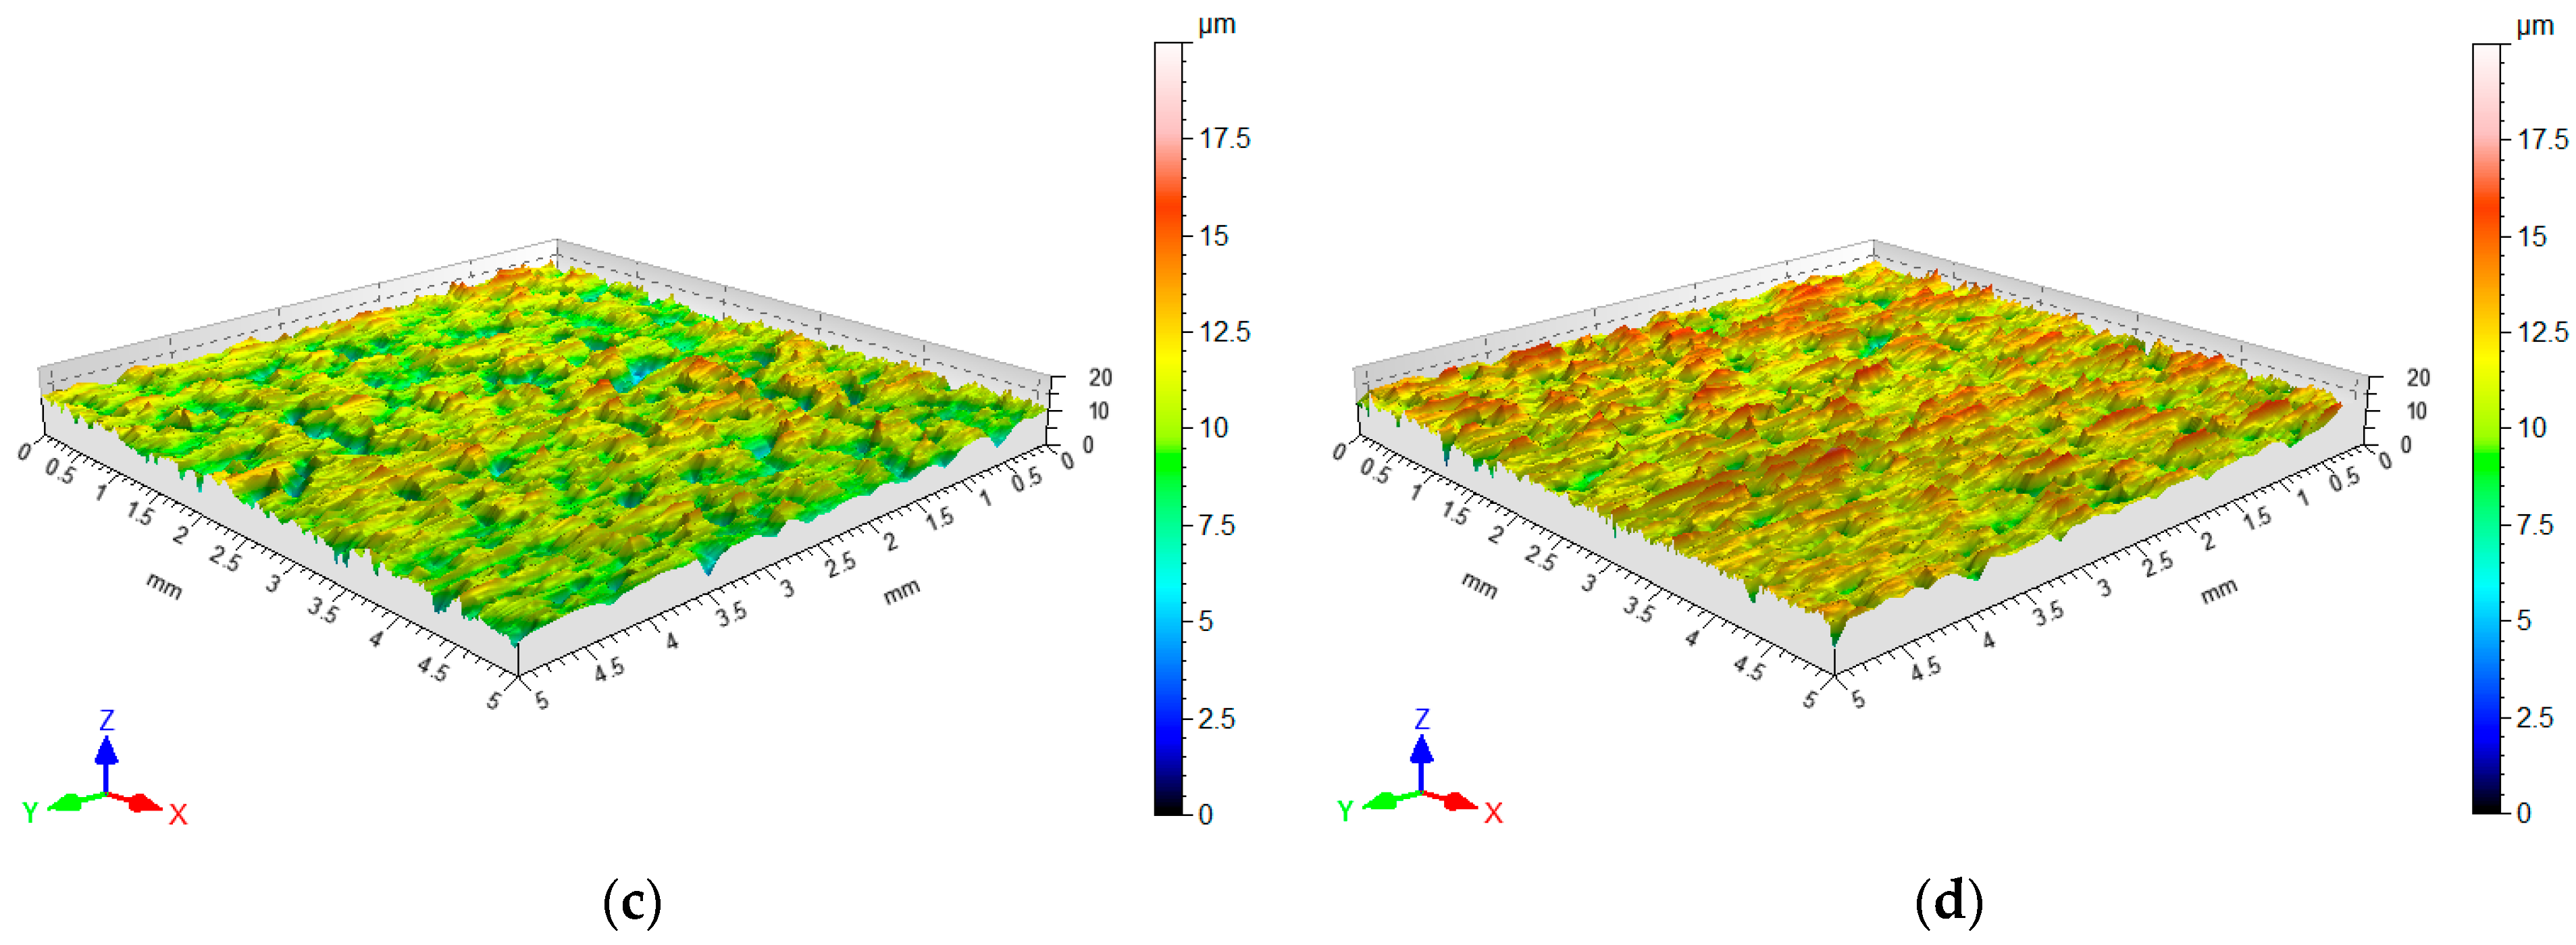
The friction phenomenon causes tribological wear of surfaces of friction pair, which largely depends on the stereometric properties of the surfaces, both in dry friction and lubricated conditions. Reducing the intensity of wear of the frictionally cooperating surfaces is an important design and technological task. Three-dimensional topographies of the samples on the side of contact with the CS are presented in Figure 20. Table 8 summarises the basic roughness parameters describing the tribological properties of the sheet surface. In general, the friction process caused a decrease in the parameters Sa and Sq of the surface roughness after the friction process with all types of countersamples. The negative value of skewness for all tested sheets indicates that the surface is dominated by valleys and grooves. However, during friction with the C-Pb and C-Pb-EBM countersamples, the initial negative skewness increased slightly. During friction with these countersamples, the Sa parameter of the sheets decreased to the least extent.
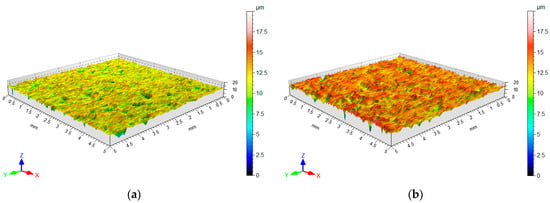
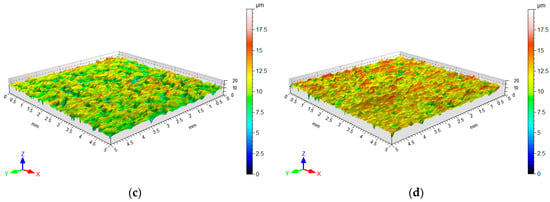
Figure 20.
Surface topography of the sheet metal after the friction process using countersamples: (a) C-EBM, (b) C-U, (c) C-PB, and (d) C-Pb-EBM.

Table 8.
Basic parameters of the surface roughness of sheet metal strips after the friction process.
Low-carbon DC01 steel sheet is a cheap and commonly used material in the automotive industry. At the same time, it is a material susceptible to corrosion. In this aspect, the surface roughness of the surface may weaken corrosion resistance. Higher surface roughness weakens corrosion resistance due to the increase in the real contact area [53]. For this reason, the greatest impact on the intensity of corrosive wear is exerted by the height parameters of surface roughness (e.g., Sa, Sp, Sz). In the analysed cases, the highest value of the Sa and Sq parameters was obtained by the sheet strip after friction with the C-Pb countersample. In turn, the lowest value was obtained for the C-EBM countersample. Surfaces with increased corrosion susceptibility have a topography dominated by deeper valleys (Figure 20c,d), while those more resistant to corrosion have a structure with greater anisotropy (Figure 20a).
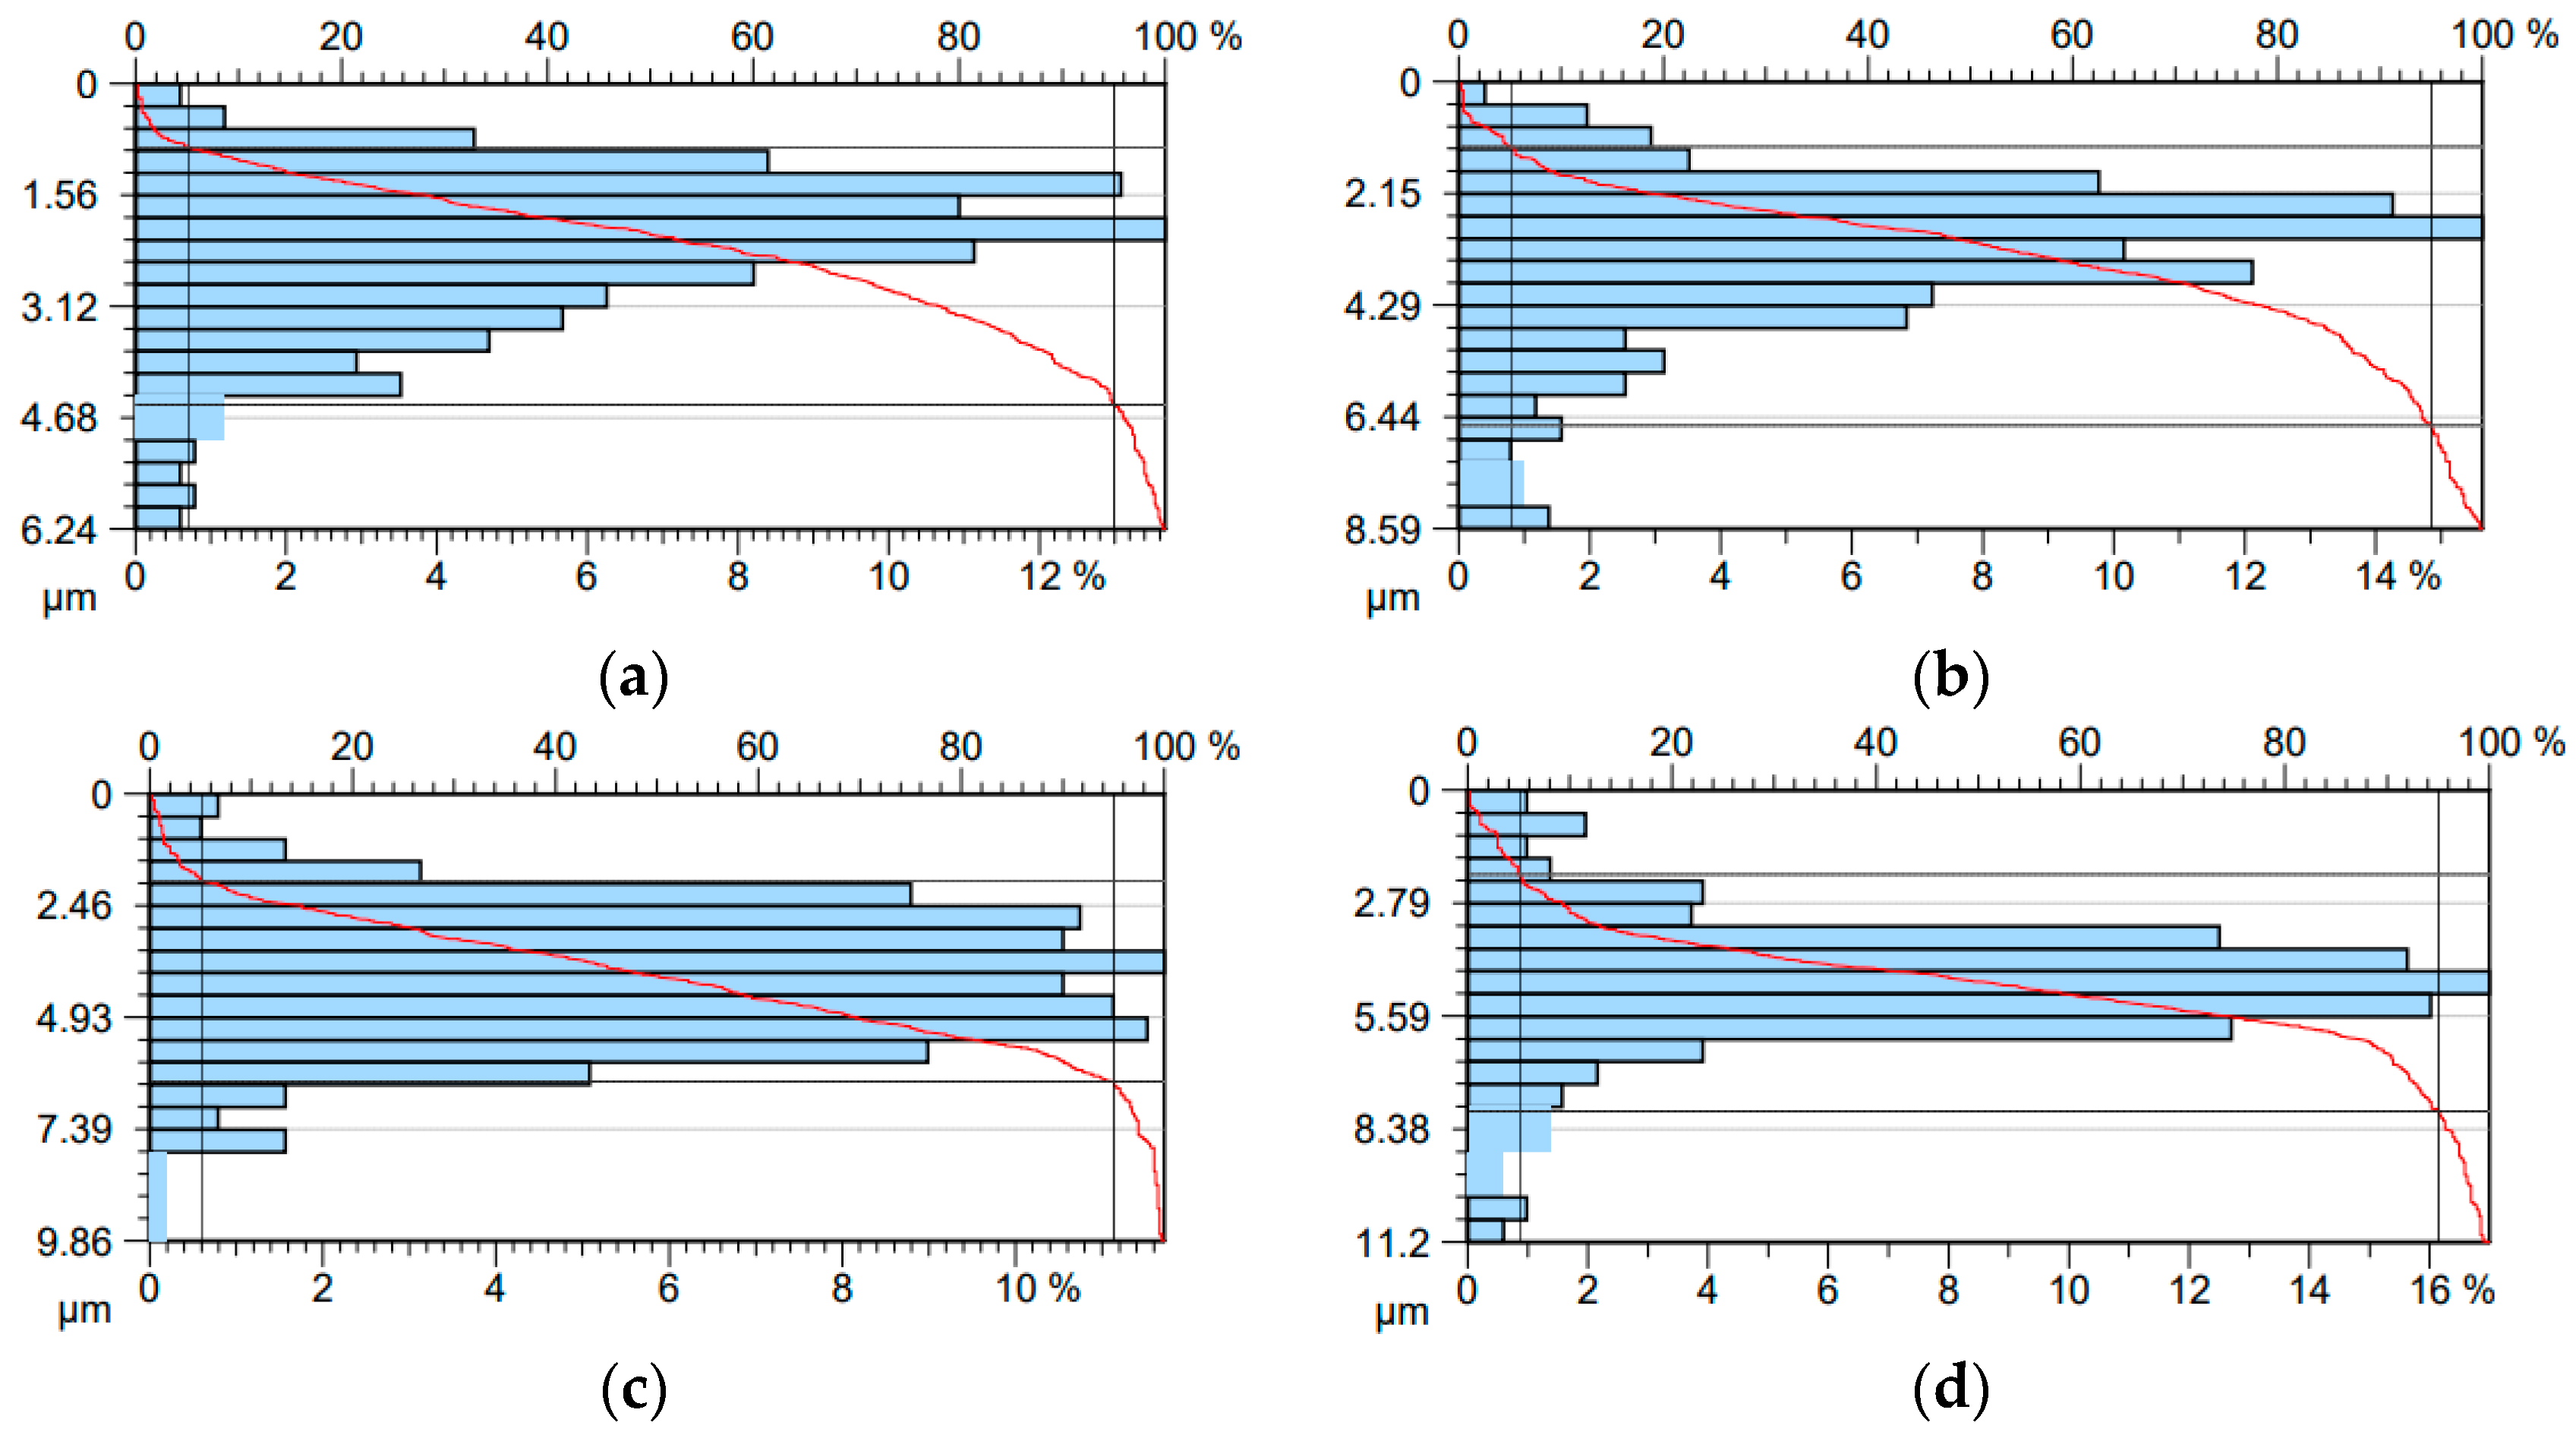
Figure 21 shows the BACs of sheet strips after the friction process. The lowest value of the Rpk parameter was obtained for the sheet strip subjected to friction with the C-EBM countersample (Table 9). This indicates a greater resistance of the surface to flattening the summits of asperities. Core peak-to-valley height Rk is responsible for the height of the surface asperities after the running-in period. The obtained Rk values for the tested sheet strips allow us to conclude that the load-bearing capacity of the sample surface after the friction process with the C-EBM countersample after the running-in period is higher than for the sample after the friction process with the C-Pb-EBM countersample. Reduced height of valleys Rvk is a measure of the surface’s ability to hold the lubricant in the valleys. For the analysed strip surfaces, the value of this parameter reached the highest value for the sample subjected to friction with the C-Pb-EBM countersample.
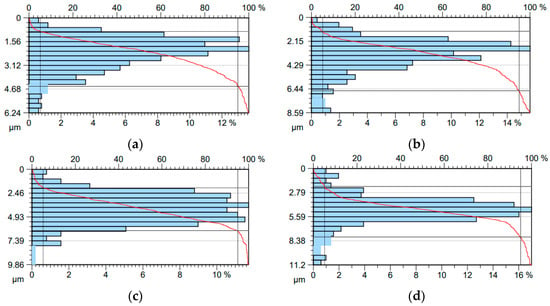
Figure 21.
Abbott–Firestone curves for the sheet strips after the friction process with the following countersamples: (a) C-EBM, (b) C-U, (c) C-Pb-EBM, and (d) C-Pb.

Table 9.
Basic parameters of the obtained Abbott–Firestone curves for sheet strips.
Many works concerning the process of sheet metal contact with the tool indicated that the roughness of the tool surface and its modifications have a significant effect on the coefficient of friction and the quality of material deformation. This has been confirmed by numerous studies on surface texturisation or its coating with various coatings. The presented results are consistent with this trend but, at the same time, offer a new perspective thanks to the use of Pb ion implantation and electron beam melting. The improved tribological properties of the modified samples obtained in the study can be explained by the reduced roughness and uniformity of the surface structure after electron beam melting, the effect of lead ions as a local lubricant in the surface layer, and the reduced adhesion of the sheet metal to the tool surface due to the energy and structural difference. From an industrial point of view, the obtained results have great implementation potential, especially in the context of cold stamping processes, where eliminating lubrication is becoming increasingly important due to ecological requirements and cost reduction; tool durability has a direct impact on the profitability of the entire production, stress control in critical zones is crucial to avoid sheet metal cracking.
4. Conclusions
The investigations on the BUT friction testing DC01 sheet metals were focused on the effect of surface modification of countersamples on the change of the main parameters of surface roughness, CoF, and residual stresses. The main conclusions can be summarised as follows:
- A significant increase in the CoF was observed with the elongation of the samples between 0% and about 6% for all the analysed types of countersamples. After exceeding this strain value, the value of the CoF stabilises. The maximum value of the CoF, about 0.31, was found for the C-EBM and C-U countersamples. For the remaining countersamples, the value of the COF was about 0.27.
- Due to the limited sample elongations to fracture in the BUT test, the recorded temperature increase was between 0.34 °C (DC01/C-Pb friction pair) and 0.58 °C (DC01/C-EBM friction pair). The increase in the surface temperature of the countersample was related to the phenomenon of external friction and the transfer of heat generated through internal friction.
- For all the analysed friction pairs, the occurrence of residual tensile stresses was observed near the contact surface of the sheet strip with the countersample. These stresses amounted to between 55 MPa (DC01/C-Pb friction pair) and 112 MPa (DC01/C-EBM friction pair). With the increase in the considered depth of residual stress measurement, the residual tensile stresses were transformed into compressive stresses with a value between −75 and −50 MPa, depending on the type of friction pair. It was observed that the residual stresses depend on the CoF. The higher the CoF value, the higher the value of residual tensile stresses in the subsurface layer.
- Analysis using SEM allowed us to identify adhesion and abrasive wear as the main mechanisms of surface topography change of the sheets as a result of the friction process. High contact pressures and strain-induced change of surface topography of the sheets cooperating with all analysed types of countersamples led to an intensive flattening of the surface asperities of the sheet strips. The friction process caused a decrease in the parameters Sa, Sq, and Sp in relation to the base sheet metal.
The study was conducted only on low-carbon steel DC01 and tools made of 145Cr6 steel. Conclusions may, therefore, be limited to this specific material configuration. It is, therefore, worth extending the scope of the study to include other steel grades and other metals. This could confirm the universality of the solutions used to modify the tool surface. The BUT tests were conducted in laboratory conditions, which do not always fully reflect industrial conditions. In the future, it is worth considering tests in industrial conditions, which would allow for the assessment of the durability of the modification effects in the long term and their impact on tool wear. Additionally, the focus was on two surface modification techniques: electron beam modification and Pb ion implantation. Although the effects were promising, other methods, such as the use of PVD or CVD coatings or laser texturing, could also bring interesting results. Therefore, it is worth including other surface modification technologies in the experimental comparisons. Proposals for future research directions are the following: analysis of tool wear after many work cycles and tribological studies, including analysis of the influence of tool modification on the behaviour of the surface in terms of topography and residual stresses.
Author Contributions
Conceptualisation, K.S. and T.T.; methodology, K.S., T.T., M.S. and J.Z.-S.; software, K.S. and J.Z.-S.; validation, K.S., T.T., M.S. and M.B.; formal analysis, T.T., K.S. and M.B.; investigation, T.T., K.S. and M.S.; resources, K.S., T.T. and J.Z.-S.; data curation, K.S., J.Z.-S. and M.S.; writing—original draft preparation, T.T., K.S. and M.B.; writing—review and editing, T.T. and K.S.; visualisation, K.S., M.S. and J.Z.-S.; supervision, K.S. and T.T. All authors have read and agreed to the published version of the manuscript.
Funding
This research received no external funding.
Data Availability Statement
The original contributions presented in this study are included in the article. Further inquiries can be directed to the corresponding author.
Conflicts of Interest
The authors declare no conflicts of interest.
References
- Luiz, V.D.; Rodrigues, P.C.M. Design of a tribo-simulator for investigation of the tribological behavior of stainless-steel sheets under different contact conditions. Mater. Res. 2022, 25, e20210220. [Google Scholar] [CrossRef]
- Trzepiecinski, T.; Lemu, H.G. Recent developments and trends in the friction testing for conventional sheet metal forming and incremental sheet forming. Metals 2020, 10, 47. [Google Scholar] [CrossRef]
- Trzepieciński, T.; Szwajka, K.; Szewczyk, M.; Zielińska-Szwajka, J.; Slota, J.; Kaščák, Ľ. The Effect of the addition of silicon dioxide particles on the tribological performance of vegetable oils in HCT600X+Z/145Cr46 steel contacts in the deep-drawing process. Materials 2025, 18, 73. [Google Scholar] [CrossRef]
- Slota, J.; Kaščák, Ľ.; Lăzărescu, L. Frictional characteristics of EN AW-6082 aluminium alloy sheets used in metal forming. Adv. Mech. Mater. Eng. 2024, 41, 79–87. [Google Scholar] [CrossRef]
- Trzepieciński, T.; Najm, S.M.; Ibrahim, O.M.; Kowalik, M. Analysis of the frictional performance of AW-5251 aluminium alloy sheets using the random forest machine learning algorithm and multilayer perceptron. Materials 2023, 16, 5207. [Google Scholar] [CrossRef]
- Sigvant, M.; Pilthammar, J.; Hol, J.; Wiebenga, J.H.; Chezan, T.; Carleer, B.; van den Boogaard, T. Friction in sheet metal forming: Influence of surface roughness and strain rate on sheet metal forming simulation results. Procedia Manuf. 2019, 29, 512–519. [Google Scholar] [CrossRef]
- Szewczyk, M.; Mezher, M.T.; Jaber, T.A. The use of artificial neural networks to the analysis of lubricating performance of vegetable oils for plastic working applications. Adv. Mech. Mater. Eng. 2025, 42, 5–15. [Google Scholar] [CrossRef]
- Nielsen, C.V.; Bay, N. Overview of friction modelling in metal forming processes. Procedia Eng. 2017, 207, 2257–2262. [Google Scholar] [CrossRef]
- Fum, X.J.; Li, J.J.; Liu, Q. Friction behavior under different forming speed for sheet metal forming. Adv. Mater. Res. 2012, 472–475, 662–665. [Google Scholar] [CrossRef]
- Dohda, K.; Boher, C.; Rezai-Aria, F.; Mahayotsanun, N. Tribology in metal forming at elevated temperatures. Friction 2015, 3, 1–27. [Google Scholar] [CrossRef]
- Luiz, V.D.; Santos, A.J.d.; Câmara, M.A.; Rodrigues, P.C.d.M. Influence of different contact conditions on friction properties of AISI 430 steel sheet with deep drawing quality. Coatings 2023, 13, 771. [Google Scholar] [CrossRef]
- Barros, T.H.C.; Gonzaga, I.A.D.; Neto, A.S.; Amaral, E.C.; Gonçalves, K.A.M.B.; de Matos Rodrigues, P.C.; Luiz, V.D. Influence of multi-pass forming on the tribological performance of AISI 430 steel sheet in deep drawing process. Adv. Mech. Mater. Eng. 2025, 42, 59–69. [Google Scholar] [CrossRef]
- Zwicker, M.F.R.; Bay, N.; Nielsen, C.V. A new test for sheet metal asperity flattening under varying subsurface strain conditions. Tribol. Int. 2023, 180, 108249. [Google Scholar] [CrossRef]
- Hol, J.; Cid Alfaro, M.V.; de Rooij, M.B.; Meinders, T. Advanced friction modeling for sheet metal forming. Wear 2012, 286–287, 66–78. [Google Scholar] [CrossRef]
- Peng, L.F.; Mao, M.Y.; Fu, M.W.; Lai, X.M. Effect of grain size on the adhesive and ploughing friction behaviours of polycrystalline metals in forming process. Int. J. Mech. Sci. 2016, 117, 197–209. [Google Scholar] [CrossRef]
- Pujante, J.; Pelcastre, L.; Vilascena, M.; Casellas, D.; Prakash, B. Investigations into wear and galling mechanism of aluminium alloy-tool steel tribopair at different temperatures. Wear 2013, 308, 193–198. [Google Scholar] [CrossRef]
- Hanson, M. On Adhesion and Galling in Metal Forming; Uppsala Universitet: Uppsala, Sweden, 2008; Available online: https://www.diva-portal.org/smash/get/diva2:171318/FULLTEXT01.pdf (accessed on 1 April 2024).
- Trzepieciński, T.; Szwajka, K.; Szewczyk, M.; Zielińska-Szwajka, J.; Barlak, M.; Nowakowska-Langier, K.; Okrasa, S. Analysis of influence of coating type on friction behaviour and surface topography of DC04/1.0338 steel sheet in bending under tension friction test. Materials 2024, 17, 5650. [Google Scholar] [CrossRef]
- Folle, L.; Schaeffer, L. New proposal to calculate the friction in sheet metal forming through bending under tension test. Mater. Res. 2019, 22, e20190523. [Google Scholar] [CrossRef]
- Wu, Y.; Recklin, V.; Groche, P. Strain induced surface change in sheet metal forming: Numerical prediction, influence on friction and tool wear. J. Manuf. Mater. Process. 2021, 5, 29. [Google Scholar] [CrossRef]
- Simon, N.; Erdle, H.; Walzer, S.; Gimbeier, J.; Böhlke, T.; Liewald, M. Residual stresses in deep-drawn cups made of duplex stainless steel X2CrNiN23-4. Forscung Im Ingenieurwesen 2021, 85, 795–806. [Google Scholar] [CrossRef]
- Mousavi, A.; Brosius, A. Improving the springback behavior of deep drawn parts by macro-structured tools. IOP Conf. Ser. Mater. Sci. Eng. 2018, 418, 012105. [Google Scholar] [CrossRef]
- Kubiak, K.J.; Liskiewicz, T.W.; Mathia, T.G. Surface morphology in engineering applications: Influence of roughness on sliding and wear in dry fretting. Tribol. Int. 2011, 44, 1427–1432. [Google Scholar] [CrossRef]
- Littlewood, M.; Wallace, J.F. Effect of surface finish and lubrication on frictional variations involved in sheet-metal-forming process Sheet Met. Ind. 1964, 41, 925–930. [Google Scholar]
- Wilson, W.R.D.; Malkani, H.G.; Saha, P.K. Boundary friction measurements using a new sheet metal forming simulator. Trans. NAMRI/SME 1991, 18, 37–42. [Google Scholar]
- Saha, P.K.; Wilson, W.R.D. Influence of plastic strain on friction in sheet metal forming. Wear 1994, 172, 167–173. [Google Scholar] [CrossRef]
- Nanayakkara, N.K.B.M.P.; Kelly, G.; Hodgson, P. Application of bending under tension test to determine the effect of tool radius and the contact pressure on the coefficient of friction in sheet metal forming. Mater. Forum 2005, 29, 114–118. [Google Scholar]
- Fratini, L.; Lo Casto, S.; Lo Valvo, E. A technical note on an experimental device to measure friction coefficient in sheet metal forming. J. Mater. Process. Technol. 2006, 172, 16–21. [Google Scholar] [CrossRef]
- Berglund, J.; Brown, C.A.; Rosén, B.G.; Bay, N. Milled die steel surface roughness correlation with steel sheet friction. CIRP Ann.—Manuf. Technol. 2010, 59, 577–580. [Google Scholar] [CrossRef]
- Trzepieciński, T.; Szwajka, K.; Szewczyk, M.; Barlak, M.; Zielińska-Szwajka, J. Effect of countersample coatings on the friction behaviour of DC01 steel sheets in bending-under-tension friction tests. Materials 2024, 17, 3631. [Google Scholar] [CrossRef]
- Folle, L.F.; Schaeffer, L. Evaluation of contact pressure in bending under tension test by a pressure sensitive film. J. Surf. Eng. Mater. Adv. Technol. 2016, 6, 201–214. [Google Scholar] [CrossRef][Green Version]
- Nielsen, C.V.; Legarth, B.N.; Niordson, C.F.; Bay, N. A correction to the analysis of bending under tension tests. Tribol. Int. 2022, 173, 107625. [Google Scholar] [CrossRef]
- EN 10130:2009; Cold Rolled Low Carbon Steel Flat Products for Cold Forming—Technical Delivery Conditions. British Standards Institution: London, UK, 2009.
- ISO 6892-1:2020; Metallic Materials—Tensile Testing-Part 1: Method of Test at Room Temperature. Beuth-Verlag: Berlin, Germany, 2020.
- EN ISO 25178-2:2022; Geometrical Product Specifications (GPS)—Surface Texture: Areal—Part 2: Terms, Definitions and Surface Texture Parameters. International Organization for Standardization: Geneva, Switzerland, 2022.
- EN ISO 16610-21:2013; Geometrical Product Specifications (GPS)—Filtration—Part 21: Linear Profile Filters: Gaussian Filters. International Organization for Standardization: Geneva, Switzerland, 2012.
- EN ISO 13565-2:1999; Geometrical Product Specifications (GPS)—Surface Texture: Profile Method, Surfaces Having Stratified Functional Properties—Part 2: Height Characterization Using the Linear Material Ratio Curve. International Organization for Standardization: Geneva, Switzerland, 1996.
- Betlej, I.; Barlak, M.; Krajewski, K.; Andres, B.; Werner, Z.; Jankowska, A.; Zakaria, S.; Boruszewski, P. Effect of Cu, Zn and Ag ion implantation on the surface modification of bacterial cellulose films. Coatings 2023, 13, 254. [Google Scholar] [CrossRef]
- Barlak, M.; Wilkowski, J.; Szymanowski, K.; Czarniak, P.; Podziewski, P.; Werner, Z.; Zagórski, K.; Staszkiewicz, B. Influence of the ion implantation of nitrogen and selected metals on the lifetime of WC-Co indexable knives during MDF machining. Ann. WULS—SGGW. For. Wood Technol. 2019, 108, 45–52. [Google Scholar] [CrossRef]
- Szewczyk, M.; Szwajka, K. Assessment of the tribological performance of bio-based lubricants using analysis of variance. Adv. Mech. Mater. Eng. 2023, 40, 31–38. [Google Scholar] [CrossRef]
- Tayebi, N.; Polycarpou, A.A. Modeling the effect of skewness and kurtosis on the static friction coefficient of rough surfaces. Tribol. Int. 2004, 37, 491–505. [Google Scholar] [CrossRef]
- Durejko, T.; Zarański, Z.; Sulej, S. Surface layer of FeAl + Al2O3 composites constitued by electrical discharge machining. Kompozyty 2008, 8, 190–194. [Google Scholar]
- Shisode, M.; Hazrati, J.; Mishra, T.; de Rooij, M.; ten Horn, C.; van Beeck, J.; van den Boogaard, T. Modeling boundary friction of coated sheets in sheet metal forming. Tribol. Int. 2021, 153, 106554. [Google Scholar] [CrossRef]
- Zwicker, M.; Bay, N.; Nielsen, C.V. A discussion of model asperities as a method to study friction in metal forming. Discov. Mech. Eng. 2023, 2, 3. [Google Scholar] [CrossRef]
- Filzek, J.; Keil, D.; Schröder, H. Temperature Induced Friction Increase in Friction Test and Forming Demonstrator for Sheet Metal Forming. 2021. Available online: https://popups.uliege.be/esaform21/index.php?id=3732 (accessed on 1 April 2024).
- Hol, J.; Meinders, V.T.; de Rooij, M.B.; van den Boogaard, A.H. Multi-scale friction modeling for sheet metal forming: The boundary lubrication regime. Tribol. Int. 2015, 81, 112–118. [Google Scholar] [CrossRef]
- Popov, V.L. Contact Mechanics and Friction: Physical Principles and Applications, 2nd ed.; Springer: Berlin/Heidelberg, Germany, 2017. [Google Scholar]
- Wu, L.; Zhao, C.; Cao, M.; Han, X. Effect of ultrasonic and low frequency vibrations on friction coefficient at die radius in deep drawing process. J. Manuf. Process. 2021, 71, 56–69. [Google Scholar] [CrossRef]
- Groche, P.; Kloepsch, C.; Moeller, N. Numerical analysis of the potential of deep drawing processes with hydrostatic pressure lubrication. Prod. Eng. 2012, 6, 157–167. [Google Scholar] [CrossRef]
- Popov, A.L.; Kozintsev, V.M.; Chelyubeev, D.A.; Levitin, A.L. Hole-drilling method in residual stress diagnostics. Mech. Solids 2021, 56, 1320–1339. [Google Scholar] [CrossRef]
- ASTM E837-20:2020; Standard Test Method for Determining Residual Stresses by the Hole-Drilling Strain-Gage Method. American Society for Testing and Materials: West Conshohocken, PA, USA, 2020.
- Tabatabaeian, A.; Ghasemi, A.R.; Shokrieh, M.M.; Marzbanrad, B.; Baraheni, M.; Fotouhi, M. Residual stress in engineering materials: A review. Adv. Eng. Mater. 2022, 24, 2100786. [Google Scholar] [CrossRef]
- Grzesik, W. Effect of the machine parts surface topography features on the machine service. Mechanik 2015, 8–9, 587–593. [Google Scholar] [CrossRef]
Disclaimer/Publisher’s Note: The statements, opinions and data contained in all publications are solely those of the individual author(s) and contributor(s) and not of MDPI and/or the editor(s). MDPI and/or the editor(s) disclaim responsibility for any injury to people or property resulting from any ideas, methods, instructions or products referred to in the content. |
© 2025 by the authors. Licensee MDPI, Basel, Switzerland. This article is an open access article distributed under the terms and conditions of the Creative Commons Attribution (CC BY) license (https://creativecommons.org/licenses/by/4.0/).

