Abstract
Electrically induced bearing failure is a reoccurring problem in modern drive train designs. To predict this damage, electrical models of bearings are required. In these models, the permittivity of lubricants is often assumed to be constant. However, the permittivity is dependent on pressure and temperature. For operating temperatures and pressures of journal bearings, no investigation of the permittivity of the lubricant exists. For this purpose, this study investigates the pressure and temperature dependence of lubricant permittivity using specially fabricated model bodies with layered structures of steel, ceramic insulating layers and copper in a parallel plate capacitor setup. Tests were performed applying temperatures between 20 °C and 100 °C and pressures between 1 and 250 bar. A mineral oil and a polyalkylene glycol (PAG) oil were examined. Results show a clear dependence of the permittivity on pressure and temperature. The mineral oil exhibits stronger pressure sensitivity, while the PAG oil shows more pronounced temperature dependence. Empirical equations to describe the permittivity as a function of temperature and pressure are derived. These findings provide relevant input for the selection of lubricants used in electrical environments. They also support the development of predictive models for modern electrical and tribological systems.
1. Introduction
The increasing integration of electrical systems across various applications, ranging from the automotive industry to industrial machinery, imposes new demands on the materials and operational media used. In such systems, lubricants play a central role in facilitating their function by reducing friction and wear, as well as by facilitating cooling functions of machine elements and bearings in particular. With the increased electrification of drive trains, the number of electrically induced bearing failures has increased [1,2]. To understand and predict the likelihood of such failures occurring and to electrically model a drive train, the electrical properties of lubricants, including permittivity, electrical resistivity and dielectric strength need to be known.
Electrically insulating lubricants in bearings are known to show capacitive electric behavior [3,4,5,6]. To model the capacitive behavior of the bearing accurately, the electric properties of lubricants are crucial, particularly the permittivity. For this purpose, the lubricant is often assumed to have constant relative permittivity. However, the permittivity of a lubricant is heavily dependent on the type of lubricant used and its additives [7].
In general, the relative permittivity of lubricants is dependent on temperature, pressure and electric frequency [8]. This dependence can critically affect the performance and reliability of electrical systems as changes in operating conditions can lead to sudden and unexpected changes in the electric behavior of such systems. Despite the critical importance of this property, systematic investigations into the pressure and temperature dependence of lubricant permittivity remain relatively scarce. This is especially the case for journal bearing applications as no work on the electric properties of technically relevant lubricants within the expected temperature and pressure ranges could be identified.
Several previous investigations have examined the dielectric properties of lubricants under varying temperatures, typically within ranges between approximately 20 °C and 100 °C, yet these studies were generally conducted at constant pressure and did not provide explicit functional correlations (e.g., García Tuero et al. [7].; Weicker et al. [9]; Sedrez and Barosa [10]). While Masuko et al. [11] considered both pressure and temperature, the analysis was focused primarily on dielectric relaxation frequency rather than a parametric description of permittivity itself. Consequently, no comprehensive study has been found that provides a functional characterization of the relative permittivity of lubricants simultaneously as a function of pressure and temperature within the operating ranges relevant for hydrodynamic journal bearings.
This article aims to characterize the temperature and pressure dependence of two lubricants and describes these dependencies through models that can help the design of future electric systems. For this purpose, a capacitor is set up with a plate distance that simulates a realistic lubrication film thickness for journal bearings. With the setup, the pressure and temperature dependence of the permittivity is investigated for two different lubricants. The following research questions will be examined:
- What temperature and pressure dependence of the permittivity can be observed for a mineral oil and polyalkylene glycol (PAG) oil assuming operating parameters within a journal bearing?
- How can the relationship between the permittivity of the oils and temperature and pressure be modeled to allow the calculation of the permittivity in the future?
The models for the temperature and pressure dependence of the permittivity derived in this article can be used to predict the electric behavior of journal bearings based on a known operating condition and lubrication film thickness. With these findings, the lubricant selection and system design for electrically loaded journal bearings can be improved, thereby enhancing the efficiency and longevity of electrical systems.
2. Materials and Methods
In this section, the basics for the electrical modeling of journal bearings are described, and an overview over the state of research on topic is given. Thereafter, the test setup, test method as well as the evaluation method used to retrieve the permittivity from the measurements are described.
2.1. Electric Behavior of Journal Bearings
The capacitive electric behavior of journal bearings has been known for decades as described by Prashad et al. [3,4,5,6]. The simplest model of the electric behavior of a journal bearing is that of a plate capacitor according to Equation (1) and Figure 1.
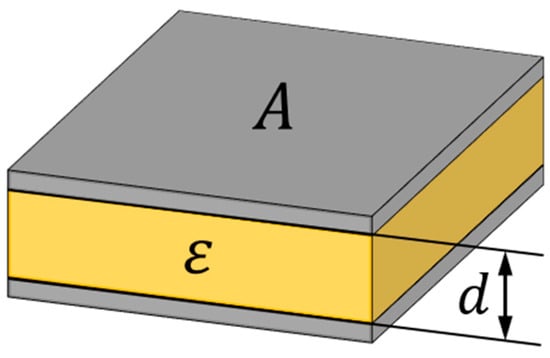
Figure 1.
Schematic representation of a plate capacitor.
This equation uses the permittivity of the lubricant ε between two metallic surfaces with an overlapping area A and a distance d. Even though a journal bearing resembles an eccentric cylindrical capacitor, according to Bittner and Kluth [12] the modeling as a plate capacitor is accurate to a relative error of less than
.
Koetz et al. [13] show a practical application of the electrical modeling of a journal bearing as a capacitor by interpreting the lubrication condition of the bearing based on the electric behavior. Additionally, the results show that deriving the lubrication film thickness from the measured electric behavior is possible if the permittivity of the oilis known. Therefore, the characterization of the permittivity of the oil in such an application setup is of vital importance to ensure the reduction of modeling errors.
Hydrodynamic journal bearings are typically subjected to substantial spatial variations in both pressure and temperature along the circumferential direction. Maximum hydrodynamic pressure is generated within the converging wedge of the oil film, while temperatures rise locally due to viscous shear and limited heat dissipation. Reported operating ranges indicate lubricant film temperatures commonly between approximately 40 °C and 80 °C under steady-state conditions, with higher values occurring under increased thermal load. Peak oil film pressures strongly depend on bearing geometry and loading and can reach several tens to hundreds of bar in highly loaded operating regimes [14]. For these operating conditions, the temperature and pressure dependence of the permittivity of the oil becomes relevant if the bearing is to be described electrically.
2.1.1. Permittivity of Oils
The permittivity of oils describes the degree to which the fluids can be polarized [15]. Permittivity consists of relative permittivity
, which is specific to a material, and absolute permittivity
, which is a constant of nature. The European standard IEC 60247 [16] describes a method for measuring the relative permittivity and resistivity of insulating liquids such as oils used in transformers. However, it does not contain references to the pressure dependence of permittivity as this dependence is not relevant for the application. From the standard, it can be understood that relative permittivity is dependent on the temperature of the lubricant and the time of electrification. The time of electrification is important for AC voltage applications as it varies dependent on the frequency of the AC voltage signal. Additionally, permittivity and its dependence on the electric frequency, temperature and pressure is highly dependent on additives and the selection of the base lubricant.
Weicker et al. [9] investigated the permittivity of a selection of lubricants and their dependence on temperature, pressure and electric frequency for ball bearing applications. However, the purpose of the research was ball bearing applications, which means that pressure and temperature ranges differ to journal bearing applications. Furthermore, models that allow the prediction of permittivity based on temperature and pressure were not obtained.
2.1.2. Examined Oils: PAG and Mineral Oil
In this study, the dielectric properties of two lubricants are considered: a synthetic polyalkylene glycol (PAG) oil and a mineral oil with additives. To minimize the influence of degradation, only fresh oils (opened less than three months before testing) are used.
PAGs represent a flexible class of synthetic lubricants whose molecular architecture can be tailored to specific applications. Water-soluble PAGs, such as the one investigated here, exhibit a strong polarity. As reported by Mortier et al. [17], this polarity leads to a more pronounced dependence of dielectric behavior on temperature, pressure and frequency.
Mineral oils, in contrast, consist of non-polar base oils that exhibit very low dielectric activity on their own. The observed polarity and resulting dielectric behavior originate primarily from the additive package blended into the base oil. These additives contain polar functional groups, such as those found in anti-wear agents, detergents, dispersants, and antioxidants, which interact with the electric field and significantly modify the overall dielectric response. Consequently, the dielectric properties result in measurable dependencies on operating conditions. Therefore, dielectric behavior must be interpreted as the combined effect of the inherently non-polar base oil, the polar contributions of the additives, and their interaction under varying operating conditions.
2.1.3. Impedance Measurement Method
To measure the permittivity of a lubricant, the measurement of the capacitance of the lubricant is necessary. As Equation (1) shows, the permittivity of the lubricant can be directly estimated from the capacitance once the distance and the area of the plate capacitor are known. For measuring permittivity, only the relative permittivity
is relevant as it changes with material and state while the absolute permittivity
remains constant.
In the literature, the measurement of the capacitance is performed by measuring its charging curve [9] or by measuring its impedance [13]. As discussed by Koetz and Kirchner, the impedance offers advantages for the monitoring of transient systems [18]. For this contribution, the system is stationary, and both measurement via charging curve or via impedance measurement would be feasible. However, in future applications, the use of the measurement setup in an operating journal bearing is planned. Operating journal bearings show transient behavior which would benefit from impedance measurement [18]. Therefore, the focus of this contribution is impedance measurement.
The measurement of the complex impedance of the capacitance utilizes the fact that AC voltages applied to capacitors result in a phase shift between the voltage and the current at the capacitor. The impedance of a serial circuit consisting of a capacitance
and a resistance
can be calculated using Equation (2) with a known frequency of the voltage signal
.
The resulting impedance can be displayed as a complex number. In such a circuit, the real part of the imaginary number corresponds to the resistive behavior and the imaginary part to the impedance caused by the capacitance in the circuit. Consequently, the phase
in a serial connection of a resistor and a capacitor can be understood as a ratio between the resistive behavior
and the capacitive behavior
in the circuit according to (3). When using the impedance measurement, the magnitude of the impedance and the phase can be obtained. Thereafter, the capacitance and the permittivity of a capacitor can be calculated.
The disadvantage of measuring the impedance is the fact that the permittivity of the lubricant is generally dependent on the electric frequency that is applied. It is therefore advisable to perform the measurement of the permittivity within a limited frequency range. The frequency used in this contribution is limited to a constant frequency of
to eliminate the frequency dependence as a disturbance as it is only expected to play a significant role at
and higher frequencies according to Weicker et al. [9].
2.1.4. Review of the Literature
To assess the current state of research towards the permittivity of lubricants further, a systematic review of the existing literature is conducted. For that, the database “Web of Science” was used with the search string
ALL = ((Permittivity AND lubricant) OR (Permittivity AND lubrication)).
The 82 results found were title and abstract screened for their relevance to the topic of this contribution. Of the 82 results, 48 were not relevant for this contribution as they focused on non-tribological topics or on lubricants with nano-additives specifically designed to increase electrical conductivity. Another 26 results of the search focused on condition monitoring applications by the continuous measurement of permittivity during operation. Of the remaining eight results, two were inaccessible or in a language not known to the authors of the contribution, leaving six results to be analyzed further.
Joshi and Blennow [19] characterized three samples of bearing lubricants electrically. These samples were a hydrogenated mineral oil with acrylic copolymers, a semi synthetic oil with nano particles to reduce the effect of surface roughness, and a fully synthetic grease. They found a relative permittivity at 40 Hz between 2.15 and 2.25 for the oil and between 3.82 and 4.67 for the grease. However, their measuring results do not include frequencies above 1000 Hz that would be relevant for the impedance measurement method. They also found a significant dependence of permittivity on frequency and of resistance on the temperature. However, no temperature or pressure dependence of the permittivity was investigated.
Prathima et al. [20] investigated the environmental effect of lubricity additives by analyzing the electrical properties of diesel fuels. They found the permittivity of the liquid to be influenced by frequency more than temperature. However, both have an effect that is dependent on the additive used and the composition of the mixture. Furthermore, the temperature dependence was only investigated between
and
.
Tuero et al. [7] investigated the electrical properties of three transmission fluids. They have found the permittivity to change between 20 °C and 100 °C by only 4%; however, a significant dependence of the conductivity on the temperature was noted. Whether they investigated synthetic or mineral oils was not described.
Hartmann et al. [21] investigated how the electric properties of antennas change when covered by water or by a mixture of water and an industrial lubricant. They found that the permittivity of the mixture of lubricant and water specifically did not show any dependence on temperature and frequency. However, water alone did show that dependence and, furthermore, showed varying sensitivity to frequency changes depending on temperature. However, the lubricant used is not specified.
Sedrez and Barbosa [10] investigated the electric properties of two refrigerants as well as a reference polyol ester lubricating oil (ISO VG 10). They only found a small temperature dependence of the lubricating oil’s permittivity. However, they found the permittivity of the lubricant to be 3.5, which shows a significant variation in the permittivity between different publications. Their measurements were taken at a frequency of 1 kHz.
Sun et al. [22] investigated the temperature dependence of the permittivity and conductivity of an automatic transmission fluid at 50 Hz. They found the permittivity to drop linearly from 2.28 to 2.13 between 30 °C and 100 °C. However, the resistivity showed a nonlinear dependence while dropping from
to
.
Masuko et al. [11] investigated the temperature and pressure dependence of the permittivity. However, their research was mainly focused on the dielectric relaxation frequency and not on a parametric description of the temperature and pressure dependence.
Based on the literature, a high dependence of the electrical properties (resistivity and permittivity) of a lubricant on the base oil and additives of the lubricant can be deduced. Additionally, these electric properties are dependent on pressure and temperature [23]. Operating journal bearings exhibit significant temperature and pressure gradients which affect the local electric properties. The literature does not include a publicly available comprehensive study of the electric properties of lubricants at temperature and pressure ranges within an operating journal bearing. Consequently, the investigation of the lubricant’s electric properties and their dependence on temperature and pressure need to be investigated before the electric behavior of journal bearings can be modeled. Measuring techniques also cannot be adapted from the literature as equipment used in the contributions mentioned here is not suitable for measurements under pressure. Therefore, this contribution focuses on investigating the temperature and pressure dependence of the lubricants’ permittivity to allow the creation of descriptive models of these properties. These models will allow improved models for the electric behavior of journal bearings to be implemented in the future.
2.2. Test Setup and Test Method
Figure 2 shows the test setup schematically.
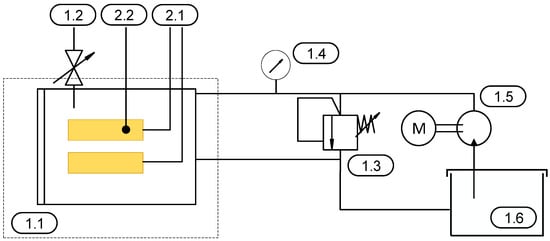
Figure 2.
Schematic representation of the experimental setup, including the pressure chamber and hydraulics.
The test specimen, configured as a parallel-plate capacitor, is placed inside a pressure vessel (1.1) during the experiments. Both the temperature sensor (2.2) and the voltage measurement (2.1) are electrically insulated from the pressure vessel. Venting air from the chamber is performed manually via a valve (1.2) to ensure a fully flooded chamber. The test fluid is stored in a reservoir (1.6). The volumetric flow is generated by a pump (1.5). The required test pressure within the pressure chamber is regulated using a manual pressure relief valve (1.3). Pressure monitoring is carried out using a pressure gauge (1.4) installed in the supply line leading to the tank.
2.2.1. Sample Geometry
The test specimen is designed as a parallel-plate capacitor (Figure 3). The counter-electrode (ground) consists of a steel plate ground to an Rz value of 1 and exhibiting a flatness of less than 5 µm. The base structure was manufactured using a layered build-up process. During the experiment, the electrode gap was defined using two ceramic gauge blocks. The following figure shows the base structure and a schematic of the layered structure.
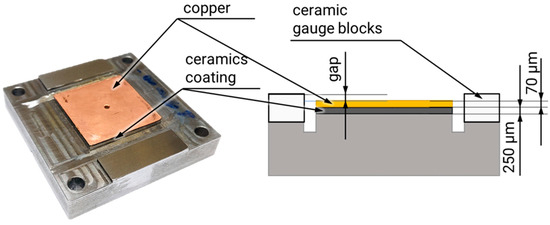
Figure 3.
Base structure and a schematic of the layered structure.
The ceramic layer was applied via thermal spraying, then subsequently machined and tested for dielectric integrity. It serves as the electrical insulator in the system. The copper coating was applied in a two-step process: First, a thin chemically deposited layer of 1–2 µm was applied to ensure electrical conductivity. This was followed by galvanic deposition to achieve a final layer thickness of approximately 70 µm. The relevant capacitor surface area is 900 mm2 (30 mm × 30 mm).
The spacing between the electrodes was defined using gauge blocks with accuracy class 1, corresponding to a dimensional tolerance of approximately 0.2 µm. Prior to testing, the sample was characterized by topographical measurements, confirming a surface parallelism better than 5 µm across the active area. The resulting geometric tolerances were evaluated with respect to the parallel-plate capacitor relation and found to have a negligible influence on the extracted relative permittivity compared to the effects of pressure and temperature. Additionally, the measurement of the permittivity is performed using reference measurements in air and thereafter in oil. Between these measurements, the assembly is not changed, ensuring that identical geometries are used between the reference measurement and the actual measurement in oil.
2.2.2. Measurement Setup
The measurement was conducted based on the respective voltages and voltage divisions, as illustrated in Figure 4. The elements of the electric circuit are listed in Table 1. In addition to the primary measurement parameters, the Figure also includes all relevant influencing factors, such as the capacitance of the ceramic layer (2.1), the electrical resistance of the intermediate medium (2.3) as well as the resistance and capacitance of the voltage measurement circuit (4.1 and 4.2). This model is the basis for the evaluation method presented in Section 2.3.
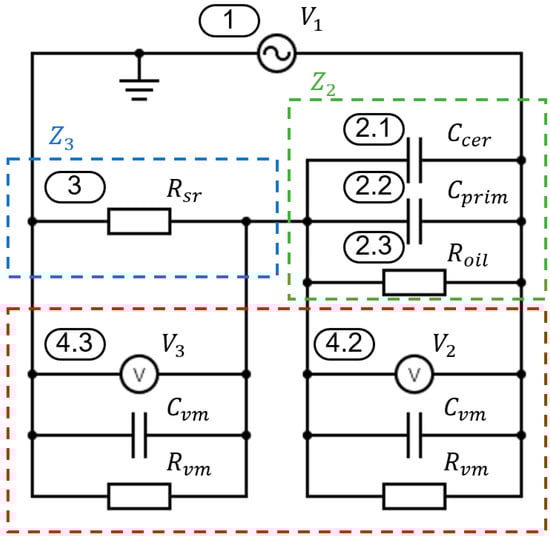
Figure 4.
Schematic representation of the voltage measurement setup, including the voltage divider (blue), the test specimen (green), the measuring equipment (red) and relevant electrical connections used for permittivity analysis (according to [18]).

Table 1.
Overview of the elements of the circuit used for voltage measurement and signal evaluation.
Based on an estimate of the expected capacitance, a series resistor
of 120,000 Ω was defined. The measurements were conducted at an electric frequency
of 10 kHz. Within this frequency range, no influence on permittivity is expected, since molecules with dipole characteristics—such as additives—can follow the electric field without delay. Inertial effects only become relevant in the megahertz range.
The measurement is performed using a Picoscope 4444 [24]. The measurement takes one second with a measurement frequency of
. This ensures high resiliency against stochastic deviations. The standard deviation of each measurement is included in Section 3.
2.2.3. Lubricant Tested
As part of the comparative study, two distinct lubricants were evaluated. The selection of lubricants was performed in reference to Weicker et al. [9], who investigated the frequency dependence of these lubricants. The first was a highly additized mineral oil, while the second was a synthetic polyalkylene glycol (PAG) oil. The lubricants are described in Table 2. Since the pressure and temperature dependencies of dielectric properties are largely governed by the presence of polar components, detailed knowledge of each lubricant’s additive formulation is essential for proper assessment. Therefore, oil analyses were conducted for both lubricants. The specific additive compositions are summarized in Table 3.
Table 2.
Overview over data sheet values of the mineral oil and the PAG oil.
Table 3.
Overview of the additives present compared between mineral oil and the PAG oil.
The listed water content is not an additive. It represents a typical component of polyalkylene glycol (PAG) oils and falls within the standard specification range for such lubricants. However, due to the strong polarity of dissolved water and its significant influence on dielectric behavior, it is included in the additive assessment for completeness.
2.2.4. Test Parameters
The measurements are conducted in a fully parametric manner using the lubricants listed above. The temperature varies between 20 °C and 100 °C, while the pressure ranges from 1 to 250 bar. These temperature and pressure ranges are typical for journal bearing applications and are therefore of interest for this contribution [25]. The individual test points are listed in Appendix B. Measurements without lubricant are also conducted in the pressure chamber to eliminate any external influence. The electric frequency is kept constant at
to avoid the influence of the frequency on the electric behavior of the lubricants.
2.3. Evaluation
From the measurement, the two measured sine voltages
and
from Figure 4 are obtained with a sample rate of
at an electric frequency of
. To extract the voltages, a regression analysis is performed. Each sine signal can be described using Equation (4). Using trigonometric identities, the equation can be written as Equation (5), which can be solved using linear regression [26].
The regression is performed for time windows of
. This results in a calculated phase
and amplitude
according to Equations (6) and (7). This is repeated for each time window until the whole measurement is described.
The measurement setup utilizes the principle of a voltage divider with the known reference resistance. However, as can be seen in Figure 4, the reference resistance is not an ideal resistor. It has an inductive factor which can usually be neglected. But the measurement equipment usually cannot simply be neglected. The resistor has a resistance
of
. The measurement equipment consists of an internal resistance of
of
and an internal capacitance
of
.
In a complex plane, the parallel connection between the three parts can be depicted in Figure 4, with the total resistance
according to Equation (8) and the reactance
according to Equation (9), with the electric frequency
of
.
The total impedance of stage 3 (in Figure 4)
can then be depicted in the complex plane according to Figure 5, and the magnitude of the impedance
and the phase
can be calculated. For this contribution, the reference impedance
, consisting of the resistor and the measurement equipment, yields
as the magnitude of the impedance. The capacitance of the reference side (stage 3) causes a phase shift
of
at
. This is the known reference of this measurement setup of which the measured voltages of the capacitance
are compared against.
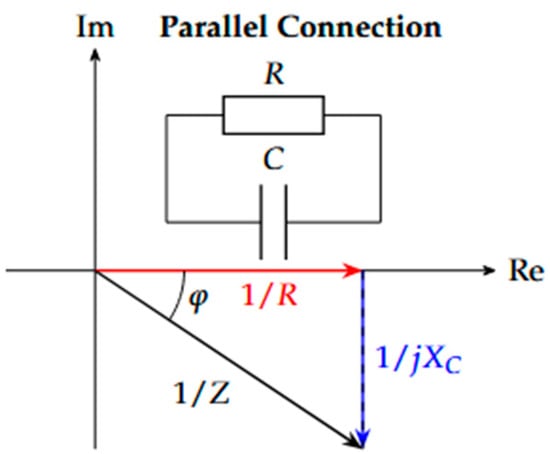
Figure 5.
Complex plane of a parallel connection [18].
The voltage to be investigated
is taken from the parallel connection of the primary capacitance
, the capacitance of the ceramic gauge blocks
, the resistance of the lubricant
as well as the internal capacitance
and resistance
of the measurement equipment. The overall impedance
of this parallel connection (stage 2 in Figure 4) can be calculated using the known reference impedance
and the measured voltage peaks
and
according to Equation (10). Likewise, the phase shift between the two voltage signals can be taken from the regression analysis. Since the reference impedance
is not an ideal resistor, the phase shift
of
needs to be added to the measured phase of the signal
.
The impedance of the parallel connection
can be written according to Equation (11) with Equations (12) and (13). The unknown values are the resistance of the oil
and the capacitance of the capacitive area to be investigated
. The capacitance of the ceramic gauge blocks can be estimated to be
using the surface area, the height of the block and the relative permittivity
of the ceramic of 29. With these equations, the resistance of the oil
and the primary capacitance
can be calculated for each time window of
.
For the calculation of the permittivity of the oil, a reference measurement is taken using a cleaned capacitor setup in air. This forms the known reference permittivity
of
with a measured capacitance
. Since the measurement setup is not changed between measuring with air as a medium and measuring with oil as a medium, the area and the distance of the capacitance in Equation (1) are kept constant. Therefore, the measured capacitance
is only dependent on the change in the permittivity of the medium, and the relative permittivity of the oil
can be calculated according to Equation (14) for different temperatures and pressures of the oil.
For the empirical regression models for the permittivity and the resistivity of the lubricants, predefined MATLAB (version 2022b) functions are used. “Poly22” and “poly33” approaches and another function are fitted using MATLAB’s “fit” function. Both approaches are compared in Section 3.2. The model equations are also included in the beginning of Section 3.2.
The results of all measurements, including the standard deviation of each calculated phase and impedance, are included in Appendix C. Each model element is specified to be accurate within
of their respective value. The only unknown capacitance is the capacitance of
, which is estimated to be accurate within
of its value. The assessment of the propagation of error yields that with these deviations the maximum deviation in the calculated permittivity is below
.
3. Results
In this section, the results are presented starting with the experimental results. Thereafter, empirical models are presented that describe the measurement results.
3.1. Experimental Measurement
The results in this section show the permittivity and the resistance of the oil over temperature and pressure. The Figures in this Section use the normalized permittivity and resistance for the temperature and pressure range mentioned in Section 2.2.4. The normalization approach is chosen as the focus of this contribution and is the change in the electric parameters of the oil with changing temperature and pressure, not the absolute value of both. To obtain the reference permittivity
and reference resistance
, the permittivity and resistance values of PAG at 250 bar and a temperature of 28 °C are chosen. This decision is made because the lowest temperature and highest pressure cause the highest value in permittivity and resistance. The reference values are shown in Table 4.
Table 4.
Reference values for the normalization approach.
Figure 6 shows the normalized relative permittivity of PAG and mineral oil between
and
for pressures between
and
bar. The standard deviation is included in each measurement point. In all results included in this section, the standard deviation is negligible. The permittivity of both oils reduces with increasing temperature. Both oils show outliers at
, with PAG reaching a normalized relative permittivity of
and mineral oil reaching a normalized relative permittivity of up to
. This is likely caused by the test procedure which starts at room temperature and the reference measurementof the relative permittivity of air. Thereafter, the capacitor is flooded with oil, and the permittivity is measured at room temperature. During this measurement, air pockets remain in the oil due to the high viscosity. When the temperature is increased to
, the reduced viscosity allows the air to escape. After heating to
the temperature drops and measurements are taken at
, and
. It cannot be ensured that the contact is fully flooded at
, but the data shows that after heating to
the measurements are repeatable and consistent. The effect of air pockets at room temperature is more pronounced in the PAG oil, as this oil has a higher viscosity compared to the mineral oil. This supports the theory that air pockets escape at
due to the reduced viscosity. Additionally, the solubility of air in oil is reduced at high temperatures, supporting the claim that the amount of air in the system is reduced after reaching
.
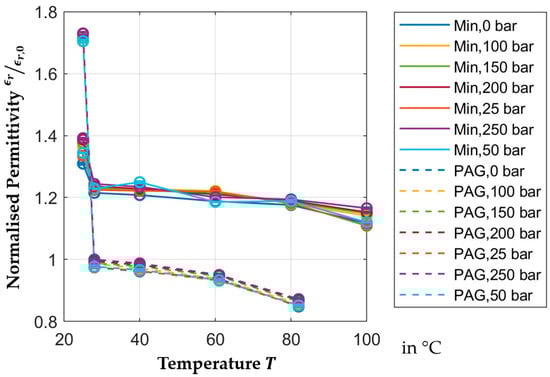
Figure 6.
Temperature-dependent normalized permittivity.
The mineral oil used in this contribution generally has a higher relative permittivity than the PAG oil. In some studies, the permittivity is between 2 and 2.3 [19,22]. The mineral oil exceeds these values ( at
) while the PAG reaches the higher end of this range ( at
). These results are expected for PAG oil as this oil is naturally polar. It also attracts water, which is indicated by the high concentration of water in the PAG oil. This water increases the observed temperature dependence of the PAG oil. However, the temperature-dependent permittivity is not necessarily expected of the mineral oil, as this oil is non-polar without additives. However, polar additives are often added to increase longevity and performance, which, in this case, is indicated by the high level of sulfur in the mineral oil. Despite this, the relative permittivity of PAG oil changes more drastically with changes in temperature. Between
and
, the permittivity of PAG reduces by more than
while the permittivity of mineral oil only reduces by
between those temperatures. The permittivity of mineral oil reduces by another
between
and
; however, comparable data for the behavior of PAG oil in that temperature range is not available. The higher dependence of the permittivity on temperature of the PAG oil is likely caused by the higher polarity of its molecules.
Figure 7 shows the normalized relative permittivity of PAG and mineral oil between
and
for different pressures. With an increase in pressure, the permittivity of both oils increases generally. The curve for the normalized permittivity of PAG oil at
again includes the previously mentioned air pockets which cause deviations in the measurement, just like the curve for the mineral oil at
. The permittivity of all oils mainly depends on the temperature and only slightly depends on pressure changes, which causes a relatively large linear shift in the curves but a relatively small slope. Figure 7 also shows that within the pressure range, the permittivity of PAG changes by about
. The measurements for mineral oil fluctuate more. The dependence of its permittivity on the pressure is in the same region; however, a definitive number cannot be given.
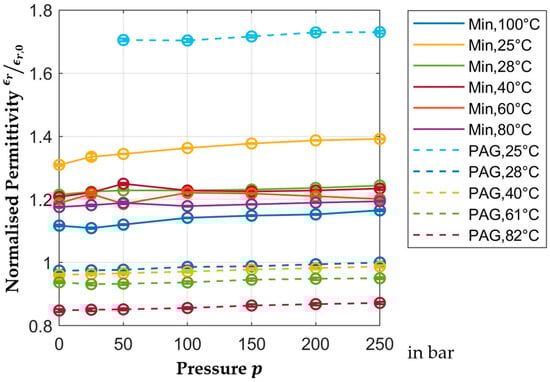
Figure 7.
Pressure-dependent normalized permittivity.
Figure 8 shows the normalized resistance of the oil film for different pressures within the temperature range. The resistance of the oil depends on the distance, the active area of the capacitor and the specific electric resistance of the oil. Only the specific electric resistance is dependent on temperature and pressure. The true distance is not known from the measurement setup as it would be necessary to tune the distance precisely to the micrometer, which is not technically feasible. Instead, normalization is used to depict the change in the resistance. Since neither area nor distance change for all PAG or all mineral oil measurements, respectively, this approach shows the relative change in the specific electric resistance of the oil. The reference value of the normalization approach for resistance is shown in Table 4. It should be added that the absolute value for resistance is dependent on the surface of the capacitor.
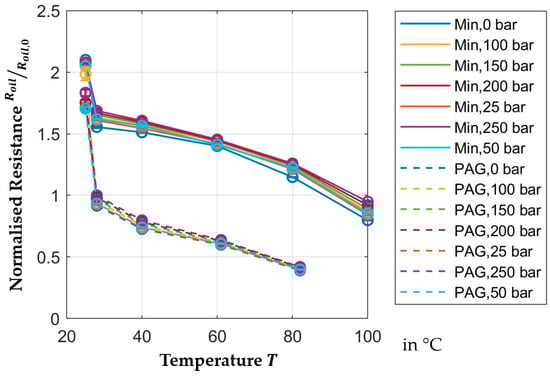
Figure 8.
Temperature-dependent normalized resistance.
The resistances of both mineral and PAG oil in Figure 8 changes significantly more than the permittivity. The change in permittivity of the PAG oil between
and
is
, while the resistance of the mineral oil in that temperature range changes by
and by another
between
and
. For the PAG, oil no data is available between
and
.
Figure 9 shows the pressure dependence of normalized resistance. Again, the measurements taken at
are outliers due to the previously described problems with air pockets. Like permittivity, resistance is also primarily dependent on temperature. The change over the pressure is only about
and reaches up to
between
and
.
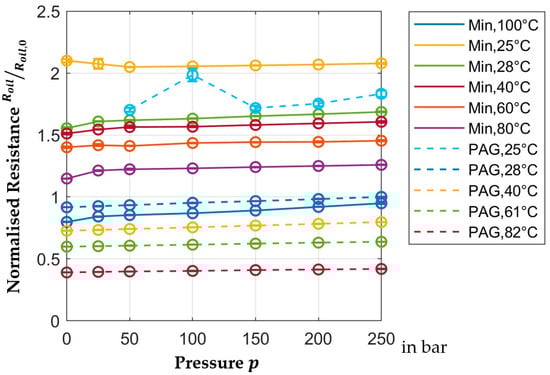
Figure 9.
Pressure-dependent normalized resistance.
3.2. Regression Model of Measurement Results
For future work, equations to describe the dimensionless permittivity are developed to help extrapolation and quantitative assessments in models. For that purpose, the dimensionless, normalized permittivity is modeled as a polynomial function and a physics-based function. The polynomial function is based on the poly33 fit using MATLAB, depicted using Equation (15). A poly22 fit that is similar but only goes up to a second-degree polynomial is also fitted to the measurements. A different fitting approach is to assume the temperature dependence of the permittivity based on other known physical equations for similar problems and create a fit function based on this equation. Such a fit function allows more information to be generated as physical behavior and can be identified through trial and error. These fit functions are more robust to extrapolation, whereas the polynomial fit is not suitable for extrapolation and has the danger of overfitting with higher-degree polynomials. The physics-based fit used in this contribution is depicted in Equation (16). This equation uses the temperature dependence of the Arrhenius equation which describes the reaction speed of chemical reactions with variable temperature. Pressure is used in this equation as a scaling factor that scales both the temperature dependence and the overall normalized permittivity. Multiple equations were fitted during the work for this contribution with Equation (16) as the most promising solution. The two approaches presented are compared to each other. The physics-based equation presented here is not a mechanistic model but an empirical model. It consequently only allows limited extrapolation. However, for the application in journal bearings, temperatures beyond
and pressures beyond
are not relevant in most cases. Therefore, this equation is deemed sufficient for the application.
The models are fit using the fit function of MATLAB. The fitted parameters according to the results are listed in Appendix A. Figure 10 shows the residual error for each datapoint in order with the respective model according to Equation (17). The residual error describes the difference between the real and the fit value. Table 5 shows the root mean square error (RMSE) according to Equation (18) and the R2 value according to Equation (19). The RMSE describes the deviations of the model with an emphasis on large deviations due to the square, while the R2 value describes how well the model captures the overall behavior and by how much it is an improvement over taking the mean value. In the case of R2, a value of one represents a perfect model while a value of zero does not show any improvement over using the mean of the values.
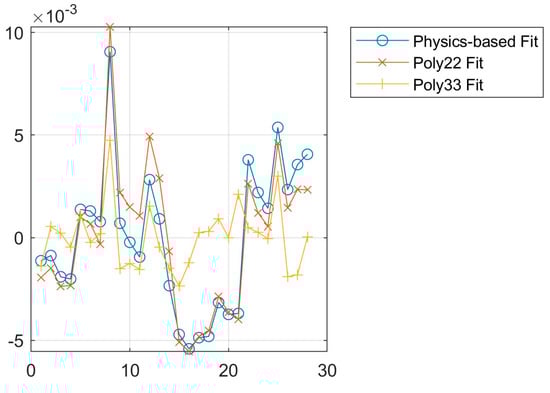
Figure 10.
Residual error of fit types using PAG.
Table 5.
RMSE and R2 values of different fit types and models.
Figure 10 shows overall small residual errors with all models for the PAG oil. Similarly, Table 5 shows small RMSE values and an R2 value of almost 1. It can therefore be concluded that all models would be valid representations of the temperature- and pressure-dependent permittivity. In general, the third-degree polynomial yields the most accurate model within the measured range, whereas the second-degree polynomial yields only slightly worse results. However, the second-degree polynomial requires fewer values to be generated, reducing the potential for user error when implementing such a model.
The physics-based fit is generally closer to the second-degree polynomial in its accuracy. The advantage of the physics-based model is that it potentially allows a limited extrapolation of the model outside of the observed temperature and pressure range over a polynomial fit. Furthermore, high-degree polynomials can lead to overfitting where the model follows measurement inaccuracies. This could be one of the reasons why data points 15 to 21 show a good fit in the third-degree polynomial but a worse fit in the other models.
Figure 11 shows the residual errors of the models for mineral oil for each datapoint. These models have a significantly greater error compared to the PAG models as can also be seen in Table 5. Again, the third-degree polynomial shows the best fit but also risks overfitting of errors. This is especially true as the permittivity of mineral oil is less dependent on changes in temperature and pressure than the PAG oil. That makes the model more susceptible to other sources of deviations like measurement errors. Furthermore, the mineral oil measurements have less internal consistency. In Figure 6, the measurements for the permittivity at
and
show the highest permittivity of all mineral oil measurements taken at
and the lowest permittivity of all mineral oil measurements taken at
. This did not happen during the PAG measurements and caused a worse fit of all models. The physics-based fit for the mineral oil model is still preferred over the polynomial fits as it is more resilient to overfitting. That is especially important for the higher scatter of the mineral oil measurements compared to the PAG measurements. Additionally, it potentially allows extrapolation if needed in the future.
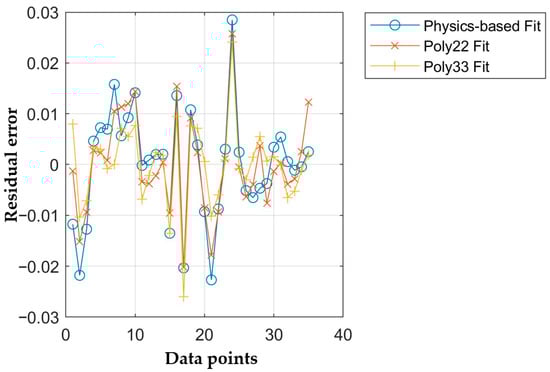
Figure 11.
Residual error of fit types using mineral oil.
Figure 12 shows the fitted models over the measurements for mineral and PAG oil. The figure confirms that the PAG models generally match better. Extrapolation beyond
likely shows significant deviations from reality; however, beyond that temperature, the operation of journal bearings is unlikely.
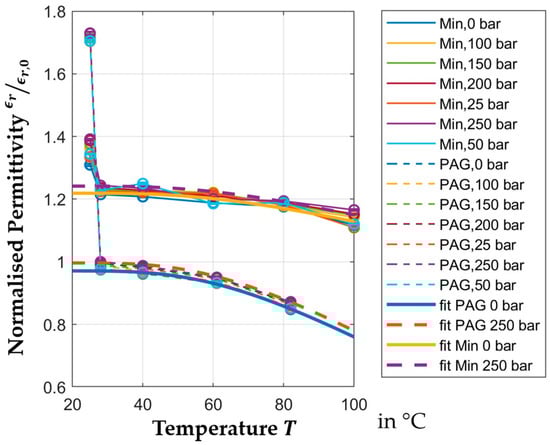
Figure 12.
Physics-based permittivity fit over the temperature.
Figure 13 shows the physics-based fit presented before with resistance as a comparison. The model matches significantly less with the observed resistance. In the case of PAG oil, the physics-based fit does not fit the general behavior. The modeling of the resistance would therefore require different modeling setups. However, for future measurements of journal bearing capacitance, the resistance is not necessary for the interpretation of the measured capacitance as opposed to the permittivity. For that reason, the modeling of the permittivity is the focus of this contribution.
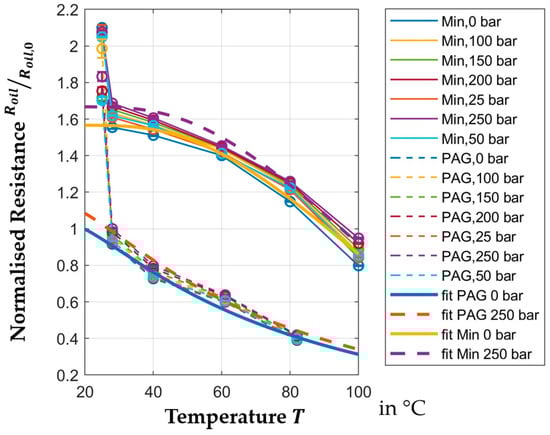
Figure 13.
Physics-based resistance fit over the temperature.
4. Discussion
The experimental results clearly show that the relative permittivity of the tested lubricants is influenced by both pressure and temperature. These dependencies are caused by polar molecules within the oil. PAG oil in its base form already shows polar behavior which is amplified by further polar additives. Mineral oil in its base form is nonpolar. The temperature and pressure dependence of its permittivity is caused by the presence of polar additives (as indicated by the high amount of sulfur compounds in the oil), which align with the electric field and thereby affect the dielectric behavior. A quantitative comparison with results from other authors is not possible as each author uses different electric frequencies to measure unique lubricants. Often, the lubricants cannot be compared. Furthermore, the authors of this contribution could not identify works that investigate the temperature and pressure dependence of the permittivity of PAG oil. However, it can be said that general trends such as a reduction in permittivity and resistivity with a temperature increase align with the results of other contributions.
A comparison of the two lubricant types indicates that mineral oil exhibits stronger pressure dependence, while synthetic oil demonstrates more significant sensitivity to temperature variations. This difference is likely caused by variations in the additives used in each oil. It is expected that the electric behavior of other PAG oils and mineral oils with different additive compositions would show a different dependence on temperature and pressure. It is therefore essential that for each electrical application the oil is characterized electrically if it is necessary for the accuracy of the modeling. For this purpose, the test setup described in this contribution is suitable for journal bearing applications.
These findings have direct implications for the electrical modeling of tribological or fluidic systems. Values for permittivity commonly found in the literature are often provided under standard conditions and do not account for dynamic environmental influences. As a result, such values may be inadequate for accurate system simulations under real-world operating conditions.
The physics-based fits of the permittivity offer a valuable basis for improving and calibrating physical models of journal bearings that include dielectric properties of lubricants as a function of external parameters. This is particularly relevant for applications involving high voltages, pressure variations, or temperature fluctuations. As the derived model is not a true mechanistic model, it only allows for limited extrapolation; however, within the operating conditions of most journal bearings up to
and
, no or only negligible extrapolation is required [14]. Within that temperature range, the observed electric behavior of the bearing would show inaccuracies of up to
due to the change in permittivity, that is, excluding the temperature-induced change in the oil resistivity which is significantly greater than the permittivity change. The empirical models presented here are therefore an improvement for electric models of journal bearings compared to assuming constant electric behavior of the lubricant.
5. Conclusions
The models derived in this study provide a basis for real engineering applications. In particular, the results can be applied to the dielectric characterization of lubricated contacts such as journal bearings, where both pressure and temperature gradients are present. While the electric behavior of different oils is expected to deviate from the results observed in this contribution, the test setup described here allows a characterization of any oil within the pressure and temperature limitations.
The dimensionless representation approach presented here further enables simple adaptations of the models to different oils. This analogy may facilitate the integration of dielectric effects into tribological models in future. This can, for example, be performed by measuring the permittivity of a different oil at one known temperature and scaling the models to describe its electric behavior. Alternatively, since pressure dependence is far less relevant than temperature dependence, users can characterize temperature-dependent permittivity at ambient pressure. Afterwards, the temperature dependence can be scaled to describe the results, and the pressure dependence from this contribution can be used. This would likely yield only small modeling errors compared to assuming constant permittivity.
In the future, concepts that include multiple capacitors within the setup of a journal bearing are planned. By evaluating the capacitance of each capacitor using the improved permittivity models of the lubricant, an extended capacitor network can be established, offering new possibilities for condition monitoring and system diagnostics.
Beyond these concepts, the presented methodology may serve as a foundation for in situ sensor development, enabling the monitoring of lubricant properties under real operating conditions. Future work should focus on extending the parameter space to higher frequencies, transient conditions and additional lubricant classes to refine the predictive capability of the models.
Author Contributions
Conceptualization, B.P., F.K., E.K. and A.H.; methodology, B.P. and F.K.; software, F.K.; validation, B.P. and F.K.; formal analysis, B.P. and F.K.; investigation, B.P. and F.K.; resources, B.P. and F.K.; data curation, B.P. and F.K.; writing—original draft preparation, B.P., F.K., A.H. and E.K.; writing—review and editing, B.P., F.K., A.H. and E.K.; visualization, B.P. and F.K.; supervision, A.H. and E.K.; project administration, A.H. and E.K.; funding acquisition, A.H. and E.K. All authors have read and agreed to the published version of the manuscript.
Funding
This research was funded by the Deutsche Forschungsgemeinschaft (DFG, German Research Foundation)—520 02 174.
Data Availability Statement
Data available on request.
Conflicts of Interest
The authors declare no conflicts of interest.
Abbreviations
The following abbreviations are used in this manuscript:
| PAG | Polyalkylene glycol |
| RMSE | Root Mean Square Error |
| AC | Alternating Current |
| DC | Direct Current |
Appendix A
Model parameters for the permittivity of PAG and mineral oil.
Table A1.
Values for the models for PAG oil.
Table A1.
Values for the models for PAG oil.
| Variable | poly22 | poly33 | Physics-Based |
|---|---|---|---|
| 0 | |||
| 0 | |||
| 0 | |||
| 0 | |||
| 0 | |||
| 0 | |||
| 0 | 0 | ||
| 0 | 0 | ||
| 0 | 0 | ||
| 0 | 0 | ||
| 0 | 0 | ||
| 0 | 0 | ||
| 0 | 0 | ||
| 0 | 0 |
Table A2.
Values for the models for mineral oil.
Table A2.
Values for the models for mineral oil.
| Variable | poly22 | poly33 | Physics-Based |
|---|---|---|---|
| 0 | |||
| 0 | |||
| 0 | |||
| 0 | |||
| 0 | |||
| 0 | |||
| 0 | 0 | ||
| 0 | 0 | ||
| 0 | 0 | ||
| 0 | 0 | ||
| 0 | 0 | ||
| 0 | 0 | ||
| 0 | 0 | ||
| 0 | 0 |
Appendix B
Lists of all measurements and their parameters.
Table A3.
Measurements without lubrication (with air).
Table A3.
Measurements without lubrication (with air).
| No. | Temperature in °C | Pressure in bar | Bemerkung |
|---|---|---|---|
| 058 | NA | NA | Reference for tests with PAG oil |
| 059 | NA | NA | Reference for tests with PAG oil |
| 099 | NA | NA | Reference for tests with mineral oil |
| 100 | NA | NA | Reference for tests with mineral oil |
Table A4.
Measurements using PAG oil.
Table A4.
Measurements using PAG oil.
| No. | Temperature in °C | Pressure in bar | No. | Temperature in °C | Pressure in bar |
|---|---|---|---|---|---|
| 060 | room | 0 | 080 | 61 | 50 |
| 061 | room | 25 | 081 | 61 | 100 |
| 062 | room | 50 | 082 | 61 | 150 |
| 063 | room | 100 | 083 | 61 | 200 |
| 064 | room | 150 | 084 | 61 | 250 |
| 065 | room | 200 | 085 | 40 | 0 |
| 066 | room | 250 | 086 | 40 | 25 |
| 067 | 100 | 0 | 087 | 40 | 50 |
| 068 | 100 | 25 | 088 | 40 | 100 |
| 069 | 100 | 50 | 089 | 40 | 150 |
| 070 | 100 | 100 | 090 | 40 | 200 |
| 071 | 82 | 0 | 091 | 40 | 250 |
| 072 | 82 | 25 | 092 | 25 | 0 |
| 073 | 82 | 50 | 093 | 25 | 25 |
| 074 | 82 | 100 | 094 | 25 | 50 |
| 075 | 82 | 150 | 095 | 25 | 100 |
| 076 | 82 | 200 | 096 | 25 | 150 |
| 077 | 82 | 250 | 097 | 25 | 200 |
| 078 | 61 | 0 | 098 | 25 | 250 |
| 079 | 61 | 25 |
Table A5.
Measurements using mineral oil.
Table A5.
Measurements using mineral oil.
| No. | Temperature in °C | Pressure in bar | No. | Temperature in °C | Pressure in bar |
|---|---|---|---|---|---|
| 101 | room | 0 | 122 | 60 | 0 |
| 102 | room | 25 | 123 | 60 | 25 |
| 103 | room | 50 | 124 | 60 | 50 |
| 104 | room | 100 | 125 | 60 | 100 |
| 105 | room | 150 | 126 | 60 | 150 |
| 106 | room | 200 | 127 | 60 | 200 |
| 107 | room | 250 | 128 | 60 | 250 |
| 108 | 100 | 0 | 129 | 40 | 0 |
| 109 | 100 | 25 | 130 | 40 | 25 |
| 110 | 100 | 50 | 131 | 40 | 50 |
| 111 | 100 | 100 | 132 | 40 | 100 |
| 112 | 100 | 150 | 133 | 40 | 150 |
| 113 | 100 | 200 | 134 | 40 | 200 |
| 114 | 100 | 250 | 135 | 40 | 250 |
| 115 | 80 | 0 | 136 | 25 | 0 |
| 116 | 80 | 25 | 137 | 25 | 25 |
| 117 | 80 | 50 | 138 | 25 | 50 |
| 118 | 80 | 100 | 139 | 25 | 100 |
| 119 | 80 | 150 | 140 | 25 | 150 |
| 120 | 80 | 200 | 141 | 25 | 200 |
| 121 | 80 | 250 | 142 | 25 | 250 |
Appendix C
List of all quantitative measurement results for each measurement including the measured magnitude of the impedance
and its standard deviation, the phase angle
of
and its standard deviation, as well as the calculated permittivity and resistivity presented in the Results section. For reference measurement and for faulty measurements, permittivity and resistance are not available.
Table A6.
All measurement results of impedance and phase angle, their standard deviations and the calculated permittivity and resistance used for the plots in Section 3.
Table A6.
All measurement results of impedance and phase angle, their standard deviations and the calculated permittivity and resistance used for the plots in Section 3.
in Ω | in Ω | in rad | in rad | in Ω | ||
|---|---|---|---|---|---|---|
| 59 | 3.71578 × 10⁴ | 28.54 | −1.49744 | 1.205 × 10⁻³ | NaN | NaN |
| 60 | 2.1875 × 10⁴ | 12.70 | −1.34041 | 5.770 × 10⁻⁴ | NaN | NaN |
| 61 | 2.1720 × 10⁴ | 18.63 | −1.33789 | 7.502 × 10⁻⁴ | NaN | NaN |
| 62 | 1.3006 × 10⁴ | 9.954 | −1.44278 | 1.094 × 10⁻³ | 3.848 | 8.463 × 10⁴ |
| 63 | 1.3050 × 10⁴ | 13.33 | −1.46444 | 2.203 × 10⁻³ | 3.845 | 9.867 × 10⁴ |
| 64 | 1.2934 × 10⁴ | 7.185 | −1.44483 | 1.015 × 10⁻³ | 3.874 | 8.537 × 10⁴ |
| 65 | 1.2857 × 10⁴ | 11.18 | −1.44868 | 1.186 × 10⁻³ | 3.902 | 8.715 × 10⁴ |
| 66 | 1.2860 × 10⁴ | 10.50 | −1.45508 | 1.316 × 10⁻³ | 3.904 | 9.109 × 10⁴ |
| 67 | 1.6385 × 10⁴ | 10.71 | −0.72648 | 7.321 × 10⁻⁴ | NaN | NaN |
| 68 | 1.6360 × 10⁴ | 12.09 | −0.72482 | 7.676 × 10⁻⁴ | NaN | NaN |
| 69 | 1.6417 × 10⁴ | 13.22 | −0.72002 | 7.911 × 10⁻⁴ | NaN | NaN |
| 70 | 1.6379 × 10⁴ | 10.82 | −0.73120 | 7.346 × 10⁻⁴ | NaN | NaN |
| 71 | 1.5284 × 10⁴ | 10.32 | −0.71113 | 8.325 × 10⁻⁴ | 1.914 | 1.939 × 10⁴ |
| 72 | 1.5378 × 10⁴ | 11.10 | −0.71840 | 1.000 × 10⁻³ | 1.920 | 1.962 × 10⁴ |
| 73 | 1.5446 × 10⁴ | 5.691 | −0.72323 | 3.520 × 10⁻⁴ | 1.922 | 1.979 × 10⁴ |
| 74 | 1.5516 × 10⁴ | 5.104 | −0.73074 | 3.387 × 10⁻⁴ | 1.932 | 2.000 × 10⁴ |
| 75 | 1.5617 × 10⁴ | 5.396 | −0.74304 | 4.530 × 10⁻⁴ | 1.950 | 2.034 × 10⁴ |
| 76 | 1.5693 × 10⁴ | 5.380 | −0.75117 | 3.462 × 10⁻⁴ | 1.960 | 2.059 × 10⁴ |
| 77 | 1.5758 × 10⁴ | 5.509 | −0.75837 | 3.755 × 10⁻⁴ | 1.969 | 2.080 × 10⁴ |
| 78 | 1.7863 × 10⁴ | 8.413 | −0.97069 | 4.516 × 10⁻⁴ | 2.116 | 2.975 × 10⁴ |
| 79 | 1.7963 × 10⁴ | 6.985 | −0.97148 | 3.871 × 10⁻⁴ | 2.102 | 2.994 × 10⁴ |
| 80 | 1.7999 × 10⁴ | 7.935 | −0.97548 | 3.824 × 10⁻⁴ | 2.106 | 3.015 × 10⁴ |
| 81 | 1.8023 × 10⁴ | 7.063 | −0.98351 | 3.744 × 10⁻⁴ | 2.115 | 3.054 × 10⁴ |
| 82 | 1.8012 × 10⁴ | 1.004 | −0.99366 | 5.783 × 10⁻⁴ | 2.135 | 3.097 × 10⁴ |
| 83 | 1.8051 × 10⁴ | 8.256 | −1.00083 | 5.353 × 10⁻⁴ | 2.141 | 3.135 × 10⁴ |
| 84 | 1.8098 × 10⁴ | 7.406 | −1.00695 | 3.656 × 10⁻⁴ | 2.145 | 3.171 × 10⁴ |
| 85 | 1.8631 × 10⁴ | 5.438 | −1.07201 | 2.974 × 10⁻⁴ | 2.170 | 3.613 × 10⁴ |
| 86 | 1.8650 × 10⁴ | 4.976 | −1.07674 | 3.113 × 10⁻⁴ | 2.174 | 3.646 × 10⁴ |
| 87 | 1.8658 × 10⁴ | 5.202 | −1.08223 | 2.676 × 10⁻⁴ | 2.181 | 3.682 × 10⁴ |
| 88 | 1.8675 × 10⁴ | 5.509 | −1.09197 | 2.948 × 10⁻⁴ | 2.192 | 3.749 × 10⁴ |
| 89 | 1.8673 × 10⁴ | 12.39 | −1.10252 | 6.805 × 10⁻⁴ | 2.207 | 3.821 × 10⁴ |
| 90 | 1.8691 × 10⁴ | 5.292 | −1.11178 | 2.799 × 10⁻⁴ | 2.217 | 3.890 × 10⁴ |
| 91 | 1.8699 × 10⁴ | 4.963 | −1.12120 | 3.182 × 10⁻⁴ | 2.229 | 3.962 × 10⁴ |
| 92 | 1.9357 × 10⁴ | 5.785 | −1.17410 | 2.600 × 10⁻⁴ | 2.199 | 4.554 × 10⁴ |
| 93 | 1.9376 × 10⁴ | 7.126 | −1.17831 | 3.825 × 10⁻⁴ | 2.201 | 4.600 × 10⁴ |
| 94 | 1.9379 × 10⁴ | 6.960 | −1.18217 | 3.494 × 10⁻⁴ | 2.205 | 4.640 × 10⁴ |
| 95 | 1.9317 × 10⁴ | 5.853 | −1.19247 | 3.518 × 10⁻⁴ | 2.226 | 4.735 × 10⁴ |
| 96 | 1.9330 × 10⁴ | 6.707 | −1.19834 | 3.205 × 10⁻⁴ | 2.230 | 4.802 × 10⁴ |
| 97 | 1.9292 × 10⁴ | 5.991 | −1.20645 | 3.015 × 10⁻⁴ | 2.244 | 4.885 × 10⁴ |
| 98 | 1.9262 × 10⁴ | 5.716 | −1.21427 | 3.868 × 10⁻⁴ | 2.257 | 4.970 × 10⁴ |
| 99 | 5.5560 × 10⁴ | 129.6 | −1.37637 | 9.291 × 10⁻⁴ | NaN | NaN |
| 100 | 5.6318 × 10⁴ | 14.87 | −1.36014 | 2.291 × 10⁻⁴ | NaN | NaN |
| 101 | 2.9737 × 10⁴ | 54.30 | −1.34342 | 1.067 × 10⁻³ | 2.955 | 1.044 × 10⁵ |
| 102 | 2.9328 × 10⁴ | 154.2 | −1.34302 | 3.392 × 10⁻³ | 3.013 | 1.031 × 10⁵ |
| 103 | 2.9171 × 10⁴ | 6.353 | −1.34072 | 2.274 × 10⁻⁴ | 3.034 | 1.019 × 10⁵ |
| 104 | 2.8901 × 10⁴ | 7.394 | −1.34359 | 2.285 × 10⁻⁴ | 3.076 | 1.021 × 10⁵ |
| 105 | 2.8703 × 10⁴ | 7.245 | −1.34624 | 2.603 × 10⁻⁴ | 3.108 | 1.025 × 10⁵ |
| 106 | 2.8568 × 10⁴ | 6.161 | −1.34827 | 2.262 × 10⁻⁴ | 3.131 | 1.028 × 10⁵ |
| 107 | 2.8509 × 10⁴ | 17.29 | −1.35005 | 4.542 × 10⁻⁴ | 3.141 | 1.033 × 10⁵ |
| 108 | 2.6728 × 10⁴ | 34.17 | −0.90154 | 1.221 × 10⁻³ | 2.521 | 3.966 × 10⁴ |
| 109 | 2.7400 × 10⁴ | 29.55 | −0.92748 | 1.084 × 10⁻³ | 2.503 | 4.185 × 10⁴ |
| 110 | 2.7422 × 10⁴ | 18.30 | −0.93772 | 6.337 × 10⁻⁴ | 2.528 | 4.242 × 10⁴ |
| 111 | 2.7366 × 10⁴ | 7.945 | −0.95279 | 3.775 × 10⁻⁴ | 2.577 | 4.315 × 10⁴ |
| 112 | 2.7539 × 10⁴ | 8.102 | −0.96766 | 3.828 × 10⁻⁴ | 2.592 | 4.425 × 10⁴ |
| 113 | 2.7804 × 10⁴ | 8.701 | −0.98520 | 4.570 × 10⁻⁴ | 2.601 | 4.571 × 10⁴ |
| 114 | 2.7935 × 10⁴ | 37.16 | −1.00426 | 1.051 × 10⁻³ | 2.631 | 4.714 × 10⁴ |
| 115 | 2.9304 × 10⁴ | 11.57 | −1.09861 | 3.147 × 10⁻⁴ | 2.654 | 5.707 × 10⁴ |
| 116 | 2.9585 × 10⁴ | 24.12 | −1.12465 | 6.537 × 10⁻⁴ | 2.667 | 6.030 × 10⁴ |
| 117 | 2.9537 × 10⁴ | 60.68 | −1.12989 | 1.543 × 10⁻³ | 2.683 | 6.080 × 10⁴ |
| 118 | 2.9715 × 10⁴ | 11.57 | −1.13039 | 3.324 × 10⁻⁴ | 2.661 | 6.118 × 10⁴ |
| 119 | 2.9689 × 10⁴ | 10.70 | −1.13523 | 3.142 × 10⁻⁴ | 2.673 | 6.168 × 10⁴ |
| 120 | 2.9654 × 10⁴ | 8.279 | −1.13954 | 2.507 × 10⁻⁴ | 2.685 | 6.213 × 10⁴ |
| 121 | 2.9634 × 10⁴ | 9.179 | −1.14360 | 2.642 × 10⁻⁴ | 2.695 | 6.257 × 10⁴ |
| 122 | 3.0296 × 10⁴ | 57.94 | −1.18689 | 1.161 × 10⁻³ | 2.681 | 6.962 × 10⁴ |
| 123 | 2.9914 × 10⁴ | 86.05 | −1.19744 | 1.479 × 10⁻³ | 2.748 | 7.046 × 10⁴ |
| 124 | 3.0369 × 10⁴ | 8.435 | −1.18949 | 2.458 × 10⁻⁴ | 2.676 | 7.016 × 10⁴ |
| 125 | 2.9913 × 10⁴ | 6.200 | −1.20309 | 2.395 × 10⁻⁴ | 2.756 | 7.134 × 10⁴ |
| 126 | 2.9973 × 10⁴ | 9.447 | −1.20463 | 2.539 × 10⁻⁴ | 2.751 | 7.171 × 10⁴ |
| 127 | 3.0107 × 10⁴ | 43.44 | −1.20339 | 1.103 × 10⁻³ | 2.731 | 7.179 × 10⁴ |
| 128 | 3.0272 × 10⁴ | 39.99 | −1.20420 | 1.019 × 10⁻³ | 2.711 | 7.225 × 10⁴ |
| 129 | 3.0340 × 10⁴ | 45.14 | −1.22055 | 9.215 × 10⁻⁴ | 2.726 | 7.514 × 10⁴ |
| 130 | 3.0212 × 10⁴ | 8.320 | −1.23109 | 3.278 × 10⁻⁴ | 2.758 | 7.675 × 10⁴ |
| 131 | 2.9842 × 10⁴ | 53.40 | −1.24070 | 1.324 × 10⁻³ | 2.821 | 7.775 × 10⁴ |
| 132 | 3.0174 × 10⁴ | 31.17 | −1.23758 | 8.430 × 10⁻⁴ | 2.772 | 7.788 × 10⁴ |
| 133 | 3.0255 × 10⁴ | 7.985 | −1.24031 | 2.849 × 10⁻⁴ | 2.765 | 7.858 × 10⁴ |
| 134 | 3.0237 × 10⁴ | 9.252 | −1.24376 | 3.039 × 10⁻⁴ | 2.772 | 7.921 × 10⁴ |
| 135 | 3.0168 × 10⁴ | 68.21 | −1.24768 | 7.387 × 10⁻⁴ | 2.787 | 7.984 × 10⁴ |
| 136 | 3.0346 × 10⁴ | 56.36 | −1.23236 | 1.452 × 10⁻³ | 2.742 | 7.728 × 10⁴ |
| 137 | 3.0331 × 10⁴ | 9.078 | −1.24657 | 3.014 × 10⁻⁴ | 2.764 | 7.998 × 10⁴ |
| 138 | 3.0287 × 10⁴ | 7.697 | −1.24949 | 2.744 × 10⁻⁴ | 2.773 | 8.047 × 10⁴ |
| 139 | 3.0321 × 10⁴ | 11.97 | −1.25229 | 2.875 × 10⁻⁴ | 2.772 | 8.112 × 10⁴ |
| 140 | 3.0320 × 10⁴ | 8.924 | −1.25711 | 3.040 × 10⁻⁴ | 2.779 | 8.212 × 10⁴ |
| 141 | 3.0272 × 10⁴ | 9.519 | −1.26129 | 3.130 × 10⁻⁴ | 2.791 | 8.291 × 10⁴ |
| 142 | 3.0192 × 10⁴ | 7.835 | −1.26631 | 2.988 × 10⁻⁴ | 2.808 | 8.382 × 10⁴ |
References
- Blair, B.J.; Pethybridge, G. Hydrodynamic Bearing Damage and Remediation of Contributing Factors in Rotating Machinery. In Proceedings of the 9th EDF/Pprime (LMS) Poitiers Workshop, Vienne, France, 7–8 October 2010. [Google Scholar]
- Schneider, V.; Krewer, M.; Poll, G.; Marian, M. Effect of Harmful Bearing Currents on the Service Life of Rolling Bearings: From Experimental Investigations to a Predictive Model. Lubricants 2024, 12, 230. [Google Scholar] [CrossRef]
- Prashad, H. Theoretical Evaluation of Capacitance, Capacitive Reactance, Resistance and Their Effects on Performance of Hydrodynamic Journal Bearings. J. Tribol. 1991, 113, 762–767. [Google Scholar] [CrossRef]
- Prashad, H. Evaluation of Dynamic Coefficients of a Two-Lobe Journal Bearing Using an Electrical Analogy Approach. J. Tribol. 1996, 118, 657–662. [Google Scholar] [CrossRef]
- Prashad, H. Tribology in Electrical Environments, 1st ed.; Elsevier: Amsterdam, The Netherlands, 2006; ISBN 978-0-444-51880-4. [Google Scholar]
- Prashad, H.; Rao, K.N. Analysis of Capacitive Effect and Life Estimation of Hydrodynamic Journal Bearings on Repeated Starts and Stops of a Machine Operating Under the Influence of Shaft Voltages. Tribol. Trans. 1994, 37, 641–645. [Google Scholar] [CrossRef]
- García Tuero, A.; Rivera, N.; Rodríguez, E.; Fernández-González, A.; Viesca, J.L.; Hernández Battez, A. Influence of Additives Concentration on the Electrical Properties and the Tribological Behaviour of Three Automatic Transmission Fluids. Lubricants 2022, 10, 276. [Google Scholar] [CrossRef]
- Sinyavsky, N.; Synashenko, O.; Kostrikova, N. Application of Relaxation Times Distribution of Dielectric Permittivity for Marine Engine Oils Analysis. JEMS 2023, 11, 209–216. [Google Scholar] [CrossRef]
- Weicker, M.; Bechev, D.; Binder, A.; Sauer, B. Schädlicher Stromdurchgang 2: Methodik zur Praxisnahen Charakterisierung von Elektrischen Schmierstoffeigenschaften zur Verbesserung der Rechnerischen Vorhersage von Lagerströmen; Abschlussbericht Forschungsvorhaben 650 II; FVA: Frankfurt am Main, Germany, 2020. [Google Scholar]
- Sedrez, P.C.; Barbosa, J.R. Relative permittivity of mixtures of R-134a and R-1234yf and a polyol ester lubricating oil. Int. J. Refrig. 2015, 49, 141–150. [Google Scholar] [CrossRef]
- Suzuki, A.; Masuko, M.; Wakisaka, K. Pressure-dependence of dielectric relaxation time in poly(propylene glycol) and its application to high-pressure viscosity estimation. Tribol. Int. 2002, 35, 55–63. [Google Scholar] [CrossRef]
- Bittner, H.; Kluth, T. Gleitlagerdiagnose mittels Magnetfeldmessungen. TM—Tech. Messen 1995, 62, 346–351. [Google Scholar] [CrossRef]
- Koetz, F.; Schmitt, F.; Kirchner, E.; Zancul, E. Visualising the lubrication condition in hydrodynamic journal bearings using impedance measurement. Front. Mech. Eng. 2024, 10, 1456575. [Google Scholar] [CrossRef]
- Ebermann, M.; Prase, B.; Hasse, A. Influence of Geometric Shape Defects on Operating Parameters in Cylindrical Journal Bearings. In Volume 14: Design, Systems, and Complexity, Proceedings of the ASME 2019 International Mechanical Engineering Congress and Exposition, Salt Lake City, UT, USA, 11–14 November 2019; American Society of Mechanical Engineers: New York, NY, USA, 2019; ISBN 978-0-7918-8351-8. [Google Scholar]
- Drioli, E.; Giorno, L. (Eds.) Encyclopedia of Membranes; Springer: Berlin/Heidelberg, Germany, 2016; ISBN 978-3-662-44323-1. [Google Scholar]
- IEC 60247:2004; Insulating Liquids—Measurement of Relative Permittivity, Dielectric Dissipation Factor (tan δ) and d.c. Resistivity. DIN German Institute for Standardization: Berlin, Germany, 2005.
- Mortier, R.M. (Ed.) Chemistry and Technology of Lubricants, 3rd ed.; Springer: Dordrecht, The Netherlands, 2010; ISBN 978-1-4020-8661-8. [Google Scholar]
- Koetz, F.; Kirchner, E. Measurement Strategies for the Monitoring of the Electric Behavior of Journal Bearings. Lubricants 2025, 13, 441. [Google Scholar] [CrossRef]
- Joshi, A.; Blennow, J. Electrical Characterization of Bearing Lubricants. In Proceedings of the 2014 IEEE Conference on Electrical Insulation and Dielectric Phenomena (CEIDP), Des Moines, IA, USA, 19–22 October 2014; IEEE: New York, NY, USA, 2014; pp. 586–589. ISBN 978-1-4799-7525-9. [Google Scholar]
- Prathima, A.; Karthikeyan, S.; Devi, K.R.; Usha, K.; Shanthi, M. Environmental effect of lubricity additives through dielectric molecular parameters. Mater. Today Proc. 2020, 33, 3658–3663. [Google Scholar] [CrossRef]
- Hartman, A.; Ekman, J.; Lang, D.; Romano, D.; Antonini, G. PEEC Models of Printed Antennas in Condition Monitoring Applications Covered by Dielectrics with Temperature-Dependent Permittivity. In Proceedings of the 2018 International Symposium on Electromagnetic Compatibility (EMC EUROPE), Amsterdam, Netherlands, 27–30 August 2018; IEEE: New York, NY, USA, 2018; pp. 343–348. ISBN 978-1-4673-9698-1. [Google Scholar]
- Sun, Y.; Zhang, Z.; Gong, Z.; Fan, Z.; Xu, Y. Temperature Dependence on Dielectric Properties of Automatic Transmission Fluid. In Proceedings of the 2022 IEEE 21st International Conference On Dielectric Liquids (ICDL), Sevilla, Spain, 29 May–2 June 2022; ISBN 978-1-6654-8491-6. [Google Scholar]
- Brazier, D.W.; Freeman, G.R. The effects of pressure on the density, dielectric constant, and viscosity of several hydrocarbons and other organic liquids. Can. J. Chem. 1969, 47, 893–899. [Google Scholar] [CrossRef]
- Pico Technology. PicoScope 4444—High-Resolution Differential Oscilloscope. Available online: https://www.picotech.com/oscilloscope/4444/picoscope-4444-overview (accessed on 18 September 2025).
- DIN 31652-1:2017-01; Plain Bearings—Hydrodynamic Plain Journal Bearings Under Steady-State Conditions—Part 1: Calculation of Circular Cylindrical Bearings. DIN Media GmbH: Berlin, Germany, 2017.
- Kuttner, T.; Rohnen, A. Practice of Vibration Measurement; Springer: Wiesbaden, Germany, 2023; ISBN 978-3-658-38462-3. [Google Scholar]
Disclaimer/Publisher’s Note: The statements, opinions and data contained in all publications are solely those of the individual author(s) and contributor(s) and not of MDPI and/or the editor(s). MDPI and/or the editor(s) disclaim responsibility for any injury to people or property resulting from any ideas, methods, instructions or products referred to in the content. |
© 2025 by the authors. Licensee MDPI, Basel, Switzerland. This article is an open access article distributed under the terms and conditions of the Creative Commons Attribution (CC BY) license (https://creativecommons.org/licenses/by/4.0/).